SQL Server Benchmarking, Baselining and Workload Analysis
53
SPONSORED BY 28-29 maggio 2013 Milano
-
Upload
gianluca-sartori -
Category
Technology
-
view
97 -
download
3
Transcript of SQL Server Benchmarking, Baselining and Workload Analysis
SPONSORED BY
28-29 maggio 2013Milano

#sqlc2013
SPONSORED BY
THANKS TO
SQLSERVER 2012
BASELINING,
BENCHMARKING AND
WORKLOAD ANALYSIS
Gianluca Sartori
SQL338
sqlconsulting.it, owner
GIANLUCA SARTORI
• Consulente Freelance
• 10 anni di esperienza SQL Server, dalla v. 7
• Specializzato in performance tuning
• MCTS, MCITP, MCT
• DBA @ Scuderia Ferrari
AGENDA
• Baselining
• Cosa succede in condizioni “normali”?
• Workload Analysis
• Come interagiscono le applicazioni e il database?
• Benchmarking
• Cosa succederebbe se…?
Health Check
Controllo la «salute» del mio server
• Perché?
• Migliorare le prestazioni
• Migliorare la gestione
• Quando?
• Regolarmente Assessment
• Continuamente Monitoring
• Come?
• Serve una metodologia
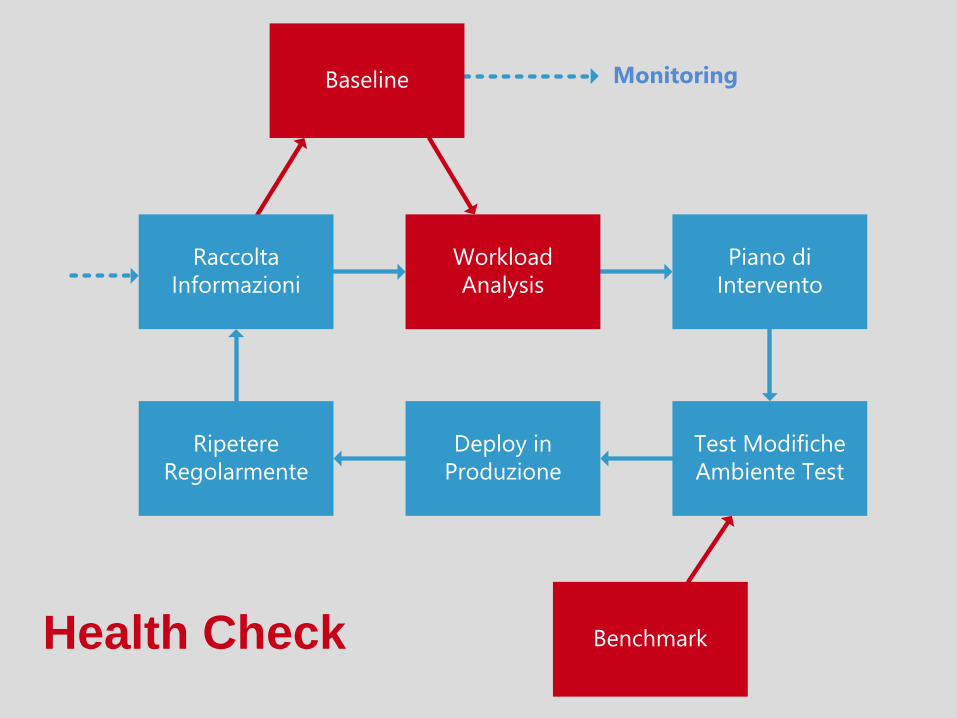
Health Check
Workload
Analysis
Piano di
Intervento
Test Modifiche
Ambiente Test
Deploy in
Produzione
Ripetere
Regolarmente
Benchmark
Baseline
Raccolta
Informazioni
Monitoring

BASELININGStabiliamo cosa è normale
Cos’è una baseline?
Descrive le performance in condizioni “normali”
• Serve come termine di confronto
• Monitoring
• Troubleshooting
• Trend Analysis e Capacity Planning
Creare una baseline
• Quali dati raccogliere?
• Come raccoglierli?
• Con quale frequenza?
• Dove salvarli?
• Quanto serve mantenerli?
• Come analizzarli?
Quali dati raccogliere?
• Informazioni generali
• Sistema
• Versione
• Dotazione HW (CPU, RAM, disco)
• SQL Server
• Versione e edizione
• Parametri di configurazione
• Inventario dei database
• Dimensione e posizionamento dei file sullo storage
Quali dati raccogliere?
• Indicatori di performance
• Wait Stats
• Performance Counters
• Dynamic Management Objects
• Query Stats

Wait Stats
DMV sys.dm_os_wait_stats
• Traccia il tempo speso dai processi in attesa di risorse
• Tempi di attesa cumulativi (ultimo riavvio dell’istanza)
• Ottimo punto di partenza per il troubleshooting
• Consente di identificare i problemi dai sintomi
• Mostra quali aree richiedono attenzione
• Non tutte le classi di wait sono significative!
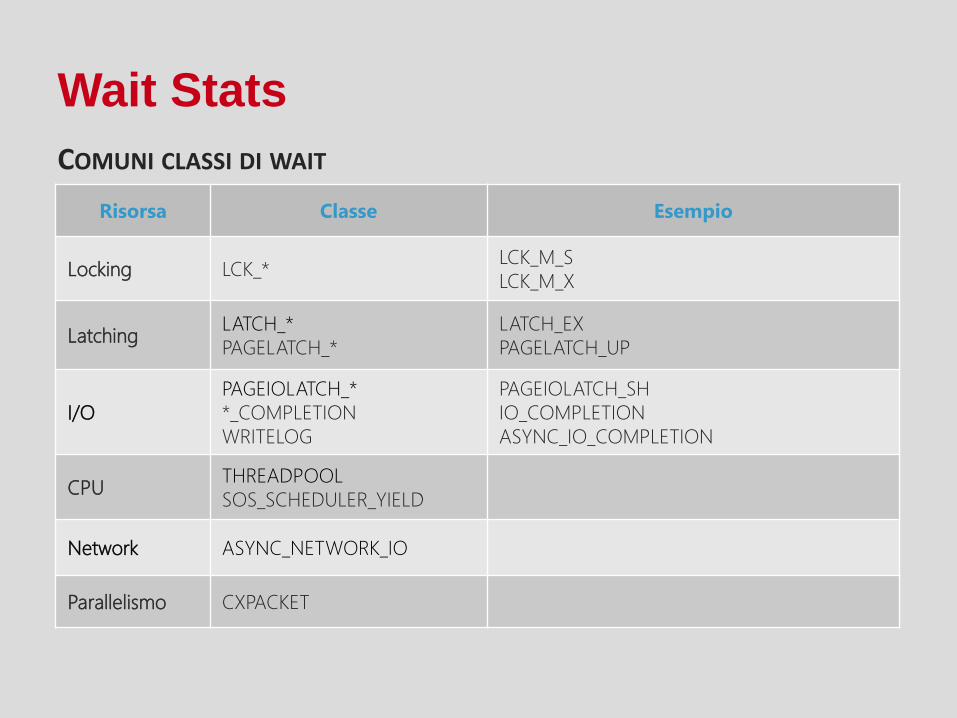
Wait Stats
COMUNI CLASSI DI WAIT
Risorsa Classe Esempio
Locking LCK_*LCK_M_S
LCK_M_X
LatchingLATCH_*
PAGELATCH_*
LATCH_EX
PAGELATCH_UP
I/O
PAGEIOLATCH_*
*_COMPLETION
WRITELOG
PAGEIOLATCH_SH
IO_COMPLETION
ASYNC_IO_COMPLETION
CPUTHREADPOOL
SOS_SCHEDULER_YIELD
Network ASYNC_NETWORK_IO
Parallelismo CXPACKET
DEMOWait Stats
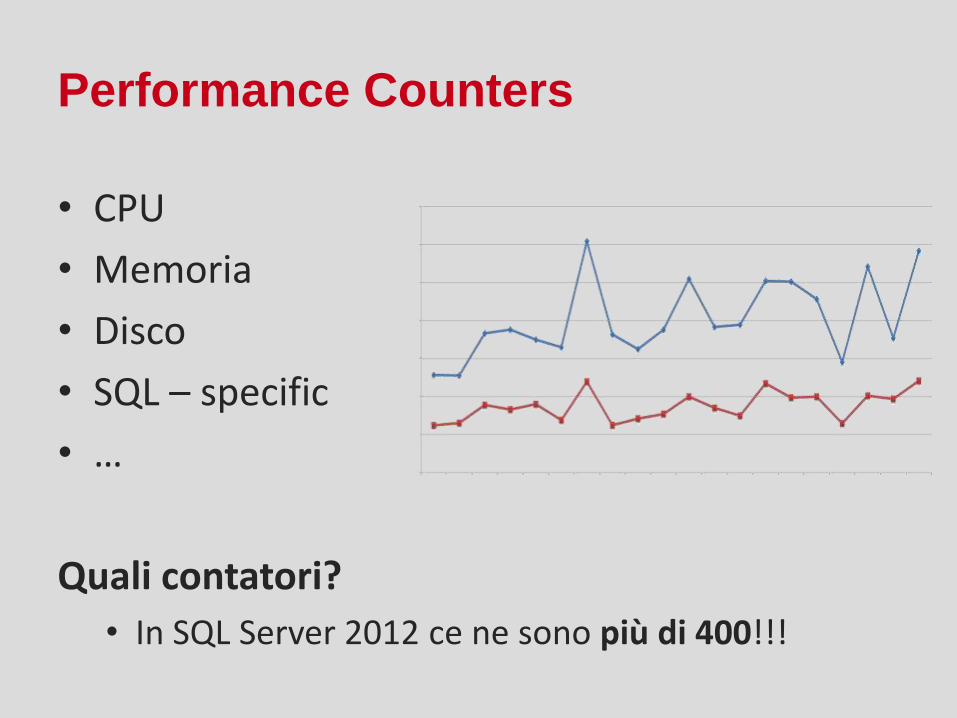
Performance Counters
• CPU
• Memoria
• Disco
• SQL – specific
• …
Quali contatori?
• In SQL Server 2012 ce ne sono più di 400!!!
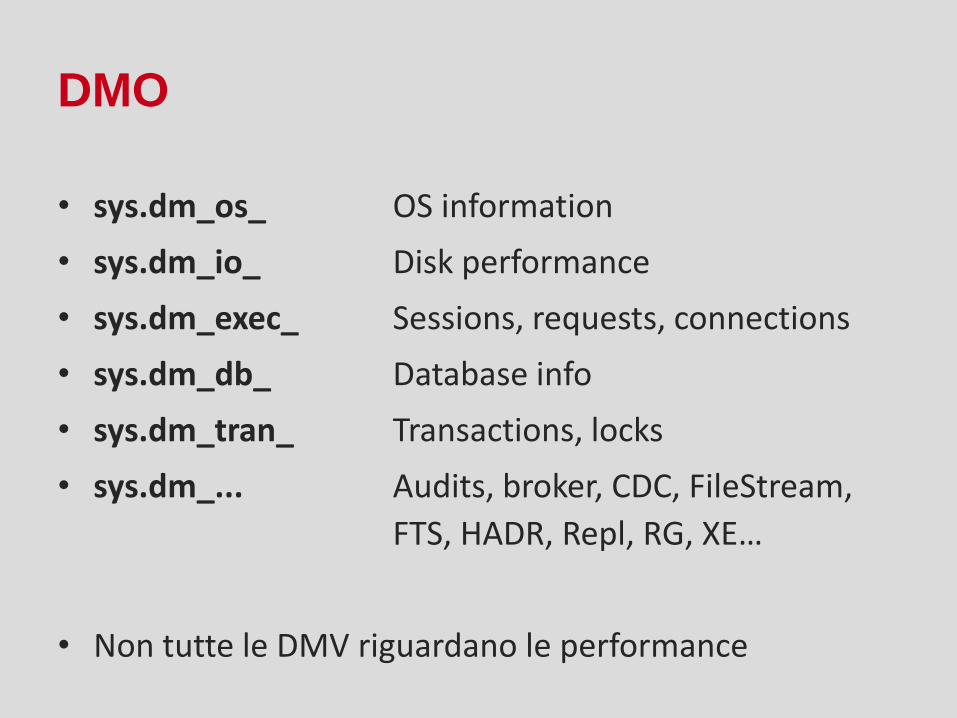
DMO
• sys.dm_os_ OS information
• sys.dm_io_ Disk performance
• sys.dm_exec_ Sessions, requests, connections
• sys.dm_db_ Database info
• sys.dm_tran_ Transactions, locks
• sys.dm_... Audits, broker, CDC, FileStream,
FTS, HADR, Repl, RG, XE…
• Non tutte le DMV riguardano le performance
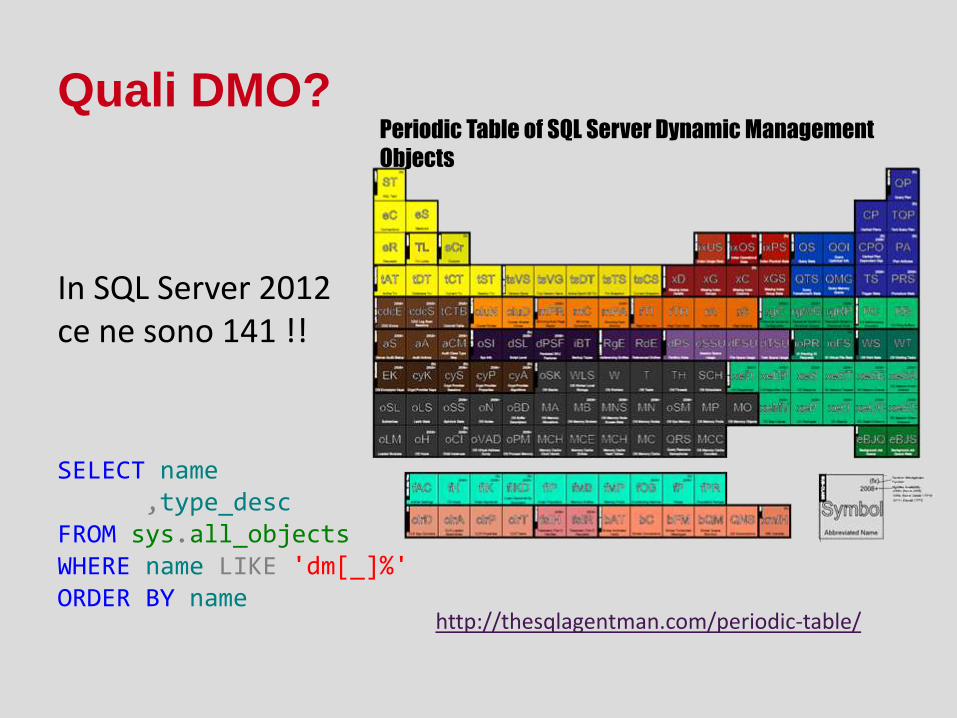
Quali DMO?Periodic Table of SQL Server Dynamic Management
Objects
SELECT name,type_desc
FROM sys.all_objectsWHERE name LIKE 'dm[_]%'ORDER BY name
In SQL Server 2012ce ne sono 141 !!
http://thesqlagentman.com/periodic-table/
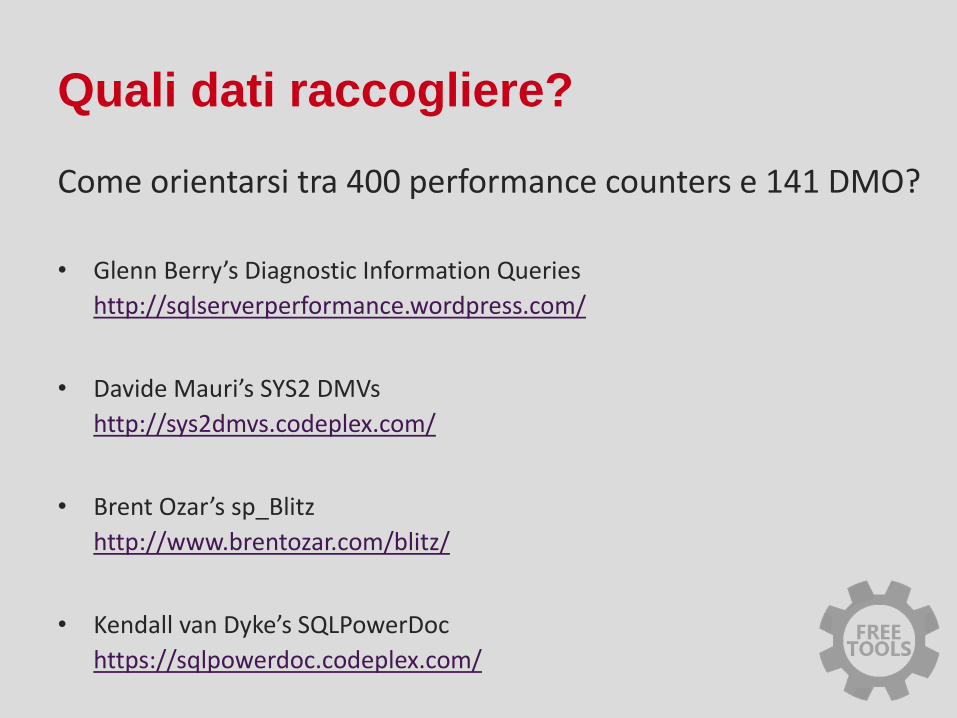
Quali dati raccogliere?
Come orientarsi tra 400 performance counters e 141 DMO?
• Glenn Berry’s Diagnostic Information Queries
http://sqlserverperformance.wordpress.com/
• Davide Mauri’s SYS2 DMVs
http://sys2dmvs.codeplex.com/
• Brent Ozar’s sp_Blitz
http://www.brentozar.com/blitz/
• Kendall van Dyke’s SQLPowerDoc
https://sqlpowerdoc.codeplex.com/
Come consultare i dati?
• Real-time
• Consultazione dei dati in tempo reale
• Monitoring e Alerting
• Mancano i punti di riferimento!
• Continuous
• Raccolta di informazioni in un repository storico
• Monitoring
• Troubleshooting
• Baselining uso i dati raccolti per il monitoring
seleziono un sottoinsieme
Strumenti di monitoring continuo
• Strumenti built-in di Windows• Reliability and Performance Monitor
• XPERF
• Perfmon automation• logman.exe
• relog.exe
• PAL [open source]• http://pal.codeplex.com/
• Offre Collector Set specifici per diversi prodotti MS
Strumenti di monitoring continuo
• Suite commerciali
• Soluzioni custom
• Pro e contro
• Strumenti Built-in di SQL Server
• Performance Data Collector
Performance Data Collector
• Presente in tutte le edizioni (no Express)
• Contiene 3 Collection Sets di sistema
• Modello estensibile con Collection Sets custom
• Raccoglie i dati a intervalli predefiniti
• I dati vengono salvati in un Management Datawarehouse
• Più istanze possono condividere lo stesso MDW
• Può essere integrato con Utility Control Point
• E’ corredato da report per analisi e consultazione dei dati
• Report centralizzati su Reporting Services:http://blogs.msdn.com/b/billramo/archive/tags/mdw+reports/
Quanto serve mantenerli?
• Dipende da
• Capacità disponibile
• Profondità dell’analisi richiesta
• Volatilità dell’ambiente
Quali dati formano la baseline?
• Seleziono un sottoinsieme dei dati raccolti per il
monitoring
• Periodicamente seleziono la baseline
• Selezione “implicita” giorno o mese precedente
• Selezione “esplicita” estraggo uno snapshot
• Una sola baseline?
• Dipende dal business cycle
• Dipende dalle applicazioni
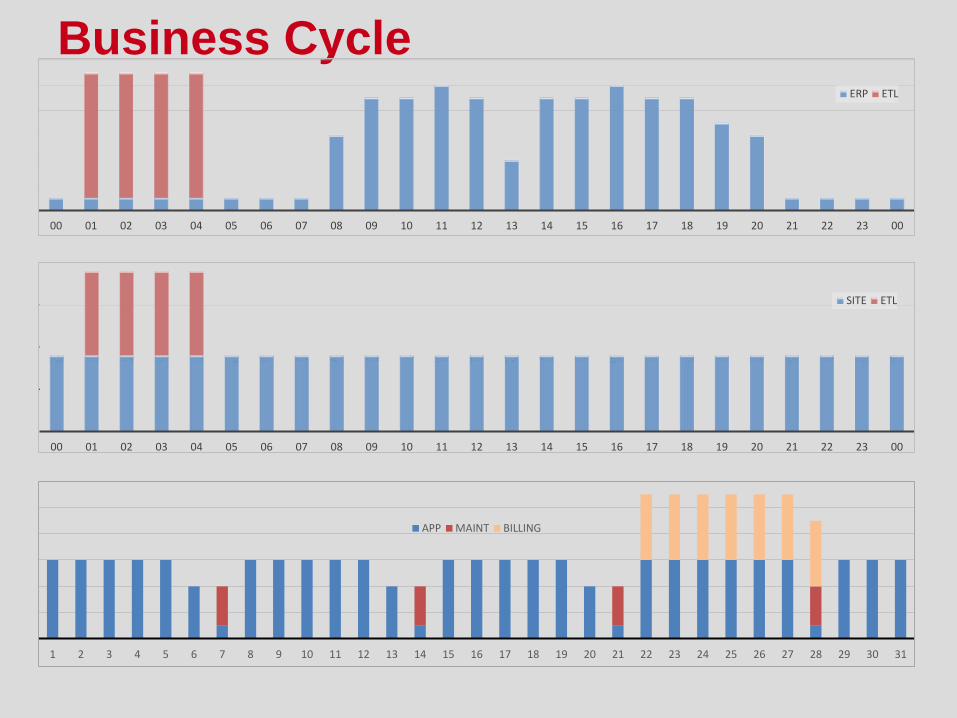
Business Cycle
00 01 02 03 04 05 06 07 08 09 10 11 12 13 14 15 16 17 18 19 20 21 22 23 00
ERP ETL
00 01 02 03 04 05 06 07 08 09 10 11 12 13 14 15 16 17 18 19 20 21 22 23 00
SITE ETL
1 2 3 4 5 6 7 8 9 10 11 12 13 14 15 16 17 18 19 20 21 22 23 24 25 26 27 28 29 30 31
APP MAINT BILLING
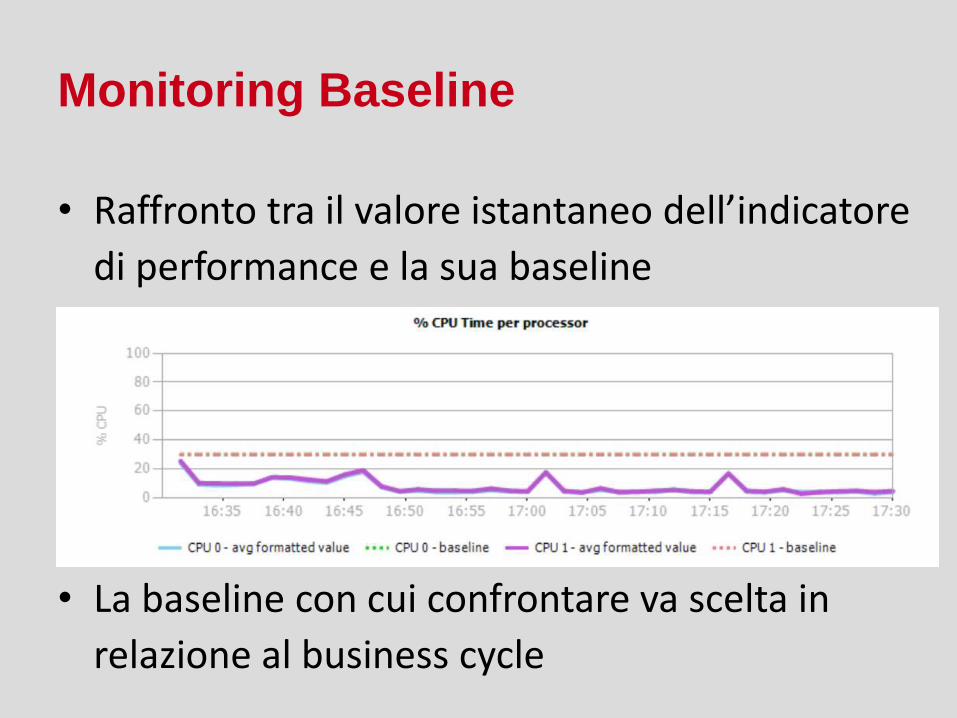
Monitoring Baseline
• Raffronto tra il valore istantaneo dell’indicatore
di performance e la sua baseline
• La baseline con cui confrontare va scelta in
relazione al business cycle
WORKLOAD ANALYSISCosa determina il carico su SQL Server?
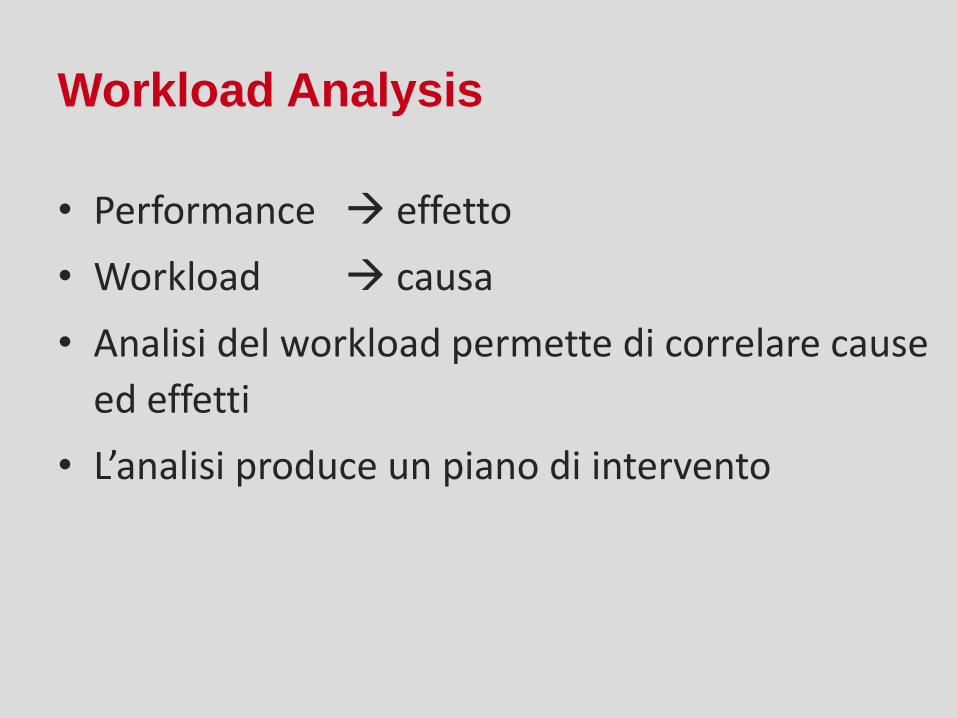
Workload Analysis
• Performance effetto
• Workload causa
• Analisi del workload permette di correlare cause
ed effetti
• L’analisi produce un piano di intervento
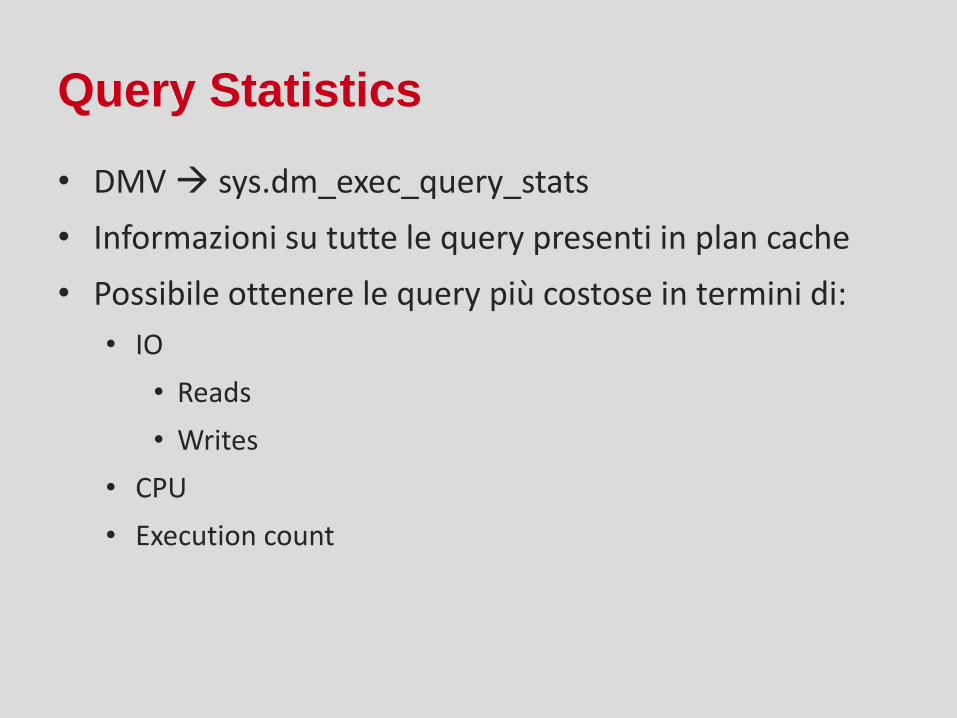
Query Statistics
• DMV sys.dm_exec_query_stats
• Informazioni su tutte le query presenti in plan cache
• Possibile ottenere le query più costose in termini di:
• IO
• Reads
• Writes
• CPU
• Execution count
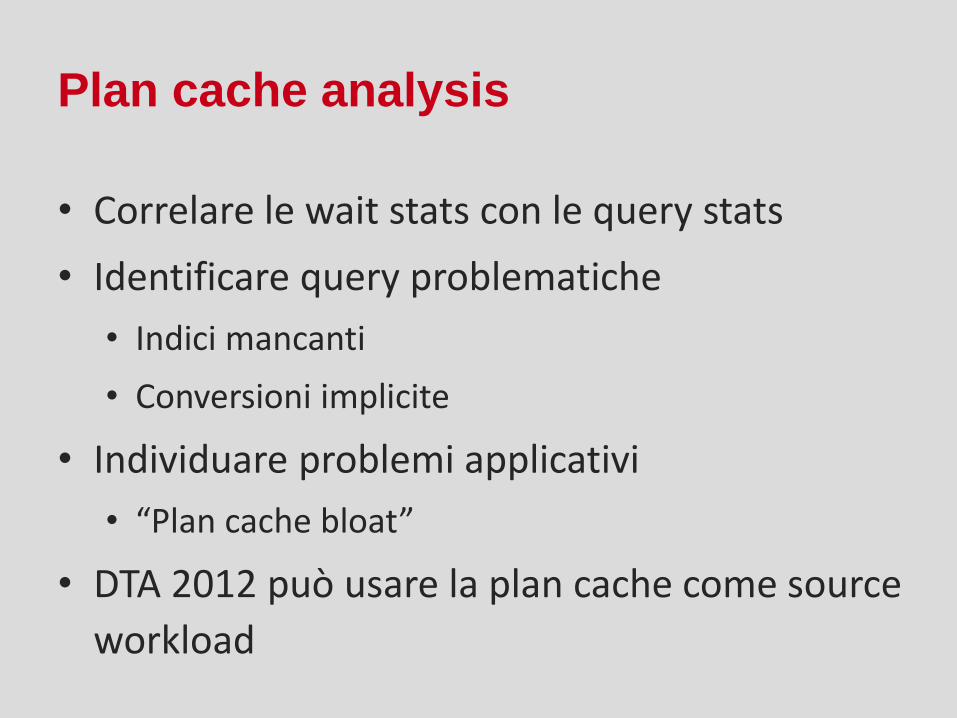
Plan cache analysis
• Correlare le wait stats con le query stats
• Identificare query problematiche
• Indici mancanti
• Conversioni implicite
• Individuare problemi applicativi
• “Plan cache bloat”
• DTA 2012 può usare la plan cache come source
workload
DEMOPlan cache analysis
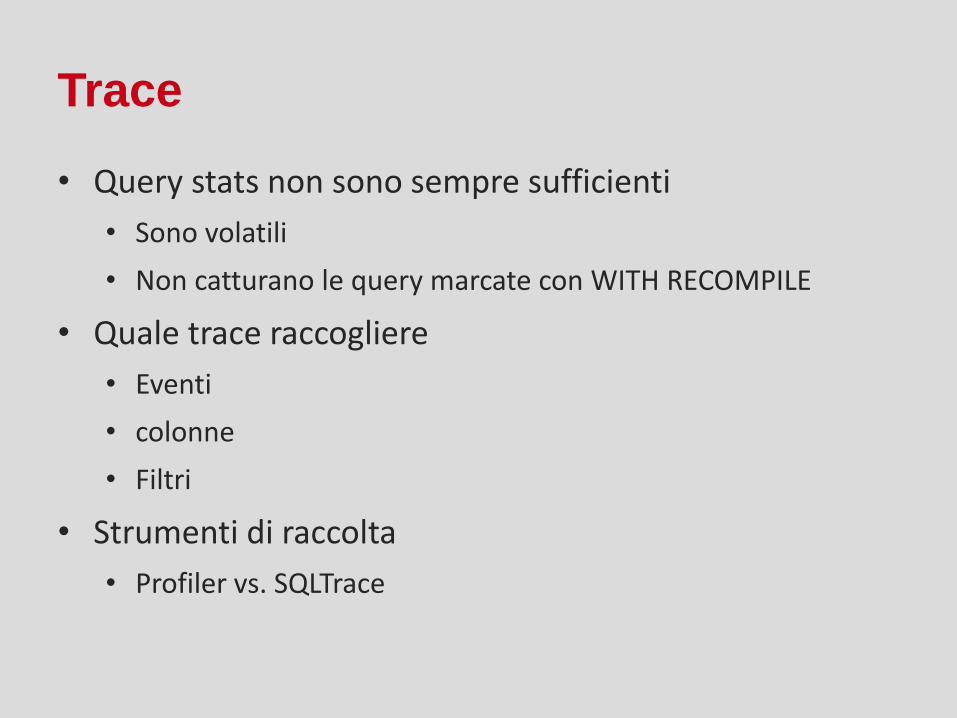
Trace
• Query stats non sono sempre sufficienti
• Sono volatili
• Non catturano le query marcate con WITH RECOMPILE
• Quale trace raccogliere
• Eventi
• colonne
• Filtri
• Strumenti di raccolta
• Profiler vs. SQLTrace
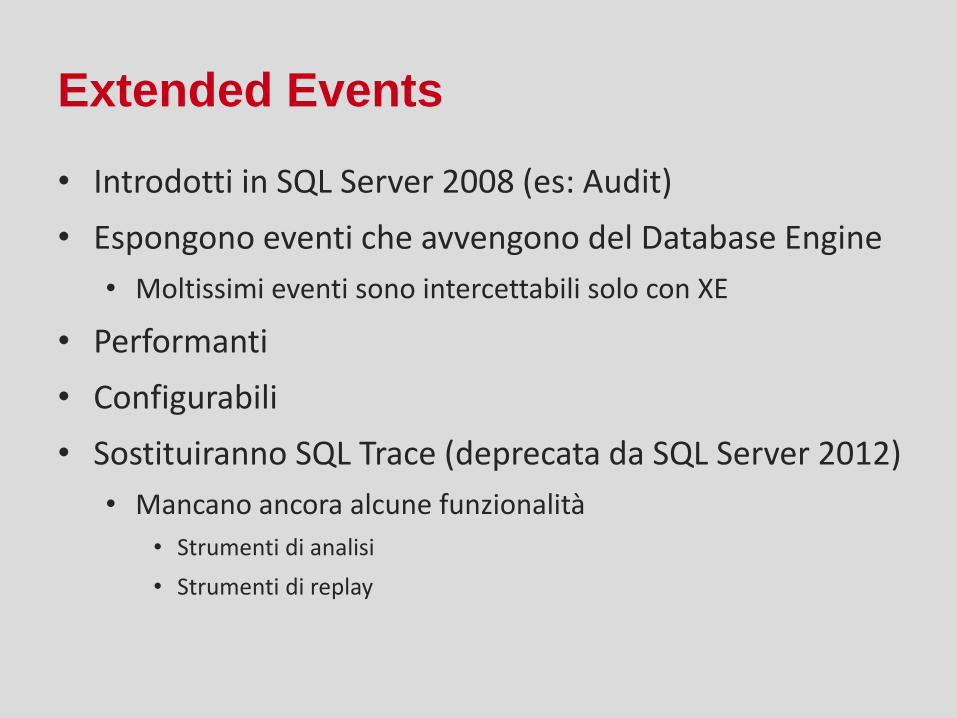
Extended Events
• Introdotti in SQL Server 2008 (es: Audit)
• Espongono eventi che avvengono del Database Engine
• Moltissimi eventi sono intercettabili solo con XE
• Performanti
• Configurabili
• Sostituiranno SQL Trace (deprecata da SQL Server 2012)
• Mancano ancora alcune funzionalità
• Strumenti di analisi
• Strumenti di replay
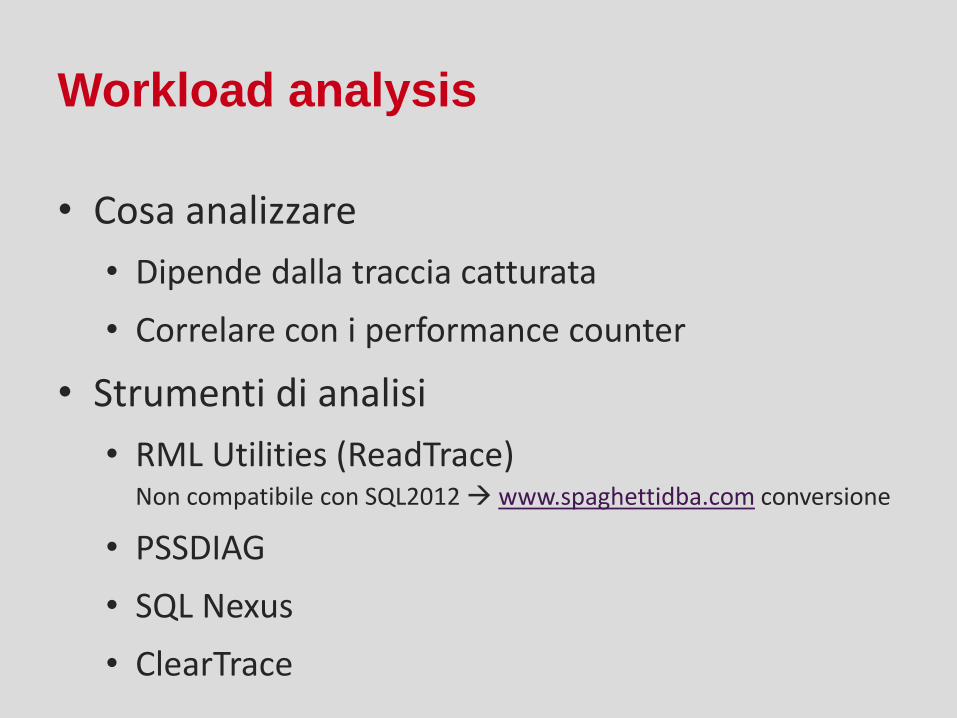
Workload analysis
• Cosa analizzare
• Dipende dalla traccia catturata
• Correlare con i performance counter
• Strumenti di analisi
• RML Utilities (ReadTrace) Non compatibile con SQL2012 www.spaghettidba.com conversione
• PSSDIAG
• SQL Nexus
• ClearTrace

BENCHMARKINGImmaginiamo diversi scenari
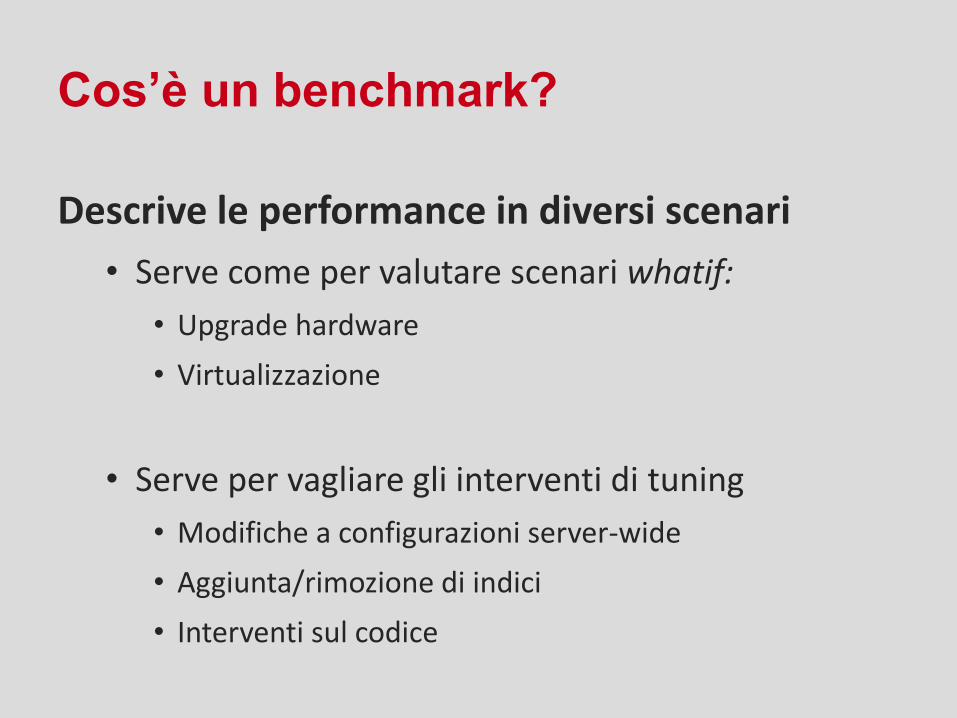
Cos’è un benchmark?
Descrive le performance in diversi scenari
• Serve come per valutare scenari whatif:
• Upgrade hardware
• Virtualizzazione
• Serve per vagliare gli interventi di tuning
• Modifiche a configurazioni server-wide
• Aggiunta/rimozione di indici
• Interventi sul codice
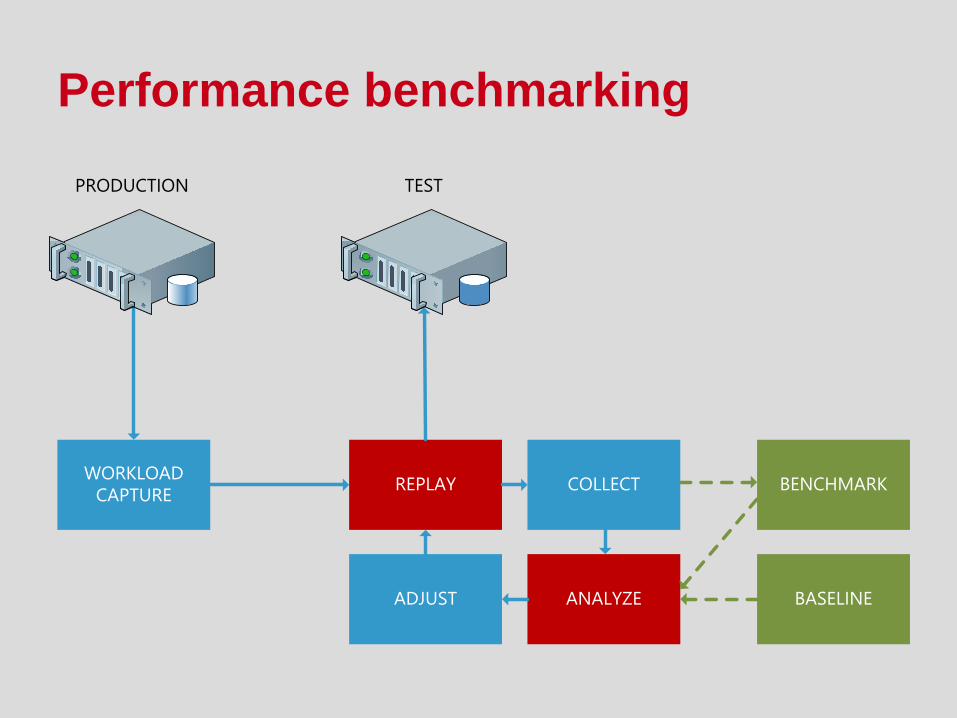
Performance benchmarking
WORKLOAD
CAPTUREREPLAY COLLECT
ANALYZEADJUST
PRODUCTION TEST
BASELINE
BENCHMARK
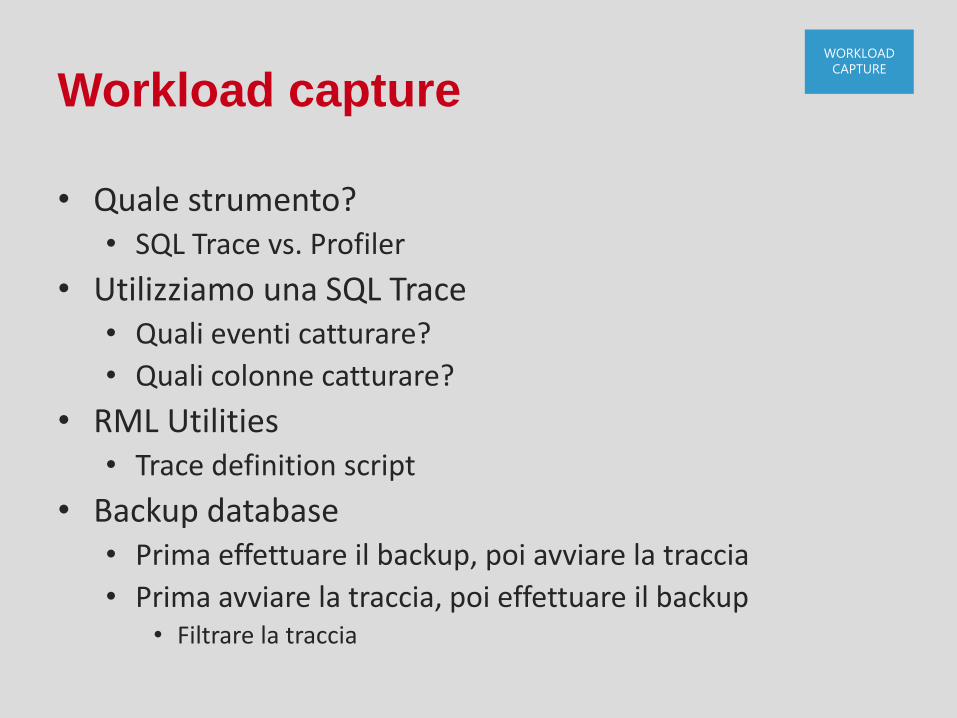
Workload capture
• Quale strumento?• SQL Trace vs. Profiler
• Utilizziamo una SQL Trace• Quali eventi catturare?
• Quali colonne catturare?
• RML Utilities• Trace definition script
• Backup database• Prima effettuare il backup, poi avviare la traccia
• Prima avviare la traccia, poi effettuare il backup• Filtrare la traccia
WORKLOAD
CAPTURE
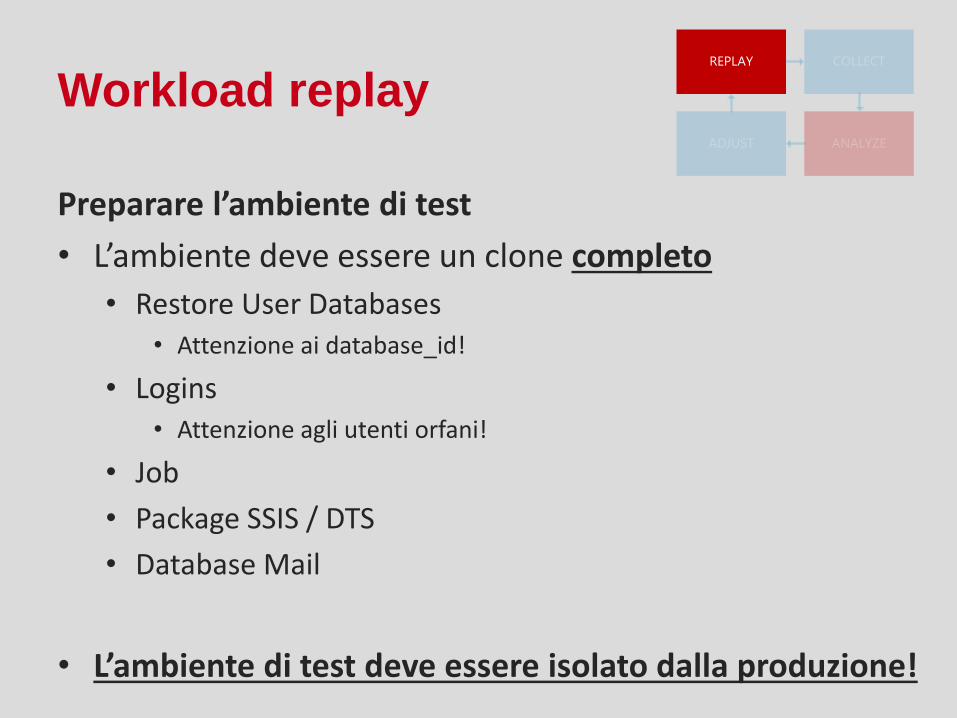
Workload replay
Preparare l’ambiente di test
• L’ambiente deve essere un clone completo
• Restore User Databases• Attenzione ai database_id!
• Logins• Attenzione agli utenti orfani!
• Job
• Package SSIS / DTS
• Database Mail
• L’ambiente di test deve essere isolato dalla produzione!
REPLAY COLLECT
ANALYZEADJUST
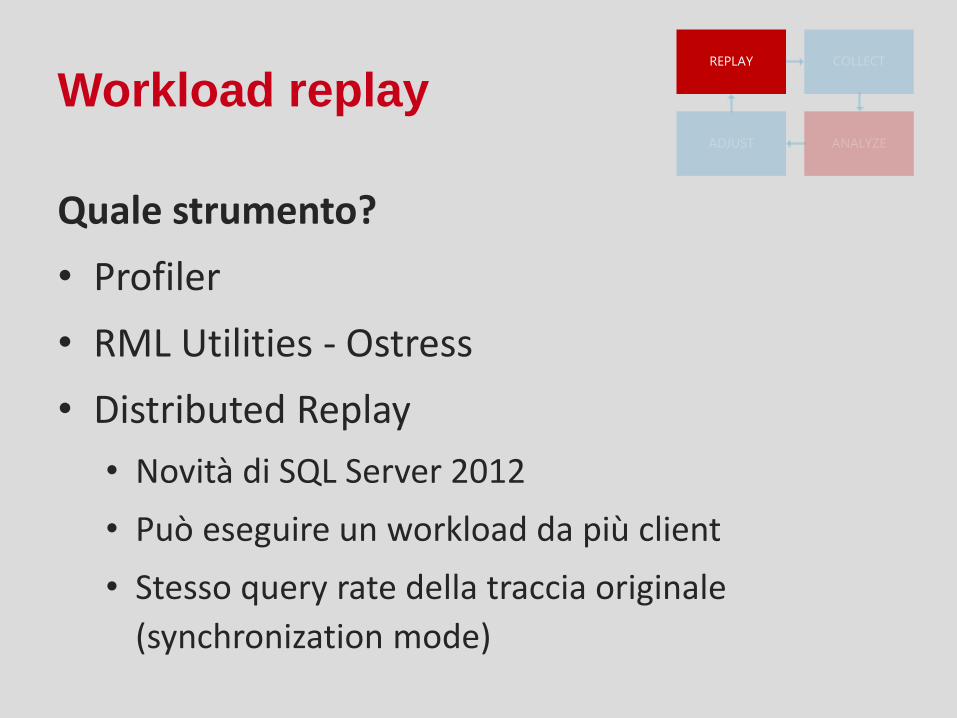
Workload replay
Quale strumento?
• Profiler
• RML Utilities - Ostress
• Distributed Replay
• Novità di SQL Server 2012
• Può eseguire un workload da più client
• Stesso query rate della traccia originale
(synchronization mode)
REPLAY COLLECT
ANALYZEADJUST
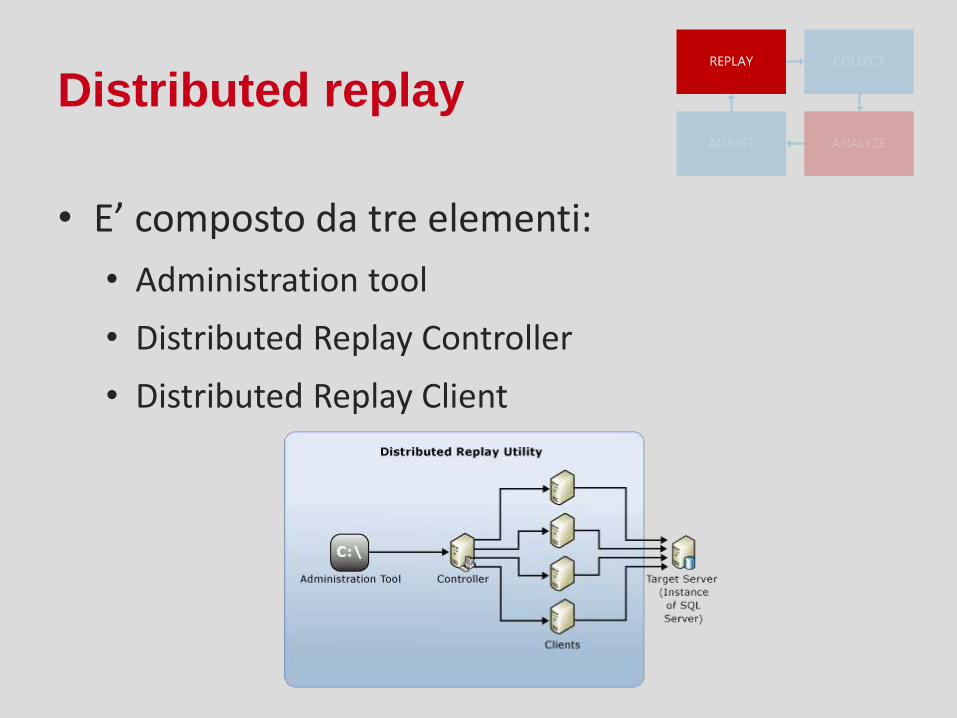
Distributed replay
• E’ composto da tre elementi:
• Administration tool
• Distributed Replay Controller
• Distributed Replay Client
REPLAY COLLECT
ANALYZEADJUST
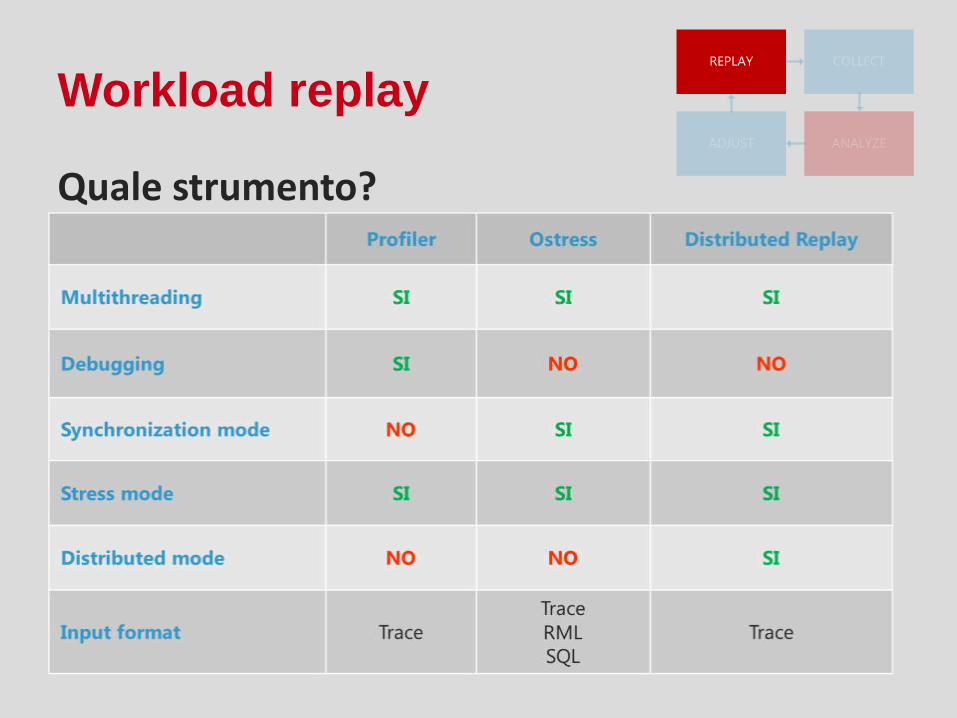
Workload replay
Quale strumento?
REPLAY COLLECT
ANALYZEADJUST
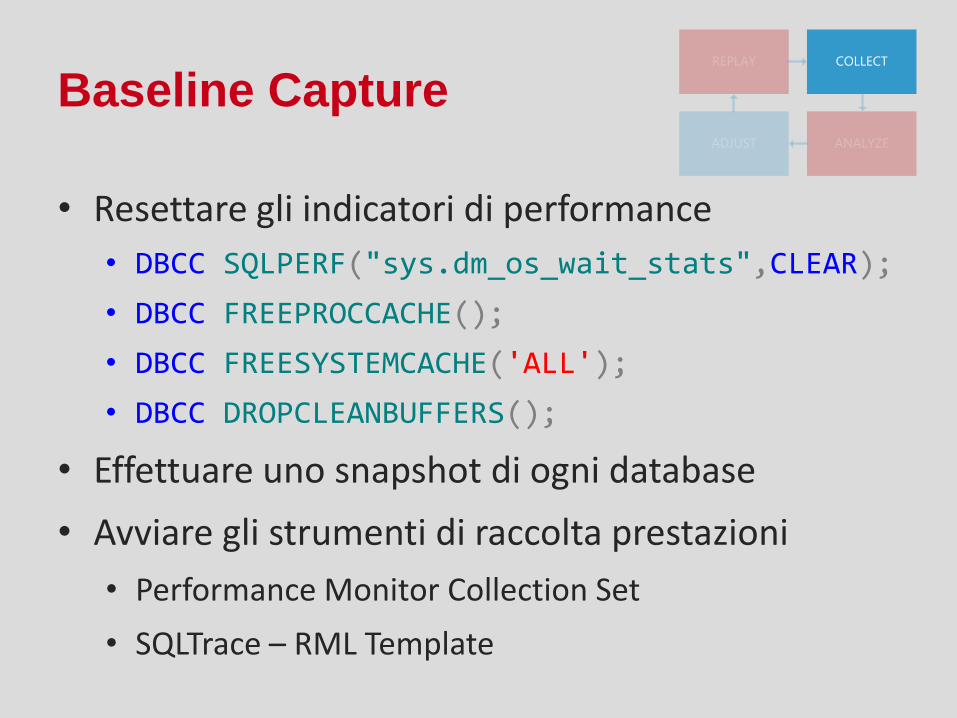
Baseline Capture
• Resettare gli indicatori di performance
• DBCC SQLPERF("sys.dm_os_wait_stats",CLEAR);
• DBCC FREEPROCCACHE();
• DBCC FREESYSTEMCACHE('ALL');
• DBCC DROPCLEANBUFFERS();
• Effettuare uno snapshot di ogni database
• Avviare gli strumenti di raccolta prestazioni
• Performance Monitor Collection Set
• SQLTrace – RML Template
REPLAY COLLECT
ANALYZEADJUST
Benchmark Capture
• Revert snapshot
• Applicare le modifiche
• Avviare gli strumenti di raccolta
• Avviare il replay
REPLAY COLLECT
ANALYZEADJUST
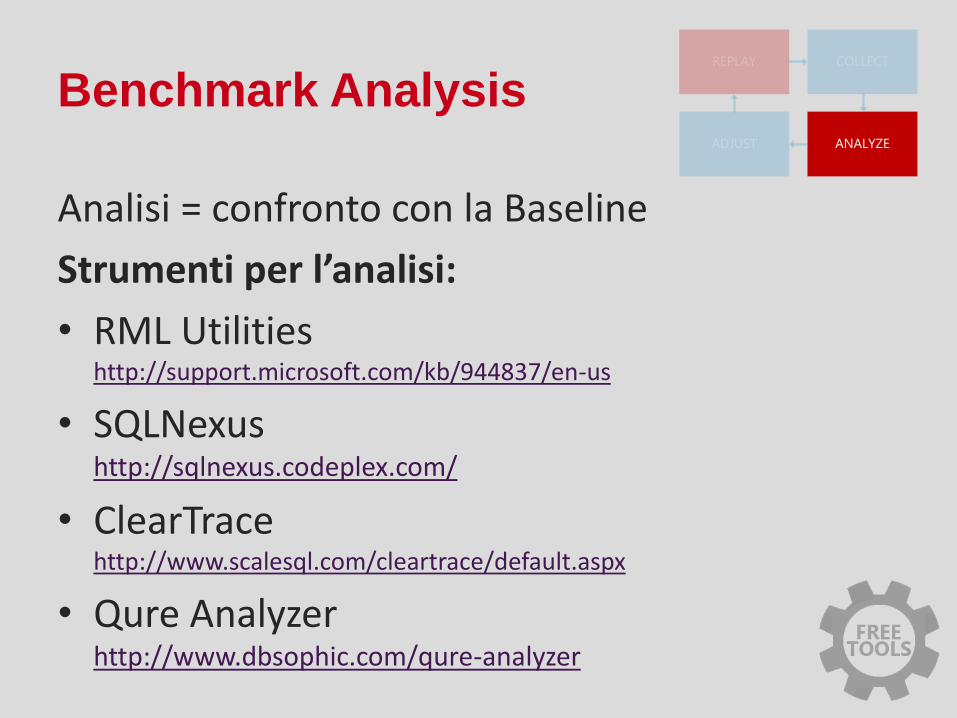
Benchmark Analysis
Analisi = confronto con la Baseline
Strumenti per l’analisi:
• RML Utilitieshttp://support.microsoft.com/kb/944837/en-us
• SQLNexushttp://sqlnexus.codeplex.com/
• ClearTracehttp://www.scalesql.com/cleartrace/default.aspx
• Qure Analyzerhttp://www.dbsophic.com/qure-analyzer
REPLAY COLLECT
ANALYZEADJUST
DEMOQure Analyzer

QUESTIONS&
ANSWERS
Links
• Technical Conferenceswww.technicalconferences.it
• SQL Server & Business Intelligence Conferencewww.sqlconference.it
• Gianluca Sartori - blogwww.spaghettidba.com
Grazie.Non dimenticare di riempire il modulo di feedback
SQL338
#sqlc2013
© EventHandler S.r.l. All rights reserved. Microsoft, Windows, Windows 8 and other product names are or may be registered trademarks and/or trademarks inthe U.S. and/or other countries. The information herein is for informational purposes only and represents the current view of Microsoft Corporation.EventHandler cannot guarantee the accuracy of any information provided after the date of this presentation.EVENTHANDLER MAKES NO WARRANTIES, EXPRESS, IMPLIED OR STATUTORY, AS TO THE INFORMATION IN THIS PRESENTATION.