SPURS Discussion Ray Schmitt/Eric Lindstrom Wed., July 21, 2010.
23
SPURS Discussion Ray Schmitt/Eric Lindstrom Wed., July 21, 2010
-
date post
19-Dec-2015 -
Category
Documents
-
view
214 -
download
0
Transcript of SPURS Discussion Ray Schmitt/Eric Lindstrom Wed., July 21, 2010.

SPURS Discussion
Ray Schmitt/Eric Lindstrom
Wed., July 21, 2010
Potential location for a process study
Location advantages:
>Low
>Low precip 1D phys.
>Modest eddy activity
>Source of water for northern tropical thermocline
>Stable S for Cal-Val
> Warm (better for Aquarius)
> Leverages other resources: 24 N section, Pirata Array, ESTOC time series (Canary Islands)
> Logistically tractable
)( SU
Objectives:What processes maintain the
salinity maximum?Where does the excess salt go?What processes give rise to
temporal variability?What is the larger impact on the
shallow overturning circulation?

Issues:
• What can we know about proposed work to date? (volunteers…?)
• What can be shared about future proposals?
• How can we communicate and coordinate once PIs are identified?
• What questions can we anticipate and discuss now?

Upper-ocean salinity balance:
a - rate of change of mixed layer salinity
b - advection by mean surface flow
c - divergence of horizontal surface fluxes
d - vertical entrainment/subduction/obduction
e - surface salt gain or loss due to evaporation – precipitation
f - small-scale vertical mixing and skin effects

Possible SPURS elements:• 3-4 months of dedicated ship time (medium class) over the course
of 1 year. • Seagliders for occupation of the butterfly boxes,• Mesoscale gliders and more AUVs (Spray, Slocum, Remus) some
equipped with microstructure sensors,• Microstructure profilers including surface skin profilers such as
ASIP, several EM profiling floats for examining mixing associated with inertial motions, temperature and shear microstructure capability on profiling floats. Salinity microstructure capability on profiler, floats and gliders (under development)
• A well-instrumented surface flux mooring, in place for at least one year, and densely instrumented with T, S, and velocity sensors in the upper 500 m
• A towed ship-based profiling CTD and ADCP• SSS-equipped drifters, Drifter/profilers, SST drifters• Multiple scale (global/basin/region) 3-dimensional eddy-resolving
ocean models with data assimilation capabilities over the selected field experiment region to support pre-FE OSSEs, realtime operations and post-experiment reanalysis. Also process models are required to test parameterizations as well as mesoscale atmospheric models for improved estimates of air-sea fluxes.
• Data server and archive
Issues:
• What is proposed (Eric)• Who is doing what? (Volunteers…)• What’s missing?• What coordination is needed now? (SPURS web
site at JPL, calendar…)• Ship time - 3 x 1 month cruises requested at
UNOLS. What are the needs for personnel, gear deployments, etc?
• What OSSE efforts are underway or proposed?• Is a SPURS regional modeling group needed?

Cruises:
• Spanish, Spring 2012 (Project funded, cruise uncertain)
• French/Irish, Summer 2012 (Proposed)
• US, Spring,Fall 2012, Spring 2013 (Proposed)
• + possible NOAA opportunities
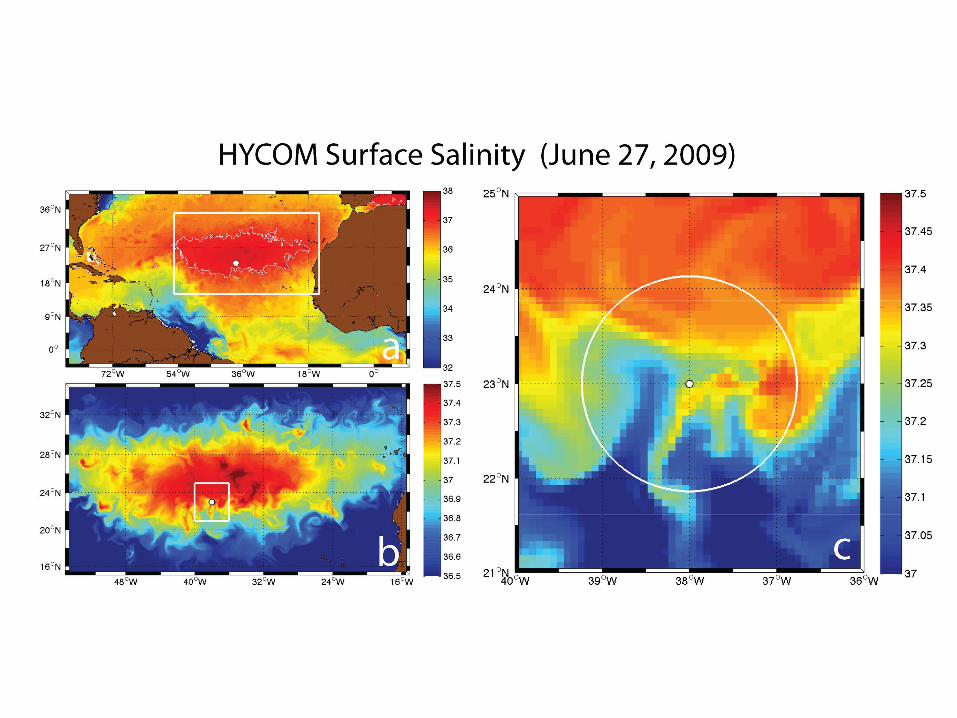

Hycom, SSS, June 29, 2009

SPURS Timing:
• NASA Field work proposals received May 28
• Discussion session today
• NSF proposals due Aug. 15.
• NASA funding decisions….?
• NASA Salinity Science Team proposals due Oct. 29.
• PI Planning Meeting, Jan 2011. – What planning can begin now?

• Surface Salinity (note SSS max is
north of E-P max. due to Ekman transport and convergence)
• Evap. – Precip. (note E-P zero is
close to vegetation boundary in Africa)


The surface eddy kinetic energy in the Atlantic estimated by Fratantoni (2001). The patterns are similar to those derived from altimetric data. The white area west of Africa corresponds to a region of low surface velocity and upwelling, thus few drifters linger in this area. The Salinity maximum corresponds with an area of low eddy kinetic energy.

Ekman transport vectors in Sverdrups (1 Sv = 106 m3s-1) and 10 cm contours of meandynamic topography of the sea surface. In color, the long-term mean sea surface salinity. Ekman transports were computed across 2.5ºx2.5º latitude-longitude cells using long-term mean wind stresses based on ECMWF ERA-40 monthly data (Uppala et al. 2005). Sea surface salinity was computed from the 1ºx1º World Ocean Atlas2005 (Antonov et al. 2006). N. Maximenko and P. Niiler provided the 1990-2002 mean ocean dynamic topography data (Maximenko and Niiler, 2005).

POP model (Maltrud et al, 2009)


Upper thermocline is favorable to salt fingers (~1/2 mixing in NATRE)
indicated by high Turner Angle, especially in late winter/spring
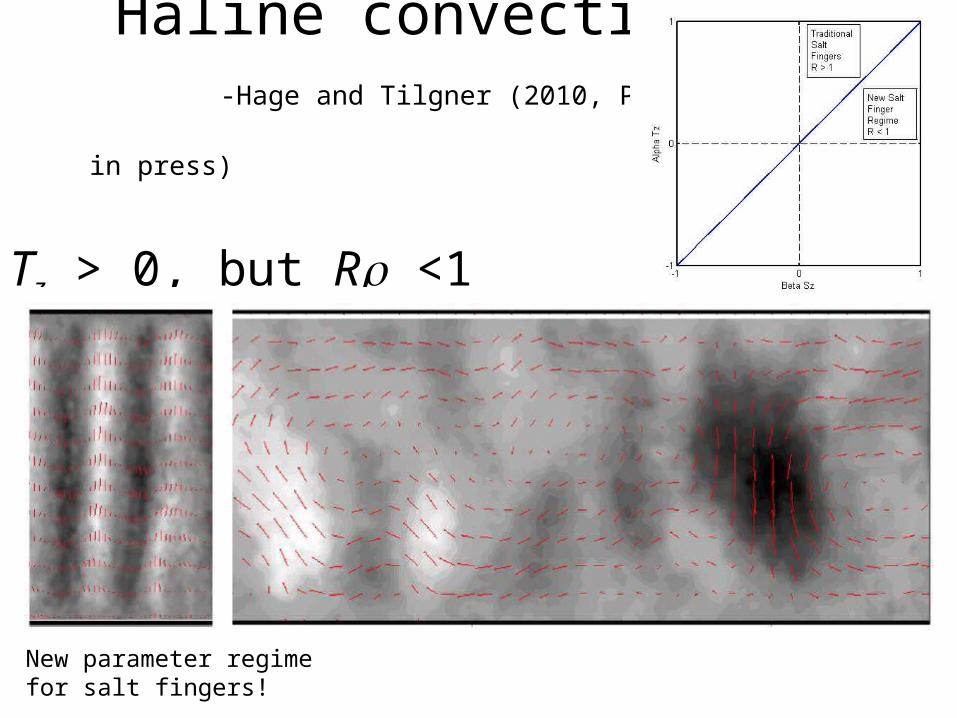
Haline convection -Hage and Tilgner (2010, Phys. Fluids,
in press)
Tz > 0, but R <1 Tz = 0
New parameter regime for salt fingers!

Tools for the Field Program:
• Floats • Gliders• Drifters • Moorings• Ships• Satellites • Micro-
structure profiling
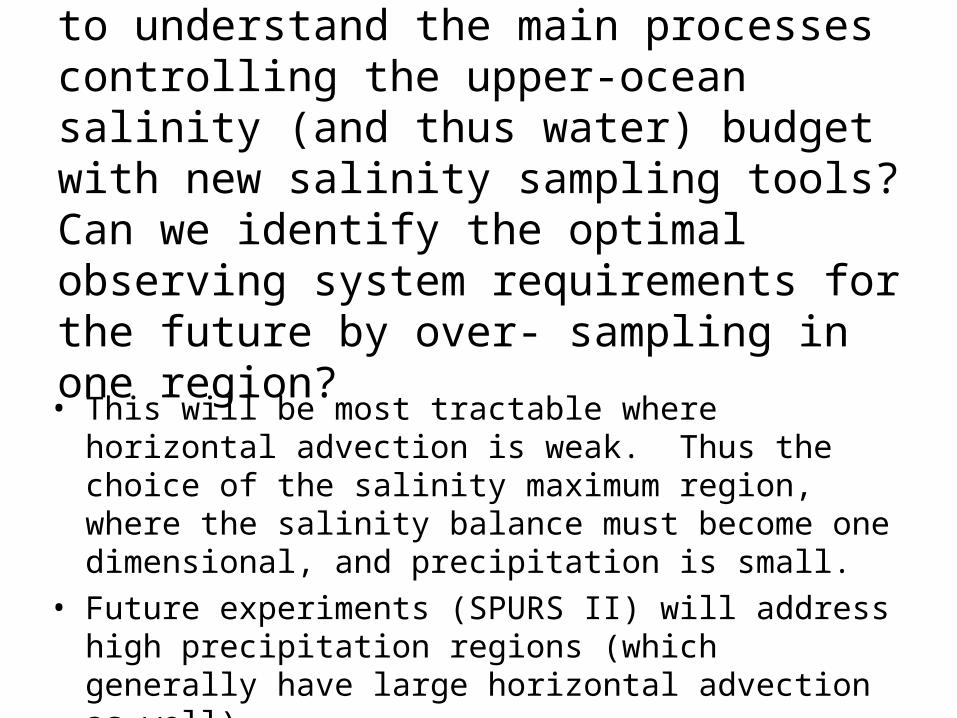
Central Questions: Can we begin to understand the main processes controlling the upper-ocean salinity (and thus water) budget with new salinity sampling tools? Can we identify the optimal observing system requirements for the future by over- sampling in one region?
• This will be most tractable where horizontal advection is weak. Thus the choice of the salinity maximum region, where the salinity balance must become one dimensional, and precipitation is small.
• Future experiments (SPURS II) will address high precipitation regions (which generally have large horizontal advection as well).


SPURS - I
• Goal: Identify the important processes controlling SSS in S-max.
• Field program 2012-2013• Modeling and data assimilation• Data server/archiving for public access• Cal/val for Aquarius & SMOS
Improved parameterizations for subgrid-scale processes in ocean modelsOptimize elements of the ocean observing system
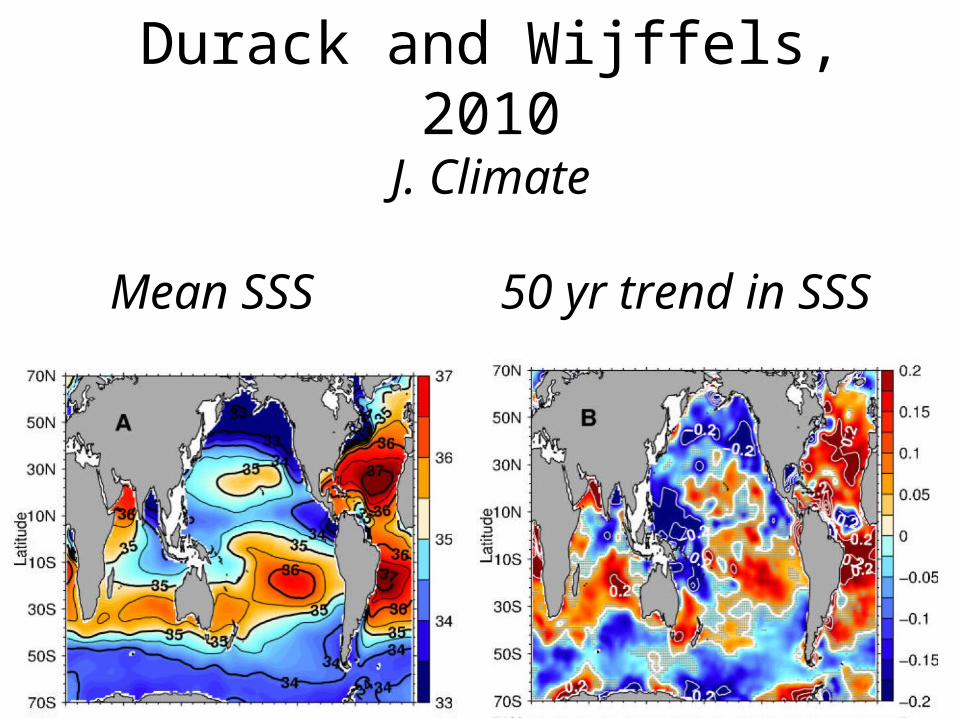
Durack and Wijffels, 2010J. Climate
Mean SSS 50 yr trend in SSS