Springflow and Well Withdrawals Similar techniques were ...
40
14 Hydrologic Budgets for the Madison and Minnelusa Aquifers, Black Hills Area, Water Years 1987-96 Springflow and Well Withdrawals Numerous headwater and artesian springs exist throughout the study area and both spring types are considered in the hydrologic budgets. The headwater springs originate from the Paleozoic units on the western side of the study area (Limestone Plateau area) and provide base flow to many area streams. Artesian springs that originate from the Madison and/or Minnelusa aquifers (Naus and others, in press) are common around the periphery of the Black Hills. Many artesian springs occur in locations downgradient from streamflow-loss zones, most commonly within or near the outcrop of the Spearfish Formation. Most estimates for artesian springflow are derived from streamflow records for streams with sub- stantial artesian springflow components. Streamflow at selected gaging stations is separated into two compo- nents—base flow and runoff. The base-flow compo- nent generally represents the amount of streamflow contributed by ground-water discharge. The base-flow component is estimated using the Base Flow Index (BFI) FORTRAN computer program (Wahl and Wahl, 1995) using coefficients of N=5 (5-day increments) and f=0.9 (90 percent minima criteria for determination of turning points). Similar techniques were used by Jarrell (2000) to identify headwater springflow for streams with sub- stantial headwater springflow components. However, estimates of headwater springflow used in the hydro- logic budgets are based on estimates of recharge over contributing ground-water areas. Additional details are provided in a subsequent section. Well withdrawals from the Madison and Minnelusa aquifers in the Black Hills area serve many categories of water use. These categories include municipal, self supply (domestic), irrigation, livestock, industrial, mining, thermoelectric power, and other. Estimates of well withdrawals used in the hydrologic budgets are based on water-use data from Amundson (1998). Storage Considerations For the period 1987-96, change in storage is approximately zero based on well hydrographs and estimated recharge. Examination of a long-term hydrograph (1962-98) for a well completed in the Minnelusa aquifer shows that although the water level has fluctuated nearly 50 ft, there is no apparent long- term trend in the water level (fig. 7; location shown in fig. 1). Hydrographs for selected well pairs (locations shown in fig. 1) completed in the Madison and Figure 7. Hydrograph for Redwater Minnelusa well. 1960 1965 1970 1975 1980 1985 1990 1995 1999 CALENDAR YEAR 3,470 3,530 3,470 3,480 3,490 3,500 3,510 3,520 WATER LEVEL, IN FEET ABOVE SEA LEVEL Redwater Minnelusa, 7N 2E10BADC (site 1)
Transcript of Springflow and Well Withdrawals Similar techniques were ...

14 Hydrologic Budgets for the Madison and Minnelusa Aquifers, Black Hills Area, Water Years 1987-96
Springflow and Well Withdrawals
Numerous headwater and artesian springs exist throughout the study area and both spring types are considered in the hydrologic budgets. The headwater springs originate from the Paleozoic units on the western side of the study area (Limestone Plateau area) and provide base flow to many area streams. Artesian springs that originate from the Madison and/or Minnelusa aquifers (Naus and others, in press) are common around the periphery of the Black Hills. Many artesian springs occur in locations downgradient from streamflow-loss zones, most commonly within or near the outcrop of the Spearfish Formation.
Most estimates for artesian springflow are derived from streamflow records for streams with sub-stantial artesian springflow components. Streamflow at selected gaging stations is separated into two compo-nents—base flow and runoff. The base-flow compo-nent generally represents the amount of streamflow contributed by ground-water discharge. The base-flow component is estimated using the Base Flow Index (BFI) FORTRAN computer program (Wahl and Wahl, 1995) using coefficients of N=5 (5-day increments) and f=0.9 (90 percent minima criteria for determination of turning points).
Similar techniques were used by Jarrell (2000) to identify headwater springflow for streams with sub-stantial headwater springflow components. However, estimates of headwater springflow used in the hydro-logic budgets are based on estimates of recharge over contributing ground-water areas. Additional details are provided in a subsequent section.
Well withdrawals from the Madison and Minnelusa aquifers in the Black Hills area serve many categories of water use. These categories include municipal, self supply (domestic), irrigation, livestock, industrial, mining, thermoelectric power, and other. Estimates of well withdrawals used in the hydrologic budgets are based on water-use data from Amundson (1998).
Storage Considerations
For the period 1987-96, change in storage is approximately zero based on well hydrographs and estimated recharge. Examination of a long-term hydrograph (1962-98) for a well completed in the Minnelusa aquifer shows that although the water level has fluctuated nearly 50 ft, there is no apparent long-term trend in the water level (fig. 7; location shown in fig. 1). Hydrographs for selected well pairs (locations shown in fig. 1) completed in the Madison and
Figure 7. Hydrograph for Redwater Minnelusa well.
1960 1965 1970 1975 1980 1985 1990 1995 1999
CALENDAR YEAR
3,470
3,530
3,470
3,480
3,490
3,500
3,510
3,520
WAT
ER
LE
VE
L, IN
FE
ET
AB
OV
E S
EA
LE
VE
L Redwater Minnelusa, 7N 2E10BADC (site 1)

Hydrologic Budgets 15
Minnelusa aquifers are shown in figure 8. Hydro-graphs that span the period 1987-96 indicate that the net change in storage during this period generally is small and can be neglected, based on water levels that were approximately equal in 1987 and 1996. Further-more, the lowest water level during the 10-year period generally occurred during water year 1992 as indicated by most hydrographs. Thus, the 6-year period from 1987-92 generally is a period of decreasing storage (outflows exceed inflows), and the 4-year period from 1993-96 is a period of increasing storage (inflows exceed outflows).
The assumption that change in storage for 1987-96 is approximately equal to zero also is vali-dated by recharge estimates. Average recharge for 1987-96 (395 ft3/s) is approximately equal to average recharge for the period 1962-98 (410 ft3/s), which was a long-term period of generally surplus precipitation, relative to generally deficit precipitation during 1931-61 (fig. 9). Thus, recharge during 1987-96 is reasonably representative of average conditions since 1962, but is considerably higher than recharge during the prolonged dry conditions of 1931-61.
Budgeting Scenarios
Two basic budgeting scenarios are considered: (1) an overall budget for the entire study area including parts of Wyoming (fig. 2); and (2) subarea budgets for selected areas within the study area. The timeframes for both budgeting scenarios are 1987-96.
For the overall budget, average values for the budget components are considered. Net ground-water flow is calculated using equation 2, assuming change in storage is zero.
For the subarea budgets, the study area is subdi-vided into nine subareas, and two timeframes with equal but opposite changes in storage are considered: (1) 1987-92 (generally decreasing storage); and (2) 1993-96 (generally increasing storage). For this budgeting scenario, it also is assumed that the ground-water flow terms on the left side of equation 2 do not vary on an annual basis because only large changes in hydraulic gradient could induce significant changes in ground-water flow rates. Although some error could be introduced by this assumption, the negative error introduced for years of declining water levels probably is offset by the positive error introduced for years of increasing water levels. Using annual estimates for the various budget components on the right side of
equation 2, an iterative process is used to solve for the ground-water inflow and outflow components, such that the summed volumetric change in storage for the two time frames is approximately equal, but opposite.
Using Darcy’s Law, the ground-water flow com-ponents determined for the subarea budgets then are used to estimate transmissivity at the study area bound-aries and at any subarea flow zones that are assumed to exist. Anisotropic flow conditions are likely in the study area; however, subareas were selected so that flow boundaries could be approximated assuming iso-tropic and homogeneous conditions. Although aniso-tropic flow could not be specifically estimated, the subarea budgets and computation of average transmis-sivities provide useful insight on how anisotropic con-ditions probably are involved in the movement of water to artesian springs. Hydraulic gradients are determined using potentiometric-surface maps for the Madison and Minnelusa aquifers. The general assumption that trans-missivity is equal for the Madison and Minnelusa aquifers is used, which yields estimates of transmis-sivity for the entire combined thicknesses of the two aquifers.
HYDROLOGIC BUDGETS
As previously discussed, two budgeting scenarios are considered—an overall budget for the entire study area and individual budgets for nine sub-areas. The timeframe for both budgeting scenarios is 1987-96. In the following sections, the overall budget is presented first, which includes derivations of budget components, after which subarea budgets are presented.
Overall Budget for Entire Study Area
The change in storage for the budgeting period (1987-96) is assumed to be zero, as previously dis-cussed. Using equation 2, net ground-water flow (out-flow minus inflow) is calculated as 100 ft3/s by subtracting estimated values for headwater springflow (78 ft3/s), artesian springflow (189 ft3/s), and well withdrawals (28 ft3/s) from average recharge (395 ft3/s). Thus, artesian springflow is the single largest outflow component. Total springflow (including headwater and artesian springflow) averages 267 ft3/s, which constitutes about 68 percent of estimated recharge.

16 Hydrologic Budgets for the Madison and Minnelusa Aquifers, Black Hills Area, Water Years 1987-96
Figure 8. Hydrographs for selected well pairs.
3,620
3,780
3,640
3,660
3,680
3,700
3,720
3,740
3,760W
ATE
R L
EV
EL,
IN F
EE
T A
BO
VE
SE
A L
EV
EL
State Line Madison, 7N 1E33CCDD (site 2)State Line Minnelusa, 7N 1E33CCDD2 (site 3)
WAT
ER
LE
VE
L, IN
FE
ET
AB
OV
E S
EA
LE
VE
L
1984 1986 1988 1990 1992 1994 1996 1998
CALENDAR YEAR
1984 1986 1988 1990 1992 1994 1996 1998
CALENDAR YEAR
WAT
ER
LE
VE
L, IN
FE
ET
AB
OV
E S
EA
LE
VE
LA
C D
E F
B
3,560
3,680
3,580
3,600
3,620
3,640
3,660 Tilford Madison, 4N 6E19AABA2 (site 4)Tilford Minnelusa, 4N 6E19AABA (site 5)
3,400
3,650
3,450
3,500
3,550
3,600
Piedmont Madison, 3N 6E15ABB2 (site 6)Piedmont Minnelusa, 3N 6E15ABB (site 7)
3,420
3,500
3,440
3,460
3,480
City Quarry Madison, 2N 7E32ABBC2 (site 8)City Quarry Minnelusa, 2N 7E32ABBC (site 9)
3,440
3,580
3,460
3,480
3,500
3,520
3,540
3,560 Reptile Gardens Madison, 1S 7E 3CDBD (site 10)Reptile Gardens Minnelusa, 1S 7E 3CDBD2 (site 11)
3,630
3,655
3,635
3,640
3,645
3,650Minnekahta Junction Madison, 7S 4E19BCCB (site 12)Minnekahta Junction Minnelusa, 7S 4E19BCCB2 (site 13)

Hydrologic Budgets 17
Because net ground-water flow (which includes leakage to and from adjacent aquifers) is positive, this solution indicates that ground-water outflow exceeds ground-water inflow by 100 ft3/s. This solution is consistent with potentiometric-surface maps (pre-sented in a following section), which show a gradient away from the uplifted central core of the Black Hills. Possible components of regional ground-water inflow from the west (Wyoming) cannot be evaluated using this budgeting scenario, but is addressed as part of the subarea budgets. The following sections discuss derivations of budget components that are used.
Inflow Components
Inflow components consist of recharge, ground-water inflow, and possible leakage from other aquifers. Estimates for average streamflow and precipitation recharge (table 1) for water years 1987-96 are used for the overall budget. During 1987-96, recharge esti-mates range from about 141 ft3/s in 1988 to 847 ft3/s in 1995. Because leakage to (or from) the Madison and Minnelusa aquifers cannot be evaluated, it is included with net ground-water flow (outflow minus inflow), which is calculated using equation 2. Thus, only the net difference between ground-water outflow and
Figure 9. Long-term trends in precipitation for the Black Hills area, water years 1931-98 (from Driscoll,Hamade, and Kenner, 2000).
0
30
10
20
AN
NU
AL
PR
EC
IPIT
ATIO
N, I
N IN
CH
ES
ANNUAL PRECIPITATIONLONG-TERM AVERAGE (18.61 INCHES)
1930 20001940 1950 1960 1970 1980 1990
YEAR
-50
0
-40
-30
-20
-10
CU
MU
LAT
IVE
DE
PAR
TU
RE
, IN
INC
HE
S
Annual precipitation for the entire study area
Cumulative departure from long-term average
18 Hydrologic Budgets for the Madison and Minnelusa Aquifers, Black Hills Area, Water Years 1987-96
inflow can be evaluated using the overall budget scenario.
Outflow Components
Outflow components consist of springflow from headwater and artesian springs, well withdrawals, and ground-water outflow (including leakage to other aquifers, which is lumped with net ground-water flow). Derivations of estimates for headwater springflow, artesian springflow, and well withdrawals are presented in the following sections.
Headwater Springflow
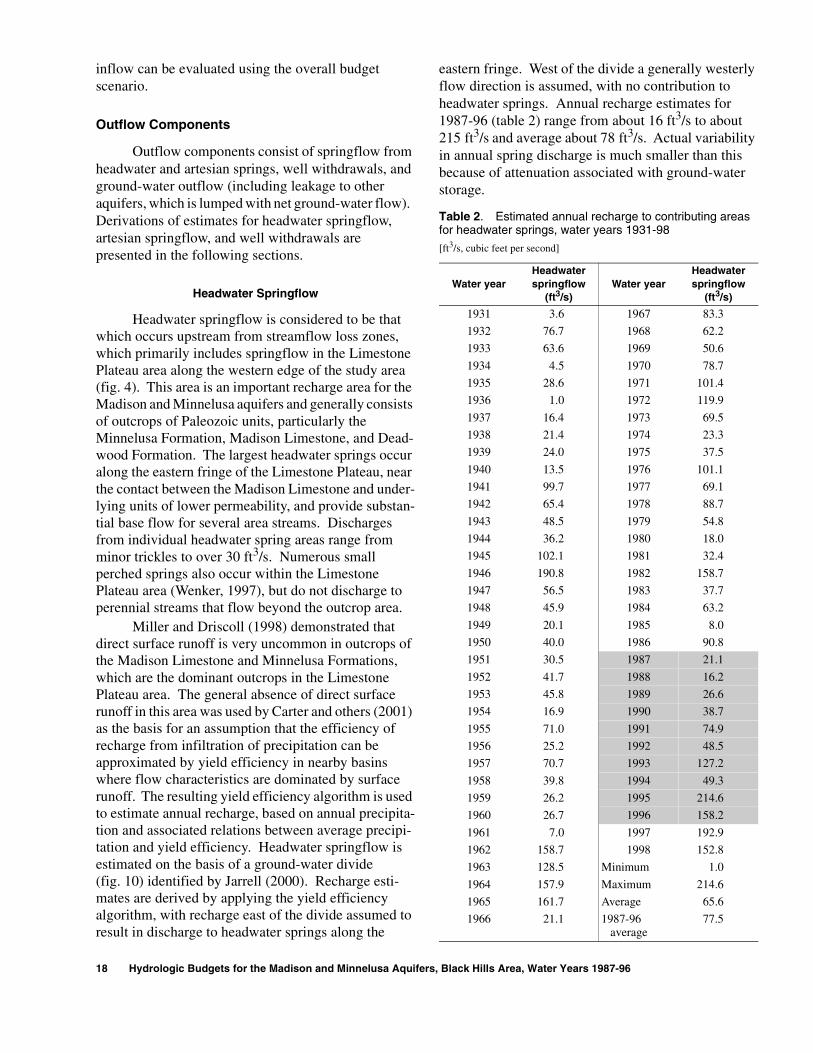
Headwater springflow is considered to be that which occurs upstream from streamflow loss zones, which primarily includes springflow in the Limestone Plateau area along the western edge of the study area (fig. 4). This area is an important recharge area for the Madison and Minnelusa aquifers and generally consists of outcrops of Paleozoic units, particularly the Minnelusa Formation, Madison Limestone, and Dead-wood Formation. The largest headwater springs occur along the eastern fringe of the Limestone Plateau, near the contact between the Madison Limestone and under-lying units of lower permeability, and provide substan-tial base flow for several area streams. Discharges from individual headwater spring areas range from minor trickles to over 30 ft3/s. Numerous small perched springs also occur within the Limestone Plateau area (Wenker, 1997), but do not discharge to perennial streams that flow beyond the outcrop area.
Miller and Driscoll (1998) demonstrated that direct surface runoff is very uncommon in outcrops of the Madison Limestone and Minnelusa Formations, which are the dominant outcrops in the Limestone Plateau area. The general absence of direct surface runoff in this area was used by Carter and others (2001) as the basis for an assumption that the efficiency of recharge from infiltration of precipitation can be approximated by yield efficiency in nearby basins where flow characteristics are dominated by surface runoff. The resulting yield efficiency algorithm is used to estimate annual recharge, based on annual precipita-tion and associated relations between average precipi-tation and yield efficiency. Headwater springflow is estimated on the basis of a ground-water divide (fig. 10) identified by Jarrell (2000). Recharge esti-mates are derived by applying the yield efficiency algorithm, with recharge east of the divide assumed to result in discharge to headwater springs along the
eastern fringe. West of the divide a generally westerly flow direction is assumed, with no contribution to headwater springs. Annual recharge estimates for 1987-96 (table 2) range from about 16 ft3/s to about 215 ft3/s and average about 78 ft3/s. Actual variability in annual spring discharge is much smaller than this because of attenuation associated with ground-water storage.
Table 2. Estimated annual recharge to contributing areas for headwater springs, water years 1931-98
[ft3/s, cubic feet per second]
Water yearHeadwater springflow
(ft3/s)Water year
Headwater springflow
(ft3/s)
1931 3.6 1967 83.3
1932 76.7 1968 62.2
1933 63.6 1969 50.6
1934 4.5 1970 78.7
1935 28.6 1971 101.4
1936 1.0 1972 119.9
1937 16.4 1973 69.5
1938 21.4 1974 23.3
1939 24.0 1975 37.5
1940 13.5 1976 101.1
1941 99.7 1977 69.1
1942 65.4 1978 88.7
1943 48.5 1979 54.8
1944 36.2 1980 18.0
1945 102.1 1981 32.4
1946 190.8 1982 158.7
1947 56.5 1983 37.7
1948 45.9 1984 63.2
1949 20.1 1985 8.0
1950 40.0 1986 90.8
1951 30.5 1987 21.1
1952 41.7 1988 16.2
1953 45.8 1989 26.6
1954 16.9 1990 38.7
1955 71.0 1991 74.9
1956 25.2 1992 48.5
1957 70.7 1993 127.2
1958 39.8 1994 49.3
1959 26.2 1995 214.6
1960 26.7 1996 158.2
1961 7.0 1997 192.9
1962 158.7 1998 152.8
1963 128.5 Minimum 1.0
1964 157.9 Maximum 214.6
1965 161.7 Average 65.6
1966 21.1 1987-96 average
77.5

Hydrologic Budgets 19
Lit
tle
Spea
rfis
h
Spea
rfis
h
Creek
Creek
CreekCastle
Castle
Cas
tle
Castle
Creek
CreekSp
ring
French
Creek
Creek
N. F
ork
S. Fork
N. Fork
S. Fork
Rapid
Rapid
Rapid
Rhoad
s Fork
Cre
ek
Cr
Squaw
Annie
Creek
Cr
Creek
Cre
ek
DeerfieldReservoir
PactolaReservoir
SheridanLake
StockadeLakeRed Canyon
Lead
Hill City
CUSTER
CheyenneCrossing
Rochford
LAWRENCE COUNTY
PENNINGTON COUNTY
CUSTER COUNTY
L I
M E
S T
O N
EP
L A
T E
A U
2000
6000
600064
00
6400
6600
6600
6400
6400
6400
7000
6800
7000
6600
6800
6000
5000
5500
6200
6200
6000
6600
6400
6200
6000
45005500
6000
5000
5500
5500
5500
5500
5500
5000
3000
3500
40004500
5000
STRUCTURE CONTOUR--Shows approximate altitude of the top of the Deadwood Formation (modified from Redden, 1994; Carter and Redden, 1999e). Contour interval is 200 and 500 feet. Dashed where inferred. Datum is sea level
ESTIMATED GROUND-WATER DIVIDE FOR THE MADISON AQUIFER (modified from Jarrell, 2000)
EXPLANATION
Figure 10. Major structural features and estimated ground-water divide in Limestone Plateau area.
51 2 3 4 MILES
51 2 3 4 KILOMETERS0
0
44o15'
44o
43o45'
103o45'
104o
103o30'
FAULT--Dashed where approxi- mated. Bar and ball on down- thrown side
ANTICLINE--Showing trace of axial plane and direction of plunge. Dashed where approximated
SYNCLINE--Showing trace of axial plane and direction of plunge. Dashed where approximated
MONOCLINE--Showing trace of axial plane. Dashed where approximated
DOME--Symbol size approxi- mately proportional to size of dome. Dome asymmetry indicated by arrow length
Base from U.S. Geological Survey digital data, 1:100,000, 1991Universal Transverse Mercator projection, zone 13
SOUTH DAKOTA
StudyArea
AreaShown
OUTCROP OF MADISON LIMESTONE AND ENGLEWOOD FORMATION (from Strobel and others, 1999)
OUTCROP OF MINNELUSA FORMATION (from Strobel and others, 1999)
OUTCROP OF DEADWOOD FORMATION (from Strobel and others, 1999)

20 Hydrologic Budgets for the Madison and Minnelusa Aquifers, Black Hills Area, Water Years 1987-96
Headwater springflow has been measured in various locations; however, the aforementioned approach is used for estimation of headwater spring-flow because available streamflow records are insufficient for water-budget calculations. Available streamflow records have been extremely useful, however, in quantifying recharge and discharge characteristics.
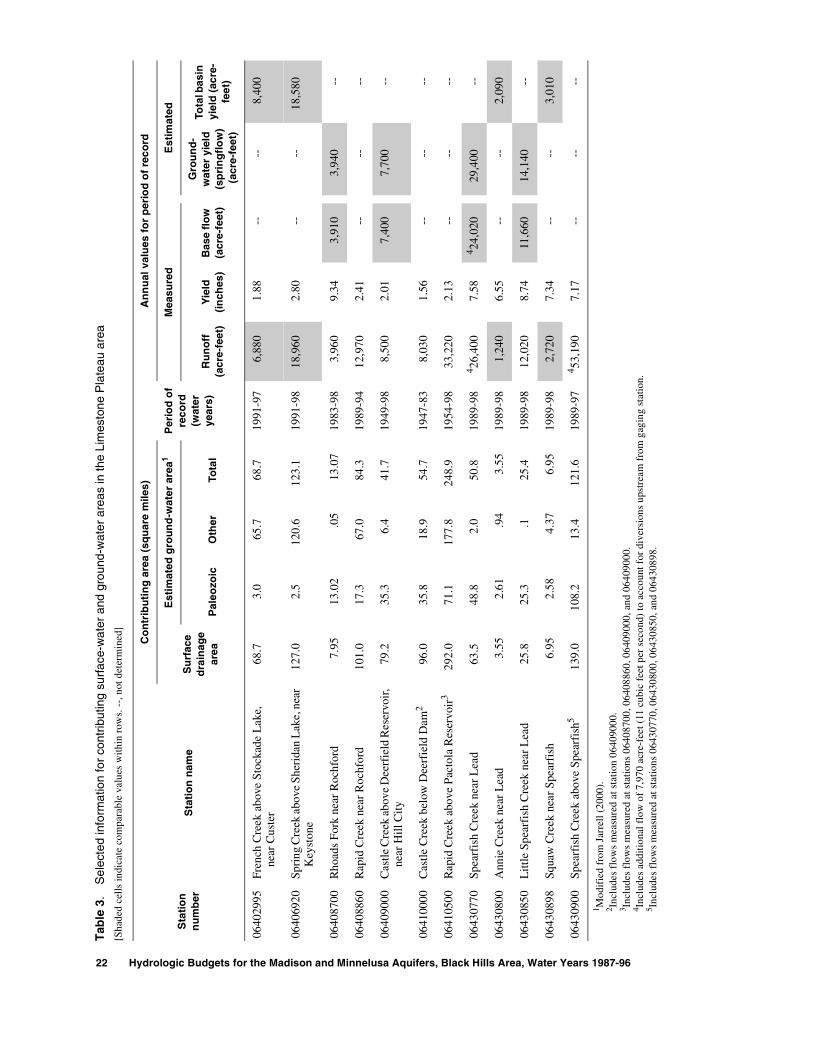
Annual yields for selected streamflow-gaging stations near the Limestone Plateau are shown in figure 11, which were used by Jarrrell (2000) to iden-tify apparent incongruences between contributing ground- and surface-water areas for several stations. Annual yields cannot be directly compared among the gaging stations because the period of records are not identical (table 3); however, it is especially apparent for stations 06408700 (Rhoads Fork) and 06409000 (Castle Creek above Deerfield Reservoir) that large differences in yield (9.34 and 2.01 inches, respectively) are not caused by climatic differences.
A variety of information is provided in table 3 that was considered and interpreted by Jarrell (2000) in delineating the ground-water divide (fig. 10) and in delineating contributing ground-water areas for gaging locations (fig. 12). The ground-water divide corre-sponds with the western extent of contributing ground-water areas for most of the gaging stations shown in figure 12. The ground-water divide coincides with the surface drainage area for French Creek (station 06402995). It is assumed that there is no easterly com-ponent for ground-water flow south of French Creek, because the drainage area for Red Canyon is dominated by outcrops of the Madison and Minnelusa Formations. For French Creek, the Paleozoic units comprise only 3.0 mi2 of the total contributing ground-water area (68.7 mi2), which is dominated by Precambrian rocks and is delineated as congruent with the surface drainage area.
North of French Creek, the contributing ground-water area for Spring Creek (station 06406920) is delineated as slightly smaller than the surface drainage. For Castle Creek (stations 06409000 and 06410000), a large part of the surface drainage is west of the ground-water divide. For Rhoads Fork (station 06408700), the contributing ground-water area is larger than the sur-face drainage; however, contributing ground-water areas are smaller than surface drainages for two down-stream stations on Rapid Creek (06408860 and 06410500).
For station 06430770 (Spearfish Creek near Lead), the contributing ground-water area is smaller
than the surface drainage, despite inclusion of a con-tributing ground-water area from the Rapid Creek basin. Much of the surface drainage for this station is west of the ground-water divide, and part of the basin contributes ground-water flow to station 06438500 (Little Spearfish Creek) to the north. No westerly com-ponent of ground-water flow is identified for areas north of this basin.
Jarrell (2000) considered a variety of hydrogeo-logic information in postulating the location of the ground-water divide (fig. 10) and delineating contrib-uting ground-water areas for gaging stations (fig. 12). Water-level information is too sparse for accurate potentiometric-surface mapping in the Limestone Plateau area (Strobel and others, 2000). Thus, informa-tion considered included structure contours, geologic structures, topography, spring locations, and measured spring discharges. Structural high points in the Dead-wood Formation were plotted along with major geo-logic structures (fig. 10). Jarrell (2000) assumed: (1) the Englewood Formation is the lower confining unit of the Madison aquifer; and (2) structural features of the underlying Deadwood Formation continued upward into the lower Madison Limestone and would influence flowpaths in the Madison aquifer, which is unconfined in this area. In some cases, topography and spring locations were used to aid in the delineation of small parts of the contributing ground-water areas.
Jarrell (2000) also compared estimated spring-flow (based on annual precipitation and yield effi-ciency) to computed base flow for selected gages. The base-flow component represents the amount of stream-flow that the aquifer contributes either directly (as sub-merged springs under the stream) or in the form of springs. The base-flow component for selected streams (table 3) was estimated using the BFI program as pre-viously described in the “Methods” section. A sum-mary of Jarrell’s (2000) comparisons is included in table 3.
Most estimates compare well with measured base-flow values in table 3, where shading is used to indicate comparable values within rows. Base-flow components are not identified for French Creek and Spring Creek (stations 06402995 and 06406920, respectively), which have only small areas comprised of Paleozoic rocks and for which contributing ground- and surface-water areas are roughly congruent. Corre-spondingly, estimated values for total basin yield (8,400 and 18,580 acre-feet, respectively) are similar to measured values (6,880 and 18,960 acre-feet).

Hydrologic Budgets 21
Lit
tle
Spea
rfis
h
Spea
rfis
h
Creek
Creek
CreekCastle
Castle
Cas
tle
Castle
Creek
CreekSp
ring
French
Creek
Creek
N. F
ork
S. Fork
N. Fork
S. Fork
Rapid
Rapid
Rapid
Rhoad
s Fork
Cre
ek
Cr
Squaw
Annie
Creek
Cr
Creek
Cre
ek
DeerfieldReservoir
PactolaReservoir
SheridanLake
StockadeLakeRed Canyon
Lead
Hill City
CUSTER
CheyenneCrossing
Rochford
LAWRENCE COUNTY
PENNINGTON COUNTY
CUSTER COUNTY
L I
M E
S T
O N
EP
L A
T E
A U
06430900(7.17)
06430898(7.34)
06430850(8.74)
06430800(6.55)
06430770(7.58)
06408700(1.56)
06408860(2.41) 06410500
(2.13)
06410000(1.56)
06409000(2.01)
06406920(2.80)
06402995(1.88)
06430900(7.17)
06430898(7.34)
06430850(8.74)
06430800(6.55)
06430770(7.58)
06408700(9.34)
06408860(2.41) 06410500
(2.13)
06410000(1.56)
06409000(2.01)
06406920(2.80)
06402995(1.88)
06430900(7.17)
OUTCROP OF MADISON LIMESTONE AND ENGLE- WOOD FORMATION (from Strobel and others, 1999)
OUTCROP OF MINNELUSA FORMATION (from Strobel and others, 1999)
OUTCROP OF DEADWOOD FORMATION (from Strobel and others, 1999)
STREAMFLOW GAGING STATION-- Number is station identification number. Number in parentheses is average annual basin yield in inches, for period of record indicated in table 3
SURFACE-WATER DRAINAGE BASIN
Base from U.S. Geological Survey digital data, 1:100,000, 1991Universal Transverse Mercator projection, zone 13
EXPLANATION
Figure 11. Locations of selected streamflow-gaging stations and associated surface-water drainage basins inLimestone Plateau area. Calculated basin yields, based on surface drainage areas, also are shown. Periodsof record for calculating yield are not consistent.
51 2 3 4 MILES
51 2 3 4 KILOMETERS0
0
44o15'
44o
43o45'
103o45'
104o
103o30'
22 Hydrologic Budgets for the Madison and Minnelusa Aquifers, Black Hills Area, Water Years 1987-96
Tab
le 3
.S
elec
ted
info
rmat
ion
for
cont
ribut
ing
surf
ace-
wat
er a
nd g
roun
d-w
ater
are
as in
the
Lim
esto
ne P
late
au a
rea
[Sha
ded
cell
s in
dica
te c
ompa
rabl
e va
lues
wit
hin
row
s. -
-, n
ot d
eter
min
ed]
Sta
tio
n
nu
mb
erS
tati
on
nam
e
Co
ntr
ibu
tin
g a
rea
(sq
uar
e m
iles)
Per
iod
of
reco
rd
(wat
er
year
s)
An
nu
al v
alu
es f
or
per
iod
of
reco
rd
Su
rfac
e d
rain
age
area
Est
imat
ed g
rou
nd
-wat
er a
rea1
Mea
sure
dE
stim
ated
Pal
eozo
icO
ther
Tota
lR
un
off
(acr
e-fe
et)
Yie
ld
(in
ches
)B
ase
flo
w
(acr
e-fe
et)
Gro
un
d-
wat
er y
ield
(sp
rin
gfl
ow
) (
acre
-fee
t)
Tota
l bas
in
yiel
d (
acre
-fe
et)
0640
2995
Fren
ch C
reek
abo
ve S
tock
ade
Lak
e,
near
Cus
ter
68.7
3.0
65.7
68.7
1991
-97
6,88
01.
88--
--8,
400
0640
6920
Spri
ng C
reek
abo
ve S
heri
dan
Lak
e, n
ear
Key
ston
e12
7.0
2.5
120.
612
3.1
1991
-98
18,9
602.
80--
--18
,580
0640
8700
Rho
ads
For
k ne
ar R
ochf
ord
7.95
13.0
2.0
513
.07
1983
-98
3,96
09.
343,
910
3,94
0--
0640
8860
Rap
id C
reek
nea
r R
ochf
ord
101.
017
.367
.084
.319
89-9
412
,970
2.41
----
--
0640
9000
Cas
tle
Cre
ek a
bove
Dee
rfie
ld R
eser
voir
, ne
ar H
ill C
ity
79.2
35.3
6.4
41.7
1949
-98
8,50
02.
017,
400
7,70
0--
0641
0000
Cas
tle
Cre
ek b
elow
Dee
rfie
ld D
am2
96.0
35.8
18.9
54.7
1947
-83
8,03
01.
56--
----
0641
0500
Rap
id C
reek
abo
ve P
acto
la R
eser
voir
329
2.0
71.1
177.
824
8.9
1954
-98
33,2
202.
13--
----
0643
0770
Spea
rfis
h C
reek
nea
r L
ead
63.5
48.8
2.0
50.8
1989
-98
4 26,4
007.
584 24
,020
29,4
00--
0643
0800
Ann
ie C
reek
nea
r L
ead
3.55
2.61
.94
3.55
1989
-98
1,24
06.
55--
--2,
090
0643
0850
Lit
tle
Spea
rfis
h C
reek
nea
r L
ead
25.8
25.3
.125
.419
89-9
812
,020
8.74
11,6
6014
,140
--
0643
0898
Squa
w C
reek
nea
r S
pear
fish
6.95
2.58
4.37
6.95
1989
-98
2,72
07.
34--
--3,
010
0643
0900
Spea
rfis
h C
reek
abo
ve S
pear
fish
513
9.0
108.
213
.412
1.6
1989
-97
4 53,1
907.
17--
----
1 Mod
ifie
d fr
om J
arre
ll (
2000
).2 In
clud
es f
low
s m
easu
red
at s
tati
on 0
6409
000.
3 Incl
udes
flo
ws
mea
sure
d at
sta
tion
s 06
4087
00, 0
6408
860,
064
0900
0, a
nd 0
6409
000.
4 Incl
udes
add
itio
nal f
low
of
7,97
0 ac
re-f
eet (
11 c
ubic
fee
t per
sec
ond)
to a
ccou
nt f
or d
iver
sion
s up
stre
am f
rom
gag
ing
stat
ion.
5 Incl
udes
flo
ws
mea
sure
d at
sta
tion
s 06
4307
70, 0
6430
800,
064
3085
0, a
nd 0
6430
898.

Hydrologic Budgets 23
Lit
tle
Spea
rfis
h
Spea
rfis
h
Creek
Creek
CreekCastle
Castle
Cas
tle
Castle
Creek
CreekSp
ring
French
Creek
Creek
N. F
ork
S. Fork
N. Fork
S. Fork
Rapid
Rapid
Rapid
Rhoad
s Fork
Cre
ek
Cr
Squaw
Annie
Creek
Cr
Creek
Cre
ek
DeerfieldReservoir
PactolaReservoir
SheridanLake
StockadeLakeRed Canyon
Lead
Hill City
CUSTER
CheyenneCrossing
Rochford
LAWRENCE COUNTY
PENNINGTON COUNTY
CUSTER COUNTY
L I
M E
S T
O N
EP
L A
T E
A U
06430900 06430898
06430850
06430800
06430770
06408700
0640886006410500
06410000
06409000
06406920
06402995
06430900 06430898
06430850
06430800
06430770
06408700
0640886006410500
06410000
06409000
06406920
06402995
06410500
EXPLANATION
Figure 12. Comparison between contributing surface-water areas and ground-water areas for gaging stations inLimestone Plateau area (from Jarrell, 2000).
51 2 3 4 MILES
51 2 3 4 KILOMETERS0
0
44o15'
44o
43o45'
103o45'
104o
103o30'
SURFACE-WATER DRAINAGE BASIN
OUTCROP OF MINNELUSA FORMATION, MADISON LIMESTONE, ENGLEWOOD FORMATION, AND DEADWOOD FORMATION
CONTRIBUTING GROUND-WATER AREAS--Color coding applies only to immediate subbasins
STREAMFLOW GAGING STATION-- Number is station identification number
French Creek above Stockade Lake (06402995)Spring Creek above Sheridan Lake (06406920)Rhoads Fork near Rochford (06408700)Rapid Creek near Rochford (06408860)
Castle Creek above Deerfield Reservoir (06409000)
Castle Creek below Deerfield Dam (06410000)Rapid Creek above Pactola Reservoir (06410500)
Spearfish Creek near Lead (06430770)Annie Creek near Lead (06430800)
Little Spearfish Creek near Lead (06430850)Squaw Creek near Spearfish (06430898)
Spearfish Creek above Spearfish (06430900)
Base from U.S. Geological Survey digital data, 1:100,000, 1991Universal Transverse Mercator projection, zone 13

24 Hydrologic Budgets for the Madison and Minnelusa Aquifers, Black Hills Area, Water Years 1987-96
For Rhoads Fork (06408700) and Castle Creek (06409000), estimates of ground-water yield (based on recharge estimates) compare favorably with base-flow components for measured streamflow. Comparisons for Spearfish Creek (06430770) and Little Spearfish Creek (06430850) are less favorable and probably are heavily influenced by storage effects and short periods of record. The estimated yield for Squaw Creek (06430898) compares favorably with measured yield; however, values for Annie Creek (06430800) compare less favorably, which Carter and others (2001) attrib-uted to consumptive uses for mining activities within the basin. No comparisons are made for stations 06408860, 06410000, 06410500, and 06430900, which are influenced by regulation or short periods of record.
Artesian Springflow
Artesian springflow is considered to be that which originates from confined aquifers around the periphery of the Black Hills. Artesian springs occur in locations downgradient from streamflow-loss zones, most commonly within or near the outcrop of the Spearfish Formation, and originate, at least partially, from the Madison and or Minnelusa aquifers (Naus and others, in press). Other springs, such as Cleg-horn/Jackson Springs, occur within the outcrop of the Minnelusa Formation, where the Madison aquifer is confined by the Minnelusa Formation. Most estimates of artesian springflow are derived from streamflow records. Gaging sites used in estimating artesian springflow are shown in figure 13, and selected site information is presented in table 4.
A summary of estimated annual artesian spring-flow for 1987-96 is presented in table 5. The sum of artesian springflow averages about 189 ft3/s and ranges from about 163 ft3/s in 1989 to about 246 ft3/s in 1996. Discharges from the individual artesian springs were estimated using a variety of methods. Details regarding individual springs follow.
For some streams that are dominated by artesian springflow, the springflow component is determined by applying the BFI program to measured daily flows, as described in the “Methods” section. This was done for 1991-96 for Stockade Beaver Creek (site 1) and Beaver Creek (site 4), which is the period of record for both, and for 1987-96 for Fall River (site 3). For the period of record, spring discharges account for about 90 percent of the flow of Stockade Beaver Creek and 97 percent of the flow of both Fall River and Beaver Creek (table 5). Springflow for 1987-90 for Stockade Beaver Creek is estimated as 9.0 ft3/s, which is similar
to measured values for 1991-93. For Beaver Creek, springflow is estimated as 10.0 ft3/s for 1987-88 and 9.0 ft3/s for 1989-90, based on comparisons with measured flows for station 06402500, which is located several miles downstream from site 4.
Measured flows for Cascade Springs (site 2, station 06400497) for 1987-95 (table 4) were assumed to consist entirely of artesian springflow. Additional flow of 4.0 ft3/s was estimated for Cool Spring (site 22) and other springs downstream from station 06400497 based on miscellaneous streamflow measurements (U.S. Geological Survey, 1996, 1997).
Streamflow in Battle Creek at station 06406000 (site 7) is influenced by a series of upstream springs, including springs along Grace Coolidge Creek (fig. 13). The springs along Battle Creek are located within the outcrop of the Minnelusa Formation and the springs along Grace Coolidge Creek are located down-stream from the outcrop of the Minnelusa Formation. Streamflow at site 7 also is influenced by streamflow losses along Battle Creek and Grace Coolidge Creek, as well as by inflows from various other tributaries. Thus, artesian springflow for Battle Creek (site 7) was estimated by applying the BFI program only for periods when streamflows in Battle Creek at station 06404000 (site 5) and Grace Coolidge Creek at station 06404998 (site 6) were less than loss thresholds deter-mined by Hortness and Driscoll (1998). Hence, only periods when there was no flow downgradient of stream loss zones were considered, with results extrap-olated to obtain annual estimates. Estimated artesian springflow for Battle Creek averaged 7.0 ft3/s for 1987-96 (table 5), with large variability in annual springflow.
Several artesian springs in the Rapid City area contribute to the flow of Rapid Creek. Anderson and others (1998) estimated combined springflow from Cleghorn (site 21) and Jackson Springs as 21.6 ft3/s for 1988-89, which was assumed to be representative for 1987-96. Additional artesian springflow along Rapid Creek is estimated to average 4.3 ft3/s. Springflow from City Springs (site 20) was measured at station 06413650 (site 8) for 1988-96. Measured flow (1988-90) of the Deadwood Avenue Drain (site 9, station 06413800) also is dominated by artesian spring-flow, and minor additional springflow occurs in a drainage immediately to the east. Annual springflow for all of these sites is estimated as 4.0 ft3/s for 1987-94, with slightly higher estimates for 1995-96, based on measured flow at station 06413650 (site 8).

Hydrologic Budgets 25
Creek
Creek
Cr
Bea
ver
Cre
ek
Cold
Springs
Sand
Beaver
Stoc
kade
N. F
orkR
apidC
r
Belle FourcheReservoir
FOURCHE
VictoriaSpring
Coolidge
AngosturaReservoir
Castl eC
r
N. Fork Castle Cr
BearG
ulch
Creek
Crow
SheridanLake
DeerfieldReservoir
PactolaReservoir
IndianCr
Horse
Creek
OwlCreek
BELLE
RIVER
REDWATER R I VE
R
Cre
ek
Cr
Lit
tle
Spea
rfis
h
Spea
rfis
h
Whi
tewoo
d
Cre
ek
Creek
Bear
Butte
Elk
Elk
Creek
Creek
Creek
Boxelder
Rapid
Rapid
Creek
CreekCreek
Spri
ng
Creek
French
Creek
Creek
CreekG
race
Creek
Creek
Cre
ek
S. Fork
S. Fork Rapid Cr
Battle
French
Beaver
Creek
Creek
Creek
FallR
Hat
Cre
ek
Creek
Horsehead
CHEYENNE
RIVER
Cot
tonw
ood
CreekHay
Bot
tom
False
Creek
Spokane
Lame
Johnny
Hig
gins
Bea
ver
Cre
ek
Robison
Squaw
Whi
teta
il
Cr
Cr
Cr
Gulch
Gulch
Annie
Iron Cr
Elk
Little
Creek
Castle
Cas
tleCreek
C reek
Bear Gulch
Whitewood
Spearfish
SaintOnge
DEADWOOD
Lead
BELLE FOURCHE
Newell
STURGIS
Blackhawk
Piedmont
Tilford
Box Elder
RAPID CITY
Hill City
Hermosa
CUSTER
HOT SPRINGS
Edgemont
Galena
Tinton CentralCity
Maurice
Savoy
Roubaix
Nemo
Hayward
Keystone
Deerfield
Pringle
Fairburn
Buffalo Gap
Wind CaveNational Park
CUSTER
STATE
PARK
WindCave
HarneyPeak x
EllsworthAir ForceBase
BUTTE CO
LAWRENCE CO MEADE CO
PENNINGTON CO
CUSTER CO
FALL RIVER CO
WY
OM
ING
SO
UT
H
DA
KO
TA
Figure 13. Locations of gaging sites used for estimation of artesian springflow.
L I
M E
S T
O N
EP
L A
T E
A U
1
2
3
5
6
4
7
89
10 11
12
13
14
1516
17
18
19
20
21
22
1
2
3
5
6
4
7
89
10 11
12
13
14
1516
17
18
19
20
21
22
0 10 20
0 10 20 MILES
KILOMETERSBase modified from U.S. Geological Survey digital data, 1:100,000Rapid City, Office of City Engineer map, 1:18,000, 1996Universal Transverse Mercator projection, zone 13
OUTCROP OF MADISON LIMESTONE (from Strobel and others, 1999)
OUTCROP OF MINNELUSA FORMATION (from Strobel and others, 1999)
104o 45' 103o30'
15' 103o
30'
44o45'
15'
44o
45'
30'
43o15'
EXPLANATION
STREAMFLOW-GAGING STATION USED TO ESTIMATE DISCHARGE AT ARTESIAN SPRINGS-- Number is site number on table 4
10
MISCELLANEOUS SITE USED TO ESTIMATE DISCHARGE AT ARTESIAN SPRINGS-- Number is site number on table 4
20

26 Hydrologic Budgets for the Madison and Minnelusa Aquifers, Black Hills Area, Water Years 1987-96
Table 4. Selected site information for gaging stations and miscellaneous-record sites used to estimate artesian springflow
[--, not applicable]
Site number(fig. 13)
Stationidentification
numberLocal number Name Latitude Longitude
Elevation(feet
abovesea level)
Period of record
considered
Gaging Stations
1 06392950 45N60W19DC Stockade Beaver Creek near Newcastle, Wyo.
435132 1040624 4,460 1991-97
2 06400497 8S5E20CDAB Cascade Springs near Hot Springs 432010 1033307 3,440 1987-95
3 06402000 7S5E24BB Fall River at Hot Springs 432550 1032833 3,413 1987-97
4 06402470 6S6E14CDB Beaver Creek above Buffalo Gap 433120 1032123 3,460 1991-97
5 06404000 2S7E18CC Battle Creek near Keystone 435221 1032010 3,800 1987-97
6 06404998 3S7E17DCDD Grace Coolidge Creek near Game Lodge, near Custer
434540 1032149 4,100 1987-97
7 06406000 2S8E32CCA Battle Creek at Hermosa 434941 1031144 3,290 1987-97
8 06413650 1N7E3BCD Lime Creek at mouth, Rapid City 440430 1031600 3,286 1987-97
9 06413800 2N7E34DDC Deadwood Avenue Drain at mouth,at Rapid City
440458 1031522 3,206 1988-90
10 06422500 2N5E12DD Boxelder Creek near Nemo 440838 1032716 4,320 1966-97
11 06423010 2N7E17DB Boxelder Creek near Rapid City 440754 1031754 3,450 1987-97
12 06424000 4N4E23AD Elk Creek near Roubaix 441741 1033547 4,881 1991-97
13 06425100 3N8E9AA Elk Creek near Rapid City 441425 1030903 2,950 1987-97
14 06429905 52N60W18C Sand Creek near Ranch A, near Beulah, Wyo.
443107 1040457 3,580 1992-97
15 06430532 7N1E16BDB Crow Creek near Beulah, Wyo. 443414 1040019 3,355 1992-97
16 06430540 7N1E16DADC Cox Lake outlet near Beulah, Wyo. 443356 1035937 3,415 1991-95
17 06431500 6N2E15BD Spearfish Creek at Spearfish 442857 1035140 3,640 1987-97
18 06432020 7N2E8DAC Spearfish Creek below Spearfish 443448 1035337 3,280 1989-97
19 06433000 8N2E11DB Redwater River above Belle Fourche 444002 1035020 3,000 1987-97
Miscellaneous Sites
20 440525103173701 2N7E32ADDA2 City Springs 440525 1031737 3,460 --
21 440327103180503 1N7E8DBBD Cleghorn Springs 440331 1031801 3,385 --
22 432028103331601 8S5E20BDCB Cool Spring 432028 1033316 3,450 --

Hydrologic Budgets 27
Table 5. Springflow estimates for streams with artesian springs
[Base-flow indices (where applicable) given as percentage of average annual streamflow; all other values given in cubic feet per second; --, no data or not determined; e, estimated; POR, period of record]
Water year
Stockade Beaver Creek(06392950)
Cascade Springs (06400497)
Other springs near
Cascade
Fall River (06402000)
Beaver Creek(06402470)
Stream-flow
Spring-flow
Spring-flow
Spring-flow
Stream-flow
Spring-flow
Stream-flow
Spring-flow
1987 -- 9.0e 21.3 4.0e 21.8 20.1 -- 10.0e
1988 -- 9.0e 19.6 4.0e 21.3 20.5 -- 10.0e
1989 -- 9.0e 18.3 4.0e 21.5 20.8 -- 9.0e
1990 -- 9.0e 18.8 4.0e 21.9 21.3 -- 9.0e
1991 9.8 8.8 18.4 4.0e 21.2 20.7 8.2 8.1
1992 9.8 8.9 17.8 4.0e 21.7 21.1 8.1 8.0
1993 10.4 9.1 16.3 4.0e 22.3 21.8 9.2 9.1
1994 10.4 9.7 18.4 4.0e 21.8 21.6 9.7 9.5
1995 12.2 11.8 19.0 4.0e 23.7 23.3 13.7 12.5
1996 13.4 11.3 19.3e 4.0e 24.5 24.2 11.3 11.1
Mean(1987-96)
-- 9.6 18.7 4.0e -- 21.5 -- 9.6
Base-flow index (POR)
.90 -- -- .97 -- .97 --
Water year
Battle Creek(06406000)
Jackson and
Cleghorn Springs
Other Rapid Creek
springs
Boxelder Creek
(06422500 and
06423010)
Elk Creek (06424000
and 06425100)
Redwater River (06433000)
Sum ofartesianspring-
flowStream-
flowSpring-
flowSpring-
flowSpring-
flowSpring-
flowSpring-
flowStream-
flowSpring-
flow
1987 7.8 6.2 21.6e 4.0e 0.0 1.6 123 101.8 199.6
1988 2.7 2.4 21.6 4.0e .0 .3 93.9 94.8 186.2
1989 1.6 1.2 21.6 4.0e .0 .0 95.1 75.5 163.4
1990 6.9 1.6 21.6e 4.0e .0 .0 93.3 78.8 168.1
1991 23.0 3.5 21.6e 4.0e .0 .1 91.8 81.4 170.6
1992 5.2 4.5 21.6e 4.0e .0 .0 79.1 76.0 165.9
1993 26.1 7.1 21.6e 4.0e .2 .1 127 80.6 173.9
1994 11.7 10.8 21.6e 4.0e .0 .4 124 93.6 193.6
1995 52.6 11.3 21.6e 5.0e .5 8.6 240 103.9 221.5
1996 32.2 21.0 21.6e 6.0e 2.5 8.2 222 116.7 245.9
Mean(1987-96)
-- 7.0 21.6 4.3 .3 1.9 -- 90.3 188.9
Base-flow index (POR)
-- -- -- -- -- -- -- -- --

28 Hydrologic Budgets for the Madison and Minnelusa Aquifers, Black Hills Area, Water Years 1987-96
Several springs are located within outcrops of the Madison Limestone and Minnelusa Formation along Boxelder Creek (Rahn and Gries, 1973) between sites 10 and 11 (fig. 13). Artesian conditions probably do not occur in most of this reach, where streamflow losses typically occur. Artesian springflow probably occurs occasionally at the lower end of the reach, how-ever, just upstream from site 11. Artesian springflow for Boxelder Creek (site 11) was estimated by applying the BFI program for periods when streamflow at site 10 was less than the loss threshold determined by Hortness and Driscoll (1998).
Highly variable artesian springflow occurs along Elk Creek, primarily in a short reach just upstream from the confluence with Little Elk Creek (fig. 13). Artesian springflow during 1991-96 was estimated by applying the BFI program for site 13 for periods when streamflow at site 12 was less than the loss threshold determined by Hortness and Driscoll (1998). Stream-flow records for site 12 are not available prior to 1991 (table 4); thus, the BFI program was used directly for 1987-90.
The Redwater River, which is measured at site 19 (fig. 13), often consists primarily of flow from a number of large artesian springs. Streamflow in the Redwater River also is influenced by surface runoff, as well as extensive diversions during the irrigation season. Continuous flow records are available for several spring areas contributing to the Redwater River; however, available records are insufficient to quantify all contributing artesian springflow. Thus, combined springflow of all artesian springs contrib-uting to the Redwater River is estimated. Monthly differences in streamflow between sites 17 and 19 are presented in table 6. Artesian springflow for each year is assumed equal to the median of values for November through February, when effects of irrigation diversions and surface runoff generally are minimal. Thus, mean artesian springflow contributing to Redwater River for 1987-96 is estimated as 90.3 ft3/s, which includes springflow that occurs along Spearfish Creek, down-stream from site 17.
Estimated artesian springflow that occurs along Spearfish Creek in the reach between sites 17 and 18 also is shown in table 6. Extensive irrigation diver-sions also occur in this reach; thus, an approach similar to that for the Redwater River was used to estimate springflow. Artesian springflow for each year is assumed equal to the median of monthly differences in
streamflow between sites 17 and 18 for November through February.
Springflow for several other individual artesian spring reaches contributing to Redwater River are quantified for years for which streamflow records are available (table 7). Measured annual streamflow values for Sand Creek (site 14), Crow Creek (site 15), and Cox Lake (site 16) are shown in table 7, along with estimated springflow derived using the BFI program.
Springflow from individual spring reaches con-tributing to Redwater River is summed in table 7 for 1992-96. Springflow for Cox Lake has little vari-ability; thus, springflow for 1996 was assumed equal to previous years. Variability for the other sites generally is similar to that of Redwater River. For 1992-96, total artesian springflow for Redwater River is estimated as 94.2 ft3/s, of which 69.2 ft3/s (about 73 percent) can be attributed to the individual sources listed in table 7. Estimates of unmeasured springflow contributing to the flow of Redwater River for these years range from about 16 to 34 ft3/s.
Well Withdrawals
Withdrawals from the Madison and Minnelusa aquifers in the Black Hills area serve many categories of water use including municipal, self supply (domestic), irrigation, livestock, industrial, mining, thermoelectric power, and unaccounted withdrawals. Estimated withdrawals for these categories of water use are presented in table 8, with total withdrawals from the Madison and Minnelusa aquifers for 1987-96 estimated as about 18.3 Mgal/d, which is equivalent to about 28 ft3/s. Municipal use, with combined with-drawals of about 6.5 Mgal/d, is the largest use category (fig. 14). The largest use occurs within Pennington County, which averages about 3.1 Mgal/d and is domi-nated by municipal usage.
Most estimates in table 8 are based on 1995 water-use data (Amundson, 1998) compiled for the entire counties included in the study area. Therefore, well withdrawals probably are slightly overestimated; however, most of the demand within these counties does occur within the study area. Withdrawals in Wyoming are small and are not estimated. Annual esti-mates for Rapid City municipal withdrawals in Pen-nington County and for irrigation withdrawals are used in developing the 1987-96 estimates, as discussed in the following paragraphs.

Hydrologic Budgets 29
Tab
le 6
.S
trea
mflo
w a
naly
sis
and
estim
ated
art
esia
n sp
ringf
low
for
Red
wat
er R
iver
and
Spe
arfis
h C
reek
[All
val
ues
in c
ubic
fee
t per
sec
ond.
Sha
ded
cell
s sh
ow m
onth
s fo
r w
hich
med
ian
flow
is u
sed
as e
stim
ate
of a
nnua
l spr
ingf
low
. --
, not
com
pute
d]
Wat
er y
ear
OC
TN
OV
DE
CJA
NF
EB
MA
RA
PR
MA
YJU
NJU
LA
UG
SE
PE
stim
ated
sp
rin
gfl
ow
1
Mon
thly
dif
fere
nce
in s
trea
mfl
ow b
etw
een
Red
wat
er R
iver
(06
4330
00)
and
Spea
rfis
h C
reek
at
Spea
rfis
h (0
6431
500)
1987
109.
312
7.9
112.
391
.288
.410
7.4
122.
811
3.0
40.1
-20.
527
.877
.510
1.8
1988
91.9
114.
097
.781
.191
.911
5.5
91.0
53.6
-35.
4-3
2.6
-25.
7-.
994
.8
1989
83.0
95.1
82.6
67.5
68.4
90.6
95.0
99.5
3.3
-31.
5-3
1.0
21.7
75.5
1990
95.8
86.3
73.2
76.1
81.5
85.9
77.2
94.7
10.9
-30.
1-2
5.5
-7.5
78.8
1991
63.5
95.5
86.0
73.2
76.7
90.2
84.4
40.2
53.7
-34.
6-2
9.5
19.1
81.4
1992
60.9
85.2
75.4
76.5
70.8
69.0
75.5
-28.
7-1
3.9
-3.6
-15.
332
.676
.0
1993
87.9
104.
896
.364
.860
.311
9.5
90.9
115.
012
8.3
81.9
12.1
33.6
80.6
1994
59.2
85.3
104.
688
.998
.213
8.6
126.
115
1.1
4.1
-18.
5-1
8.0
14.0
93.6
1995
101.
710
1.9
84.3
105.
812
4.2
99.6
94.3
719.
029
9.0
92.1
19.7
51.0
103.
9
1996
131.
711
5.2
106.
211
8.2
214.
420
7.5
187.
825
1.0
232.
021
.426
.993
.211
6.7
Mea
n (1
987-
96)
----
----
----
----
----
----
90.3
Mon
thly
dif
fere
nce
in s
trea
mfl
ow b
etw
een
Spea
rfis
h C
reek
at S
pear
fish
(064
3150
0) a
nd S
pear
fish
Cre
ek b
elow
Spe
arfi
sh (
0643
2020
)
1989
9.5
16.6
11.1
11.9
4.5
14.8
11.9
-9.5
-12.
9-2
9.6
-33.
4-8
.811
.5
1990
11.4
11.2
2.5
12.8
10.7
8.2
-1.1
-0.7
-13.
6-3
0.7
-28.
6-1
4.1
11.0
1991
2.2
10.4
2.5
-2.8
10.4
8.7
8.5
11.8
3.9
-31.
3-2
5.6
-5.1
6.5
1992
1.8
12.8
6.9
2.1
2.3
10.2
1.7
-27.
3-2
1.8
-16.
9-1
8.7
-0.5
4.6
1993
6.8
14.6
7.1
4.2
9.6
13.9
7.3
5.0
6.2
8.4
-1.5
0.7
8.4
1994
7.9
9.2
13.6
15.2
12.7
10.6
-4.1
-3.4
-27.
4-2
9.4
-26.
3-1
4.5
13.2
1995
12.6
17.6
13.5
5.4
6.7
9.9
18.0
25.0
51.0
14.4
-10.
2-4
.210
.1
1996
14.9
14.5
8.0
14.2
16.6
14.7
22.8
20.0
19.0
-5.2
-15.
63.
114
.4
Mea
n (1
989-
96)
----
----
----
----
----
----
8.0
1 Est
imat
ed u
sing
med
ian
diff
eren
ce f
or m
onth
s of
Nov
embe
r th
roug
h Fe
brua
ry.

30 Hydrologic Budgets for the Madison and Minnelusa Aquifers, Black Hills Area, Water Years 1987-96
Table 7. Springflow for artesian springs or spring reaches along tributaries to Redwater River
[Base-flow indices (where applicable) given as a percentage of average annual streamflow, all other values given in cubic feet per second; --, no data or not determined; e, estimated]
Water year
Sand Creek (06429905)
Crow Creek(06430532)
Cox Lake (06430540)
Spearfish Creek
(06431500 and
06432020)
Sub-total
Redwater River1
(06433000)Un-
measured spring-flow2
Stream-flow
Spring-flow
Stream-flow
Spring-flow
Stream-flow
Spring-flow
Spring-flow
Spring-flow
Spring-flow
1987 -- -- -- -- -- -- -- -- 101.8 --
1988 -- -- -- -- -- -- -- -- 94.8 --
1989 -- -- -- -- -- -- 11.5 -- 75.5 --
1990 -- -- -- -- -- -- 11.0 -- 78.8 --
1991 -- -- -- -- 4.3 4.2 6.5 -- 81.4 --
1992 15.7 15.0 33.3 32.8 4.2 4.2 4.6 56.6 76.0 19.4
1993 16.4 15.6 37.4 36.0 4.2 4.2 8.4 64.2 80.6 16.4
1994 17.2 16.4 37.8 36.0 4.2 4.2 13.2 69.8 93.6 23.8
1995 23.2 22.1 42.9 36.1 4.3 4.2 10.1 72.5 103.9 31.4
1996 24.3 23.1 44.5 41.3 -- 4.2e 14.4 83.0 116.7 33.7
Mean (1992-96) -- 18.4 -- 36.4 -- 4.2 10.1 69.2 94.2 24.9
Base-flow index(period of record)
.95 -- .93 -- .99 -- -- -- -- --
1From table 6.2Calculated as Redwater River springflow minus subtotal.

Hydrologic Budgets 31
Table 8. Estimated well withdrawals from the Madison and Minnelusa aquifers in the Black Hills area, water years 1987-96
Aquifer
Average annual water use, in thousands of gallons per day
CountyTotal
Butte Custer Fall River Lawrence Meade Pennington
Municipal
Madison 723.0 0.0 666.0 1,436.0 284.0 2,537.6 5,646.6
Minnelusa .0 .0 .0 .0 284.0 575.7 859.7
Total 723.0 .0 666.0 1,436.0 568.0 3,113.3 6,506.3
Self-supply Domestic
Madison 2.1 5.2 2.9 45.9 54.1 98.6 208.8
Minnelusa 8.4 24.1 38.5 109.8 353.0 186.9 720.7
Total 10.5 29.3 41.4 155.7 407.1 285.5 929.5
Irrigation
Madison 480.2 .0 2.8 107.9 12.7 51.3 654.9
Minnelusa 610.5 9.3 48.1 1,573.5 31.4 10.7 2,283.5
Total 1,090.7 9.3 50.9 1,681.4 44.1 62.0 2,938.4
Livestock Watering
Madison 9.6 6.2 1.2 7.3 2.4 11.9 38.6
Minnelusa 33.9 20.1 8.4 51.0 13.4 16.2 143.0
Total 43.5 26.3 9.6 58.3 15.8 28.1 181.6
Industrial
Madison .0 .0 .0 52.0 .0 .0 52.0
Minnelusa .0 4.0 .0 .0 19.0 901.0 924.0
Total .0 4.0 .0 52.0 19.0 901.0 976.0
Mining
Madison .0 .0 210.0 25.0 .0 .0 235.0
Minnelusa .0 .0 .0 107.0 .0 941.0 1,048.0
Total .0 .0 210.0 132.0 .0 941.0 1,283.0
Thermoelectric
Madison .0 .0 .0 .0 .0 320.0 320.0
Minnelusa .0 .0 .0 .0 .0 120.0 120.0
Total .0 .0 .0 .0 .0 440.0 440.0
Subtotal
Madison 1,214.9 11.4 882.9 1,674.1 637.2 3,019.4 7,439.9
Minnelusa 652.8 57.5 95.0 1,841.3 416.8 2,751.5 5,814.9
Total 1,867.7 68.9 977.9 3,515.4 1,054.0 5,770.9 13,254.8
Unaccounted Withdrawals
Madison 2,000.0 2.9 220.7 418.5 159.3 754.9 3,556.3
Minnelusa 163.2 14.4 23.8 460.3 104.2 687.9 1,453.7
Total 2,163.2 17.3 244.5 878.9 263.5 1,442.7 5,010.0
Total
Madison 3,214.9 14.3 1,103.6 2,092.6 796.5 3,774.3 10,990.2
Minnelusa 816.0 71.9 118.8 2,301.6 521.0 3,439.4 7,268.6
Total 4,030.9 86.1 1,222.4 4,394.3 1,317.5 7,213.6 18,264.8

32 Hydrologic Budgets for the Madison and Minnelusa Aquifers, Black Hills Area, Water Years 1987-96
Figure 14. Pie chart showing percentages of use from the Madison and Minnelusa aquifers, by category, forSouth Dakota counties in the Black Hills area.
Municipal35.8%Self-supply
5.1%
Irrigation15.7%
Livestock1.0%
Industrial5.4%
Mining7.1% Thermoelectric
2.4%
Unaccounted27.5%
Municipalities that use the Madison and Min-nelusa aquifers to some degree to supply water for their customers include Belle Fourche, Box Elder, Edge-mont, Hot Springs, Rapid City, Spearfish, Sturgis, and Whitewood (table 9). Rapid City, which used an average of about 2.9 Mgal/d from the Madison and Minnelusa aquifers during 1987-96, is the largest user.
Withdrawals for municipal purposes in Rapid City have increased steadily since increased develop-ment of the Madison aquifer began in the early 1990’s. Thus, the average withdrawal for 1987-96 (table 8) is calculated from annual withdrawals, which are used in the subsequent budgets for subareas. In table 8, it was assumed that 80 percent of the municipal withdrawals in Rapid City are from the Madison aquifer and 20 percent are from the Minnelusa aquifer. Municipal withdrawals from the Madison and Minnelusa aquifers in other communities also may have been less than the 1995 withdrawals used for budgeting purposes; how-ever, the difference is assumed to be small in compar-ison to the difference for Rapid City. The average municipal water use rate (1987-96) from the Madison and Minnelusa aquifers is about 6,506,300 gal/d (10.07 ft3/s).
Self-supply water use includes all withdrawals for domestic use that are not supplied by municipalities.
Total self-supply ground-water withdrawals are avail-able for 1995 by county, but not by aquifer. To estimate the percent of total ground-water withdrawals from the Madison and Minnelusa aquifers, data on domestic wells in the six-county area were compiled from the USGS Ground-Water Site Inventory (GWSI) database. The percentages of wells completed in the Madison and Minnelusa aquifers were applied to the total ground-water withdrawals to apportion self-supply use (table 10). The estimated total withdrawal from the Madison and Minnelusa aquifers for domestic purposes from self-supply wells is 929,500 gal/d (1.44 ft3/s).
Irrigation water use includes all water artificially applied to farms, orchards, and horticultural crops. Data on irrigation withdrawals from the Madison and Minnelusa aquifers were compiled from the USGS Site-Specific Water-Use Data System (SWUDS) for the period of record (1981-98) for counties in the study area (table 11). Over three times as much water is used from the Minnelusa aquifer than the Madison aquifer for irrigation. Irrigation water use varies from year to year depending on precipitation conditions, and aver-aged 2,938,400 gal/d (4.48 ft3/s) from 1987-96. The largest irrigation withdrawals occur in Lawrence and Butte Counties for the Minnelusa aquifer, and in Butte County for the Madison aquifer (table 11).

Hydrologic Budgets 33
Table 9. Estimated water use from the Madison and Minnelusa aquifers by incorporated municipalities in the Black Hills area, 1995
Municipality Population AquiferAnnual use
(million gallons)Average daily use(thousand gallons)
Belle Fourche 5,168 Madison 263.895 1723.0
Box Elder 3,133 Madison 85.775 1235.0
Edgemont 907 Madison 46.355 1127.0
Hot Springs 4,277 Madison 196.735 1539.0
Rapid City 59,373 Madison/Minnelusa 21,050.598 2,878.3
Spearfish 7,747 Madison 469.380 11,286.0
Sturgis 5,570 Madison/Minnelusa 207.320 1568.0
Whitewood 987 Madison 354.750 150.0
Total 87,162 Madison/Minnelusa 2,374.800 6,506.3
1Joe Lyons, U.S. Bureau of Reclamation, written commun., 1999.2John Wagner, Rapid City Water Department, written commun, 2000. Annual and daily use are averages for 1987-96.3Dave Mikkelson, City of Whitewood, oral commun., 2000.
Table 10. Percentages of wells, by aquifer, used to estimate domestic and livestock uses
[--, not applicable]
County Population
Totalground-water use(thousand gallons
per day)
Percentage of wells, by aquifer
Madison Minnelusa Other
Self-supplied Domestic
Butte 1,120 90 2.3 9.3 88.4
Custer 4,100 290 1.8 8.3 89.9
Fall River 1,950 140 2.1 27.5 70.4
Lawrence 7,940 560 8.2 19.6 72.2
Meade 16,400 1,230 4.4 28.7 66.9
Pennington 16,050 1,280 7.7 14.6 77.7
Totals 47,560 3,590 -- -- --
Livestock Watering
Butte -- 320 3.0 10.6 86.4
Custer -- 110 5.6 18.3 76.1
Fall River -- 240 0.5 3.5 96.0
Lawrence -- 170 4.3 30.0 65.7
Meade -- 480 0.5 2.8 96.7
Pennington -- 270 4.4 6.0 89.6
Totals -- 1,590 -- -- --

34 Hydrologic Budgets for the Madison and Minnelusa Aquifers, Black Hills Area, Water Years 1987-96
Tab
le 1
1.E
stim
ated
irrig
atio
n w
ithdr
awal
s fr
om th
e M
adis
on a
nd M
inne
lusa
aqu
ifers
in th
e B
lack
Hill
s ar
ea, w
ater
yea
rs 1
981-
98
[All
val
ues
in a
cre-
feet
, unl
ess
othe
rwis
e in
dica
ted.
acr
e-ft
, acr
e-fe
et; g
al/d
, gal
lons
per
day
]
Wat
er y
ear
Mad
iso
n a
qu
ifer
Min
nel
usa
aq
uif
erC
om
bin
ed M
inn
elu
sa a
nd
Mad
iso
n a
qu
ifer
s
Bu
tte
Cu
ster
Fal
l R
iver
Law
-re
nce
Mea
de
Pen
-n
ing
ton
Tota
lB
utt
eC
ust
erF
all
Riv
erL
aw-
ren
ceM
ead
eP
en-
nin
gto
nTo
tal
Bu
tte
Cu
ster
Fal
l R
iver
Law
-re
nce
Mea
de
Pen
-n
ing
ton
Tota
l
1981
972.
90.
00.
012
1.1
0.0
0.0
1,09
3.9
837.
52.
620
.42,
047.
60.
049
.32,
957.
31,
810.
32.
620
.42,
168.
60.
049
.34,
051.
2
1982
473.
6.0
.072
.9.0
.054
6.5
749.
0.0
50.9
782.
12.
920
.01,
604.
91,
222.
6.0
50.9
855.
02.
920
.02,
151.
4
1983
543.
0.0
.0.0
.0.0
543.
083
2.7
.565
.13,
508.
2.0
48.8
4,45
5.3
1,37
5.7
.565
.13,
508.
2.0
48.8
4,99
8.3
1984
626.
0.0
.0.0
.0.0
626.
095
6.0
111.
076
.02,
575.
163
.0.0
3,78
1.1
1,58
2.0
111.
076
.02,
575.
163
.0.0
4,40
7.1
1985
859.
6.0
.0.0
.0.0
859.
61,
152.
017
.786
.72,
840.
266
.0.0
4,16
2.6
2,01
1.6
17.7
86.7
2,84
0.2
66.0
.05,
022.
2
1986
300.
6.0
.0.0
.0.0
300.
649
0.0
21.0
32.0
2,11
7.8
59.0
.32,
720.
179
0.6
21.0
32.0
2,11
7.8
59.0
.33,
020.
6
1987
272.
9.0
31.0
119.
0.0
.042
2.9
1,00
6.0
20.1
20.6
1,82
5.0
67.0
7.1
2,94
5.8
1,27
8.9
20.1
51.6
1,94
4.0
67.0
7.1
3,36
8.7
1988
860.
9.0
.018
2.4
.0.0
1,04
3.3
1,20
4.7
17.8
43.4
2,59
1.1
48.8
12.7
3,91
8.5
2,06
5.6
17.8
43.4
2,77
3.5
48.8
12.7
4,96
1.8
1989
858.
4.0
.015
2.0
.0.0
1,01
0.4
1,02
1.0
13.0
47.8
1,85
0.9
39.5
13.3
2,98
5.5
1,87
9.4
13.0
47.8
2,00
2.9
39.5
13.3
3,99
5.9
1990
809.
0.0
.019
3.0
10.0
.01,
012.
071
1.0
11.3
21.8
2,49
7.0
44.6
5.1
3,29
0.8
1,52
0.0
11.3
21.8
2,69
0.0
54.6
5.1
4,30
2.8
1991
602.
8.0
.092
.08.
21.
370
4.3
487.
24.
437
.12,
076.
741
.25.
62,
652.
21,
090.
04.
437
.12,
168.
749
.46.
93,
356.
5
1992
699.
5.0
.014
9.6
7.3
1.0
857.
445
1.6
3.1
39.4
2,45
9.3
43.2
5.8
3,00
2.3
1,15
1.1
3.1
39.4
2,60
8.9
50.5
6.8
3,85
9.7
1993
356.
0.0
.052
.94.
2.7
413.
835
5.0
1.2
38.9
589.
518
.01.
01,
003.
671
1.0
1.2
38.9
642.
422
.21.
71,
417.
4
1994
77.9
.0.0
112.
76.
533
2.5
529.
582
0.4
9.3
87.0
2,01
8.7
2.0
12.9
2,95
0.3
898.
39.
387
.02,
131.
48.
534
5.4
3,47
9.8
1995
565.
8.0
.083
.758
.710
5.1
813.
339
2.1
3.1
133.
057
8.8
14.1
5.7
1,12
6.9
957.
93.
113
3.0
662.
572
.911
0.8
1,94
0.2
1996
275.
2.0
.070
.947
.113
4.6
527.
738
9.7
21.3
69.7
1,13
8.5
33.9
51.2
1,70
4.3
664.
921
.369
.71,
209.
381
.018
5.8
2,23
2.0
1997
498.
7.0
11.0
56.6
25.1
240.
583
1.8
433.
55.
871
.31,
455.
310
.711
.01,
987.
693
2.3
5.8
82.3
1,51
1.9
35.8
251.
52,
819.
5
1998
337.
7.0
.081
.914
4.2
377.
294
1.0
1,02
2.4
107.
461
.41,
614.
345
.116
.22,
866.
81,
360.
110
7.4
61.4
1,69
6.2
189.
339
3.4
3,80
7.8
Mea
n19
87-9
6A
cre-
ft53
7.8
.03.
112
0.8
14.2
57.5
733.
568
3.9
10.5
53.9
1,76
2.5
35.2
12.0
2,55
8.0
1,22
1.7
10.5
57.0
1,88
3.4
49.4
69.6
3,29
1.5
1,00
0 ga
l/d
480.
2.0
2.8
107.
912
.751
.365
4.9
610.
59.
348
.11,
573.
531
.410
.72,
283.
51,
090.
79.
350
.91,
681.
444
.162
.12,
938.
4
Mea
n19
81-9
8A
cre-
ft55
5.0
2.3
85.6
17.3
66.3
726.
573
9.5
20.6
55.7
1,92
0.3
33.3
14.8
2,78
4.2
1,29
4.6
20.6
58.0
2,00
5.9
50.6
81.0
3,51
0.7
1,00
0 ga
l/d
495.
52.
176
.415
.459
.264
8.6
660.
218
.449
.71,
714.
429
.713
.22,
485.
61,
155.
718
.451
.81,
790.
845
.172
.43,
134.
1

Hydrologic Budgets 35
Livestock water use includes water used in the production of meat, poultry, eggs, milk, and wool. Like the self-supply domestic use, total ground-water with-drawals for livestock watering are available for 1995 by county, but not by aquifer. To estimate the percent of total ground-water withdrawals from the Madison and Minnelusa aquifers, data on livestock wells in the six-county area were compiled from the GWSI data-base. The percentages of wells completed in the Madison and Minnelusa aquifers were applied to the total ground-water withdrawals to apportion livestock use (table 10). The estimated total withdrawal from the Madison and Minnelusa aquifers for livestock-watering purposes is 181,600 gal/d (0.28 ft3/s).
Estimates for industrial, mining, and thermoelec-tric uses were determined using withdrawal data from the Madison and Minnelusa aquifers compiled from the SWUDS database for 1995. Industrial water use repre-sents water used to manufacture products; mining water use represents water withdrawn for the extraction of minerals; and thermoelectric water use represents water used in the production of electric power generated with fossil-fuel, geothermal, or nuclear energy (Amundson, 1998). The estimated total with-drawal from the Madison and Minnelusa aquifers is 976,000 gal/d (1.51 ft3/s) for industrial use, 1,283,000 gal/d (1.99 ft3/s) for mining use, and 440,000 gal/d (0.68 ft3/s) for thermoelectric use.
The category of unaccountable withdrawals includes all flowing wells discharging water continu-ously from the Madison and Minnelusa aquifers (wild wells) and other withdrawals that are not accounted for by other use categories. The unaccountable with-drawals, 5,010,000 gal/d (7.75 ft3/s), are estimated as being 25 percent of the subtotal of all other water use categories, with the exception of the withdrawal from the Madison aquifer in Butte County, which was esti-mated as 2,000,000 gal/d based on known wild wells completed in the Madison aquifer (Jim Goodman, South Dakota Department of Environment and Natural Resources, oral commun., 2000).
Subarea Budgets
Within this section, individual budgets are quan-tified for nine subareas within the overall study area. Preliminary budgets quantifying only combined, net ground-water inflows or outflows for the Madison and Minnelusa aquifers are developed first for each sub-area. Detailed budgets also are developed, which include estimates of flow components and transmis-sivity for the individual aquifers at specific flow zones. An evaluation of budget components also is provided.
Preliminary Budgets
Separate budgets are developed for nine subareas within the study area (figs. 15 and 16). The subarea budgets are developed as combined budgets for the Madison and Minnelusa aquifers, using common sub-areas for both aquifers. Subareas were identified on the basis of hypothetical flowpaths that were constructed roughly orthogonal to mapped hydraulic heads in the Madison and Minnelusa aquifers. For unconfined settings near outcrop areas, flowpaths probably are heavily influenced by bedding dips, which generally are radially away from the central part of the uplift. For confined settings, anisotropic and heterogeneous hydraulic properties can result in flowpaths that are strongly nonorthogonal to hydraulic heads (Long, 2000). Regional ground-water flow from the west also may influence potentiometric surfaces in the northern and southwestern parts of the study area.
Subarea boundaries were selected with the intent of minimizing apparent flow across the boundaries (referred to as interior subarea flow zones in figs. 15 and 16); however, in a number of cases, zero-flow boundaries that respect mapped hydraulic heads could not be established for both aquifers. Various other fac-tors such as locations of major artesian springs, stream-flow loss zones, and areas dominated by precipitation recharge also were considered in selecting subarea boundaries. These factors are useful in evaluating various budget components. For example, subarea 6, which has no artesian springflow, is located between subareas 5 and 7, both of which have large artesian springs.

36 Hydrologic Budgets for the Madison and Minnelusa Aquifers, Black Hills Area, Water Years 1987-96
Sundance
Newcastle
Whitewood
Spearfish
Maurice
Savoy
SaintOnge
DEADWOODLead
Nemo
CentralCity
BELLE FOURCHE
Newell
STURGIS
Blackhawk
Piedmont
Tilford
Box Elder
RAPID CITY
Hill City
Hermosa
CUSTER
HOT SPRINGS
Edgemont
Roubaix
Keystone
Hayward
Fairburn
Buffalo Gap
Pringle
Redwater
Creek
Sand
Creek
Cold
Springs
Inyan
Kara Creek
Creek
Cre
ek
Stoc
kade
Beaver
Bea
ver
CHEYENNE
RI
VER
Creek
Lance
Cre
ek
Creek
NF
orkR
apidC
r
Belle FourcheReservoir
FOURCHE
Victoria
Spring
Grace
Cooli d ge
AngosturaReservoir
Iron
Castl eC
rN Fork Castle C
Can
yon
Red
BearG
ulch
Creek
Crow
SheridanLake
DeerfieldReservoir
PactolaReservoir
Indian Cr
Horse
Creek
OwlCreek
BELLE
RIVER
REDWATER R I VE
RC
reek
Spea
rfis
h
Whi
tewoo
d
Cre
ek
Creek
Bear
Butte
Elk
ElkCreek
Creek
Boxelder
Rapid
Rapid
Creek
Creek
Creek
Creek
Creek
Creek
Cre
ek
S. Fork
S. Fork Rapid Cr
Battle
French
Beaver
Creek
Creek
Creek
FallR
Hat
Cre
ek
Creek
Horsehead
CHEYENNE
RIVER
Cot
tonw
ood
CreekHay
Spokane
Lame
Johnny
Bea
ver
Cre
ek
Robison
Gulch
Gulch
Castle
Cas
tle
Bear
Little
Creek
Gulch
Hig
gins
Creek
C reek
Cr
Bot
tom
Fal
se
Creek
Wind CaveNational Park
CUSTER
STATE
PARK
WindCave
HarneyPeakx
CROOK COWESTON CO
NIOBRARA CO
104o104o30' 103o30'
103o
44o30'
44o
43o30'
BUTTE CO
LAWRENCE CO MEADE CO
PENNINGTON CO
CUSTER CO
FALL RIVER CO
WY
OM
ING
SO
UT
H
DA
KO
TA
3600
5800
6600
3600
3400
380040004200
4400
50005200
4800
540056006000
6200 42006400
4000
3800
3200
3400
3600
4200
2600
2600
2800
4000
2800
2800
3000
3000
66006000
64006200
5000
3600
4000
3200
3600
4600
3400
3400
3800
3800
4000
4000
5000
60006200
8
1 2
3
4
5
6
7
9
8
1 2
3
4
5
6
7
9
7320.9
1,4631.8
7321.3
900.3
1,0452.8
3101.7
5101.3
5104.6
5104.2
3,19643.7
5,58936.9
59119.7
7,39312.2
4,34911.0
Base modified from U.S. Geological Survey digital data,1:100,000 and City Engineer's map, Rapid City, 1991
Figure 15. Subareas, generalized ground-water flow directions, and flow zones for the Madison aquifer. Estimatedtransmissivities and flow components for flow zones also are shown.
0 10 20
0 10 20 MILES
KILOMETERS
OUTCROP OF MADISON LIMESTONE AND ENGLEWOOD FORMATION (from Strobel and others, 1999; DeWitt and others, 1989)
SUBAREA--Number is subarea number
POTENTIOMETRIC CONTOUR--Shows altitude at which water would have stood in tightly cased, nonpumping wells (modified from Strobel and others, 2000a; Greene and Rahn, 1995). Contour interval 200 feet. Dashed where inferred. Datum is sea level
EXTERIOR INFLOW ZONE--Area where ground water is assumed to be entering the study area. Number is zone numberEXTERIOR OUTLOW ZONE--Area where ground water is assumed to be exiting the study area. Number is zone number
INTERIOR SUBAREA FLOW ZONE--Area where ground water is assumed to be crossing subarea boundaries. Number is zone number
EXPLANATION
DAKOTASOUTH
WYOMING
AreaShownBlack
Hills
GENERAL DIRECTION OF GROUND-WATER FLOWDIRECTION OF FLOW ACROSS FLOW ZONE--Upper number is transmissivity estimate in feet squared per day; lower number is estimated flow in cubic feet per second88
7321.3
LARGE ARTESIAN SPRING
1010
10
11
9
8
7
6
5
4
2
3
1212
14
13
12
11
1

Hydrologic Budgets 37
1 2
3
6
7
8
9
4
5
Sundance
Newcastle
Whitewood
Spearfish
Maurice
Savoy
SaintOnge
DEADWOODLead
Nemo
CentralCity
BELLE FOURCHE
Newell
STURGIS
Blackhawk
Piedmont
Tilford
Box Elder
RAPID CITY
Hill City
Hermosa
CUSTER
HOT SPRINGS
Edgemont
Roubaix
Keystone
Hayward
Fairburn
Buffalo Gap
Pringle
Redwater
Creek
Sand
Creek
Cold
Springs
Inyan
Kara Creek
Creek
Cre
ek
Stoc
kade
Beaver
Bea
ver
CHEYENNE
RI
VER
Creek
Lance
Cre
ek
Creek
NF
orkR
apidC
r
Belle FourcheReservoir
FOURCHE
Victoria
Spring
Grace
Cooli d ge
AngosturaReservoir
Iron
Castl eC
r
N Fork Castle C
Can
yon
Red
BearG
ulch
Creek
Crow
SheridanLake
DeerfieldReservoir
PactolaReservoir
Indian Cr
Horse
Creek
OwlCreek
BELLE
RIVER
REDWATER R I VE
RC
reek
Spea
rfis
h
Whi
tewoo
d
Cre
ek
Creek
Bear
Butte
Elk
ElkCreek
Creek
Boxelder
Rapid
Rapid
Creek
Creek
Creek
Creek
Creek
Creek
Cre
ek
S. Fork
S. Fork Rapid Cr
Battle
French
Beaver
Creek
Creek
Creek
FallR
Hat
Cre
ek
Creek
Horsehead
CHEYENNE
RIVER
Cot
tonw
ood
CreekHay
Spokane
Lame
Johnny
Bea
ver
Cre
ek
Robison
Gulch
Gulch
Castle
Cas
tle
Bear
Little
Creek
Gulch
Hig
gins
Creek
C reek
Cr
Bot
tom
Fal
se
Creek
Wind CaveNational Park
CUSTER
STATE
PARK
WindCave
HarneyPeakx
CROOK COWESTON CO
NIOBRARA CO
104o104o30' 103o30'
103o
44o30'
44o
43o30'
BUTTE CO
LAWRENCE CO MEADE CO
PENNINGTON CO
CUSTER CO
FALL RIVER CO
WY
OM
ING
SO
UT
H
DA
KO
TA
4000
4000
6600
62003400
6000
5400 5800
5000 5200
44004200
2800
3600
3600
3400
4000
3200
3000
44004600
3800
4800 4200
5000
4000 3800
60006200
64006400
3800
68006600
3800
600064006200
6200
5600
5800
6000
2800
3000
3200
5400
3800
3800
48004600
4800
36004600 3400
42004400
4000
3600
260028
003000
3200
3400
3800
4000
4200
4400
4600
4200
4000
3800
3600
2600
Base modified from U.S. Geological Survey digital data,1:100,000 and City Engineer's map, Rapid City, 1991
Figure 16. Subareas, generalized ground-water flow directions, and flow zones for the Minnelusa aquifer. Estimatedtransmissivities and flow components for flow zones also are shown.
0 10 20
0 10 20 MILES
KILOMETERS
OUTCROP OF THE MINNELUSA FORMATION (from Strobel and others, 1999; DeWitt and others, 1989)
POTENTIOMETRIC CONTOUR--Shows altitude at which water would have stood in tightly cased, nonpumping wells (modified from Strobel and others, 2000b; Downie and Dinwiddie, 1988). Contour interval 200 feet, where appropriate. Dashed where inferred. Datum is sea level
EXPLANATION
GENERAL DIRECTION OF GROUND-WATER FLOW
SUBAREA--Number is subarea number
EXTERIOR INFLOW ZONE--Area where ground water is assumed to be entering the study area. Number is zone number
EXTERIOR OUTLOW ZONE--Area where ground water is assumed to be exiting the study area. Number is zone number
INTERIOR FLOW ZONE--Area where ground water is assumed to be crossing subarea boundaries. Number is zone number
88DIRECTION OF FLOW ACROSS FLOW ZONE--Upper number is transmissivity estimate in feet squared per day; lower number is estimated flow in cubic feet per second
LARGE ARTESIAN SPRING
DAKOTASOUTH
WYOMING
AreaShownBlack
Hills
25
30
25
30
1515
16
15
24
27
25
26
23
22
21
20
19
18
17
28
29
30
31
32
7320.4
1,4632.8
7324.8
900.6
1,0453.9
1,4632.4
4340.8
3103.4
5101.3
7123.4
5103.1
5101.3
3,19627.5
3,1968.1
3,19615.4
5915.3
7,39311.5
4,34913.0
5103.1

38 Hydrologic Budgets for the Madison and Minnelusa Aquifers, Black Hills Area, Water Years 1987-96
Subarea budgets are developed for 1987-92 (decreasing storage) and 1993-96 (increasing storage). Change in storage is assumed to be equal in magnitude but opposite for the two periods. Consideration of these two different time periods and numerous sub-areas provides various opportunities to evaluate ground-water flow components.
Precipitation recharge estimates for each subarea were distributed using the yield efficiency algorithm and excluded areas east of the ground-water divide in the Limestone Plateau area (fig. 10), which would con-tribute to headwater springflow. With this exception, the sum of budget components for the subareas is equal to the components for the overall budget. Other budget components are distributed by the following methods: (1) percent of each subarea relative to ungaged drainage basins for streamflow recharge presented in Carter and others (2001); (2) percent of each subarea relative to counties for all water-use categories except municipal; and (3) discrete locations within subareas for streamflow recharge estimates for gaged streams, artesian springflow, and municipal water use.
Subarea budgets are presented in table 12. Net ground-water flow (either net inflow or net outflow in equation 2) for each subarea is calculated using an iter-ative process until the volumetric change in storage for the period 1987-92 is approximately equal, but oppo-site to the change in storage for the period 1993-96. Results also are presented in figures 15 and 16, which collectively show balances that are identical to table 12, but also include estimated flow components for the individual aquifers at specific flow zones, as described in a subsequent section. Using subarea 1 as an example, inflows are identified only for the Min-nelusa aquifer (15.4 ft3/s); however, outflows are iden-tified for both the Madison (36.9 ft3/s) and Minnelusa (8.1 ft3/s) aquifers, which results in a combined net outflow of 29.6 ft3/s (table 12).
For most subareas, net ground-water outflow exceeds inflow. Net ground-water outflow for these subareas ranges from 5.9 ft3/s in subarea 4 to 48.6 ft3/s in subarea 9. The large net ground-water outflow com-ponent in subarea 9 results from large precipitation recharge (table 12) on the expansive outcrops of Madison Limestone and Minnelusa Formation in this area.
Net ground-water inflow exceeds ground-water outflow for subareas 7 and 8 because discharge of large artesian springs exceeds estimated recharge within these subareas. Outflows from subarea 8 probably contribute to subarea 7, and outflows from subarea 9 probably contribute to subarea 8 (figs. 15 and 16).
Detailed Budgets
Within this section, detailed subarea budgets are developed, which include estimates of flow compo-nents for the individual aquifers at specific flow zones. Estimates of transmissivity also are derived using the preliminary subarea budgets, which are required for development of the detailed subarea budgets, as described in the following sections.
General Methods and Considerationsfor Estimating Transmissivity
The net ground-water outflows and inflows determined using the subarea budgets are used to esti-mate transmissivity and flow across subarea bound-aries at various locations based on Darcy’s Law:
(1)
where:Q = flow, in cubic feet per day;K = hydraulic conductivity, in feet per day;i = hydraulic gradient; and
A = cross-sectional area, in square feet.
Flow through any vertical section of an aquifer can be expressed using transmissivity, as follows:
(2)
where:Q = flow, in cubic feet per day;T = transmissivity, in feet squared per day;i = hydraulic gradient; and
L = length of boundary, in feet.
Q KiA=
Q TiL=

Hydrologic Budgets 39
Table 12. Hydrologic budgets, by subareas, for the Madison and Minnelusa aquifers in the Black Hills area,water years 1987-96
[ft3/s, cubic feet per second; acre-ft, acre-feet]
Water year
Inflows (ft3/s) Outflows (ft3/s) Sum (ft3/s) Change in storage
Stream-flow
recharge
Precipita-tion
recharge
Netground-
waterinflow
Artesianspring-
flowWells
Netground-
wateroutflow
Inflows Outflows ft3/s acre-ft
Subarea 1
1987 8.6 64.8 0.0 101.8 11.0 29.6 73.4 142.4 -69.0 -49,961
1988 5.9 53.9 .0 94.8 12.6 29.6 59.8 137.0 -77.2 -55,898
1989 6.1 65.5 .0 75.5 11.7 29.6 71.6 116.8 -45.2 -32,728
1990 7.5 83.9 .0 78.8 12.2 29.6 91.4 120.6 -29.2 -21,143
1991 8.5 122.7 .0 81.4 10.9 29.6 131.2 121.9 9.3 6,734
1992 6.6 86.5 .0 76.0 11.3 29.6 93.1 116.9 -23.8 -17,233
Average/sum1 1987-92
7.2 79.6 .0 84.7 11.6 29.6 86.8 125.9 -39.2 1-170,228
1993 9.8 170.2 .0 80.6 9.1 29.6 180.0 119.3 60.7 43,951
1994 11.3 100.7 .0 93.6 10.6 29.6 112.0 133.8 -21.8 -15,785
1995 15.9 260.0 .0 103.9 9.4 29.6 275.9 142.9 133.0 96,301
1996 16.1 202.9 .0 116.7 9.6 29.6 219.0 155.9 63.1 45,689
Average/sum1 1993-96
13.3 183.5 .0 98.7 9.7 29.6 196.7 138.0 58.8 1170,156
Average/sum1 1987-96
9.6 121.1 .0 90.3 10.8 29.6 130.7 130.8 .0 1-72
Subarea 2
1987 27.5 6.1 .0 .0 3.7 34.2 33.6 37.9 -4.3 -3,113
1988 5.8 5.9 .0 .0 4.2 34.2 11.7 38.4 -26.7 -19,333
1989 9.2 6.2 .0 .0 3.8 34.2 15.4 38.0 -22.6 -16,364
1990 15.5 5.8 .0 .0 4.1 34.2 21.3 38.3 -17.0 -12,309
1991 23.8 8.9 .0 .0 3.7 34.2 32.7 37.9 -5.2 -3,765
1992 12.3 5.7 .0 .0 3.8 34.2 18.0 38.0 -20.0 -14,481
Average/sum1 1987-92
15.7 6.4 .0 .0 3.9 34.2 22.1 38.1 -16.0 1-69,366
1993 32.9 16.0 .0 .0 3.1 34.2 48.9 37.3 11.6 8,399
1994 35.4 5.9 .0 .0 3.6 34.2 41.3 37.8 3.5 2,534
1995 58.5 31.7 .0 .0 3.2 34.2 90.2 37.4 52.8 38,231
1996 49.7 16.0 .0 .0 3.3 34.2 65.7 37.5 28.2 20,419
Average/sum1 1993-96
44.1 17.4 .0 .0 3.3 34.2 61.5 37.5 24.0 169,583
Average/sum1 1987-96
27.1 10.8 .0 .0 3.7 34.2 37.9 37.9 .0 1217
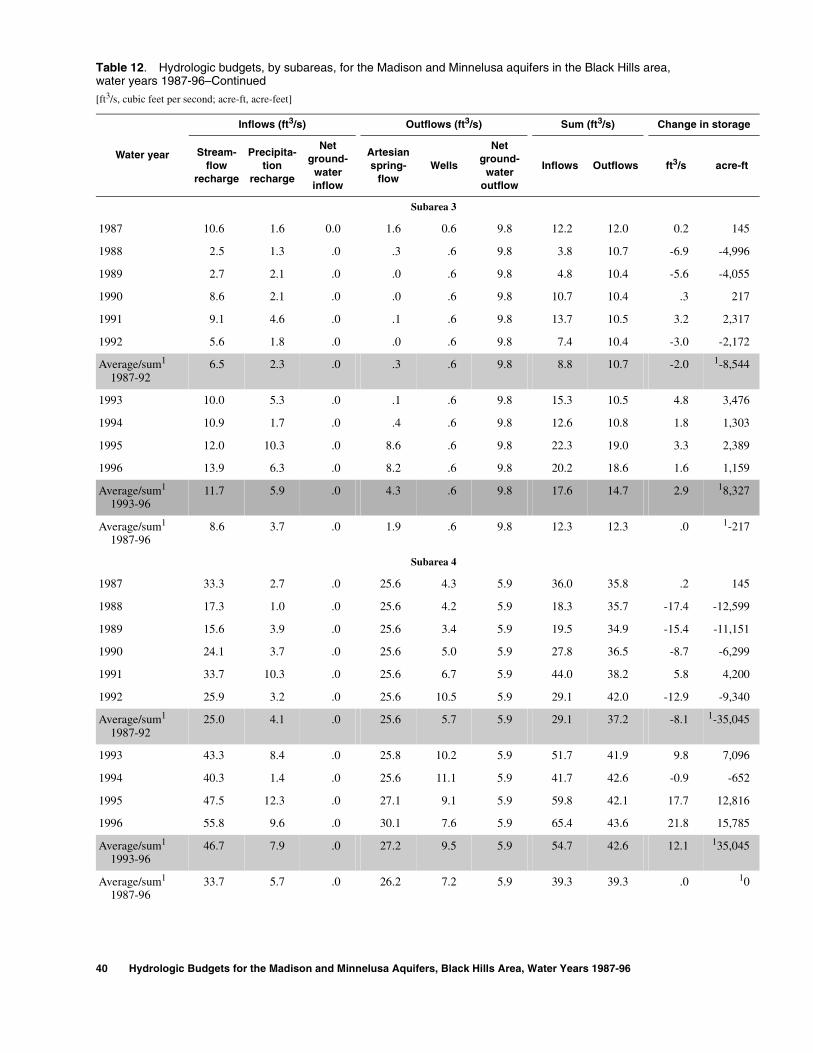
40 Hydrologic Budgets for the Madison and Minnelusa Aquifers, Black Hills Area, Water Years 1987-96
Subarea 3
1987 10.6 1.6 0.0 1.6 0.6 9.8 12.2 12.0 0.2 145
1988 2.5 1.3 .0 .3 .6 9.8 3.8 10.7 -6.9 -4,996
1989 2.7 2.1 .0 .0 .6 9.8 4.8 10.4 -5.6 -4,055
1990 8.6 2.1 .0 .0 .6 9.8 10.7 10.4 .3 217
1991 9.1 4.6 .0 .1 .6 9.8 13.7 10.5 3.2 2,317
1992 5.6 1.8 .0 .0 .6 9.8 7.4 10.4 -3.0 -2,172
Average/sum1 1987-92
6.5 2.3 .0 .3 .6 9.8 8.8 10.7 -2.0 1-8,544
1993 10.0 5.3 .0 .1 .6 9.8 15.3 10.5 4.8 3,476
1994 10.9 1.7 .0 .4 .6 9.8 12.6 10.8 1.8 1,303
1995 12.0 10.3 .0 8.6 .6 9.8 22.3 19.0 3.3 2,389
1996 13.9 6.3 .0 8.2 .6 9.8 20.2 18.6 1.6 1,159
Average/sum1 1993-96
11.7 5.9 .0 4.3 .6 9.8 17.6 14.7 2.9 18,327
Average/sum1 1987-96
8.6 3.7 .0 1.9 .6 9.8 12.3 12.3 .0 1-217
Subarea 4
1987 33.3 2.7 .0 25.6 4.3 5.9 36.0 35.8 .2 145
1988 17.3 1.0 .0 25.6 4.2 5.9 18.3 35.7 -17.4 -12,599
1989 15.6 3.9 .0 25.6 3.4 5.9 19.5 34.9 -15.4 -11,151
1990 24.1 3.7 .0 25.6 5.0 5.9 27.8 36.5 -8.7 -6,299
1991 33.7 10.3 .0 25.6 6.7 5.9 44.0 38.2 5.8 4,200
1992 25.9 3.2 .0 25.6 10.5 5.9 29.1 42.0 -12.9 -9,340
Average/sum1 1987-92
25.0 4.1 .0 25.6 5.7 5.9 29.1 37.2 -8.1 1-35,045
1993 43.3 8.4 .0 25.8 10.2 5.9 51.7 41.9 9.8 7,096
1994 40.3 1.4 .0 25.6 11.1 5.9 41.7 42.6 -0.9 -652
1995 47.5 12.3 .0 27.1 9.1 5.9 59.8 42.1 17.7 12,816
1996 55.8 9.6 .0 30.1 7.6 5.9 65.4 43.6 21.8 15,785
Average/sum1 1993-96
46.7 7.9 .0 27.2 9.5 5.9 54.7 42.6 12.1 135,045
Average/sum1 1987-96
33.7 5.7 .0 26.2 7.2 5.9 39.3 39.3 .0 10
Table 12. Hydrologic budgets, by subareas, for the Madison and Minnelusa aquifers in the Black Hills area,water years 1987-96–Continued
[ft3/s, cubic feet per second; acre-ft, acre-feet]
Water year
Inflows (ft3/s) Outflows (ft3/s) Sum (ft3/s) Change in storage
Stream-flow
recharge
Precipita-tion
recharge
Netground-
waterinflow
Artesianspring-
flowWells
Netground-
wateroutflow
Inflows Outflows ft3/s acre-ft

Hydrologic Budgets 41
Subarea 5
1987 12.8 1.3 0.0 6.2 1.6 6.0 14.1 13.8 0.3 217
1988 2.4 .6 .0 2.4 1.6 6.0 3.0 10.0 -7.0 -5,068
1989 3.1 2.2 .0 1.2 1.6 6.0 5.3 8.8 -3.5 -2,534
1990 10.6 3.6 .0 1.6 1.6 6.0 14.2 9.2 5.0 3,620
1991 12.9 4.5 .0 3.5 1.6 6.0 17.4 11.1 6.3 4,562
1992 7.9 2.0 .0 4.5 1.6 6.0 9.9 12.1 -2.2 -1,593
Average/sum1 1987-92
8.3 2.4 .0 3.2 1.6 6.0 10.7 10.8 -0.2 1-796
1993 17.3 4.9 .0 7.1 1.6 6.0 22.2 14.7 7.5 5,430
1994 10.2 1.3 .0 10.8 1.7 6.0 11.5 18.5 -7.0 -5,068
1995 18.7 7.2 .0 11.3 1.6 6.0 25.9 18.9 7.0 5,068
1996 18.0 4.7 .0 21.0 1.7 6.0 22.7 28.7 -6.0 -4,344
Average/sum1 1993-96
16.1 4.5 .0 12.6 1.7 6.0 20.6 20.2 .4 11,086
Average/sum1 1987-96
11.4 3.2 .0 7.0 1.6 6.0 14.6 14.6 .0 1290
Subarea 6
1987 7.8 .3 .0 .0 .0 8.3 8.1 8.3 -0.2 -145
1988 2.7 .2 .0 .0 .0 8.3 2.9 8.3 -5.4 -3,910
1989 1.6 .6 .0 .0 .0 8.3 2.2 8.3 -6.1 -4,417
1990 5.1 .8 .0 .0 .0 8.3 5.9 8.3 -2.4 -1,738
1991 7.8 .9 .0 .0 .0 8.3 8.7 8.3 .4 290
1992 5.5 .7 .0 .0 .0 8.3 6.2 8.3 -2.1 -1,521
Average/sum1 1987-92
5.1 .6 .0 .0 .0 8.3 5.7 8.3 -2.6 1-11,440
1993 9.2 1.3 .0 .0 .0 8.3 10.5 8.3 2.2 1,593
1994 7.4 .3 .0 .0 .0 8.3 7.7 8.3 -0.6 -434
1995 13.0 2.5 .0 .0 .0 8.3 15.5 8.3 7.2 5,213
1996 13.9 1.5 .0 .0 .0 8.3 15.4 8.3 7.1 5,141
Average/sum1 1993-96
10.9 1.4 .0 .0 .0 8.3 12.3 8.3 4.0 111,513
Average/sum1 1987-96
7.4 .9 .0 .0 .0 8.3 8.3 8.3 .0 172
Table 12. Hydrologic budgets, by subareas, for the Madison and Minnelusa aquifers in the Black Hills area,water years 1987-96–Continued
[ft3/s, cubic feet per second; acre-ft, acre-feet]
Water year
Inflows (ft3/s) Outflows (ft3/s) Sum (ft3/s) Change in storage
Stream-flow
recharge
Precipita-tion
recharge
Netground-
waterinflow
Artesianspring-
flowWells
Netground-
wateroutflow
Inflows Outflows ft3/s acre-ft

42 Hydrologic Budgets for the Madison and Minnelusa Aquifers, Black Hills Area, Water Years 1987-96
Subarea 7
1987 2.0 0.6 6.1 10.0 0.1 0.0 8.7 10.1 -1.4 -1,014
1988 .4 .4 6.1 10.0 .1 .0 6.9 10.1 -3.2 -2,317
1989 .4 .6 6.1 9.0 .1 .0 7.1 9.1 -2.0 -1,448
1990 1.0 .9 6.1 9.0 .1 .0 8.0 9.1 -1.1 -796
1991 1.6 1.1 6.1 8.1 .1 .0 8.8 8.2 .6 434
1992 1.0 1.2 6.1 8.0 .1 .0 8.3 8.1 .2 145
Average/sum1 1987-92
1.1 .8 6.1 9.0 .1 .0 8.0 9.1 -1.2 1-4,996
1993 2.2 2.1 6.1 9.1 .1 .0 10.4 9.2 1.2 869
1994 2.3 .6 6.1 9.5 .1 .0 9.0 9.6 -0.6 -434
1995 6.1 4.2 6.1 12.5 .1 .0 16.4 12.6 3.8 2,751
1996 6.1 1.2 6.1 11.1 .1 .0 13.4 11.2 2.2 1,593
Average/sum1 1993-96
4.2 2.0 6.1 10.6 .1 .0 12.3 10.7 1.7 14,779
Average/sum1 1987-96
2.3 1.3 6.1 9.6 .1 .0 9.7 9.7 .0 1-217
Subarea 8
1987 5.9 3.2 35.6 45.4 1.8 .0 44.7 47.2 -2.5 -1,810
1988 1.5 2.2 35.6 44.1 1.8 .0 39.3 45.9 -6.6 -4,779
1989 1.6 3.8 35.6 43.1 1.8 .0 41.0 44.9 -3.9 -2,824
1990 3.9 5.4 35.6 44.1 1.9 .0 44.9 46.0 -1.1 -796
1991 5.5 5.7 35.6 43.1 1.8 .0 46.8 44.9 1.9 1,376
1992 1.6 5.2 35.6 42.9 1.8 .0 42.4 44.7 -2.3 -1,665
Average/sum1 1987-92
3.3 4.3 35.6 43.8 1.8 .0 43.2 45.6 -2.4 1-10,499
1993 4.1 10.8 35.6 42.1 1.8 .0 50.5 43.9 6.6 4,779
1994 2.4 2.3 35.6 44.0 1.9 .0 40.3 45.9 -5.6 -4,055
1995 11.9 14.6 35.6 46.3 1.9 .0 62.1 48.2 13.9 10,065
1996 6.0 7.5 35.6 47.5 1.8 .0 49.1 49.3 -0.2 -145
Average/sum1 1993-96
6.1 8.8 35.6 45.0 1.9 .0 50.5 46.8 3.7 110,644
Average/sum1 1987-96
4.4 6.1 35.6 44.3 1.8 .0 46.1 46.1 .0 1145
Table 12. Hydrologic budgets, by subareas, for the Madison and Minnelusa aquifers in the Black Hills area,water years 1987-96–Continued
[ft3/s, cubic feet per second; acre-ft, acre-feet]
Water year
Inflows (ft3/s) Outflows (ft3/s) Sum (ft3/s) Change in storage
Stream-flow
recharge
Precipita-tion
recharge
Netground-
waterinflow
Artesianspring-
flowWells
Netground-
wateroutflow
Inflows Outflows ft3/s acre-ft

Hydrologic Budgets 43
Subarea 9
1987 0.0 24.6 0.0 9.0 2.2 48.6 24.6 59.8 -35.2 -25,487
1988 .0 20.7 .0 9.0 2.2 48.6 20.7 59.8 -39.1 -28,311
1989 .0 35.3 .0 9.0 2.2 48.6 35.3 59.8 -24.5 -17,740
1990 .0 46.1 .0 9.0 2.2 48.6 46.1 59.8 -13.7 -9,920
1991 .0 73.1 .0 8.8 2.2 48.6 73.1 59.6 13.5 9,775
1992 .0 44.6 .0 8.9 2.2 48.6 44.6 59.7 -15.1 -10,933
Average/sum1 1987-92
.0 40.7 .0 9.0 2.2 48.6 40.7 59.8 -19.0 1-82,616
1993 .0 98.2 .0 9.1 2.2 48.6 98.2 59.9 38.3 27,732
1994 .0 40.2 .0 9.7 2.3 48.6 40.2 60.6 -20.4 -14,771
1995 .0 106.4 .0 11.8 2.2 48.6 106.4 62.6 43.8 31,714
1996 .0 114.3 .0 11.3 2.3 48.6 114.3 62.2 52.1 37,724
Average/sum1 1993-96
.0 89.8 .0 10.5 2.3 48.6 89.8 61.3 28.5 182,399
Average/sum1 1987-96
.0 60.4 .0 9.6 2.2 48.6 60.4 60.4 .0 1-217
1Sum used for change in storage in acre-feet.
Table 12. Hydrologic budgets, by subareas, for the Madison and Minnelusa aquifers in the Black Hills area,water years 1987-96–Continued
[ft3/s, cubic feet per second; acre-ft, acre-feet]
Water year
Inflows (ft3/s) Outflows (ft3/s) Sum (ft3/s) Change in storage
Stream-flow
recharge
Precipita-tion
recharge
Netground-
waterinflow
Artesianspring-
flowWells
Netground-
wateroutflow
Inflows Outflows ft3/s acre-ft
Where flowpaths cross study area or subarea boundaries, flow zones were identified to represent ground-water flow areas along individual boundary segments for the Madison and Minnelusa aquifers (figs. 15 and 16). The flow zones consist of: (1) exterior inflow zones, where ground water is assumed to be entering the study area; (2) exterior out-flow zones, where ground water is assumed to be exiting the study area; and (3) interior flow zones, where ground water is assumed to be crossing subarea boundaries. For the Madison aquifer, 14 flow zones are identified (fig. 15), and for the Minnelusa aquifer, 18 flow zones are identified (fig. 16).
For purposes of this report, an estimate of average transmissivity for individual flow zones can be obtained by rearranging equation 4 and using the
hydraulic gradient perpendicular to the flow zone to yield the following equation:
(3)
where:T = transmissivity, in feet squared per day;Q = flow, in cubic feet per day;ip = hydraulic gradient perpendicular to the
boundary; andL = length of flow zone, in feet.
For each flow zone, the average hydraulic gra-dient perpendicular to the flow zone was determined. Hydraulic gradients and the lengths of flow zones are presented in table 13.
TQ
ipL-------=

44 Hydrologic Budgets for the Madison and Minnelusa Aquifers, Black Hills Area, Water Years 1987-96
Equations 3 through 5 assume homogeneous and isotropic conditions in the aquifers, which generally is not the case for the Madison and Minnelusa aquifers. However, it is assumed that these conditions are aver-aged over the length of the flow zones, which approxi-mates isotropic conditions resulting in an average transmissivity. For estimation purposes, it is assumed that the transmissivity of the Madison and Minnelusa aquifers are equal in any particular flow zone. It is assumed that hypothetical flowpaths are approximately perpendicular to the potentiometric-surface contours (figs. 15 and 16); however, ground-water flow can be nearly parallel to potentiometric-surface contours in some areas (Long, 2000), especially in the Madison aquifer due to heterogeneity and anisotropy.
Transmissivity of the Madison and Minnelusa aquifers in the Black Hills area varies greatly. Esti-mates of hydraulic conductivity and transmissivity are available from previous investigations (table 14). In the Madison aquifer, transmissivity estimates range from less than 1 to 56,000 ft2/d, and in the Minnelusa aquifer, transmissivity estimates range from less than 1 to 12,000 ft2/d. Some of the transmissivity estimates from previous investigations were for small areas near large-discharge wells and are not necessarily represen-tative of average transmissivity over large areas. Although transmissivity values from previous investi-gations were not used in determining ground-water flow components, they provide a basis against which estimated transmissivities (using flows from subarea budgets) can be compared.
Because all subareas have multiple flow zones, transmissivity generally is calculated in equation 5 by dividing the net ground-water inflow or outflow given in table 12 for each respective subarea (Q) by the sum of the product of hydraulic gradient (i) times length (L), for the flow zones included in each particular calcula-tion. This calculation yields equal values of transmis-sivity for all flow zones involved in a calculation, which is used as an initial assumption, when possible. Ground-water flow for individual flow zones is calcu-lated using equation 5 to solve for Q using the esti-mated transmissivity for each flow zone. More specific methods and assumptions that have been applied in estimating transmissivity for the flow zones, by sub-area, are presented in the following section.
Table 13. Flow-zone information used in estimating transmissivity
Flowzone
number
Subareanumber
Flowdirection
Hydraulicgradient1
Length offlow zone
(miles)
Madison Aquifer
1 8 Inflow 0.0017 15.2
2 2 Outflow .0076 29.4
3 3 Outflow .0089 15.2
4 3 Outflow .0125 11.9
5 4 Outflow .0051 8.1
6 5 Outflow .0046 19.7
7 6 Outflow .0046 9.6
8 7 Outflow .0039 14.4
9 8 Outflow .0025 12.0
10 8 Outflow .0034 6.0
11 9 Outflow .0147 37.1
12 1,2 Interior boundary2 .0047 22.8
13 7,8 Interior boundary2 .0019 10.4
14 8,9 Interior boundary2 .0017 15.9
Minnelusa Aquifer
15 1 Inflow .0046 17.2
16 8 Inflow .0020 24.9
17 1 Outflow .0019 22.0
18 2 Outflow .0048 29.4
19 3 Outflow .0027 15.2
20 3 Outflow .0083 11.9
21 4 Outflow .0050 8.1
22 5 Outflow .0092 19.7
23 6 Outflow .0064 9.6
24 7 Outflow .0072 14.4
25 8 Outflow .0089 12.0
26 8 Outflow .0016 6.0
27 9 Outflow .0050 29.3
28 3,4 Interior boundary2 .0045 17.0
29 5,6 Interior boundary2 .0025 12.9
30 6,7 Interior boundary2 .0016 16.7
31 7,8 Interior boundary2 .0018 17.0
32 8,9 Interior boundary2 .0025 10.71Hydraulic gradient determined perpendicular to flow zones.2Indicates flow across interior subarea boundary.

Hydrologic Budgets 45
Table 14. Estimates of hydraulic conductivity and transmissivity from previous investigations
[ft/d, feet per day; ft2/d, feet squared per day; <, less than]
SourceHydraulic conductivity
(ft/d)Transmissivity
(ft2/d)Area represented
Madison Aquifer
Konikow, 1976 -- 860 - 2,200 Mont., N. Dak., S. Dak., Wyo.
Miller, 1976 -- 0.01 - 5,400 Southeastern Mont.
Blankennagel and others, 1977 2.4x10⁻⁵ - 1.9 -- Crook County, Wyo.
Woodward-Clyde Consultants, 1980 -- 3,000 Eastern Wyo., western S. Dak.
Blankennagel and others, 1981 -- 5,090 Crook County, Wyo.
Downey, 1982 -- 250 - 1,500 Mont., N. Dak., S. Dak., Wyo.
Back and others, 1983 2.93x10⁻⁵ -- Eastern Wyo., western S. Dak.
Cooley and others, 1986 1.04 -- Mont., N. Dak., S. Dak., Wyo., Nebr.
Kyllonen and Peter, 1987 -- 4.3 - 8,600 Northern Black Hills
Imam,1991 9.0 x 10⁻⁶ -- Black Hills area
Greene, 1993 -- 1,300 - 56,000 Rapid City area
Tan, 1994 5 -1,300 -- Rapid City area
Greene and others, 1999 -- 2,900 - 41,700 Spearfish area
Minnelusa Aquifer
Blankennagel and others, 1977 <2.4x10⁻⁵ - 1.4 -- Crook County, Wyo.
Pakkong, 1979 -- 880 Boulder Park area, S. Dak.
Woodward-Clyde Consultants, 1980 -- 30 - 300 Eastern Wyo., western S. Dak.
Kyllonen and Peter, 1987 -- 0.86 - 8,600 Northern Black Hills
Greene, 1993 -- 12,000 Rapid City area
Tan, 1994 32 -- Rapid City area
Greene and others, 1999 -- 267 - 9,600 Spearfish area
Budget Components and Transmissivity Estimates
Estimates of transmissivity and ground-water flow are obtained from equation 5 using the general methods previously described. The resulting estimates for individual flow zones are presented in table 15, and are shown in figure 15 for the Madison aquifer and in figure 16 for the Minnelusa aquifer. Although trans-missivity estimates are calculated to the nearest integer so that calculations balance, the estimates should be considered valid only within an order of magnitude. Numerous limitations exist for subdividing flow in the Madison and Minnelusa aquifers due to: (1) numerous assumptions associated with transmissivity estimates; and (2) potential errors resulting from presumed flow-paths and hydraulic gradients. Thus, the overall budget estimate of 100 ft3/s for net outflow is the most reliable estimate, and estimates of net outflows and inflows associated with individual subareas are more reliable than estimates of flow for individual flow zones.
Because of an interior boundary flow component from subarea 1 into subarea 2 for the Madison aquifer (interior flow zone 12, fig. 15), transmissivities for
exterior flow zones 15 and 17 in subarea 1 and zones 2 and 18 in subarea 2 are calculated first, assuming equal transmissivities for these exterior flow zones. Sum-ming net outflows of 29.6 ft3/s in subarea 1 and 34.2 ft3/s in subarea 2 (table 12) yields a combined out-flow of 63.8 ft3/s, which is independent of the calcu-lated value for interior zone 12. Equation 5 is solved by dividing the combined outflow (63.8 ft3/s) by the sum of the products i and L for the four flow zones, which results in equal transmissivity estimates of 3,196 ft2/d (table 15). Substituting this transmissivity into equation 4 yields flow estimates for the four exterior flow zones. Balancing with net outflow for either subarea indicates an interior flow component of 36.9 ft3/s from subarea 1 to subarea 2. Then transmis-sivity for interior flow zone 12 is calculated as 5,589 ft2/d. The transmissivity of interior flow zone 12 is about 1.7 times higher than transmissivity for the exterior flow zones for subareas 1 and 2. This is con-sistent with a general hypothesis of decreasing basin-ward transmissivity (Hamade, 2000).

46 Hydrologic Budgets for the Madison and Minnelusa Aquifers, Black Hills Area, Water Years 1987-96
Table 15. Estimates of transmissivity and flow for flow zones
[ft3/s, cubic feet per second; ft2/d, feet squared per day]
Ground-water flow1
total for subarea
(ft3/s)
Flow zone number
Flowdirection
AquiferHydraulic gradient
Length of flow zone
(miles)
Transmis-sivity(ft2/d)
Ground-water
flow2 for flow zone
(ft3/s)
Subarea 1
29.6 12 Interior boundary (out) Madison 0.0047 22.8 5,589 36.9
29.6 15 Inflow Minnelusa .0046 17.2 3,196 -15.4
29.6 17 Outflow Minnelusa .0019 22.0 3,196 8.1
Subarea 2
34.2 12 Interior boundary (in) Madison .0047 22.8 5,589 -36.9
34.2 2 Outflow Madison .0076 29.4 3,196 43.7
34.2 18 Outflow Minnelusa .0048 29.4 3,196 27.5
Subarea 3
9.8 28 Interior boundary (in) Minnelusa .0045 17.0 712 -3.4
9.8 3 Outflow Madison .0089 15.2 510 4.2
9.8 4 Outflow Madison .0125 11.9 510 4.6
9.8 19 Outflow Minnelusa .0027 15.2 510 1.3
9.8 20 Outflow Minnelusa .0083 11.9 510 3.1
Subarea 4
5.9 28 Interior boundary (out) Minnelusa .0045 17.0 712 3.4
5.9 5 Outflow Madison .0051 8.1 510 1.3
5.9 21 Outflow Minnelusa .0050 8.1 510 1.3
Subarea 5
6.0 29 Interior boundary (out) Minnelusa .0025 12.9 434 0.8
6.0 6 Outflow Madison .0046 19.7 310 1.7
6.0 22 Outflow Minnelusa .0092 19.7 310 3.4
Subarea 6
8.3 29 Interior boundary (in) Minnelusa .0025 12.9 434 -0.8
8.3 30 Interior boundary (out) Minnelusa .00016 16.7 1,463 2.4
8.3 7 Outflow Madison .0046 9.6 1,045 2.8
8.3 23 Outflow Minnelusa .0064 9.6 1,045 3.9
Subarea 7
-6.1 30 Interior boundary (in) Minnelusa .0016 16.7 1,463 -2.4
-6.1 13 Interior boundary (in) Madison .0019 10.4 1,463 -1.8
-6.1 31 Interior boundary (in) Minnelusa .0018 17.0 1,463 -2.8
-6.1 8 Outflow Madison .0039 14.4 90 .3
-6.1 24 Outflow Minnelusa .0072 14.4 90 .6

Hydrologic Budgets 47
Subarea 8
-35.6 13 Interior boundary (out) Madison 0.0019 10.4 1,463 1.8
-35.6 31 Interior boundary (out) Minnelusa .0018 17.0 1,463 2.8
-35.6 14 Interior boundary (in) Madison .0017 15.2 7,393 -12.2
-35.6 32 Interior boundary (in) Minnelusa .0025 10.0 7,393 -11.5
-35.6 1 Inflow Madison .0017 15.2 4,349 -11.0
-35.6 9 Outflow Madison .0025 12.0 732 1.3
-35.6 10 Outflow Madison .0034 6.0 732 .9
-35.6 16 Inflow Minnelusa .0020 24.9 4,349 -13.0
-35.6 25 Outflow Minnelusa .0089 12.0 732 4.8
-35.6 26 Outflow Minnelusa .0016 6.0 732 .4
Subarea 9
48.6 14 Interior boundary (out) Madison .0017 15.2 7,393 12.2
48.6 32 Interior boundary (out) Minnelusa .0025 10.0 7,393 11.5
48.6 11 Outflow Madison .0147 37.1 591 19.7
48.6 27 Outflow Minnelusa .0050 29.3 591 5.3
1A positive flow indicates net outflow, and a negative flow indicates net inflow.2Flows may not sum exactly to flow total for zone due to independent rounding; a positive flow indicates outflow, and a negative
flow indicates inflow.
Table 15. Estimates of transmissivity and flow for flow zones–Continued
[ft3/s, cubic feet per second; ft2/d, feet squared per day]
Ground-water flow1
total for subarea
(ft3/s)
Flow zone number
Flowdirection
AquiferHydraulic gradient
Length of flow zone
(miles)
Transmis-sivity(ft2/d)
Ground-water
flow2 for flow zone
(ft3/s)
Subareas 3 and 4 also share a common interior flow zone; thus, transmissivities are calculated using the same approach as subareas 1 and 2. Assuming equal transmissivity for exterior outflow zones 3, 4, 5, 19, 20, and 21 in subareas 3 and 4 yields values of 510 ft2/d, which then can be used to solve for other flow components. Transmissivity for interior flow zone 28 is calculated as 712 ft2/d, which is about 1.4 times higher than the estimated transmissivity for the exterior outflow zones.
In the Minnelusa aquifer, some flow from sub-area 5 into subarea 6 is indicated by interior flow zone 29 in figure 16. A viable solution to equation 5 for sub-areas 5 and 6 does not exist using the same approach as used for subareas 1-4. Therefore, transmissivity for subarea 5 is solved by using only the net outflow of 6.0 ft3/s (table 12) for that subarea. Transmissivities of
exterior outflow zones 6 and 22 are assumed to be equal, while the transmissivity for interior flow zone 29 is assumed to be 1.4 times the transmissivity of the exterior outflow zones, which is the resulting factor in subareas 3 and 4. This yields transmissivity estimates of 310 ft2/d for the two exterior outflow zones and 434 ft2/d for the interior flow zone.
The previous calculation yielded a transmissivity estimate for interior flow zone 29. A similar approach to subarea 5 is used to calculate transmissivity for interior flow zone 30 and the exterior outflow zones 7 and 23. The transmissivity of interior flow zone 30 is assumed to be 1.4 times the transmissivity of exterior outflow zones 7 and 23, which is the resulting factor used in previous calculations. This yields transmis-sivity estimates of 1,463 ft2/d for interior flow zone 30 and 1,045 ft2/d for exterior outflow zones 7 and 23.

48 Hydrologic Budgets for the Madison and Minnelusa Aquifers, Black Hills Area, Water Years 1987-96
A similar approach is used in subarea 7, where the transmissivity estimate for interior flow zone 30 is known from a previous calculation. However, in this case, the transmissivities in interior flow zones 13 (Madison aquifer) and 31 (Minnelusa aquifer) are assumed to be equal to the transmissivity for interior flow zone 30. This assumption is made on the basis that the transmissivity must be sufficiently high along this interior boundary to supply flow from subarea 8 to large artesian springs in subarea 7. Transmissivities should be much higher for interior flow zones 13 and 31 than for the exterior outflow zones 8 and 24 due to: (1) decreasing saturated thickness in the Madison aquifer at distance from the outcrop as the thickness of the Madison Limestone approaches zero in this area (Rahn, 1986); and (2) major structural features that are present in the vicinity of interior flow zones 13 and 31 (fig. 4). Equation 5 is solved for exterior outflow zones 8 and 24 using the estimated transmissivity of 1,463 ft2/d for all three interior flow zones. This yields a transmissivity estimate of 90 ft2/d for exterior out-flow zones 8 and 24.
In subarea 8, transmissivity calculations are complicated by the numerous flow zones. Transmis-sivities for interior flow zones 13 and 31 were esti-mated in previous calculations, but transmissivities have not been estimated for the remaining eight flow zones. First, it is assumed that the transmissivities for exterior outflow zones 9, 10, 25, and 26 are equal to each other, and are equal to one-half the transmissivity for interior flow zones 13 and 31 due to thinning of the Madison Limestone. This yields a transmissivity esti-mate of 732 ft2/d for the exterior outflow zones. Next, it is assumed that the transmissivity for interior flow zones 14 and 32 in the southwestern part of the study area is equal to 1.7 times the transmissivity for exterior inflow zones 1 and 16, which is the resulting factor determined in subareas 1 and 2. Then, equation 5 is solved, which yields transmissivity estimates of 7,393 ft2/d for interior flow zones 14 and 13 and 4,349 ft3/d for exterior inflow zones 1 and 16. Although the transmissivity estimates for the flow zones in the southwestern part of the study area are within ranges determined by previous investigations (table 14), they are higher than for any other flow zones in the study area. This is consistent with very low hydraulic gradients in the vicinity of these flow zones, which generally indicates high transmissivity.
For subarea 9, transmissivities for interior flow zones 14 and 32 were determined by previous
calculations. Equation 5 is solved for exterior outflow zones 11 and 27, which yields a transmissivity estimate of 591 ft2/d. It is expected that the transmissivity for exterior outflow zones 11 and 27 would be much less than for flow zones further south in subarea 8 because neither the Madison nor Minnelusa aquifer is fully sat-urated along the entire length of the exterior outflow zones in subarea 9. In addition, exterior outflow zones 11 and 27 have a higher hydraulic gradient, especially in the Madison aquifer, than flow zones to the south, indicating lower transmissivity.
Evaluation of Budget Components
As discussed, development of subarea budgets allows evaluation of various budget components. Transmissivity estimates range from 90 ft2/d to about 7,400 ft2/d, which are similar to values reported by previous investigators (table 14). The highest trans-missivity values are for areas in the northern and south-western parts of the study area, and the lowest values are along the eastern study area boundary (figs. 15 and 16). It is emphasized that the transmissivity esti-mates are averages over larger areas than can be obtained using aquifer test data, and large spatial vari-ability in actual transmissivities can be expected. The potential for large errors exists in estimates of transmis-sivity and flow components because calculations are based on net outflow estimates and assumptions of equal transmissivity.
Most of the transmissivity estimates are derived for flow zones located considerable distances from the outcrops. Transmissivities probably are higher nearer the outcrop areas due to structural deformation and dis-solution activity. Extremely high transmissivity prob-ably occurs in the immediate vicinity of artesian springs, where large, focused discharge occurs. Trans-missivities probably decrease downgradient from large artesian springs due to reduced dissolution activity. Basinward decreases in transmissivity were hypothe-sized by Huntoon (1985) as a major factor in artesian spring development, which is consistent with transmis-sivity calculations for subareas 1, 2, 3, and 4 that resulted in lower estimates for the exterior flow zones than for interior flow zones. In other subareas, lower transmissivities were assumed in exterior flow zones than in interior flow zones.
Uncertainties associated with estimates of streamflow recharge probably are small, relative to uncertainties associated with estimates of precipitation recharge (Carter and others, 2001). Evaluation of

Hydrologic Budgets 49
subarea budgets provides confidence that the yield effi-ciency algorithm systematically provides realistic esti-mates for precipitation recharge. A good example for evaluating precipitation recharge is subarea 1, which has a large component of artesian springflow that aver-ages about 90 ft3/s for 1987-96 (table 12). Streamflow recharge, which averages 9.6 ft3/s, is especially small for this subarea, which is dominated by precipitation recharge of about 121 ft3/s. Net outflow of 29.6 ft3/s is consistent with a conclusion by Naus and others (in press) from geochemical evidence that flow in this area is dominated by areal recharge, with minor or negli-gible influence from regional flowpaths from the west. The collective evidence provides confidence that the methods used for estimating precipitation recharge per-form well for this area, which has the highest rates for precipitation recharge in the study area.
The large change in storage (table 12) for sub-area 2 (about 69,000 acre-ft) results primarily from a large net outflow rate and a large differential in stream-flow recharge rates between the dry and wet periods. The large storage change is consistent with large water-level fluctuations (figs. 1 and 8) for the Tilford wells (sites 4 and 5) and for another pair of observation wells (not shown) located northwest of Sturgis, where fluctu-ations of about 50 ft have occurred during 1987-96 (Driscoll, Bradford, and Moran, 2000).
In comparison, changes in storage are much smaller for subareas 3 and 5, both of which have much smaller differentials in both streamflow and precipita-tion recharge rates. Both of these subareas are influ-enced by artesian springs with highly variable discharge rates, relative to most other artesian springs (table 12). Water-level data for subarea 5 are sparse; however, the Piedmont wells in subarea 3 (sites 6 and 7) show relatively small water-level fluctuations (figs. 1 and 8).
Budgets for subareas in the southern Black Hills are consistent with geochemical interpretations (Naus and others, in press), which indicated long flowpaths along the western and southwestern flanks contributing to large artesian springs in the area. The average dis-charge of Beaver Creek Spring (tables 5 and 12) exceeds estimated recharge in subarea 7 and probably is influenced by outflow from subarea 8, which is con-sistent with the geochemical information. Similarly, discharges of artesian springs in subarea 8 are much larger than recharge in this subarea. Outflow from subarea 9 is a probable source for inflow to subarea 8,
which again is substantiated by geochemical informa-tion (Naus and others, in press).
Consideration of combined budgets for subareas 7, 8, and 9 provides useful insights. Com-bined streamflow and precipitation recharge of 74.5 ft3/s exceeds discharge of springs and wells (67.6 ft3/s) for these subareas, indicating net ground-water outflow of 6.9 ft3/s. This combined budget is again consistent with a geochemical interpretation by Naus and others (in press) that the large springs in this area are recharged primarily within the uplift area, and the influence of regional flow from the west probably is minor or negligible.
Although regional flow from the west probably does not contribute substantially to ground-water flow in the southern part of the study area, the complex potentiometric surfaces and ground-water flowpaths in this area may be affected by regional influences such as flowpaths and pinching out of the Madison Limestone to the southeast. Because of sparsity of data points (Strobel and others, 2000), large uncertainties exist for the potentiometric-surface maps, which affects both postulated flowpaths and gradients used for calculation of transmissivity and subdivided flow for the Madison and Minnelusa aquifers.
The aforementioned factors probably contribute to possible inconsistencies in estimated flow compo-nents and associated transmissivity values along the southwestern boundary of the study area, where esti-mates should be used with caution. The assumption of orthogonal flowpaths necessitates westerly flow com-ponents out of subarea 9 and back into subarea 8, which may not be entirely realistic. The small trans-missivity estimates for exterior outflow zones 11 and 27 result from steep hydraulic gradients and may be heavily influenced by unconfined conditions. Con-versely, the hydraulic gradients are very low for flow zones 1, 14, 16, and 32, which results in large transmis-sivity estimates for these zones. Despite uncertainties in accurate mapping of hydraulic heads, there is cer-tainty that hydraulic gradients are very low in the southwest corner of the study area and that large flow components out of subarea 9 exist. Thus, high trans-missivities must occur somewhere in the vicinity of subarea 9 to allow large flow components with low hydraulic gradients.

50 Hydrologic Budgets for the Madison and Minnelusa Aquifers, Black Hills Area, Water Years 1987-96
SUMMARY AND CONCLUSIONS
The Madison and Minnelusa aquifers are two of the most important aquifers in the Black Hills area of South Dakota and Wyoming. The quantification and evaluation of various hydrologic budget components are important for managing and understanding the water resources in the Black Hills area.
The basic continuity equation (Sum of inflows - Sum of outflows = Change in storage) is used to develop hydrologic budgets for two scenarios, including an overall budget for the entire study area and more detailed budgets for subareas. The overall budget is a combined budget for the Madison and Minnelusa aquifers because most budget components cannot be quantified individually for the aquifers. This average budget is computed for water years 1987-96, for which change in storage is approximately equal to zero, based on well hydrographs and recharge esti-mates. Estimates of well withdrawals are presented by aquifer, and for some budget components additional information for other time periods also is presented. Annual estimates of budget components are included in detailed budgets for nine subareas, which consider periods of decreasing storage (1987-92) and increasing storage (1993-96). The detailed budgets also are com-bined budgets; however, estimates of ground-water flow for each aquifer are derived.
Inflows considered include recharge, leakage from adjacent aquifers, and ground-water inflows across the study area boundary. Recharge, which occurs at or near land surface, includes infiltration of precipitation on outcrops of the Madison Limestone and Minnelusa Formation, and streamflow recharge where streams cross the outcrops. Outflows include springflow (headwater and artesian), well withdrawals, leakage to adjacent aquifers, and ground-water outflow across the study area boundary.
Leakage to and from adjacent aquifers, which is difficult to quantify and cannot be distinguished from ground-water inflows or outflows, is included with these components. Similarly, ground-water inflows and outflows are difficult to quantify individually; thus, for cases when change in storage is assumed equal to zero, net ground-water flow (outflow minus inflow) can be calculated, given estimates for the other budget components.
For the overall budget for water years 1987-96, net ground-water outflow from the study area is com-puted as 100 ft3/s (cubic feet per second). Estimates of average, combined budget components for the Mad-
ison and Minnelusa aquifers are: 395 ft3/s for recharge, 78 ft3/s for headwater springflow, 189 ft3/s for artesian springflow, and 28 ft3/s for well withdrawals. Thus, artesian springflow is the single largest outflow com-ponent. Total springflow (including headwater and artesian springflow) averages 267 ft3/s, which consti-tutes about 68 percent of estimated recharge.
Estimates of recharge to the Madison and Min-nelusa aquifers used in the hydrologic budgets are from a previous investigation. During 1987-96, recharge ranged from about 141 to 847 ft3/s and averaged about 395 ft3/s. Of this amount, about 104 ft3/s (26 percent) was contributed by streamflow recharge and 291 ft3/s (74 percent) was from infiltration of precipitation on outcrop areas.
Headwater springflow is considered to be that which occurs upstream from streamflow loss zones, primarily within the Limestone Plateau area, which is an important recharge area for the Madison and Min-nelusa aquifers on the western flanks of the Black Hills. A ground-water divide has been identified in the Lime-stone Plateau area, with recharge to the east of the divide assumed to discharge to headwater springs along the eastern fringe of the plateau. Incongruences between contributing surface- and ground-water areas also are identified for various drainage basins in this area. Estimates of headwater springflow are derived from estimates of precipitation recharge for contrib-uting ground-water areas east of the divide. Precipita-tion recharge is estimated using a “yield efficiency algorithm” developed by previous investigators that compares spatial distributions for annual precipitation, average annual precipitation, and average efficiency of basin yield, which is used as a surrogate for efficiency of precipitation recharge. Average headwater spring-flow for 1987-96 is estimated as 78 ft3/s, based on esti-mates of annual recharge that ranged from about 16 to 215 ft3/s. Variability in annual springflow is much smaller because of attenuation associated with ground-water storage.
Artesian springflow is considered to be that which originates from confined aquifers in locations downgradient from streamflow loss zones. Estimates of artesian springflow for 1987-96 ranged from about 163 to 246 ft3/s and averaged 189 ft3/s.
Well withdrawals serve many categories of water use including municipal, self supply (domestic), irriga-tion, livestock, industrial, mining, thermoelectric power, and unaccountable withdrawals. Total well withdrawals from the Madison and Minnelusa aquifers

References 51
are about 18.3 million gallons per day (28 ft3/s), with about 60 percent of overall withdrawals from the Madison aquifer. Municipal use, with combined with-drawals of about 6.5 million gallons per day, is the largest use category.
Hydrologic budgets also are quantified for nine subareas for periods of decreasing storage (1987-92) and increasing storage (1993-96), with changes in storage assumed equal but opposite. Common sub-areas are identified for the Madison and Minnelusa aquifers, and previous components from the overall budget are distributed over the subareas, excluding headwater springflow and recharge for areas contrib-uting to headwater springflow. An estimate of net ground-water flow for the two aquifers is computed for each subarea using an iterative process until the volu-metric change in storage for the two periods are approximately equal, but opposite. For most subareas, net ground-water outflow exceeds inflow, and ranges from 5.9 ft3/s in the area east of Rapid City to 48.6 ft3/s along the southwestern flanks of the Black Hills. Net ground-water inflow exceeds outflow for two subareas where the discharge of large artesian springs exceeds estimated recharge within the subareas.
More detailed subarea budgets also are devel-oped, which include estimates of flow components for the individual aquifers at specific flow zones. The net outflows and inflows from the preliminary subarea budgets are used to estimate transmissivity and flow across exterior flow zones corresponding with parts of the study area boundary and interior flow zones between subareas based on Darcy’s Law. For estima-tion purposes, it is assumed that transmissivities of the Madison and Minnelusa aquifers are equal in corre-sponding flow zones. Equal transmissivities also are assumed, when possible, for exterior flow zones within an individual subarea. Calculated transmissivities for several interior flow zones are larger than for nearby exterior flow zones, which is consistent with general basinward decreases in transmissivity.
The resulting transmissivity estimates range from 90 ft2/d to about 7,400 ft2/d, which is similar to values reported by previous investigators. The highest transmissivity estimates are for areas in the northern and southwestern parts of the study area and the lowest transmissivity estimates are along the eastern study area boundary. Because the transmissivity estimates are averages over large areas, much larger spatial variability in actual transmissivities can be expected.
Evaluation of subarea budgets provides confi-dence in budget components developed for the overall budget. Recharge estimates are consistently compat-ible with other budget components, including artesian springflow, which is a dominant component in many subareas. Calculated storage changes for subareas also are consistent with other budget components, specifi-cally artesian springflow and net ground-water flow, and also are consistent with water-level fluctuations for observation wells. Ground-water budgets and flow-paths are especially complex in the southern Black Hills area; however, budget results are consistent with geochemical interpretations by previous investigators.
The overall results are particularly beneficial in corroborating a systematic method for estimation of precipitation recharge developed by previous investi-gators. Uncertainties associated with estimates of precipitation recharge are inherently larger than for streamflow recharge, which, in many cases, can be based on discrete measurements. Although uncertain-ties cannot be specifically evaluated, the hydrologic budgets do provide confidence that realistic estimates for precipitation recharge are obtained for a wide variety of recharge conditions.
REFERENCES
Amundson, F.D., 1998, Estimated use of water in South Dakota, 1995: U.S. Geological Survey Open-File Report 98-268, 18 p.
Back, W., Hanshaw, B.B., Plummer, L.N., Rahn, P.H., Right-mire, C.T., and Rubin, M., 1983, Process and rate of dedolomitization—Mass transfer and 14C dating in a regional carbonate aquifer: Geological Society of America Bulletin, v. 94, no. 12, p. 1415-1429.
Blankennagel, R.K., Howells, L.W., and Miller, W.R., 1981, Completion and testing of Madison Limestone Test Well 3: U.S. Geological Survey Open-File Report 81-528, 91 p.
Blankennagel, R.K., Miller, W.R., Brown, D.L., and Cush-ing, E.M., 1977, Report on preliminary data for Madison Limestone test well 1, NE1/4SE1/4 Sec. 15, T. 57N., R. 65W., Crook County, Wyoming: U.S. Geological Survey Open-File Report 77-164, 97 p., 3 pl.
Braddock, W.A., 1963, Geology of the Jewel Cave SW quad-rangle, Custer County, South Dakota: U.S. Geological Survey Bulletin 1063-G, p. 217-268.

52 Hydrologic Budgets for the Madison and Minnelusa Aquifers, Black Hills Area, Water Years 1987-96
Carter, J.M., Driscoll, D.G., and Hamade, G.R., 2001, Esti-mated recharge to the Madison and Minnelusa aquifers in the Black Hills area, South Dakota and Wyoming, water years 1931-98: U.S. Geological Survey Water-Resources Investigations Report 00-4278, 66 p.
Carter, J.M., and Redden, J.A., 1999a, Altitude of the top of the Inyan Kara Group in the Black Hills area, South Dakota: U.S. Geological Survey Hydrologic Investiga-tions Atlas HA-744-A, 2 sheets, scale 1:100,000.
———1999b, Altitude of the top of the Minnekahta Lime-stone in the Black Hills area, South Dakota: U.S. Geological Survey Hydrologic Investigations Atlas HA-744-B, 2 sheets, scale 1:100,000.
———1999c, Altitude of the top of the Minnelusa Forma-tion in the Black Hills area, South Dakota: U.S. Geological Survey Hydrologic Investigations Atlas HA-744-C, 2 sheets, scale 1:100,000.
———1999d, Altitude of the top of the Madison Limestone in the Black Hills area, South Dakota: U.S. Geological Survey Hydrologic Investigations Atlas HA-744-D, 2 sheets, scale 1:100,000.
———1999e, Altitude of the top of the Deadwood Forma-tion in the Black Hills area, South Dakota: U.S. Geological Survey Hydrologic Investigations Atlas HA-744-E, 2 sheets, scale 1:100,000.
Cooley, R.L., Konikow, L.F., and Naff, R.L., 1986, Nonlin-ear-regression groundwater flow modeling of a deep regional aquifer system: Water Resources Research, v. 22, no. 13, p. 1759-1778.
DeWitt, Ed, Redden, J.A., Buscher, David, and Wilson, A.B., 1989, Geologic map of the Black Hills area, South Dakota and Wyoming: U.S. Geological Survey Map I-1910, scale 1:250,000.
DeWitt, Ed, Redden, J.A., Wilson, A.B., and Buscher, David, 1986, Mineral resource potential and geology of the Black Hills Nations Forest, South Dakota and Wyo-ming: U.S. Geological Survey Bulletin 1580, 135 p.
Downey, J.S., 1982, Geohydrology of the Madison and associated aquifers in parts of Montana, North Dakota, South Dakota, and Wyoming: U.S. Geological Survey Open-File Report 82-914, 108 p.
Downey, J.S., and Dinwiddie, G.A., 1988, The regional aquifer system underlying the Northern Great Plains in parts of Montana, North Dakota, South Dakota, and Wyoming—Summary: U.S. Geological Survey Professional Paper 1402-A, 64 p.
Driscoll, D.G., 1992, Plan of study for the Black Hills Hydrology Study, South Dakota: U.S. Geological Survey Open-File Report 92-84, 10 p.
Driscoll, D.G, Bradford, W.L., and Moran, M.J., 2000, Selected hydrologic data, through water year 1998, Black Hills Hydrology Study, South Dakota: U.S. Geological Survey Open-File Report 00-70, 284 p.
Driscoll, D.G., Hamade, G.R., and Kenner, S.J., 2000, Summary of precipitation data for the Black Hills area of South Dakota, water years 1931-98: U.S. Geological Survey Open-File Report 00-329, 151 p.
Gott, G.B., Wolcott, D.E., and Bowles, C.G., 1974, Stratig-raphy of the Inyan Kara Group and localization of uranium deposits, southern Black Hills, South Dakota and Wyoming: U.S. Geological Survey Professional Paper 763, 57 p.
Greene, E.A., 1993, Hydraulic properties of the Madison aquifer system in the western Rapid City area, South Dakota: U.S. Geological Survey Water-Resources Investigations Report 93-4008, 56 p.
Greene, E.A., Shapiro, A.M., and Carter, J.M., 1999, Hydro-geologic characterization of the Minnelusa and Madison aquifers near Spearfish, South Dakota: U.S. Geological Survey Water-Resources Investigations Report 98-4156, 64 p.
Gries, J.P., 1975, Mineral and water resources of South Dakota: U.S. Congress, 94th, 1st Session, Interior and Insular Affairs Committee Print, 313 p.
———1996, Roadside geology of South Dakota: Missoula, Mont., Mountain Press Publishing Co., 358 p.
Hamade, G.R., 2000, Hydrologic budget of the Madison-Minnelusa aquifer system in the Black Hills area, for the period of record from 1987 to 1998: Rapid City, South Dakota School of Mines and Technology, unpub-lished Ph.D. dissertation, 173 p.
Hortness, J.E., and Driscoll, D.G., 1998, Streamflow losses in the Black Hills of western South Dakota: U.S. Geological Survey Water-Resources Investigations Report 98-4116, 99 p.
Huntoon, P.W., 1985, Rejection of recharge water from Madison aquifer along eastern perimeter of Bighorn Artesian Basin, Wyoming: Ground Water, v. 23, no. 3, p. 345-353.
Imam, Mozaffer, 1991, Factors affecting the yield of Madi-son wells in the Black Hills: Rapid City, South Dakota School of Mines and Technology, unpublished M.S. thesis, 96 p.
Jarrell, G.J., 2000, Delineation of ground-water basins on the Limestone Plateau, Black Hills, South Dakota: Rapid City, South Dakota School of Mines and Technology, unpublished M.S. thesis, 73 p.
Johnson, B.N., 1933, A climatological review of the Black Hills: The Black Hills Engineer, Rapid City, South Dakota School of Mines and Technology, 71 p.
Konikow, L.F., 1976, Preliminary digital model of ground-water flow in the Madison Group, Powder River Basin and adjacent areas, Wyoming, Montana, South Dakota, North Dakota, and Nebraska: U.S. Geological Survey Water-Resources Investigations Report 63-75, 44 p., 6 pl.

References 53
Kyllonen, D. P., and Peter, K.D., 1987, Geohydrology and water quality of the Inyan Kara, Minnelusa, and Madison aquifers of the Northern Black Hills, South Dakota and Wyoming, and Bear Lodge Mountains, Wyoming: U.S. Geological Survey Water-Resources Investigations Report 86-4158, 61 p.
Long, A.J., 2000, Modeling techniques for karst aqui-fers—anisotropy, dual porosity, and linear systems analysis: Rapid City, South Dakota School of Mines and Technology, unpublished Ph.D. dissertation, 59 p.
Miller, L.D., and Driscoll, D.G., 1998, Streamflow charac-teristics for the Black Hills of South Dakota, through water year 1993: U.S. Geological Survey Water-Resources Investigations Report 97-4288, 322 p.
Miller, W.R., 1976, Water in carbonate rocks of the Madison Group in southeastern Montana; a preliminary evalua-tion: U.S. Geological Survey Water-Supply Paper 2043, 51 p.
Naus, C.A., Driscoll, D.G., and Carter, J.M., in press, Geochemistry of the Madison and Minnelusa aquifers in the Black Hills area, South Dakota: U.S. Geological Survey Water-Resources Investigations Report 01-4129.
Orr, H.K., 1959, Precipitation and streamflow in the Black Hills: U.S. Department of Agriculture, Forest Service, Rocky Mountain Forest and Range Experiment Station Paper No. 44, 25 p.
Pakkong, Mongkol, 1979, Ground water of the Boulder Park area, Lawrence County, South Dakota: Rapid City, South Dakota School of Mines and Technology, unpub-lished M.S. thesis, 91 p., 4 pl.
Peter, K.D., 1985, Availability and quality of water from the bedrock aquifers in the Rapid City area, South Dakota: U.S. Geological Survey Water-Resources Investiga-tions Report 85-4022, 34 p.
Rahn, P.H., 1985, Ground water stored in the rocks of western South Dakota, in Rich, F.J., ed., Geology of the Black Hills, South Dakota and Wyoming (2d ed.): Geological Society of America, Field Trip Guidebook, American Geological Institute., p. 154-174.
Rahn, P.H., and Gries, J.P., 1973, Large springs in the Black Hills, South Dakota and Wyoming: South Dakota Geological Survey Report of Investigations 107, 46 p.
Strobel, M.L., Jarrell, G.J., Sawyer, J.F., Schleicher, J.R., and Fahrenbach, M.D., 1999, Distribution of hydrogeologic units in the Black Hills area, South Dakota: U.S. Geological Survey Hydrologic Investigations Atlas HA-743, 3 sheets, scale 1:100,000.
Swenson, F.A., 1968, New theory of recharge to the artesian basin of the Dakotas: Geological Society of America Bulletin 1081-B, p. 163-182.
Tan, Xiaodan, 1994, Potentiometric surfaces, recharge rates, and hydraulic conductivities of the Madison and Minnelusa aquifers in the Rapid Creek basin above Rapid City, South Dakota: Rapid City, South Dakota School of Mines and Technology, unpublished M.S. thesis, 74 p.
U.S. Department of Commerce, 1999, Climatological data for South Dakota, annual summary: Asheville, North Carolina (issued annually).
U.S. Geological Survey, 1988-98, Water resources data for South Dakota, water years 1987-97: U.S. Geological Survey Water-Data Reports SD-87-1 to SD-97-1 (pub-lished annually).
Wahl, K.L., and Wahl, T.L., 1995, Determining the flow of Comal Springs at New Braunfels, Texas: Proceedings of Texas Water ‘95, A Component Conference of the First International Conference on Water Resources Engineering, American Society of Civil Engineers, August 16-17, 1995, San Antonio, Texas, p. 77-86.
Wenker, G.A., 1997, Geological setting and water quality of headwater springs in the Black Hills of South Dakota: Rapid City, South Dakota School of Mines and Technology, unpublished M.S. thesis, 101 p.
Woodward-Clyde Consultants, 1980, Well-field hydrology technical report for the Energy Transportation Systems Incorporated Coal Slurry Pipeline Project: Woodward-Clyde Consultants, prepared for the U.S. Bureau of Land Management [variously paged].