Springer paper.pdf
13
See discussions, stats, and author profiles for this publication at: http://www.researchgate.net/publication/281226859 Decomposing the trade-environment nexus for Malaysia: what do the technique, scale, composition, and comparative advantage effect indicate? ARTICLE in ENVIRONMENTAL SCIENCE AND POLLUTION RESEARCH · AUGUST 2015 Impact Factor: 2.76 · DOI: 10.1007/s11356-015-5217-9 · Source: PubMed 4 AUTHORS, INCLUDING: Khalid Ahmed University of Cambridge 13 PUBLICATIONS 28 CITATIONS SEE PROFILE Rusnah Muhamad University of Malaya 22 PUBLICATIONS 54 CITATIONS SEE PROFILE Available from: Khalid Ahmed Retrieved on: 31 August 2015
-
Upload
shaikh-taimoor -
Category
Documents
-
view
302 -
download
7
Transcript of Springer paper.pdf

Seediscussions,stats,andauthorprofilesforthispublicationat:http://www.researchgate.net/publication/281226859
Decomposingthetrade-environmentnexusforMalaysia:whatdothetechnique,scale,composition,andcomparativeadvantageeffectindicate?
ARTICLEinENVIRONMENTALSCIENCEANDPOLLUTIONRESEARCH·AUGUST2015
ImpactFactor:2.76·DOI:10.1007/s11356-015-5217-9·Source:PubMed
4AUTHORS,INCLUDING:
KhalidAhmed
UniversityofCambridge
13PUBLICATIONS28CITATIONS
SEEPROFILE
RusnahMuhamad
UniversityofMalaya
22PUBLICATIONS54CITATIONS
SEEPROFILE
Availablefrom:KhalidAhmed
Retrievedon:31August2015
RESEARCH ARTICLE
Decomposing the trade-environment nexus for Malaysia: what dothe technique, scale, composition, and comparative advantageeffect indicate?
Chong Hui Ling1 & Khalid Ahmed2& Rusnah Binti Muhamad3
& Muhammad Shahbaz4
Received: 25 June 2015 /Accepted: 10 August 2015# Springer-Verlag Berlin Heidelberg 2015
Abstract This paper investigates the impact of trade open-ness on CO2 emissions using time series data over the periodof 1970QI-2011QIV for Malaysia. We disintegrate the tradeeffect into scale, technique, composition, and comparative ad-vantage effects to check the environmental consequence oftrade at four different transition points. To achieve the pur-pose, we have employed augmented Dickey-Fuller (ADF)and Phillips-Perron (PP) unit root tests in order to examinethe stationary properties of the variables. Later, the long-runassociation among the variables is examined by applyingautoregressive distributed lag (ARDL) bounds testing ap-proach to cointegration. Our results confirm the presence ofcointegration. Further, we find that scale effect has positiveand technique effect has negative impact on CO2 emissionsafter threshold income level and form inverted U-shaped rela-tionship—hence validates the environmental Kuznets curvehypothesis. Energy consumption adds in CO2 emissions.
Trade openness and composite effect improve environmentalquality by lowering CO2 emissions. The comparative advan-tage effect increases CO2 emissions and impairs environmen-tal quality. The results provide the innovative approach to seethe impact of trade openness in four sub-dimensions of tradeliberalization. Hence, this study attributes more comprehen-sive policy tool for trade economists to better design environ-mentally sustainable trade rules and agreements.
Keywords CO2 emissions . Trade openness . Economicgrowth . Environmental Kuznets curve . Scale effect .
Technique effect . Composition effect
Introduction
Today, developed world is in favor of opening economies aswell as for more trade openness, as trade openness has bene-ficial impact on economic growth. This rising level of tradeopenness has started the debate that changing trade patternmay bring environmental changes in the globe of world.Following standard Heckscher-Ohlin model of trade, a coun-try having relatively low factor price ratio would be relativelyenvironment abundant. Trade openness would increase spe-cialization in pollution-intensive products. This environmentdetrimental shift in the composition of output lies behind thepopular concern. Yet, following the Stolper-Samuelson theo-rem, the price paid for using environment would be bid-up andall firms would shift to less-pollution-intensive productiontechniques. In the standard Heckscher-Ohlin model, therewould be no change in the overall use of environment(Khalil and Inam 2006; Halicioglu 2009; Managi et al.2009; Baek et al. 2009). Grossman and Krueger (1991) startedthe debate that trade openness has significant impact on envi-ronmental quality. The proponents of trade openness treat
Responsible editor: Philippe Garrigues
* Khalid [email protected]
Chong Hui [email protected]
Rusnah Binti [email protected]
Muhammad [email protected]
1 Institute of Postgraduate Studies, University of Malaya, KualaLumpur, Malaysia
2 Institute of Business Administration, Sukkur, Pakistan3 Faculty of Business and Accountancy, University of Malaya, Kuala
Lumpur, Malaysia4 Department of Management Sciences, COMSATS Institute of
Information Technology, Lahore, Pakistan
Environ Sci Pollut ResDOI 10.1007/s11356-015-5217-9

quality of environment as a normal good, as the level of tradedincome rises, people attached with this income demand cleanenvironment. The authorities discourage the old and outdatedtechniques of production. The proponents of trade opennesssuppose that trade openness creates win-win situation whichimproves the economy and environment as a whole. But onother hand, opponents of trade openness claim that trade open-ness stimulates economic activity and quality of environmentis deteriorated if the techniques of production are unchanged.They suppose that if quality of environment is a normal good,then firms in developing countries move toward lower stan-dard of production due to relax rules and regulations of envi-ronment. This process may raise distribution of income atworld level; trade openness favors growth of pollution-intensive industries in case of developing countries, as devel-oped countries enforce strict environmental regulations, there-by having a significant adverse effect on environmental qual-ity (Copeland and Taylor 1994a, 2004; Copeland 2005).
Although theoretical relationship between trade opennessand environmental quality is not clear, but developed countrieshave recently raised concerns over the dirty industries of de-veloping countries, as it changes the structure of comparativeadvantages. Firms in developed countries have to face strictdomestic environmental regulations compared to developingcountries. But, on other hand, developing countries are con-cerned that trade liberalization will promote specialization indirty industries, thus aggravating environmental damage(Dean, l992). The modern world is now divided into tradeblocks, and trade openness has the potential to affect not onlysocio-economic well-being of the nations in trade block, butalso environmental quality enjoyed by all states involved in theagreements; that such a trade-environment relationship existsis well established and widely accepted (McArthur and Sachs2001; Todaro and Smith 2002; Baylis and Smith 2005). Suchtype of relationship is visible in trade liberalization agreementsamong countries with a marked developmental imbalance.
There is a wide range of literature available that empiricallyinvestigates trade-emissions nexus; however, the findings havebeen conflicting (Shahbaz et al. 2013a, b, c; Ahmed et al.2015). For example: Managi (2004) explores the environmen-tal consequence of trade liberalization and found positiveelasticity for both developing and developed countries, butthe later study of Frankel and Rose (2005) concludes that tradeopenness reduces emissions. Managi et al. (2009) argue thatenvironmental repercussions of trade depend upon the eco-nomic structure of the country and pollutants. Hence, the liter-ature reveals that in order to examine whether trade detrimentsenvironment, country-specific study is required and CO2
emission is found with the highest concentration in thedeveloping countries i.e., Malaysia. The recent studies ofSbia et al. (2014) and Farhani and Ozturk (2015) indicate thatenvironmental consequence of trade may also vary due toscale, technique, and composition effects in a particular
country. However, their theoretical statement is assessed in thisstudy. Malaysia’s emissions profile is influenced by severaldevelopment indicators. For example; the results of Solarin(2014) conclude that tourists significantly contribute to pollu-tion in Malaysia, Bekhet and Yasmin (2013) found that energyconsumption increases pollution both in long run and short run,Agus et al. (2013) conclude that palm oil industry also in-creases pollution, and Begum et al. (2015) found that GDPgrowth leads to pollution intensity in long run. However, tradeopenness has mixed results on environmental quality ofMalaysia. Saboori et al. (2012) conclude that trade opennessis not the major contributing factor in Malaysia, whereasSolarin (2014) found thatMalaysia’s exports to Singapore havepositive correlation with CO2 emissions. Although ample lit-erature has investigated the growth-environment nexus in caseof Malaysia, but due to involvement of several developmentindicators, the country’s emission profiles require further em-pirical investigations. The impact of trade liberalization mainlydepends on the simultaneous growth in technical knowhowand institutional quality. Hence, Malaysian government claimssubstantial investment on research and development in order tocontrol the potential environmental degradation caused by theindustrialization. Hence, whether the government initiative isgoing in the right direction and has potential to accomplishdesired environmental friendly sustainable development goalfor Malaysia is still in question. This study explores the impactof trade openness on environment using decomposed environ-mental Kuznets curve (EKC) hypothesis i.e., scale, technique,and composition effects. Moreover, the comparative advantageeffect is an additional exogenous factor.
The aim of this study is to examine the effect of tradeopenness on CO2 emissions. As an individual country, levelof income as well as the composition of traded commoditiesand level of emission intensity can give better understandingabout the effect of trade openness on CO2 emissions (Baeket al. 2009). This study is a healthy contribution toward re-spective literature by four folds: (i) it is pioneering effort in-vestigating the relationship between trade openness and CO2
emissions by adding scale, technique, composite, and compar-ative advantage effects in CO2 emission function, (ii) thebounds testing approach is applied for checking the presenceof cointegration between the variables along with test of unitroot properties of the series, and (iii) the long-run and short-run elasticities have been investigated by applying OLS andECM approaches. Finally, cause and effect between tradeopenness and CO2 emissions is examined by employing thevector error correction model (VECM) Granger causality test.We find that scale effect increases CO2 emissions, but tech-nique effect reduces CO2 emissions. Energy consumptionadds in CO2 emissions. The composition effect lowers CO2
emissions. Trade openness (trade effect) lowers CO2 emis-sions, but comparative advantage effect increases CO2 emis-sions. The causality analysis reports the bidirectional between
Environ Sci Pollut Res

energy consumption and CO2 emissions. The compositioneffect, trade effect, and comparative advantage effect causeenergy consumption and, hence, CO2 emissions.
Literature review
The existing empirical literature on trade-emissions nexus hasprovided mixed results, and a mutual consensus has not beendeveloped yet. Initially, Grossman and Krueger (1991) starteddebate on the relationship between trade openness andenvironmental quality. Later on, Lucas et al. (1992) examinedthe impact of trade openness on growth of toxic intensity ofoutput. They found that rapidly growing economies increasedtheir trade openness which further reduces toxic intensity ofoutput. Grossman and Krueger (1994) analyzed the relation-ship between trade openness and environmental quality incase of Mexico and its Northern neighbors. Their resultsshowed that trade openness increases Mexican specializationin unskilled labor-intensive industries, which in turn causes areduction in environmental pollution. Trade openness is help-ful in improving quality of environment via income growth,but strict regulations about environment quality increase effi-ciency and encourage innovations. This process further has apositive affect for a firm’s competitiveness and enhanced tradevolume (Porter and van der Linde 1995). Gale and Mendez(1998) investigated the linkages between trade openness, eco-nomic growth, and environment quality and found that risinglevel of income has detrimental impact on quality ofenvironment, but trade openness has insignificantrelationship with quality of environment. Dean (2002) ana-lyzed the effect of trade openness on environment and notedthat rising level of trade openness in international marketsaggravates environmental damage via terms of trade but mit-igates it via income growth (Ang 2008; Jalil and Mahmud2009; Menyah and Wolde-Rufael 2010; Ghosh 2010; Chang2010; Ozturk 2010). Levinson and Taylor (2001, 2008) foundthat strict environmental regulations are associated with largernet imports. So, foreign direct investment and quality of envi-ronment in case of developing countries have received lessattention. There are numbers of other studies which investi-gate that CO2 emissions and trade openness have long-runrelationship (Lee et al. 2009; Narayan and Narayan 2010;Bhattacharyya and Ghoshal 2010; Shahbaz et al. 2015b).
Liddle (2001), Antweiler et al. (2001), and Frankel andRose (2005) found that trade openness is good for environ-mental quality in case of developing and developed nations.On contrary, Kukla-Gryz (2009) supported that trade open-ness increases the level of air pollution in case of developingnations at first stage of economic growth. Moreover, Low andYeats (1992), Mani and Wheeler (1998), Dinda and Coondoo(2006), and Baek et al. (2009) mentioned that free trade mayhave detrimental impacts on environment in case of
developing countries, but trade openness may increase envi-ronmental quality in developed countries.Managi et al. (2009)examined the relationship between trade openness, economicdevelopment, and environmental quality using the instrumen-tal variables for OECD and non-OECD countries. They foundthat trade openness is beneficial for environmental quality vialowering CO2 emissions in OECD countries but increasesCO2 emissions in non-OECD countries. But, Iwata et al.(2012) reported that trade openness affects CO2 emissions inOECD countries insignificantly. Halicioglu (2009) investigat-ed the causal relationship between CO2 emissions, energyconsumption, economic growth, and trade openness usingTurkish data. The results indicated that trade openness leadsto CO2 emissions, and economic growth and energyconsumption are also contributing factors to CO2 emissions.But, Cole (2004) noted that developing countries do not fol-low rules and regulations of WTO, and as a result, tradeopenness reduces quality of environment there. Takeda andMatsuura (2006) exposed how quality of environmental isaffected by trade openness of Bdirty^ goods in case of EastAsian countries over the period of 1988–2000. Their empiricalfindings indicate that increasing exports in dirty industries toJapan and domestic industrialization in East Asia tend to raiseCO2 emissions in East Asian countries, while dirty importsfrom Japan and the USA do not affect CO2 emissions in thearea. Temurshoev (2006) analyzed the relationship betweentrade openness and quality of environment in developingeconomies. The results indicated that correlation between cap-ital intensity and pollution intensity of production was smalland thus raised doubts about the existence of factor endow-ment hypothesis. But, other studies found that differences inenvironmental regulations across countries are a significantdeterminant of trade flows (Van Beers and Van den Bergh1997; Harris and Sollis 2003; Busse 2004). However, the ar-guments based on the pollution haven hypothesis 1 have alsoprovided sufficient room for researchers to investigate thetrade-induced emissions in developing countries(Temurshoev 2006; Dietzenbacher and Mukhopadhyay2007; Kearsley and Riddel 2010).
Baek and Koo (2008) examined that foreign direct in-vestment (FDI) inflow impacts environmental quality inChina. Cole and Elliott (2003) used Chinese cities dataand concluded that the environmental effect of FDIinflows from Hong Kong, Macao, and Taiwan and otherforeign economies could be beneficial, detrimental, orneutral, depending on the pollutants being considered.Naranpanawa (2010) examined the causality between tradeopenness and CO2 emissions in case of Sri Lanka. The
1 The pollution haven hypothesis argues that since developed countrieshave stringent environmental regulations, hence the disadvantaged firmsrelocate their pollution-intensive productions to developing countrieswhere the regulations are soft.
Environ Sci Pollut Res
empirical results reported the presence of cointegrationbetween the series. The causality analysis unveiled thattrade openness is Granger cause of CO2 emissions inlong run, but in short run, trade openness Granger causesCO2 emissions. For Tunisian economy, Chebbi et al.(2010) examined the relationship between trade opennessand CO2 emissions. They found that trade openness in-creases CO2 emissions and the unidirectional causal rela-tion exists running from trade openness to CO2 emissions.
Forslid et al. (2011) explained that how internationaltrade affects environmental quality? They argued that in-ternational trade eases the firms to shift their economicactivities to those countries where environmental regula-tions are relaxed. Their empirical evidence reported thatcompetitive firms invest more in energy-efficienttechnologies and emit very less energy pollutants whichsave environment from degradation. Hoa (2012) appliedeconomic integration model to examine the relationshipbetween trade liberalization and CO2 emissions forChinese economy. The results show that economicgrowth is detrimental to environment, but trade opennessbenefits it. Similarly, Gu et al. (2013) reported trade open-ness Granger CO2 emissions. Kohler (2013) examined therelationship between trade liberalization, energy consump-tion, economic growth, and CO2 emissions for SouthAf r i ca . The resu l t s conf i rmed the presence ofcointegration between trade openness and CO2 emissions,and the bidirectional causality is validated between tradeopenness and quality of environment. In case of UnitedArab Emirates, Shahbaz et al. (2014c) used CO2 emissionfunction and reported that exports have positive impact onCO2 emissions while the feedback effect exists in exportsand CO2 emissions.
In case of Malaysia, various authors partially examinedthe effect of trade openness on CO2 emissions and listeddown ambiguous empirical evidence. For example,Shahbaz et al. (2013a, b, c) investigated whether tradeopenness affects CO2 emissions. They found that tradeopenness deteriorates CO2 emissions. Later on, Lau et al.(2014) examined the causal relationship between tradeopenness and CO2 emissions. They noted that thevariables are cointegrated for long run and trade opennessGranger causes economic growth and, hence, CO2
emissions. In other Asian countries such as Thailand,Arouri et al. (2014) reported that trade openness impedesenvironmental quality and the bidirectional causalrelationship exists between both the variables. Shahbazet al. (2014a, b) unveiled that trade openness increasesCO2 emissions, but the neutral effect exists between tradeopenness and CO2 emissions in case of Bangladesh andTunisia. Similarly, Tiwari et al. (2013) reported the posi-tive impact of trade openness on CO2 emissions andfeedback effect between both the variables. Shahbaz et al.
(2012b, c) and Ahmed and Long (2013) noted that tradeopenness lowers CO2 emissions, but Nasir and Rehman(2011) reported that trade openness deteriorates environ-mental quality in Pakistan. 2. Shahbaz et al. (2015a) ex-posed the relationship between trade openness (measuringby globalization index) and environmental degradation forIndian economy, and they noticed that trade opennessharms environmental quality in India. 3 Recently, Ibrahimand Law (2015) incorporated the role of institutions intrade-emission nexus for Sub-Saharan African countries.They found that trade-emission nexus is sensitive with in-stitutional quality, i.e., countries where institutional qualityis good, and trade is less harmful for environmental qualityand vice versa.
Empirical modeling and estimation strategy
The objective of present paper is to test the effect of tradeopenness on CO2 emissions via scale, technique, composite,and comparative advantage effects. Keeping in view ofMalaysia’s export led growth economic structure, we assumeenergy consumption has a significant role to play in suchscenario. However, trade openness does not only increase en-ergy consumption, but also sufficient liberalization enhancesenergy efficiency through spillover effect of technologicalchange in an economy. Similarly, the environmental impactof economic growth and trade openness changes as economypasses transition phase. In this regard, EKC hypothesisprovides standard tool to check inverted U relationshipbetween growth and environment. Considering the tradeopenness as exogenous variable, Cole (2006) suggests thattrade openness induces energy-efficient technology transfer,mass awareness to demand for clean environment, and gov-ernment policy direction toward environmental friendly eco-nomic policies. The environmental consequence of tradethrough energy consumption is varied through income effect,technique effect, and composition effect (Jena and Grote2008). The effect of comparative advantage on environmentdepends upon combined effect of overall composition of tradeof a country. Following Cole (2006), the general functionalform of model is given below:
Ct ¼ f Y t; Y2t ;Et;Kt;Ot;Kt:Ot
� � ð1Þ
We have transformed the variables into logarithmic form,and empirical form of model is given as follows:
2 Later on, Khalid et al. (2014) confirmed the findings by Shahbaz et al.(2012b, c)3 Shahbaz et al. (2015c) examined the validity of EKC for African coun-tries. Their analysis indicated the presence of EKC, and the feedbackeffect is noticed between economic growth and CO2 emissions.
Environ Sci Pollut Res
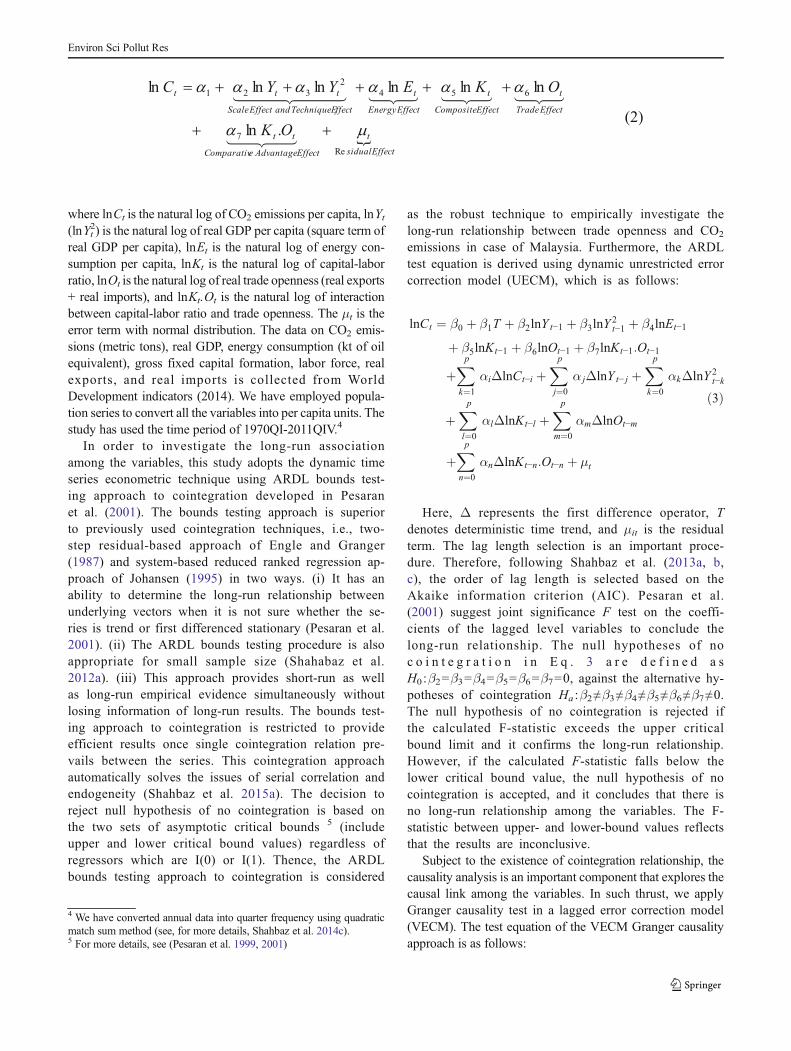
where lnCt is the natural log of CO2 emissions per capita, lnYt(lnYt
2) is the natural log of real GDP per capita (square term ofreal GDP per capita), lnEt is the natural log of energy con-sumption per capita, lnKt is the natural log of capital-laborratio, lnOt is the natural log of real trade openness (real exports+ real imports), and lnKt.Ot is the natural log of interactionbetween capital-labor ratio and trade openness. The μt is theerror term with normal distribution. The data on CO2 emis-sions (metric tons), real GDP, energy consumption (kt of oilequivalent), gross fixed capital formation, labor force, realexports, and real imports is collected from WorldDevelopment indicators (2014). We have employed popula-tion series to convert all the variables into per capita units. Thestudy has used the time period of 1970QI-2011QIV.4
In order to investigate the long-run associationamong the variables, this study adopts the dynamic timeseries econometric technique using ARDL bounds test-ing approach to cointegration developed in Pesaranet al. (2001). The bounds testing approach is superiorto previously used cointegration techniques, i.e., two-step residual-based approach of Engle and Granger(1987) and system-based reduced ranked regression ap-proach of Johansen (1995) in two ways. (i) It has anability to determine the long-run relationship betweenunderlying vectors when it is not sure whether the se-ries is trend or first differenced stationary (Pesaran et al.2001). (ii) The ARDL bounds testing procedure is alsoappropriate for small sample size (Shahabaz et al.2012a). (iii) This approach provides short-run as wellas long-run empirical evidence simultaneously withoutlosing information of long-run results. The bounds test-ing approach to cointegration is restricted to provideefficient results once single cointegration relation pre-vails between the series. This cointegration approachautomatically solves the issues of serial correlation andendogeneity (Shahbaz et al. 2015a). The decision toreject null hypothesis of no cointegration is based onthe two sets of asymptotic critical bounds 5 (includeupper and lower critical bound values) regardless ofregressors which are I(0) or I(1). Thence, the ARDLbounds testing approach to cointegration is considered
as the robust technique to empirically investigate thelong-run relationship between trade openness and CO2
emissions in case of Malaysia. Furthermore, the ARDLtest equation is derived using dynamic unrestricted errorcorrection model (UECM), which is as follows:
lnCt ¼ β0 þ β1T þ β2lnY t−1 þ β3lnY2t−1 þ β4lnEt−1
þ β5lnKt−1 þ β6lnOt−1 þ β7lnKt−1:Ot−1
þXp
k¼1
αiΔlnCt−i þXp
j¼0
α jΔlnY t− j þXp
k¼0
αkΔlnY 2t−k
þXp
l¼0
αlΔlnKt−l þXp
m¼0
αmΔlnOt−m
þXp
n¼0
αnΔlnKt−n:Ot−n þ μt
ð3Þ
Here, Δ represents the first difference operator, Tdenotes deterministic time trend, and μit is the residualterm. The lag length selection is an important proce-dure. Therefore, following Shahbaz et al. (2013a, b,c), the order of lag length is selected based on theAkaike information criterion (AIC). Pesaran et al.(2001) suggest joint significance F test on the coeffi-cients of the lagged level variables to conclude thelong-run relationship. The null hypotheses of noc o i n t e g r a t i o n i n E q . 3 a r e d e f i n e d a sH0 :β2=β3=β4=β5=β6=β7=0, against the alternative hy-potheses of cointegration Ha :β2≠β3≠β4≠β5≠β6≠β7≠0.The null hypothesis of no cointegration is rejected ifthe calculated F-statistic exceeds the upper criticalbound limit and it confirms the long-run relationship.However, if the calculated F-statistic falls below thelower critical bound value, the null hypothesis of nocointegration is accepted, and it concludes that there isno long-run relationship among the variables. The F-statistic between upper- and lower-bound values reflectsthat the results are inconclusive.
Subject to the existence of cointegration relationship, thecausality analysis is an important component that explores thecausal link among the variables. In such thrust, we applyGranger causality test in a lagged error correction model(VECM). The test equation of the VECM Granger causalityapproach is as follows:
4 We have converted annual data into quarter frequency using quadraticmatch sum method (see, for more details, Shahbaz et al. 2014c).5 For more details, see (Pesaran et al. 1999, 2001)
Environ Sci Pollut Res

1−Lð Þ
lnCt
lnYlnY 2
tlnKt
lnOt
lnKt:Ot
26666664
37777775¼
a1a2a3a4a5
266664
377775þXp
i¼1
1−Lð Þ
b11i b12i b13i b14i b15i b16ib21i b22i b23i b24i b25i b26ib31i b32i b33i b43i b53i b36ib41i b42i b43i b44i b45i b46ib51i b52i b53i b54i b55i b56ib61i b62i b63i b64i b65i b66i
26666664
37777775�
lnCt−1lnY t−1lnY 2
t−1lnKt−1lnOt−1lnKt−1:Ot−1
26666664
37777775
þ
αβδθϑϕ
26666664
37777775ECTt−1 þ
ε1tε2tε3tε4tε5tε6t
26666664
37777775
ð4Þ
Besides the variables in the above equation, (1−L) denotesdifference operator and ECTt-1 represents lagged error-correction term taken from the long-run relationship. Theterms ε1t,ε2t,ε3t,ε4t,ε5t and ε6t are the residuals. These sto-chastic terms are assumed to be homoscedastic. The statisticalsignificance of the coefficient of lagged error term, i.e., ECTt−
1, shows the long-run causal relationship causal relationshipbetween the variables. The statistical significance of F-statisticvia Wald test including differences and lagged differences ofindependent variables incorporated in model confirms theshort-run causality. The joint long-run and short-run causalityis confirmed by the statistical significance of the lagged errorterm with differences and lagged differences of the variablesincorporated in model. For instance, b12,3,i≠0∀ i implies thatscale and technique effects Granger cause CO2 emissions, andscale and technique effects are Granger cause of CO2 emis-sions shown by b21,3,i≠0∀ i.
Results and their discussion
Table 1 explains the descriptive statistic analysis. We find thatvariations are high in trade openness compared to CO2 emis-sions. Economic growth’s variations are less compared to cap-italization, and energy consumption is more volatile comparedto economic growth. Furthermore, the Jarque-Bera statisticsconfirm the normality of trade openness, economic growth,energy consumption, capitalization, and CO2 emissions. Thisshows that all the series are suitable for further empiricalanalysis.
The next step is to test whether unit root problemexists between the variables before applying thecointegration approach for long run. We have overcomethis issue by employing augmented Dickey-Fuller(ADF) and Phillips-Perron (PP) unit root tests. The re-sults are shown in Table 2. The results of ADF testindicate that all the series are found non-stationary atlevel accommodating intercept and trend. After firstdifferencing, CO2 emissions (lnCt), economic growth
(lnYt), energy consumption (lnEt), composite effect (lnKt), and trade openness (lnOt) have been stationary. Itreveals that the variables are integrated at I(1). The PPunit root test also confirms these findings.
The results provided by ADF and PP may be ambiguousbecause these tests are unable to capture the information ofstructural breaks occurring in the series whichmay be cause ofunit root problem. We have solved this issue by applying theunit root test developed in Zivot and Andrews (1992) thataccommodates the information for single unknown structuralbreak in the time series data. The results are reported inTable 2. We noted that CO2 emissions, economic growth,energy consumption, capitalization, and trade openness con-tain unit root problem at level in the presence of structuralbreaks. These structural breaks in CO2 emissions, economicgrowth, energy consumption, capitalization, and trade open-ness occurred in 1989Q2, 1991Q2, 1993Q3, 1997Q1, and1992Q2, respectively. The Malaysian government implement-ed numerous economic policies such as environmentalauditing in 1989, sixth 5-year plan, i.e., 1991–1996, electricityreforms in 1993, liberalization and privatization sector re-forms for improving capital infrastructure in 1997, andASEAN Free Trade Agreement (AFTA) in 1992, respectively,to improve the performance of Malaysian economy. The var-iables contain stat ionari ty at f i rs t difference by
Table 1 Descriptive statistics analysis
Variables lnCt lnYt lnEt lnKt lnOt
Mean 1.2789 9.2689 7.1851 8.3174 9.5405
Median 1.3327 9.2889 7.2741 8.4737 9.6528
Maximum 2.1650 9.9270 7.9385 9.2080 10.535
Minimum 0.3996 8.4043 6.2271 7.1387 8.1021
Std. dev. 0.5893 0.4578 0.5388 0.5482 0.8190
Skewness −0.0431 −0.2027 −0.2979 −0.4330 −0.2870Kurtosis 1.4946 1.7759 1.8275 2.1174 1.6544
Jarque-Bera 3.9785 2.9096 3.0270 2.6760 3.7449
Probability 0.1367 0.2334 0.2201 0.2623 0.1537
Environ Sci Pollut Res
accommodating structural breaks in CO2 emissions, economicgrowth, energy consumption, capitalization, and tradeopenness.
The unique order of integration of the variables leadsus to employ the bounds testing cointegration approachfor examining long-run relationship between the vari-ables while accommodating information about structuralbreaks in the series. Furthermore, the selection of ap-propriate lag does matter while investigating thecointegration between the series. We have used Akaikeinformation criterion (AIC) for lag length selection dueits superior properties and explanatory power. The re-sults are reported in the second column of Table 3.6
For cointegration, we employed the ARDL bounds test-ing approach and the results are reported in Table 3.While using CO2 emissions and energy consumptionas dependent variables, bounds testing F-statistics arehigher than critical upper bound at 5 and 1 % levels,respectively. This leads us to reject the hypothesis of nocointegration. We cannot reject the null hypothesis of nocointegration, as we used economic growth, compositeeffect, trade openness, and comparative advantage effectas dependent variables. We note the presence ofcointegration between trade openness and CO2 emis-sions by incorporating economic growth, energy
consumption, composite effect, and comparative advan-tage effect for Malaysian economy.
We have reported the long-run results in Table 4 afterconfirming the cointegration between the variables. We findthat scale effect has positive and technique effect has negativeimpact on CO2 emissions. At 1 % level of statistical signifi-cance, the results show that while attaining the economies ofscale, 1 % increase in income casts 2.26 % of CO2 emissions.However, when economic transition shifts due to technologi-cal change are considered, the positive effect turns into nega-tive where 1 % increase in income reduces CO2 emissions by0.17 %. It shows that the relationship between linear (scaleeffect) and non-linear (technique effect) in terms of real GDPper capita and CO2 emissions is inverted U-shaped whichfurther confirms the existence of EKC hypothesis. The resultsare similar to Copeland and Taylor (1994b) who study theenvironmental effect of north-south trade and contrasting toCole (2006) who found that trade openness boosts energyconsumption that ultimately degrades environmental qualityin long run. Our empirical results suggest that increased ineconomic activity does not pare down environmental qualitybecause income effect encourages newer technology adoptionand leads to cleaner production in Malaysia. Furthermore, theempirical presence of the EKC is supported by the findings ofSaboori et al. (2012), Saboori and Sulaiman (2013), and Lauet al. (2014) but Begum et al. (2015) who also reported theabsence of EKC in case of Malaysia. Energy consumption ispositively and significantly associated with CO2 emissions.Keeping other things constant, a 1 % increase in energy
6 We have inserted dummy variable for each variable while considering itas dependent variable.
Table 2 Unit root analysisVariables ADF test PP test
T-statistic P value T-statistic P value
lnCt −2.5548 (5) 0.3017 −2.2050 (3) 0.4832
lnYt −1.5383 (4) 0.8124 −1.9084 (3) 0.6457
lnEt −2.6073 (3) 0.2777 −2.2702 (3) 0.4474
lnKt −2.6090 (2) 0.1315 −1.7871 (3) 0.7068
lnOt −0.3806 (2) 0.9875 0.1391 (3) 0.9974
ΔlnCt −4.8703 (4)* 0.0005 −6.9816 (3)* 0.0000
ΔlnYt −4.7749 (5)* 0.0008 −6.7654 (3)* 0.0000
ΔlnEt −11.0829 (2)* 0.0000 −8.0117 (3)* 0.000
ΔlnKt −4.7040 (3)* 0.0010 −5.9635 (3)* 0.0000
ΔlnOt −7.2535 (2)* 0.0000 −6.4370 (3)* 0.0000
Variables ZA test at level ZA test at first difference
T-statistic Break year T-statistic Break year
lnCt −4.772 (3) 1989Q2 −12.913 (2)* 1995Q4
lnYt −4.311 (2) 1991Q2 −8.271 (3)* 1986Q3
lnEt −4.704 (3) 1993Q3 −12.317 (1)* 1978Q3
lnKt −4.700 (2) 1997Q1 −7.332 (2)* 1997Q2
lnOt −3.231 (3) 1992Q2 −8.534 (4)* 1987Q3
Lag length and bandwidth of variables are shown in small parentheses for ADF, PP, and ZA unit root tests
*Significant at 1 % level of significance
Environ Sci Pollut Res

consumption increases CO2 emissions by 0.35 %. This empir-ical evidence is same as reported by Saboori et al. (2012a, b),Saboori and Sulaiman (2013), Shahbaz et al. (2013a, b, c),Lau et al. (2014), and Begum et al. (2015) for Malaysianeconomy. The impact of composition effect on CO2 emissionsis negative and significant. The results show that 1 % increasein composition effect (capital-labor ratio) leads to decreaseCO2 emissions by 0.57 % keeping all else same. This findingis consistent with Tsurumi andManagi (2010), but contrastingto Cole (2006) who reported that composition effect is posi-tively linked with energy intensity and leads to CO2 emis-sions. This notion further enumerates that change in the com-position of production line (i.e., adoption of less capital inten-sive means of production) in presence of technique effect re-duces emission intensity. Trade openness has negative and
significant effect on CO2 emissions. It is noted that a 1 % raisein trade openness declines CO2 emissions by 0.69 % by keep-ing other things constant. It reveals that the environmentalfriendliness of trade liberalization is a long-run phenomenonin case of Malaysia. Trade openness sufficiently supportstechnological spillover, capital formation, and institutional de-velopment in the country. The long-term national policies toincrease trade volume enhance environmental quality inMalaysia. However, in comparison to past literature, our re-sults contradict with Shahbaz et al. (2013a, b, c, 2014a, b) whonoted that trade openness increases CO2 emissions forMalaysia, Bangladesh, and Tunisia but consistent withShahbaz et al. (2012b, c) in case of Pakistan. The positiveand statistically significant relationship was found betweencomparative advantage effect and CO2 emissions. These find-ings suggest that the reciprocal production using comparativeadvantage deteriorates environmental quality in Malaysia. Itcould be mainly because of loosing technical competitivenessin targeted industries due to outward shift of physical andhuman capital. It can also have positive effect on energy in-tensity and, hence, increase CO2 emissions. Similarly, al-though partial impacts of trade openness and composite effectare negative, they are dominated by comparative advantageeffect which increases CO2 emissions. The impact of dummyvariable is positive and statistically significant at 1 % level.This shows that the implementation of environmental auditingin 1989 failed to control environment from degradation.
In short run, Table 5 reports that current CO2 emissions arepositively and significantly affected by CO2 emissions in theprevious period. The effect of scale effect and technique effectis positive and negative at 1 % level. Energy consumptionaffects CO2 emissions positively at 1 % level. The effect ofcomposite effect and trade openness on CO2 emissions is neg-ative and positive but statistically insignificant. The
Table 3 The results of ARDL cointegration test
Bounds testing to cointegration Diagnostic tests
Dependent variable Optimal lag length F-statistics Break year χNORMAL2 χARCH
2 χRESET2 χSERIAL
2
FC(C/Y,Y2,E,K,O,K.O) 6, 5, 6, 5, 6, 6, 5 4.289** 1989Q2 0.9060 1.724 0.9300 0.5702
FY ;Y 2 Y ; Y 2=C;E;K;O;K:O� � 6, 6, 6, 6, 5, 5, 6 2.991 1991Q2 0.6402 3.5452 0.2910 2.7743
FE(E/C,Y,Y2,K,O,K.O) 6, 5, 5, 5, 6, 6, 5 5.346* 1993Q3 0.2188 0.0900 0.6009 0.8473
FK(K/C,Y,Y2,E,O,K.O) 6, 6, 6, 6, 6, 6, 6 2.900 1997Q1 0.4461 2.4400 2.8571 1.9556
FO(O/C,Y,Y2,E,K,K.O) 6, 5, 5, 5, 5, 6, 5 2.250 1992Q2 0.2744 2.9888 0.7766 1.3690
FO.K(O.K/C,Y,Y2,E,K,O) 6, 5, 5, 5, 6, 6, 6 2.600 .... 0.3627 2.6900 1.8160 1.6500
Significant level Lower bounds I(0) Upper bounds I(1)
1 % level 3.60 4.90
5 % level 2.87 4.00
10 % level 2.53 3.59
Critical values are collected from Pesaran et al. (2007)
*Significant at 1 % level; **significant at 5 % level; ***significant at 10 % level
Table 4 Long-run analysis
Dependent variable=lnCt
Variable Coefficient Std. error T-statistic Prob. value
Constant 2.7510 0.7460 3.6876 0.0003
lnYt 2.2691 0.9032 2.5122 0.0130
lnYt2 −0.1686 0.0462 −3.6488 0.0004
lnEt 0.3532 0.0829 4.2595 0.0000
lnKt −0.5742 0.2385 −2.4074 0.0172
lnOt −0.6866 0.2153 −3.1887 0.0017
lnOt.Kt 0.2749 0.1005 2.7341 0.0070
D1989 0.0415 0.0052 7.9520 0.0000
R2 0.9891
Adj−R2 0.9805
F-statistic 23.9100*
*Significant at 1 % level
Environ Sci Pollut Res
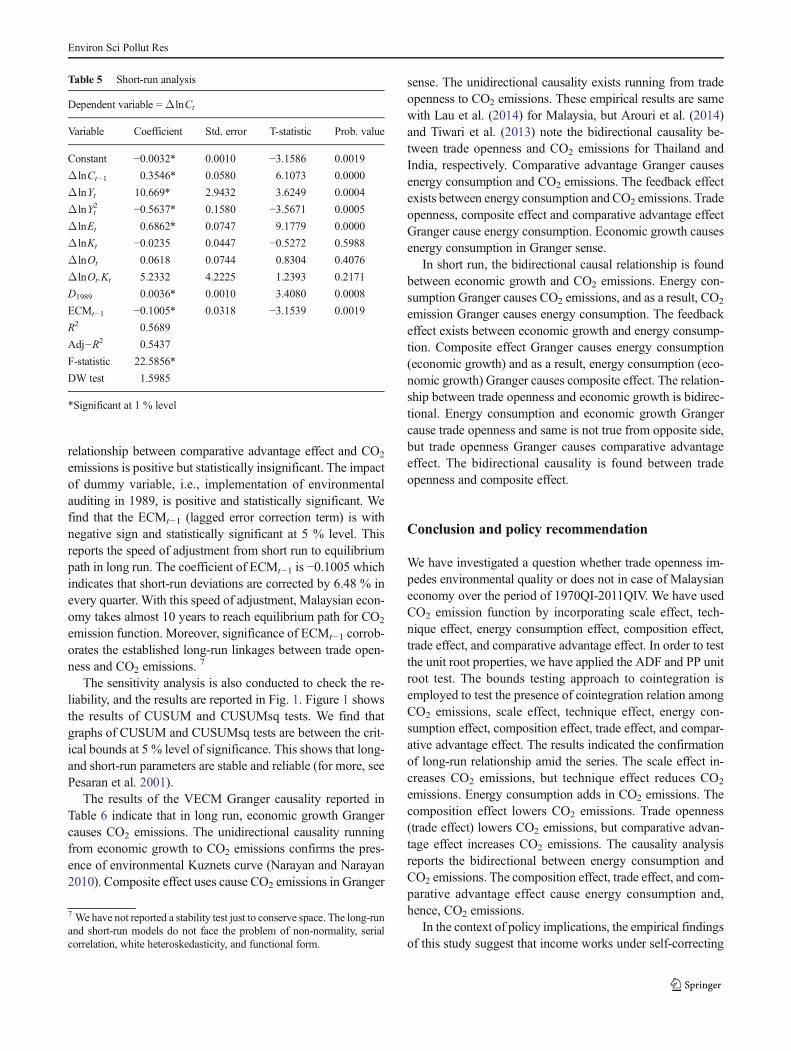
relationship between comparative advantage effect and CO2
emissions is positive but statistically insignificant. The impactof dummy variable, i.e., implementation of environmentalauditing in 1989, is positive and statistically significant. Wefind that the ECMt−1 (lagged error correction term) is withnegative sign and statistically significant at 5 % level. Thisreports the speed of adjustment from short run to equilibriumpath in long run. The coefficient of ECMt−1 is −0.1005 whichindicates that short-run deviations are corrected by 6.48 % inevery quarter. With this speed of adjustment, Malaysian econ-omy takes almost 10 years to reach equilibrium path for CO2
emission function. Moreover, significance of ECMt−1 corrob-orates the established long-run linkages between trade open-ness and CO2 emissions. 7
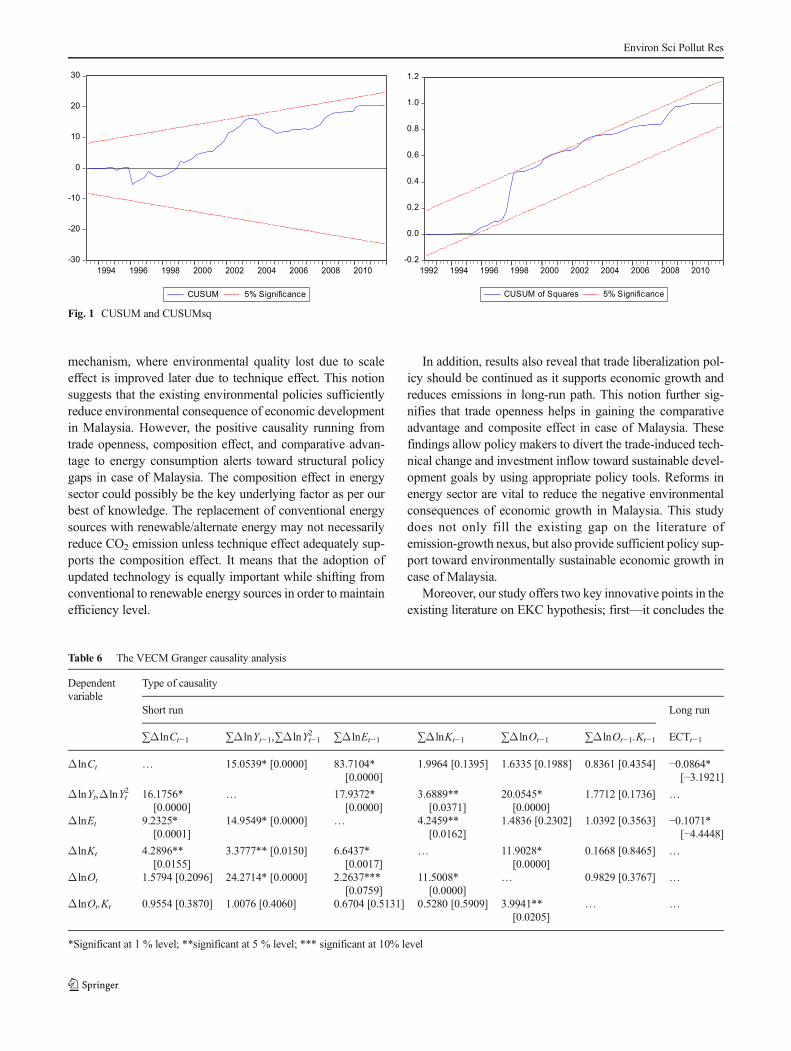
The sensitivity analysis is also conducted to check the re-liability, and the results are reported in Fig. 1. Figure 1 showsthe results of CUSUM and CUSUMsq tests. We find thatgraphs of CUSUM and CUSUMsq tests are between the crit-ical bounds at 5 % level of significance. This shows that long-and short-run parameters are stable and reliable (for more, seePesaran et al. 2001).
The results of the VECM Granger causality reported inTable 6 indicate that in long run, economic growth Grangercauses CO2 emissions. The unidirectional causality runningfrom economic growth to CO2 emissions confirms the pres-ence of environmental Kuznets curve (Narayan and Narayan2010). Composite effect uses cause CO2 emissions in Granger
sense. The unidirectional causality exists running from tradeopenness to CO2 emissions. These empirical results are samewith Lau et al. (2014) for Malaysia, but Arouri et al. (2014)and Tiwari et al. (2013) note the bidirectional causality be-tween trade openness and CO2 emissions for Thailand andIndia, respectively. Comparative advantage Granger causesenergy consumption and CO2 emissions. The feedback effectexists between energy consumption and CO2 emissions. Tradeopenness, composite effect and comparative advantage effectGranger cause energy consumption. Economic growth causesenergy consumption in Granger sense.
In short run, the bidirectional causal relationship is foundbetween economic growth and CO2 emissions. Energy con-sumption Granger causes CO2 emissions, and as a result, CO2
emission Granger causes energy consumption. The feedbackeffect exists between economic growth and energy consump-tion. Composite effect Granger causes energy consumption(economic growth) and as a result, energy consumption (eco-nomic growth) Granger causes composite effect. The relation-ship between trade openness and economic growth is bidirec-tional. Energy consumption and economic growth Grangercause trade openness and same is not true from opposite side,but trade openness Granger causes comparative advantageeffect. The bidirectional causality is found between tradeopenness and composite effect.
Conclusion and policy recommendation
We have investigated a question whether trade openness im-pedes environmental quality or does not in case of Malaysianeconomy over the period of 1970QI-2011QIV. We have usedCO2 emission function by incorporating scale effect, tech-nique effect, energy consumption effect, composition effect,trade effect, and comparative advantage effect. In order to testthe unit root properties, we have applied the ADF and PP unitroot test. The bounds testing approach to cointegration isemployed to test the presence of cointegration relation amongCO2 emissions, scale effect, technique effect, energy con-sumption effect, composition effect, trade effect, and compar-ative advantage effect. The results indicated the confirmationof long-run relationship amid the series. The scale effect in-creases CO2 emissions, but technique effect reduces CO2
emissions. Energy consumption adds in CO2 emissions. Thecomposition effect lowers CO2 emissions. Trade openness(trade effect) lowers CO2 emissions, but comparative advan-tage effect increases CO2 emissions. The causality analysisreports the bidirectional between energy consumption andCO2 emissions. The composition effect, trade effect, and com-parative advantage effect cause energy consumption and,hence, CO2 emissions.
In the context of policy implications, the empirical findingsof this study suggest that income works under self-correcting
7 We have not reported a stability test just to conserve space. The long-runand short-run models do not face the problem of non-normality, serialcorrelation, white heteroskedasticity, and functional form.
Table 5 Short-run analysis
Dependent variable = ΔlnCt
Variable Coefficient Std. error T-statistic Prob. value
Constant −0.0032* 0.0010 −3.1586 0.0019
ΔlnCt−1 0.3546* 0.0580 6.1073 0.0000
ΔlnYt 10.669* 2.9432 3.6249 0.0004
ΔlnYt2 −0.5637* 0.1580 −3.5671 0.0005
ΔlnEt 0.6862* 0.0747 9.1779 0.0000
ΔlnKt −0.0235 0.0447 −0.5272 0.5988
ΔlnOt 0.0618 0.0744 0.8304 0.4076
ΔlnOt.Kt 5.2332 4.2225 1.2393 0.2171
D1989 0.0036* 0.0010 3.4080 0.0008
ECMt−1 −0.1005* 0.0318 −3.1539 0.0019
R2 0.5689
Adj−R2 0.5437
F-statistic 22.5856*
DW test 1.5985
*Significant at 1 % level
Environ Sci Pollut Res
mechanism, where environmental quality lost due to scaleeffect is improved later due to technique effect. This notionsuggests that the existing environmental policies sufficientlyreduce environmental consequence of economic developmentin Malaysia. However, the positive causality running fromtrade openness, composition effect, and comparative advan-tage to energy consumption alerts toward structural policygaps in case of Malaysia. The composition effect in energysector could possibly be the key underlying factor as per ourbest of knowledge. The replacement of conventional energysources with renewable/alternate energy may not necessarilyreduce CO2 emission unless technique effect adequately sup-ports the composition effect. It means that the adoption ofupdated technology is equally important while shifting fromconventional to renewable energy sources in order to maintainefficiency level.
In addition, results also reveal that trade liberalization pol-icy should be continued as it supports economic growth andreduces emissions in long-run path. This notion further sig-nifies that trade openness helps in gaining the comparativeadvantage and composite effect in case of Malaysia. Thesefindings allow policy makers to divert the trade-induced tech-nical change and investment inflow toward sustainable devel-opment goals by using appropriate policy tools. Reforms inenergy sector are vital to reduce the negative environmentalconsequences of economic growth in Malaysia. This studydoes not only fill the existing gap on the literature ofemission-growth nexus, but also provide sufficient policy sup-port toward environmentally sustainable economic growth incase of Malaysia.
Moreover, our study offers two key innovative points in theexisting literature on EKC hypothesis; first—it concludes the
-30
-20
-10
0
10
20
30
1994 1996 1998 2000 2002 2004 2006 2008 2010
CUSUM 5% Significance
-0.2
0.0
0.2
0.4
0.6
0.8
1.0
1.2
1992 1994 1996 1998 2000 2002 2004 2006 2008 2010
CUSUM of Squares 5% Significance
Fig. 1 CUSUM and CUSUMsq
Table 6 The VECM Granger causality analysis
Dependentvariable
Type of causality
Short run Long run
∑ΔlnCt−1 ∑ΔlnYt−1,∑ΔlnYt−12 ∑ΔlnEt−1 ∑ΔlnKt−1 ∑ΔlnOt−1 ∑ΔlnOt−1.Kt−1 ECTt−1
ΔlnCt … 15.0539* [0.0000] 83.7104*[0.0000]
1.9964 [0.1395] 1.6335 [0.1988] 0.8361 [0.4354] −0.0864*[−3.1921]
ΔlnYt,ΔlnYt2 16.1756*
[0.0000]… 17.9372*
[0.0000]3.6889**
[0.0371]20.0545*
[0.0000]1.7712 [0.1736] …
ΔlnEt 9.2325*[0.0001]
14.9549* [0.0000] … 4.2459**[0.0162]
1.4836 [0.2302] 1.0392 [0.3563] −0.1071*[−4.4448]
ΔlnKt 4.2896**[0.0155]
3.3777** [0.0150] 6.6437*[0.0017]
… 11.9028*[0.0000]
0.1668 [0.8465] …
ΔlnOt 1.5794 [0.2096] 24.2714* [0.0000] 2.2637***[0.0759]
11.5008*[0.0000]
… 0.9829 [0.3767] …
ΔlnOt.Kt 0.9554 [0.3870] 1.0076 [0.4060] 0.6704 [0.5131] 0.5280 [0.5909] 3.9941**[0.0205]
… …
*Significant at 1 % level; **significant at 5 % level; *** significant at 10% level
Environ Sci Pollut Res

existence of EKC hypothesis in Malaysia, and secondly—itdeclares sign of causality among the variables. We furtherdisintegrate the EKC and empirically investigate the environ-mental repercussion of scale, technique, and composition ef-fect. The model is robust and the finding possesses deep pol-icy implications for Malaysia and helps policy makers in di-verse ways.
References
Agus F, Gunarso P, Sahardjo BH, Harris N, van NoordwijkM, Killeen TJ(2013) Historical CO2 emissions from land use and land use changefrom the oil palm industry in Indonesia, Malaysia and Papua NewGuinea. Roundtable on Sustainable Palm Oil, Kuala Lumpur
Ahmed K, Long W (2013) An empirical analysis of CO2 emission inPakistan using EKC hypothesis. J Int Trade Law Policy 12(2):188–200
Ahmed K, Shahbaz M, Qasim A, Long W (2015) The linkages betweendeforestation, energy and growth for environmental degradation inPakistan. Ecol Indic 49:95–103
Ang JB (2008) A survey of recent developments in the literature of fi-nance and growth. J Econ Surv 22(3):536–576
Antweiler W, Copeland BR, Taylor MS (2001) Is free trade good for theenvironment? Am Econ Rev 91:877–908
Arouri M, Shahbaz M, Onchang R, Islam F, Teulon F (2014)Environmental Kuznets curve in Thailand: cointegration and causal-ity analysis. J Energy Dev 39:149–170
Baek J, Koo WW (2008) Identifying macroeconomic linkages to USagricultural trade balance. Can J of Agric Econ/Revue canadienned'agroeconomie 56(1):63–77
Baek J, Cho Y, Koo WW (2009) The environmental consequences ofglobalization: a country-specific time-series analysis. Ecol Econ68:2255–2264
Baylis J, Smith S (2005) The globalization of world politics. OxfordUniversity Press, 2005
Begum RA, Sohag K, Abdullah SMS, Jaafar M (2015) CO2 emissions,energy consumption, economic and population growth in Malaysia.Renew Sust Energ Rev 41:594–601
Bekhet HA, Yasmin T (2013) Disclosing the relationship among CO2emissions, energy consumption, economic growth and bilateraltrade between Singapore and Malaysia: an econometric analysis.Int J Soc Hum Sci Eng 7(9):50–55
Bhattacharyya R, Ghoshal T (2010) Economic growth and CO2 emis-sions. Environ Dev Sustain 12(2):159–177
Busse M (2004) Transnational corporations and repression of politicalrights and civil liberties: an empirical analysis. Kyklos 57(1):45–66
ChangC (2010)Amultivariate causality test of carbon dioxide emissions,energy consumption and economic growth in China. Appl Energy87:3533–3537
Chebbi HE, Olarreaga M, Zitouna H (2010) Trade openness and CO2emissions in Tunisia. Working Paper 518, Economic ResearchForum
Cole G (2004) Personnel and human resource management. Pers Rev33(3):373–374
Cole MA (2006) Does trade liberalization increase national energy use?Econ Lett 92:108–112
Cole MA, Elliott RJ (2003) Determining the trade–environment compo-sition effect: the role of capital, labor and environmental regulations.J Environ Econ Manag 46(3):363–383
Copeland BR (2005) Policy endogeneity and the effects of trade on theenvironment. Agric Resour Econ Rev 34(1):1–15
Copeland BR, Taylor MS (1994) North-South trade and the environment.Q J Econ 755–787
Copeland BR, TaylorMS (2004) Trade, growth and the environment (No.9823). National Bureau of Economic Research
Dean JM (2002) Does trade liberalization harm the environment? A newtest. Can J Econ 35(4):819–842
Dietzenbacher E, Mukhopadhyay K (2007) An empirical examination ofthe pollution haven hypothesis for India: towards a green Leontiefparadox? Environ Resour Econ 36(4):427–449
Dinda S, Coondoo D (2006) Income and emission: a panel data-basedcointegration analysis. Ecol Econ 57(2):167–181
Engle RF, Granger CW (1987) Co-integration and error correction: rep-resentation, estimation, and testing. Econometrica: Journal of theEconometric Society 251–276
Farhani S, Ozturk I (2015) Causal relationship between CO2 emissions,real GDP, energy consumption, financial development, trade open-ness, and urbanization in Tunisia. Environ Sci Pollut Res 1–14
Forslid R, Okubo T, Ultveit-Moe KH (2011) Does international tradecontribute to global CO2 emissions? Third Conference of GIST,International Trade, Firm Location and Services
Frankel JA, Rose AK (2005) Is trade good or bad for the environment?Sorting out the causality. Rev Econ Stat 87(1):85–91
Gale LR, Mendez JA (1998) The empirical relationship between trade,growth and the environment. Int Rev Econ Financ 7(1):53–61
Ghosh S (2010) Examining carbon emissions economic growth nexus forIndia: a multivariate cointegration approach. Energy Policy 38(6):3008–3014
Grossman GM, Krueger AB (1991) Environmental impacts of a NorthAmerican free trade agreement (No. w3914). National Bureau ofEconomic Research
Grossman GM, Krueger AB (1994) Economic growth and the environ-ment (No. 4634). National Bureau of Economic Research
Gu Z, Gao Y, Li C (2013) An empirical research on trade liberalizationandCO2 emissions in China. International Conference on EducationTechnology and Information System (ICETIS 2013), p 243–246
Halicioglu F (2009) An econometric study of CO2 emissions, energyconsumption, income and foreign trade in Turkey. Energ Policy37(3):1156–1164
Harris R, Sollis R (2003) Applied time series modeling and forecasting.Wiley, West Sussex
Hoa TV (2012) Trade, growth and CO2 emissions in China: evidencefrom an economic integration model. Victoria Institute of StrategicEconomic Studies, Victoria University, Australia
Ibrahim MH, Law SH (2015) Institutional quality and CO2 emission–trade relations: evidence from Sub-Saharan Africa. S Afr J Econ.doi:10.1111/saje.12095
Iwata H, Okada K, Samreth S (2012) Empirical study on the determinantsof CO2 emissions: evidence from OECD countries. Appl Econ44(27):3513–3519
Jalil A, Mahmud SF (2009) Environment Kuznets curve for CO2 emis-sions: a cointegration analysis for China. Energ Policy 37(12):5167–5172
Jena PR, Grote U (2008). Growth–trade–environment nexus in India.Econ Bull 17(11):1–11
Johansen S (1995) Identifying restrictions of linear equations with appli-cations to simultaneous equations and cointegration. J Econ 69(1):111–132
Kearsley A, Riddel M (2010) A further inquiry into the pollution havenhypothesis and the environmental Kuznets Curve. Ecol Econ 69(4):905–919
Khalid A, Shahbaz M, Long AQ (2014) The linkages between defores-tation, energy and growth for environmental degradation inPakistan. Ecol Indic 49:95–103
Environ Sci Pollut Res
Khalil, S. and Inam, Z. (2006). Is trade good for environment? A unit rootcointegration analysis. Pak Dev Rev 1187–1196
Kohler M (2013) CO2 emissions, energy consumption, income and for-eign trade: a South African perspective. Energ Policy 63:1042–1050
Kukla-Gryz A (2009) Economic growth, international trade and air pol-lution: a decomposition analysis. Ecol Econ 68(5):1329–1339
Lau L-S, Chee-Keong C, Eng Y-E (2014) Investigation of the environ-mental Kuznets curve for carbon emissions in Malaysia: do foreigndirect investment and trade matter? Energ Policy 68:490–497
Lee C, Chiu Y, Sun C (2009) Does one size fit all? A re-examination ofthe environmental Kuznets curve using the dynamic panel data ap-proach. Rev Agric Econ 31:751–778
Levinson A, Taylor MS (2001) Trade and the environment: unmaskingthe pollution haven effect. Unpublished manuscript, US NationalScience Foundation
Levinson A, Taylor MS (2008) Unmasking the pollution haven effect. IntEcon Rev 49(1):223–254
Liddle HA (2001) Free trade and the environment-development system.Ecol Econ 39(1):21–26
Low P, Yeats A (1992) Do dirty industries migrate? World BankDiscussion Papers, 1992
Lucas RE, Wheeler D, Hettige H (1992) Economic development, envi-ronmental regulation, and the international migration of toxic indus-trial pollution, 1960–88 (vol. 1062). World Bank Publications
Managi S (2004) Trade liberalization and the environment: carbon diox-ide for 1960–1999. Econ Bull 17(1):1–5
Managi S, Hibiki A, Tsurumi T (2009) Does trade openness improveenvironmental quality? J Environ Econ Manag 58(3):346–363
Mani M, Wheeler D (1998) In search of pollution havens? Dirty industryin the world economy, 1960 to 1995. J Environ Dev 7(3):215–247
McArthur, J. W. and Sachs, J. D. (2001). Institutions and geography:comment on Acemoglu, Johnson and Robinson (2000) (No.w8114). National Bureau of Economic Research
Menyah K, Wolde-Rufael Y (2010) Energy consumption, pollutant emis-sions and economic growth in South Africa. Energy Econ 32(6):1374–1382
Naranpanawa A (2010) Does trade openness promote carbon emissions?Empirical evidence from Sri Lanka. Empir Econ Lett 10(10):973–986
Narayan PK, Narayan S (2010) Carbon dioxide emissions and economicgrowth: panel data evidence from developing countries. EnergPolicy 38:661–666
Nasir M, Rehman F-U (2011) Environmental Kuznets curve for carbonemissions in Pakistan: an empirical investigation. Energ Policy 39:1857–1864
Ozturk I (2010) A literature survey on energy-growth nexus. Energ Policy38:340–349
Pesaran MH, Shin Y, Smith RP (1999) Pooled mean group estimation ofdynamic heterogeneous panels. J Am Stat Assoc 94(446):621–634
Pesaran MH, Shin Y, Smith RJ (2001) Bounds testing approaches to theanalysis of level relationships. J Appl Econ 16(3):289–326
Pesaran MH, Smith LV, Smith RP (2007) What if the UK or Sweden hadjoined the euro in 1999? An empirical evaluation using a GlobalVAR. International Journal of Finance & Economics 12(1):55–87
Porter ME, Van der Linde C (1995) Toward a new conception of theenvironment-competitiveness relationship. J Econ Perspect 97–118
Saboori B, Sulaiman J (2013) Environmental degradation, economicgrowth and energy consumption: evidence of the environmentalKuznets curve in Malaysia. Energ Policy 60:892–905
Saboori B, Sulaiman J, Mohd S (2012) Economic growth and CO2 emis-sions in Malaysia: a cointegration analysis of the environmentalKuznets curve. Energ Policy 51:184–191
Sbia R, Shahbaz M, Hamdi H (2014) A contribution of foreign directinvestment, clean energy, trade openness, carbon emissions and eco-nomic growth to energy demand in UAE. Econ Model 36:191–197
Shahbaz M, Lean HH (2012a) Does financial development increase en-ergy consumption? The role of industrialization and urbanization inTunisia. Energy Policy 40:473–479
Shahbaz M, Lean HH, Shabbier MM (2012b) Environmental KuznetsCurve hypothesis in Pakistan: cointegration and Granger causality.Renew Sust Energ Rev 16:2947–2953
Shahbaz M, Zeshan M, Afza T (2012c) Is energy consumption effectiveto spur economic growth in Pakistan? New evidence from boundstest to level relationships and Granger causality tests. Econ Model29(6):2310–2319
Shahbaz M, Khan S, Tahir MI (2013a) The dynamic links between ener-gy consumption, economic growth, financial development and tradein China: fresh evidence from multivariate framework analysis.Energy Econ 40:8–21
Shahbaz M, Solarin SA, Mahmood H, Arouri M (2013b) Does financialdevelopment reduce CO2 emissions inMalaysian economy? A timeseries analysis. Econ Model 35:145–152
Shahbaz M, Tiwari AK, Nasir M (2013c) The effects of financial devel-opment, economic growth, coal consumption and trade openness onCO2 emissions in South Africa. Energ Policy 61:1452–1459
Shahbaz M, Khraief N, Uddin GS, Ozturk I (2014a) EnvironmentalKuznets curve in an open economy: a bounds testing and causalityanalysis for Tunisia. Renew Sust Energ Rev 34:325–336
Shahbaz M, Sbia R, Hamdi H, Ozturk I (2014b) Economic growth, elec-tricity consumption, urbanization and environmental degradationrelationship in United Arab Emirates. Ecol Indic 45:622–631
Shahbaz M, Uddin GS, Rehman I, Imran K (2014c) Industrialization,electricity consumption and CO2 emissions in Bangladesh. RenewSust Energ Rev 31:575–586
Shahbaz M, Mallick H, Mahalik MK, Loganathan N (2015a) Does glob-alization impede environmental quality in India? Ecol Indic 52:379–393
Shahbaz M, Nasreen S, Abbas F, Anis O (2015b) Does foreign directinvestment impede environmental quality in high-, middle-, andlow-income countries? Energy Econ 51:275–287
Shahbaz M, Solarin SA, Sbia R, Bibi S (2015c) Does energy intensitycontribute to CO2 emissions? A trivariate analysis in selectedAfrican countries. Ecol Indic 50:215–224
Solarin SA (2014) Tourist arrivals and macroeconomic determinants ofCO2 emissions in Malaysia. Anatolia 25(2):228–241
Takeda F, Matsuura K (2006) Trade and the environment in East Asia:examining the linkages with Japan and the USA. J Korean Econ7(1):33–56
Temurshoev U (2006) Pollution haven hypothesis or factor endowmenthypothesis: theory and empirical examination for the US and China.CERGE-EI
Tiwari AK, Shahbaz M, Hye QMA (2013) The environmental Kuznetscurve and the role of coal consumption in India: cointegration andcausality analysis in an open economy. Renew Sust Energ Rev 18:519–527
Todaro MP, Smith SC (2002) Economic development pearson educationltd. Edenburg Gate, Essex
Tsurumi T, Managi S (2010) Decomposition of the environmentalKuznets curve: scale, technique, and composition effects. EnvironEcon Policy Stud 11(1–4):19–36
Van Beers C, Van Den Bergh JC (1997) An empirical multi‐countryanalysis of the impact of environmental regulations on foreign tradeflows. Kyklos 50(1):29–46
Zivot E, Andrews D (1992) Further evidence of great crash, the oil priceshock and unit root hypothesis. J Bus Econ Stat 10:251–270
Environ Sci Pollut Res