Spring Valley Retail Strip - Dallas, TX
15
SPRING VALLEY RETAIL STRIP DALLAS, TX
-
Upload
vitorino-group -
Category
Documents
-
view
221 -
download
4
description
Â
Transcript of Spring Valley Retail Strip - Dallas, TX

SPRING VALLEY RETAIL STRIP
DALLAS, TX
SPRING VALLEY RETAIL STRIP
FINA
NC
IAL A
NA
LYSIS
MA
RK
ET
OV
ER
VIE
WP
RO
PE
RT
Y D
ESC
RIP
TIO
N
2This information has been secured from sources we believe to be reliable, but we make no representations or warranties, expressed or implied, as to the accuracy of the information. References to square footage or age are approximate. Buyer must verify the information and bears all risk for any inaccuracies. Any projections, opinions, assumptions or estimates used herein are for example purposes only and do not represent the current or future performance of the property. © 2015 Vitorino Group
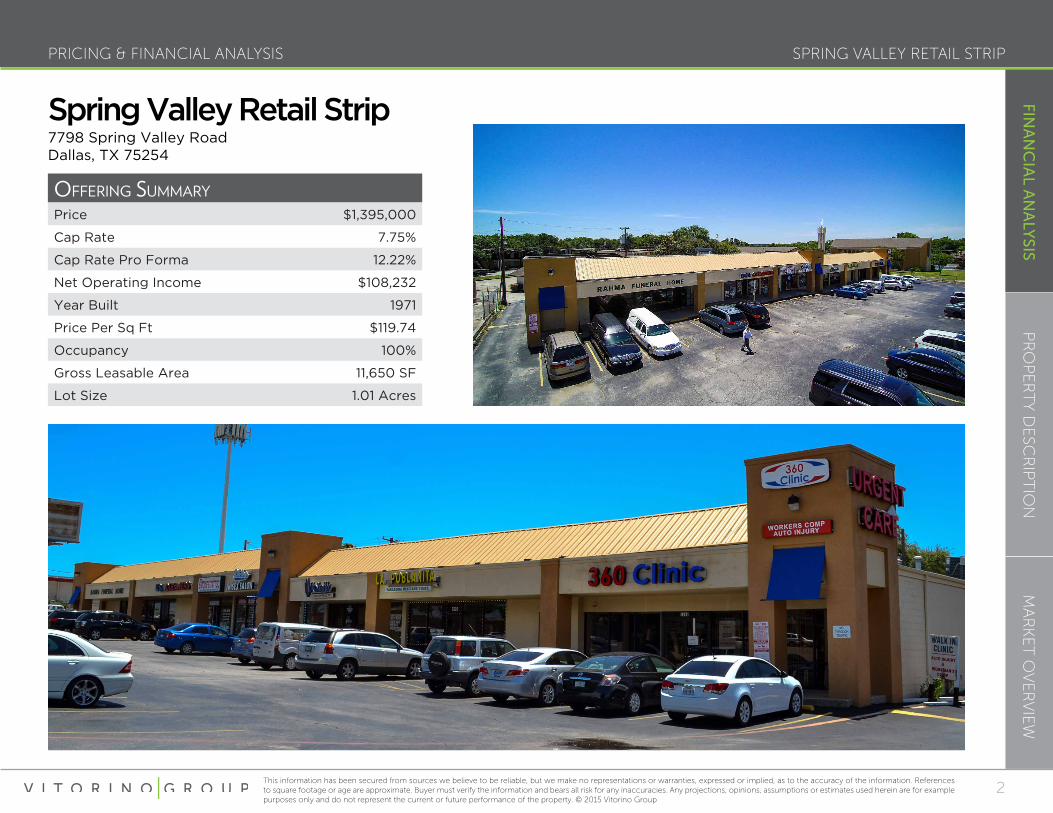
PRICING & FINANCIAL ANALYSIS
Offering Summary
Price $1,395,000
Cap Rate 7.75%
Cap Rate Pro Forma 12.22%
Net Operating Income $108,232
Year Built 1971
Price Per Sq Ft $119.74
Occupancy 100%
Gross Leasable Area 11,650 SF
Lot Size 1.01 Acres
Spring Valley Retail Strip7798 Spring Valley RoadDallas, TX 75254

SPRING VALLEY RETAIL STRIP
FINA
NC
IAL A
NA
LYSIS
MA
RK
ET
OV
ER
VIE
WP
RO
PE
RT
Y D
ESC
RIP
TIO
N
3This information has been secured from sources we believe to be reliable, but we make no representations or warranties, expressed or implied, as to the accuracy of the information. References to square footage or age are approximate. Buyer must verify the information and bears all risk for any inaccuracies. Any projections, opinions, assumptions or estimates used herein are for example purposes only and do not represent the current or future performance of the property. © 2015 Vitorino Group
PRICING & FINANCIAL ANALYSIS
incOme & expenSeS current pSf prO fOrma pSf
Base Rent - Occupied Space 100.0% $170,400 $14.63 $170,400 $14.63
Base Rent - Vacant Space $0 $0.00 $0 $0.00
GROSS POTENTAL RENT $170,400 $14.63 $170,400 $14.63
Exp. Reimb.
Real Estate Taxes $0 $0.00 $30,764 $2.64
Insurance $0 $0.00 $11,577 $0.99
CAM $0 $0.00 $13,862 $1.19
Mgmt. Fee $0 $0.00 $8,219 $0.71
Total Exp. Reimb. $0 $0.00 $64,422 $5.53
GROSS POTENTIAL INCOME $170,400 $14.63 $234,822 $20.16
Vacancy Factor 0.00% $0 $0.00 0.00% $0 $0.00
EFFECTIVE GROSS INCOME $170,400 $14.63 $234,822 $20.16
Expenses
Real Estate Taxes ($30,764) ($2.64) ($30,764) ($2.64)
Insurance ($11,577) ($0.99) ($11,577) ($0.99)
CAM ($13,862) ($1.19) ($13,862) ($1.19)
Mgmt. Fee (% of GPI) 3.50% ($5,964) ($0.51) 3.50% ($8,219) ($0.71)
Total Expenses ($62,168) ($5.34) ($64,422) ($5.53)
NET OPERATING INCOME $108,232 $179,974

SPRING VALLEY RETAIL STRIP
FINA
NC
IAL A
NA
LYSIS
MA
RK
ET
OV
ER
VIE
WP
RO
PE
RT
Y D
ESC
RIP
TIO
N
4This information has been secured from sources we believe to be reliable, but we make no representations or warranties, expressed or implied, as to the accuracy of the information. References to square footage or age are approximate. Buyer must verify the information and bears all risk for any inaccuracies. Any projections, opinions, assumptions or estimates used herein are for example purposes only and do not represent the current or future performance of the property. © 2015 Vitorino Group
RENT ROLL
Suite tenant Sq ft% Of Sq ft
Start endannual
rentpSf
eScalatiOn date
eScalatiOn amOunt
OptiOnSleaSe
type
7798 Klair Naveed M.D. 3,035 26.1% 1/15/2015 5/15/2018 $36,000 $11.86 - - - Gross
7800 La Poblanita Mexican Bakery 1,900 16.3% 12/1/2002 12/1/2016 $27,000 $14.21 - - - Gross
7802 Skolnik Chiropractic 1,240 10.6% 8/11/2003 12/1/2016 $20,400 $16.45 - - - Gross
7804 Vicki's Unisex Salon 1,200 10.3% 4/15/2009 12/1/2016 $20,400 $17.00 - - - Gross
7806 Aftab Ahmad Khan 900 7.7% 5/1/2015 7/31/2020 $14,400 $16.00 - - - Gross
7808 USA Cleaners 1,200 10.3% 4/1/2003 12/1/2016 $20,400 $17.00 - - - Gross
7810 Rahma Funeral Home 2,175 18.7% 7/7/2004 12/1/2016 $31,800 $14.62 - - - Gross
Occupied 11,650 100.0% $170,400
Vacant 0 0.0%
Total 11,650 100.0%
SPRING VALLEY RETAIL STRIP
FINA
NC
IAL A
NA
LYSIS
MA
RK
ET
OV
ER
VIE
WP
RO
PE
RT
Y D
ESC
RIP
TIO
N
5This information has been secured from sources we believe to be reliable, but we make no representations or warranties, expressed or implied, as to the accuracy of the information. References to square footage or age are approximate. Buyer must verify the information and bears all risk for any inaccuracies. Any projections, opinions, assumptions or estimates used herein are for example purposes only and do not represent the current or future performance of the property. © 2015 Vitorino Group
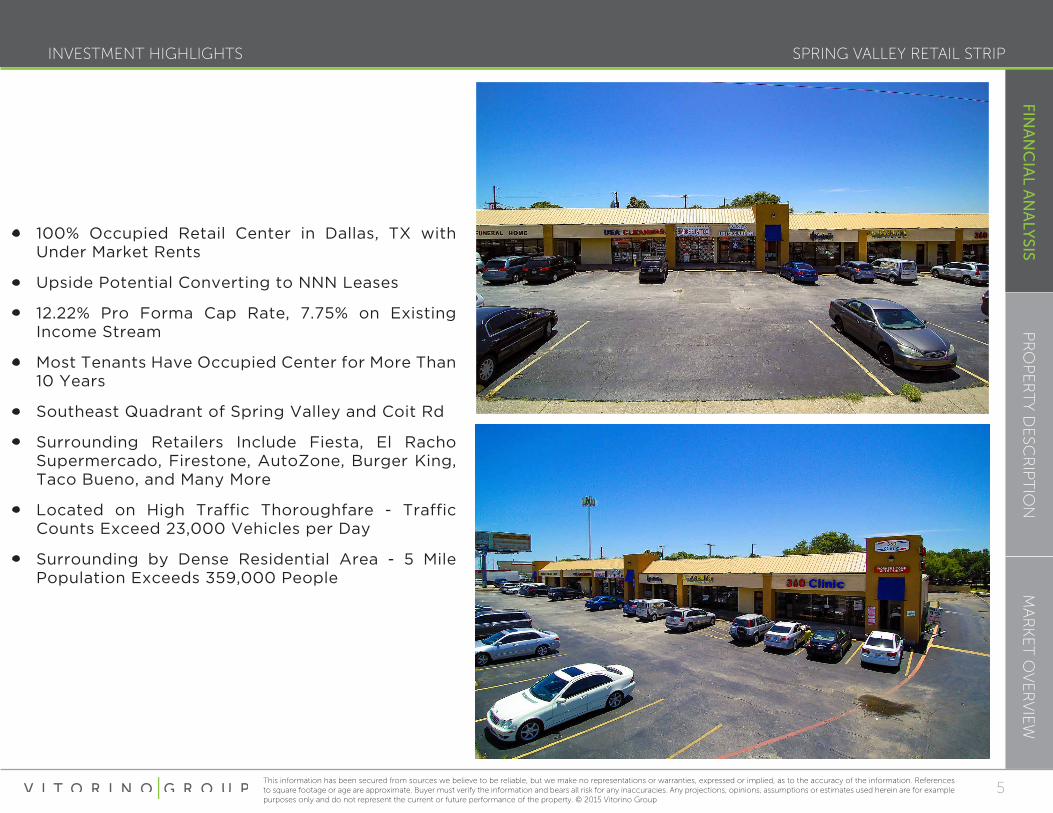
INVESTMENT HIGHLIGHTS
• 100% Occupied Retail Center in Dallas, TX with Under Market Rents
• Upside Potential Converting to NNN Leases
• 12.22% Pro Forma Cap Rate, 7.75% on Existing Income Stream
• Most Tenants Have Occupied Center for More Than 10 Years
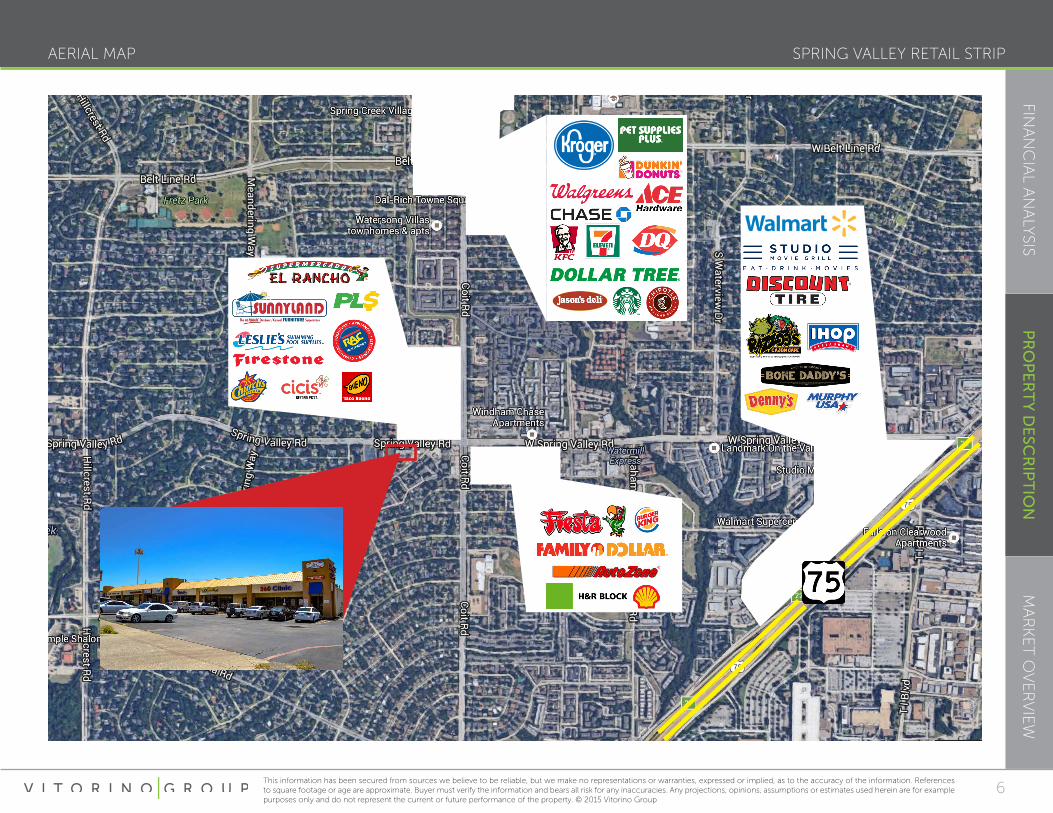
• Southeast Quadrant of Spring Valley and Coit Rd
• Surrounding Retailers Include Fiesta, El Racho Supermercado, Firestone, AutoZone, Burger King, Taco Bueno, and Many More
• Located on High Traffic Thoroughfare - Traffic Counts Exceed 23,000 Vehicles per Day
• Surrounding by Dense Residential Area - 5 Mile Population Exceeds 359,000 People
SPRING VALLEY RETAIL STRIP
FINA
NC
IAL A
NA
LYSIS
MA
RK
ET
OV
ER
VIE
WP
RO
PE
RT
Y D
ESC
RIP
TIO
N
6This information has been secured from sources we believe to be reliable, but we make no representations or warranties, expressed or implied, as to the accuracy of the information. References to square footage or age are approximate. Buyer must verify the information and bears all risk for any inaccuracies. Any projections, opinions, assumptions or estimates used herein are for example purposes only and do not represent the current or future performance of the property. © 2015 Vitorino Group
AERIAL MAP

SPRING VALLEY RETAIL STRIP
FINA
NC
IAL A
NA
LYSIS
MA
RK
ET
OV
ER
VIE
WP
RO
PE
RT
Y D
ESC
RIP
TIO
N
7This information has been secured from sources we believe to be reliable, but we make no representations or warranties, expressed or implied, as to the accuracy of the information. References to square footage or age are approximate. Buyer must verify the information and bears all risk for any inaccuracies. Any projections, opinions, assumptions or estimates used herein are for example purposes only and do not represent the current or future performance of the property. © 2015 Vitorino Group
LOCAL MAP

SPRING VALLEY RETAIL STRIP
FINA
NC
IAL A
NA
LYSIS
MA
RK
ET
OV
ER
VIE
WP
RO
PE
RT
Y D
ESC
RIP
TIO
N
8This information has been secured from sources we believe to be reliable, but we make no representations or warranties, expressed or implied, as to the accuracy of the information. References to square footage or age are approximate. Buyer must verify the information and bears all risk for any inaccuracies. Any projections, opinions, assumptions or estimates used herein are for example purposes only and do not represent the current or future performance of the property. © 2015 Vitorino Group
REGIONAL MAP

SPRING VALLEY RETAIL STRIP
FINA
NC
IAL A
NA
LYSIS
MA
RK
ET
OV
ER
VIE
WP
RO
PE
RT
Y D
ESC
RIP
TIO
N
9This information has been secured from sources we believe to be reliable, but we make no representations or warranties, expressed or implied, as to the accuracy of the information. References to square footage or age are approximate. Buyer must verify the information and bears all risk for any inaccuracies. Any projections, opinions, assumptions or estimates used herein are for example purposes only and do not represent the current or future performance of the property. © 2015 Vitorino Group
MARKET SUMMARY
Dallas encompasses half of the Dallas/Fort Worth Metroplex and is the third-largest city in Texas and the ninth-largest city in the United States. Dallas is home to the third-largest concentration of Fortune 500 companies in the country and is the largest economic center of the Dallas/Fort Worth metropolitan area. The Metroplex has strong submarket occupancy rates, is home to more shopping centers per capita and has one of the largest concentrations of corporate headquarters for publicly traded companies in the United States.
The city is the largest economic center of the 12-county Dallas–Fort Worth–Arlington metropolitan area, which had a population of 6,810,913 people as of July 1, 2013. The metropolitan economy is the sixth largest in the United States, with a 2012 real GDP of $420.34 billion. In 2013 the metropolitan area led the nation with the largest year-over-year increase in employment, and advanced to become the fourth-largest employment center in the nation (behind New York City, Los Angeles, and Chicago) with more than three million non-farm jobs. In the
latest rankings released in 2013, Dallas was rated as a “beta plus” world city by the Globalization and World Cities Study Group & Network. Dallas is also ranked 14th in world rankings of GDP by the Organization for Economic Co-operation and Development. The Dallas-Fort Worth Metroplex has one of the largest concentrations of corporate headquarters for publicly traded companies in the United States. The city of Dallas has 12 Fortune 500 companies, and the DFW region as a whole has 20.
Dallas is the best-ranked city on the Regulatory Climate Index thanks to its efficient local regulations. Entrepreneurs and small businesses can expect a welcoming business environment across all five areas of local regulation. Dallas scores above average across each meaningful measure of an interaction that a business has with a local government agency through procedure, time, and cost. These rankings reflect the city’s continuing efforts to develop programs and initiatives to strengthen the business environment, provide access to capital, and encourage economic growth at the local level.
DALLAS, TX

SPRING VALLEY RETAIL STRIP
FINA
NC
IAL A
NA
LYSIS
MA
RK
ET
OV
ER
VIE
WP
RO
PE
RT
Y D
ESC
RIP
TIO
N
10This information has been secured from sources we believe to be reliable, but we make no representations or warranties, expressed or implied, as to the accuracy of the information. References to square footage or age are approximate. Buyer must verify the information and bears all risk for any inaccuracies. Any projections, opinions, assumptions or estimates used herein are for example purposes only and do not represent the current or future performance of the property. © 2015 Vitorino Group
DEMOGRAPHIC SUMMARY
PoPulation
HouseHolds
income
Race and etHnicity
Housing
emPloyment
Geography: 5 miles
In the identified area, the current year population is 359,452. The rate of change since 2000 was 1.95%. The five-year projection for the population in the area is 381,425 representing a change of 5.76% from 2015 to 2020. Currently, the population is 49.6% male and 50.4% female. The median age in this area is 29.7, compared to the U.S. median agoe of 37.9.
There are currently 153,829 households in your selected georgraphy. The number of households has changed by -0.19% since 2000. It is estimated that the number of households in your area will be 163,005 five years from now, which represents a change of 5.62% from the current year. The average household size in your area is 2.32 persons.
In 2015, the median household income for your selected georgraphy is $53,326, compare this to the Entire U.S. average, which is currently $53,217. It is estimated that the median household income in your area will be $60,494 five years from now, which represents a change of 11.84% from the current year.
The current year per capita income in your area is $38,338, compare this to the Entire U.S. average, which is $28,597. The current year average household income in your area is $89,288, compare this to the Entire U.S. average, which is $74,699.
The current year racial makeup of your selected area is as follows: 59.0% White, 16.3% Black, 0.6% Native American and 9.0% Asian/Pacific Islander. Compare these to the Entire U.S. Averages which are: 71.60% White, 12.70% Black, 0.18% Native American and 5.02% Asian/Pacific Islander.
People of Hispanic origin are counted independently of race. People of Hispanic origin make up 27.4% of the current year population in your selected area. Compare this to the Entire U.S. average of 17.6%.
In 2015, there were 63,225 owner occupied housing units in your area and there were 83,475 renter occupied housing units in your area. Median home value in the area is $356,616.
In 2015, there are 193,235 employees in your selected area, this is also known as the daytime population. Currently, 67.2% of employees are employed in white-collar occupations in this geography, and 15.6% are employed in blue-collar occupations. In 2015, unemployment in this area is 4.0%.
Demographic data © 2015 esri

SPRING VALLEY RETAIL STRIP
FINA
NC
IAL A
NA
LYSIS
MA
RK
ET
OV
ER
VIE
WP
RO
PE
RT
Y D
ESC
RIP
TIO
N
11This information has been secured from sources we believe to be reliable, but we make no representations or warranties, expressed or implied, as to the accuracy of the information. References to square footage or age are approximate. Buyer must verify the information and bears all risk for any inaccuracies. Any projections, opinions, assumptions or estimates used herein are for example purposes only and do not represent the current or future performance of the property. © 2015 Vitorino Group
DEMOGRAPHIC STATISTICS
traffic cOuntS
incOme 1 mile 3 mileS 5 mileS
$ 0 - $14,999 15.0% 11.5% 11.5%
$ 15,000 - $24,999 14.7% 10.6% 10.8%
$ 25,000 - $34,999 14.5% 10.8% 11.4%
$ 35,000 - $49,999 19.2% 14.4% 13.5%
$ 50,000 - $74,999 12.7% 17.1% 15.8%
$ 75,000 - $99,999 7.7% 11.0% 10.5%
$100,000 - $149,999 7.4% 11.2% 11.2%
$150,000 - $199,999 3.4% 4.8% 5.2%
$200,000 + 5.3% 8.5% 10.1%
2015 Median Household Income $38,351 $52,733 $53,326
2015 Per Capita Income $21,068 $35,582 $38,338
2015 Average Household Income $64,404 $83,659 $89,228
pOpulatiOn 1 mile 3 mileS 5 mileS
2000 Population 30,614 140,298 352,436
2010 Population 27,119 137,739 340,635
2015 Population 28,614 144,713 359,452
2020 Population 30,461 153,248 381,425
HOuSeHOldS 1 mile 3 mileS 5 mileS
2000 Households 9,711 59,643 154,127
2010 Households 8,831 58,801 146,796
2015 Households 9,215 61,284 153,829
2020 Households 9,753 64,720 163,005
2015 Daytime Population 14,160 78,410 193,235
2015 Average Household Size 3.10 2.34 2.32
2010 Owner Occupied Housing Units 30.0% 37.8% 38.5%
2010 Renter Occupied Housing Units 59.3% 52.3% 50.8%
2010 Vacant 10.7% 9.8% 10.7%
2015 Owner Occupied Housing Units 28.6% 36.0% 36.6%
2015 Renter Occupied Housing Units 60.0% 53.9% 52.5%
2015 Vacant 11.4% 10.2% 10.9%
2020 Owner Occupied Housing Units 28.3% 35.8% 36.4%
2020 Renter Occupied Housing Units 60.4% 54.9% 53.6%
2020 Vacant 11.3% 9.3% 10.0%
23,370
46,300

The information contained in the following offering memorandum is proprietary and strictly confidential. It is intended to be reviewed only by the party receiving it from Vitorino Group and it should not be made available to any other person or entity without the written consent of Vitorino Group. By taking possession of and reviewing the information contained herein the recipient agrees to hold and treat all such information in the strictest confidence. The recipient further agrees that recipient will not photocopy or duplicate any part of the offering memorandum. If you have no interest in the subject property at this time, please return this offering memorandum to Vitorino Group.
This offering memorandum has been prepared to provide summary, unverified financial and physical information to prospective purchasers, and to establish only a preliminary level of interest in the subject property. The information contained herein is not a substitute for a thorough due diligence investigation. Vitorino Group has not made any investigation, and makes no warranty or representation with respect to the income or expenses for the subject property, the future projected financial performance of the property, the size and square footage of the property and improvements, the presence or absence of contaminating substances, PCBs or asbestos, the compliance with local, state and federal regulations, the physical condition of the improvements thereon, or the financial condition or business prospects of any tenant, or any tenant’s plans or intentions to continue its occupancy of the subject property. The information contained in this offering memorandum has been obtained from sources we believe to be reliable; however, Vitorino Group has not verified, and will not verify, any of the information contained herein, nor has Vitorino Group conducted any investigation regarding these matters and makes no warranty or representation whatsoever regarding the accuracy or completeness of the information provided. All potential buyers must take appropriate measures to verify all of the information set forth herein. Prospective buyers shall be responsible for their costs and expenses of investigating the subject property.
ALL PROPERTY SHOWINGS ARE BY APPOINTMENT ONLY. PLEASE CONTACT THE VITORINO GROUP AGENT FOR MORE DETAILS.
CONFIDENTIALITY AGREEMENT

Vitorino Group hereby advises all prospective purchasers of Net Leased property as follows:
The information contained in this Marketing Brochure has been obtained from sources we believe to be reliable. However, the Vitorino Group has not and will not verify any of this information, nor has the Vitorino Group conducted any investigation regarding these matters. The Vitorino Group makes no guarantee, warranty or representation whatsoever about the accuracy or completeness of any information provided.
As the Buyer of a net leased property, it is the Buyer’s responsibility to independently confirm the accuracy and completeness of all material information before completing any purchase. This Marketing Brochure is not a substitute for your thorough due diligence investigation of this investment opportunity. The Vitorino Group expressly denies any obligation to conduct a due diligence examination of this Property for Buyer.
Any projections, opinions, assumptions or estimates used in this Marketing Brochure are for example only and do not represent the current or future performance of this property. The value of a net leased property to you depends on factors that should be evaluated by you and your tax, financial and legal advisors. Buyer and Buyer’s tax, financial, legal, and construction advisors should conduct a careful, independent investigation of any net leased property to determine to your satisfaction with the suitability of the property for your needs.
Like all real estate investments, this investment carries significant risks. Buyer and Buyer’s legal and financial advisors must request and carefully review all legal and financial documents related to the property and tenant. While the tenant’s past performance at this or other locations is an important consideration, it is not a guarantee of future success. Similarly, the lease rate for some properties, including newly-constructed facilities or newly-acquired locations, may be set based on a tenant’s projected sales with little or no record of actual performance, or comparable rents for the area. Returns are not guaranteed; the tenant and any guarantors may fail to pay the lease rent or property taxes, or may fail to comply with other material terms of the lease; cash flow may be interrupted in part or in whole due to market, economic, environmental or other conditions. Regardless of tenant history and lease guarantees, Buyer is responsible for conducting his/her own investigation of all matters affecting the intrinsic value of the property and the value of any long-term lease, including the likelihood of locating a replacement tenant if the current tenant should default or abandon the property, and the lease terms that Buyer may be able to negotiate with a potential replacement tenant considering the location of the property, and Buyer’s legal ability to make alternate use of the property.
By accepting this Marketing Brochure you agree to release The Vitorino Group and hold it harmless from any kind of claim, cost, expense, or liability arising out of your investigation and/or purchase of this net leased property.
Net Lease Disclaimer

Before working with a real estate broker, you should know that the duties of a broker depend on whom the broker represents. If you are a prospective seller or landlord (owner) or a prospective buyer or tenant (buyer), you should know that the broker who lists the property for sale or lease is the owner’s agent. A broker who acts as a subagent represents the owner in cooperation with the listing broker. A broker
who acts as a buyer’s agent represents the buyer. A broker may act as an intermediary between the parties if the parties consent in writing. A broker can assist you in locating a property, preparing a contract or lease, or obtaining financing without representing you. A broker is obligated by law to treat you honestly.
IF THE BROKER REPRESENTS THE OWNER:The broker becomes the owner’s agent by entering into an agreement with the owner, usually through a written - listing agreement, or by agreeing to act as a subagent by accepting an offer of subagency from the listing broker. A subagent may work in a different real estate office. A listing broker or subagent can assist the buyer but does not represent the buyer and must place the interests of the owner first. The buyer should not tell the owner’s agent anything the buyer would not want the owner to know because an owner’s agent must disclose to the owner any material information known to the agent.
IF THE BROKER REPRESENTS THE BUYER:The broker becomes the buyer’s agent by entering into an agreement to represent the buyer, usually through a written buyer representation agreement. A buyer’s agent can assist the owner but does not represent the owner and must place the interests of the buyer first. The owner should not tell a buyer’s agent anything the owner would not want the buyer to know because a buyer’s agent must disclose to the buyer any material information known to the agent.
IF THE BROKER ACTS AS AN INTERMEDIARY:A broker may act as an intermediary between the parties if the broker complies with The Texas Real Estate License Act. The broker must obtain the written consent of each party to the transaction to act as an
Approved by the Texas Real Estate Commission for Voluntary Use Texas law requires all real estate licensees to give the following information about brokerage services to prospective buyers, tenants, sellers and landlords.
Real estate licensee asks that you acknowledge receipt of this information about brokerage services for the licensee’s records.
Information About Brokerage Services
intermediary. The written consent must state who will pay the broker and, in conspicuous bold or underlined print, set forth the broker’s obligations as an intermediary. The broker is required to treat each party honestly and fairly and to comply with The Texas Real Estate License Act. A broker who acts as an intermediary in a transaction:
With the parties’ consent, a broker acting as an intermediary between the parties may appoint a person who is licensed under The Texas Real Estate License Act and associated with the broker to communicate with and carry out instructions of one party and another person who is licensed under that Act and associated with the broker to communicate with and carry out instructions of the other party.
If you choose to have a broker represent you, you should enter into a written agreement with the broker that clearly establishes the broker’s obligations and your obligations. The agreement should state how and by whom the broker will be paid. You have the right to choose the type of representation, if any, you wish to receive. Your payment of a fee to a broker does not necessarily establish that the broker represents you. If you have any questions regarding the duties and responsibilities of the broker, you should resolve those questions before proceeding.
(1) shall treat all parties honestly;(2) may not disclose that the owner will accept a price less than the asking price unless authorized in writing to do so by the owner;(3) may not disclose that the buyer will pay a price greater than the price submitted in a written offer unless authorized in writing to do so by the buyer; and(4) may not disclose any confidential information or any information that a party specifically instructs the broker in writing not to disclose unless authorized in writing to disclose the information or required to do so by The Texas Real Estate License Act or a court order or if the information materially relates to the condition of the property.

exclusively listed
469.844.8880 | VITORINOGROUP.COM