SprIng 2015 Market Intelligence Intelligence SprIng 2015 Welcome to our Spring 2015 market report....
8
Market Intelligence SPRING 2015 Welcome to our Spring 2015 market report. In this edition, we respond to the pension reforms by reviewing the latest trends in the private rental sector and highlight the returns that can be made from investing in property. The net total return that can be earned from a buy-to-let investment.
Transcript of SprIng 2015 Market Intelligence Intelligence SprIng 2015 Welcome to our Spring 2015 market report....
Market Intelligence
SprIng 2015
Welcome to our Spring 2015 market report. In this edition, we respond to the pension reforms by reviewing the latest trends in the private rental sector and highlight the returns that can be made from investing in property.
The net total return that can be earned from a buy-to-let investment.
2
Pension reform
THE prIVATE rEnTAL SECTOr
The pension system has been radically transformed, meaning that anyone aged 55 years or over will, from April 2015, be able to withdraw their pension and spend it in different ways. People in this category will no longer be required to purchase annuities but will have the option to withdraw their whole pension pot.
The first 25% will be tax free and the remaining 75% taxed at the marginal rate. The government estimates that around 18 million people will be eligible to withdraw capital from their pension pots.
Because there is no longer a requirement to purchase annuities to provide an income, many are expected to use lump sums to invest in other, higher-yielding alternatives. Buy-to-let property is one option, providing not only an income return, but also capital growth potential. This report reviews the UK’s private rental market to assess the opportunities available to private investors.
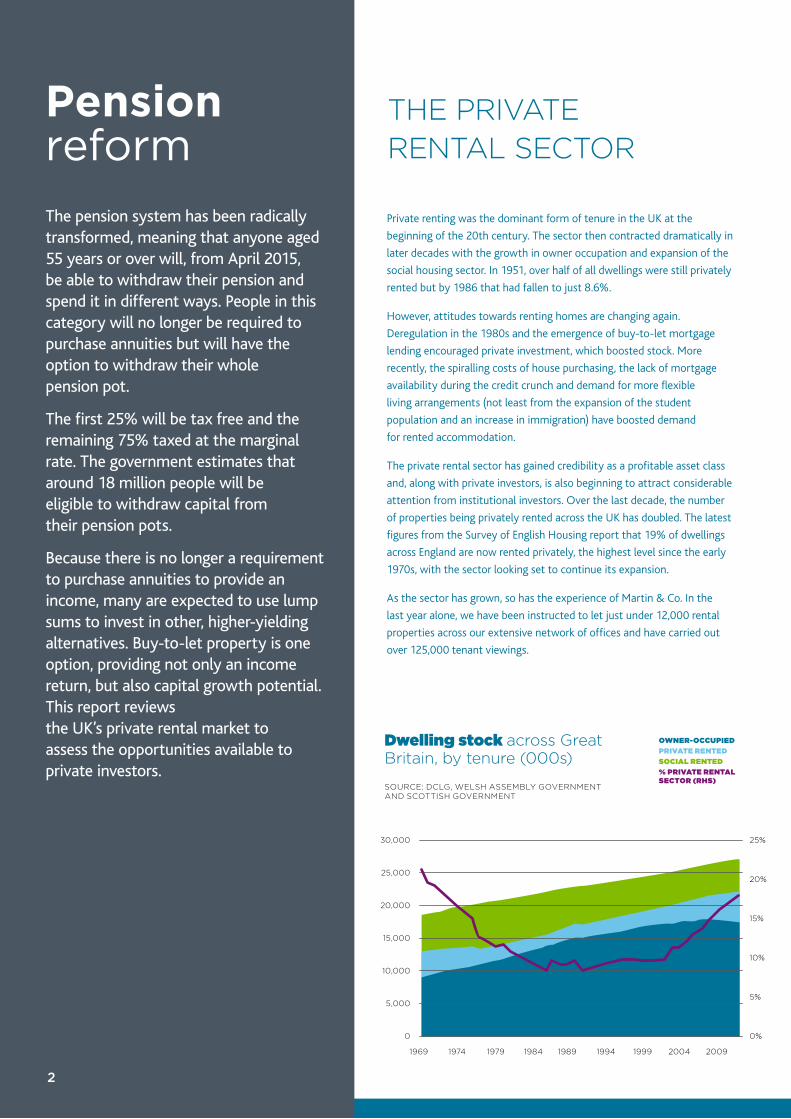
SOurCE: DCLg, WELSH ASSEMbLy gOVErnMEnT AnD SCOTTISH gOVErnMEnT
Private renting was the dominant form of tenure in the UK at the
beginning of the 20th century. The sector then contracted dramatically in
later decades with the growth in owner occupation and expansion of the
social housing sector. In 1951, over half of all dwellings were still privately
rented but by 1986 that had fallen to just 8.6%.
However, attitudes towards renting homes are changing again.
Deregulation in the 1980s and the emergence of buy-to-let mortgage
lending encouraged private investment, which boosted stock. More
recently, the spiralling costs of house purchasing, the lack of mortgage
availability during the credit crunch and demand for more flexible
living arrangements (not least from the expansion of the student
population and an increase in immigration) have boosted demand
for rented accommodation.
The private rental sector has gained credibility as a profitable asset class
and, along with private investors, is also beginning to attract considerable
attention from institutional investors. Over the last decade, the number
of properties being privately rented across the UK has doubled. The latest
figures from the Survey of English Housing report that 19% of dwellings
across England are now rented privately, the highest level since the early
1970s, with the sector looking set to continue its expansion.
As the sector has grown, so has the experience of Martin & Co. In the
last year alone, we have been instructed to let just under 12,000 rental
properties across our extensive network of offices and have carried out
over 125,000 tenant viewings.
Dwelling stock across great britain, by tenure (000s)
owner-occupieD privaTe renTeD social renTeD % privaTe renTal secTor (rHs)
30,000
1969 1974 1979 1984 1989 1994 1999 2004 2009
25%
25,00020%
20,000
15%
15,000
10%
10,000
5%5,000
0 0%
Market Intelligence SprIng 2015 | 3
2 million+ 8.7% 123.6% Households live in privately rented accommodation across Martin & Co’s market SOurCE: 2011 CEnSuS
rise in average rents across gb since beginning of 2011 SOurCE: OnS
Increase in number of buy-to-let loans issued between 2009 and 2014SOurCE: COunCIL Of MOrTgAgE LEnDErS
SOurCE: COunCIL Of MOrTgAgE LEnDErS
InVESTMEnT In THE prIVATE rEnTAL MArkET
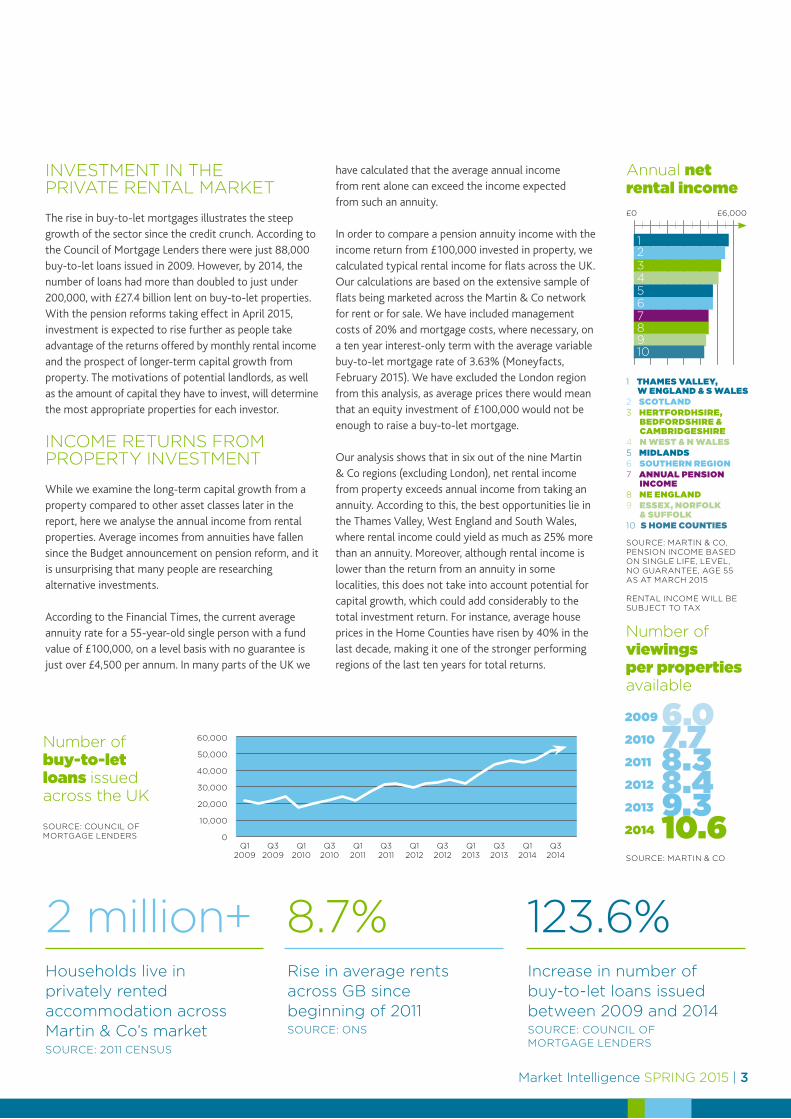
The rise in buy-to-let mortgages illustrates the steep growth of the sector since the credit crunch. According to the Council of Mortgage Lenders there were just 88,000 buy-to-let loans issued in 2009. However, by 2014, the number of loans had more than doubled to just under 200,000, with £27.4 billion lent on buy-to-let properties. With the pension reforms taking effect in April 2015, investment is expected to rise further as people take advantage of the returns offered by monthly rental income and the prospect of longer-term capital growth from property. The motivations of potential landlords, as well as the amount of capital they have to invest, will determine the most appropriate properties for each investor.
InCOME rETurnS frOM prOpErTy InVESTMEnT
While we examine the long-term capital growth from a property compared to other asset classes later in the report, here we analyse the annual income from rental properties. Average incomes from annuities have fallen since the Budget announcement on pension reform, and it is unsurprising that many people are researching alternative investments.
According to the Financial Times, the current average annuity rate for a 55-year-old single person with a fund value of £100,000, on a level basis with no guarantee is just over £4,500 per annum. In many parts of the UK we
have calculated that the average annual income from rent alone can exceed the income expected from such an annuity.
In order to compare a pension annuity income with the income return from £100,000 invested in property, we calculated typical rental income for flats across the UK. Our calculations are based on the extensive sample of flats being marketed across the Martin & Co network for rent or for sale. We have included management costs of 20% and mortgage costs, where necessary, on a ten year interest-only term with the average variable buy-to-let mortgage rate of 3.63% (Moneyfacts, February 2015). We have excluded the London region from this analysis, as average prices there would mean that an equity investment of £100,000 would not be enough to raise a buy-to-let mortgage.
Our analysis shows that in six out of the nine Martin & Co regions (excluding London), net rental income from property exceeds annual income from taking an annuity. According to this, the best opportunities lie in the Thames Valley, West England and South Wales, where rental income could yield as much as 25% more than an annuity. Moreover, although rental income is lower than the return from an annuity in some localities, this does not take into account potential for capital growth, which could add considerably to the total investment return. For instance, average house prices in the Home Counties have risen by 40% in the last decade, making it one of the stronger performing regions of the last ten years for total returns.
number of viewings per properties available
SOurCE: MArTIn & CO
6.07.78.38.49.310.6
2009
2010
2011
2012
2013
2014
number of buy-to-let loans issued across the uk
Annual net rental income
SOurCE: MArTIn & CO, pEnSIOn InCOME bASED On SIngLE LIfE, LEVEL, nO guArAnTEE, AgE 55 AS AT MArCH 2015 rEnTAL InCOME WILL bE SubjECT TO TAx
£0 £6,000
1 THames valley, w englanD & s wales
2 scoTlanD3 HerTforDHsire,
BeDforDsHire & camBriDgesHire
4 n wesT & n wales 5 miDlanDs6 souTHern region7 annual pension
income8 ne englanD 9 essex, norfolk
& suffolk10 s Home counTies
1234
678910
5
60,000
Q1 2009
Q3 2009
Q1 2010
Q3 2010
Q1 2011
Q3 2011
Q1 2012
Q3 2012
Q1 2013
Q3 2013
Q1 2014
Q3 2014
25%
50,000
20%
40,000
15%
30,000
10%
20,000
5%
10,000
0
0%
£1,000 41% Amount per month over which one-fifth of tenants are prepared to spend on rent
percentage of tenants seeking properties with at least two bedrooms
4
WHAT SHOuLD LAnDLOrDS InVEST In?
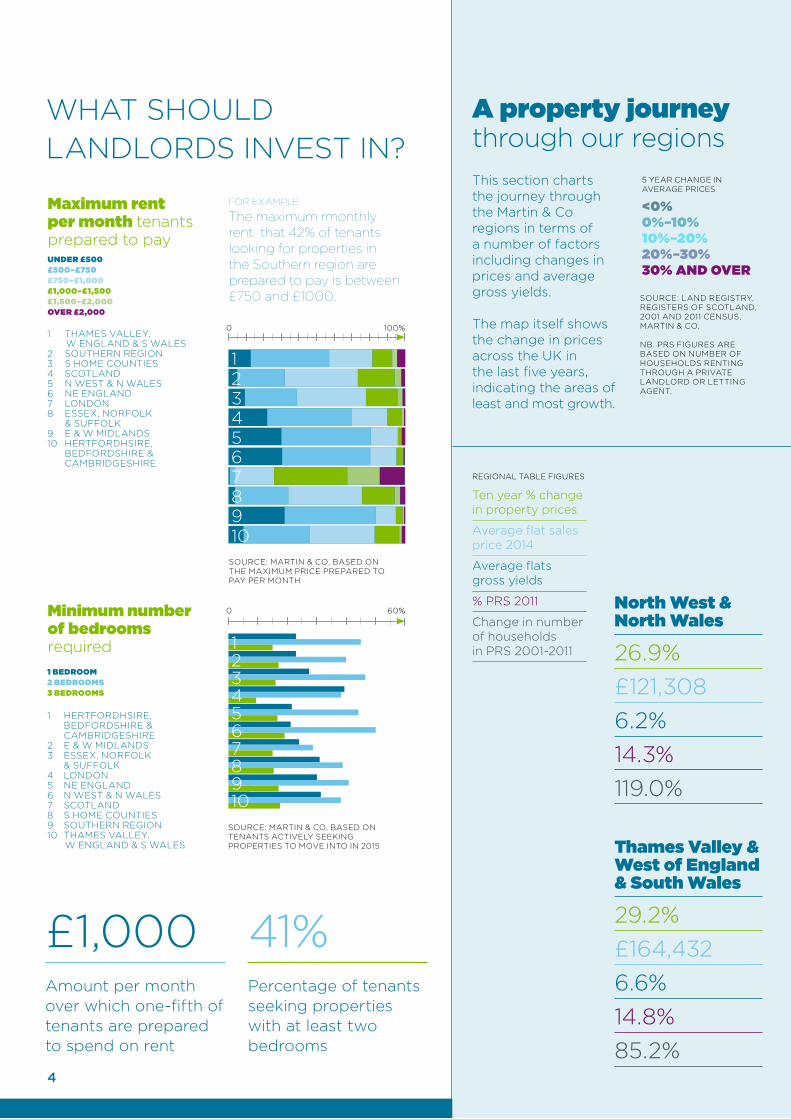
a property journey through our regions
SOurCE: LAnD rEgISTry, rEgISTErS Of SCOTLAnD, 2001 AnD 2011 CEnSuS, MArTIn & CO.
nb. prS fIgurES ArE bASED On nuMbEr Of HOuSEHOLDS rEnTIng THrOugH A prIVATE LAnDLOrD Or LETTIng AgEnT.
<0%0%–10%10%–20%20%–30%30% anD over
Ten year % change in property prices
Average flat sales price 2014
Average flats gross yields
% prS 2011
Change in number of households in prS 2001-2011
north west & north wales
26.9%£121,3086.2%14.3%119.0%
Thames valley & west of england & south wales
29.2%£164,4326.6%14.8%85.2%
5 yEAr CHAngE In AVErAgE prICES
rEgIOnAL TAbLE fIgurES
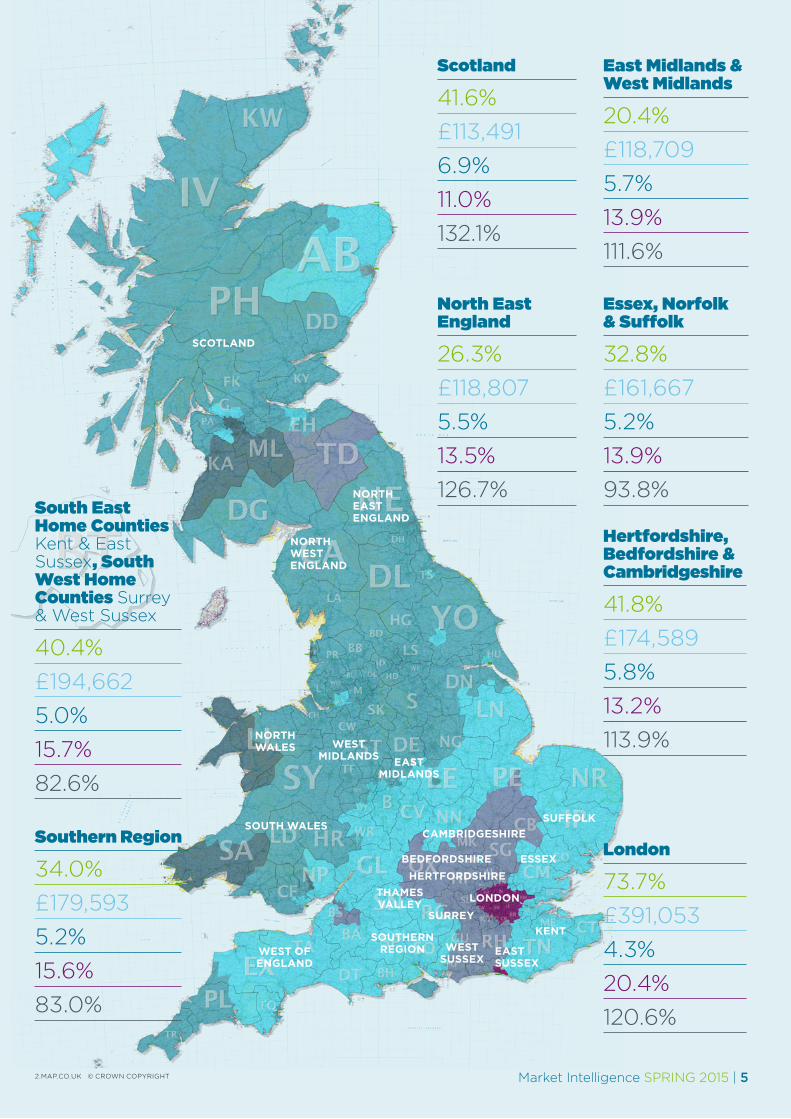
This section charts the journey through the Martin & Co regions in terms of a number of factors including changes in prices and average gross yields.
The map itself shows the change in prices across the uk in the last five years, indicating the areas of least and most growth.
1
2 3 4 5 6 7 8
9 10
1
2 3
4 5 6 7 8 9 10
HErTfOrDHSIrE, bEDfOrDSHIrE & CAMbrIDgESHIrE E & W MIDLAnDSESSEx, nOrfOLk & SuffOLkLOnDOnnE EngLAnD n WEST & n WALES SCOTLAnDS HOME COunTIESSOuTHErn rEgIOnTHAMES VALLEy, W EngLAnD & S WALES
THAMES VALLEy, W EngLAnD & S WALESSOuTHErn rEgIOnS HOME COunTIESSCOTLAnDn WEST & n WALES nE EngLAnD LOnDOnESSEx, nOrfOLk & SuffOLkE & W MIDLAnDSHErTfOrDHSIrE, bEDfOrDSHIrE & CAMbrIDgESHIrE
maximum rent per month tenants prepared to pay
for example
The maximum rmonthly rent that 42% of tenants looking for properties in the Southern region are prepared to pay is between £750 and £1000.
minimum number of bedrooms required
SOurCE: MArTIn & CO, bASED On THE MAxIMuM prICE prEpArED TO pAy pEr MOnTH
SOurCE: MArTIn & CO, bASED On TEnAnTS ACTIVELy SEEkIng prOpErTIES TO MOVE InTO In 2015
0 100%
0 60%
unDer £500 £500–£750 £750–£1,000 £1,000–£1,500£1,500–£2,000 over £2,000
1 BeDroom 2 BeDrooms 3 BeDrooms
1
12345678910
6
4
9
3
8
5
10
2
7
Scotland
Southern region
london
north eaSt england
north WeSt england
Kent
eaSt SuSSex
WeSt SuSSex
cambridgeShire
eaSt midlandS
WeSt midlandS
north WaleS
South WaleS
WeSt of england
bedfordShirehertfordShire
Surrey
thameS Valley
eSSex
SuffolK
Market Intelligence SprIng 2015 | 5
scotland
41.6%£113,4916.9%11.0%132.1%
east midlands & west midlands
20.4%£118,7095.7%13.9%111.6%
essex, norfolk & suffolk
32.8%£161,6675.2%13.9%93.8%
north east england
26.3%£118,8075.5%13.5%126.7%
Hertfordshire, Bedfordshire & cambridgeshire
41.8%£174,5895.8%13.2%113.9%
south east Home counties kent & East Sussex, south west Home counties Surrey & West Sussex
40.4%£194,6625.0%15.7%82.6%
london
73.7%£391,0534.3%20.4%120.6%
southern region
34.0%£179,5935.2%15.6%83.0%
2.MAp.CO.uk © CrOWn COpyrIgHT
6
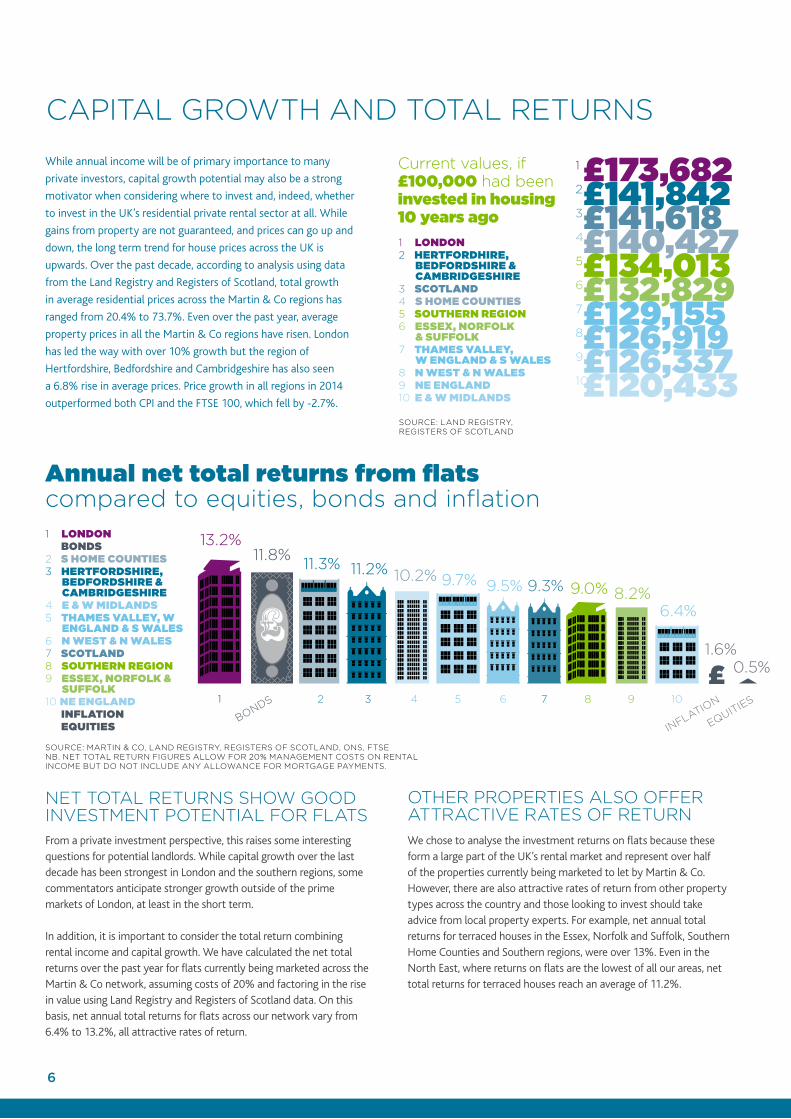
CApITAL grOWTH AnD TOTAL rETurnS
While annual income will be of primary importance to many
private investors, capital growth potential may also be a strong
motivator when considering where to invest and, indeed, whether
to invest in the UK’s residential private rental sector at all. While
gains from property are not guaranteed, and prices can go up and
down, the long term trend for house prices across the UK is
upwards. Over the past decade, according to analysis using data
from the Land Registry and Registers of Scotland, total growth
in average residential prices across the Martin & Co regions has
ranged from 20.4% to 73.7%. Even over the past year, average
property prices in all the Martin & Co regions have risen. London
has led the way with over 10% growth but the region of
Hertfordshire, Bedfordshire and Cambridgeshire has also seen
a 6.8% rise in average prices. Price growth in all regions in 2014
outperformed both CPI and the FTSE 100, which fell by -2.7%.
nET TOTAL rETurnS SHOW gOOD InVESTMEnT pOTEnTIAL fOr fLATS From a private investment perspective, this raises some interesting questions for potential landlords. While capital growth over the last decade has been strongest in London and the southern regions, some commentators anticipate stronger growth outside of the prime markets of London, at least in the short term.
In addition, it is important to consider the total return combining rental income and capital growth. We have calculated the net total returns over the past year for flats currently being marketed across the Martin & Co network, assuming costs of 20% and factoring in the rise in value using Land Registry and Registers of Scotland data. On this basis, net annual total returns for flats across our network vary from 6.4% to 13.2%, all attractive rates of return.
OTHEr prOpErTIES ALSO OffEr ATTrACTIVE rATES Of rETurn We chose to analyse the investment returns on flats because these form a large part of the UK’s rental market and represent over half of the properties currently being marketed to let by Martin & Co. However, there are also attractive rates of return from other property types across the country and those looking to invest should take advice from local property experts. For example, net annual total returns for terraced houses in the Essex, Norfolk and Suffolk, Southern Home Counties and Southern regions, were over 13%. Even in the North East, where returns on flats are the lowest of all our areas, net total returns for terraced houses reach an average of 11.2%.
Current values, if £100,000 had been invested in housing 10 years ago
SOurCE: LAnD rEgISTry, rEgISTErS Of SCOTLAnD
SOurCE: MArTIn & CO, LAnD rEgISTry, rEgISTErS Of SCOTLAnD, OnS, fTSEnb. nET TOTAL rETurn fIgurES ALLOW fOr 20% MAnAgEMEnT COSTS On rEnTAL InCOME buT DO nOT InCLuDE Any ALLOWAnCE fOr MOrTgAgE pAyMEnTS.
1 lonDon2 HerTforDHire,
BeDforDsHire & camBriDgesHire
3 scoTlanD4 s Home counTies5 souTHern region6 essex, norfolk
& suffolk7 THames valley,
w englanD & s wales 8 n wesT & n wales 9 ne englanD 10 e & w miDlanDs
1 lonDon BonDs2 s Home counTies3 HerTforDsHire,
BeDforDsHire & camBriDgesHire
4 e & w miDlanDs5 THames valley, w
englanD & s wales 6 n wesT & n wales 7 scoTlanD8 souTHern region9 essex, norfolk &
suffolk10 ne englanD inflaTion equiTies
£173,682£141,842 £141,618 £140,427 £134,013 £132,829 £129,155 £126,919 £126,337 £120,433
1
2
3
4
5
6
7
8
9
10
annual net total returns from flats compared to equities, bonds and inflation
13.2%
1
11.8%
bOnDS
11.3%
2
11.2%
3
10.2%
4
9.7%
5
9.5%
6
9.3%
7
9.0%
8
8.2%
9
6.4%
10
1.6%
InfLATIOn
0.5%
EQuITIES
£
Market Intelligence SprIng 2015 | 7
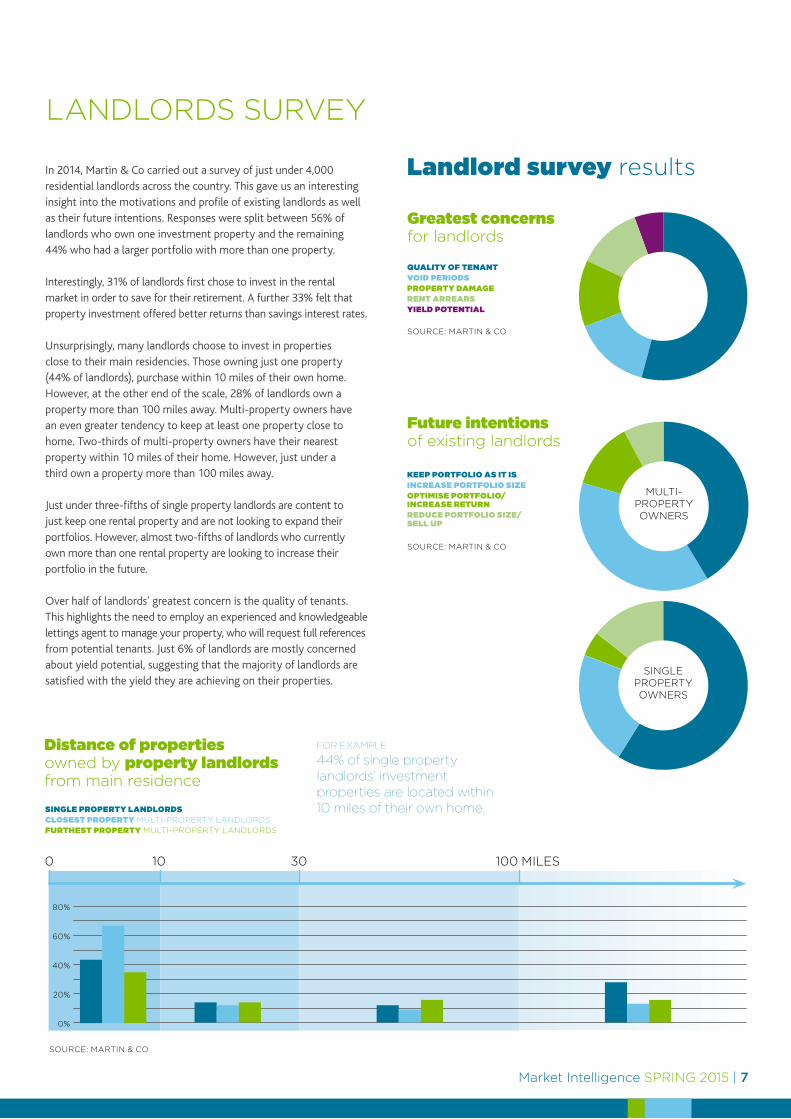
LAnDLOrDS SurVEy
In 2014, Martin & Co carried out a survey of just under 4,000 residential landlords across the country. This gave us an interesting insight into the motivations and profile of existing landlords as well as their future intentions. Responses were split between 56% of landlords who own one investment property and the remaining 44% who had a larger portfolio with more than one property.
Interestingly, 31% of landlords first chose to invest in the rental market in order to save for their retirement. A further 33% felt that property investment offered better returns than savings interest rates.
Unsurprisingly, many landlords choose to invest in properties close to their main residencies. Those owning just one property (44% of landlords), purchase within 10 miles of their own home. However, at the other end of the scale, 28% of landlords own a property more than 100 miles away. Multi-property owners have an even greater tendency to keep at least one property close to home. Two-thirds of multi-property owners have their nearest property within 10 miles of their home. However, just under a third own a property more than 100 miles away.
Just under three-fifths of single property landlords are content to just keep one rental property and are not looking to expand their portfolios. However, almost two-fifths of landlords who currently own more than one rental property are looking to increase their portfolio in the future.
Over half of landlords’ greatest concern is the quality of tenants. This highlights the need to employ an experienced and knowledgeable lettings agent to manage your property, who will request full references from potential tenants. Just 6% of landlords are mostly concerned about yield potential, suggesting that the majority of landlords are satisfied with the yield they are achieving on their properties.
landlord survey results
Distance of properties owned by property landlords from main residence
greatest concerns for landlords
future intentions of existing landlords
SOurCE: MArTIn & CO
SOurCE: MArTIn & CO
SOurCE: MArTIn & CO
single properTy lanDlorDsclosesT properTy MuLTI-prOpErTy LAnDLOrDSfurTHesT properTy MuLTI-prOpErTy LAnDLOrDS
qualiTy of TenanT voiD perioDsproperTy DamagerenT arrearsyielD poTenTial
keep porTfolio as iT isincrease porTfolio sizeopTimise porTfolio/increase reTurnreDuce porTfolio size/sell up
0 10 30 100 MILES
MuLTI- prOpErTy OWnErS
SIngLE prOpErTy OWnErS
80%
60%
40%
20%
0%
for example
44% of single property landlords’ investment properties are located within 10 miles of their own home.

ArLA, LOnDOn rEnTAL STAnDArDS, prOpErTy OMbuDSMAn, nAEA (TbC)
27,000 94%1 million 7 minutesnumber of tenants on Martin & Co’s books actively searching for properties in 2015
of our landlord clients said they would recommend us
number of tenants registered with Martin & Co over the last decade
we sell or let a property every 7 minutes in the uk
east midlands & west midlands
Beeston • Birmingham Harborne
• Birmingham Kings Heath •
Birmingham Longbridge •
Chesterfield • Coalville •
Coventry • Derby •
Gainsborough • Grantham •
Hinckley • Ilkeston •
Leamington Spa • Leicester •
Lincoln • Loughborough •
Mansfield • Mountsorrel •
Newark • Nottingham City •
Nottingham Hucknall • Rugby •
Shrewsbury • Solihull • Sutton
Coldfield • Tamworth • Telford •
Wolverhampton • Worksop
essex, norfolk & suffolk
Bury St Edmunds • Cambridge •
Chelmsford • Colchester •
Diss • Ely • Harlow • Ipswich •
Norwich • Southend-on-Sea •
Stowmarket
north east england
Beverley • Doncaster •
Guisborough • Harrogate •
Huddersfield • Leeds City
Leeds Garforth • Leeds
Horsforth • Newcastle upon
Tyne • Pontefract • Rotherham
• Saltaire • Sheffield City •
Sheffield Hillsborough •
South Shields • Sunderland •
Wakefield • Whitley Bay • York
scotlandAberdeen • Ayr • Bathgate •
Cupar • Dundee • Dunfermline
• East Kilbride • Glasgow City •
Glasgow Shawlands • Glasgow
West End • Inverness • Kinross
• Kirkcaldy • Leith • Paisley •
Stirling
Thames valley & west of england & south walesAbingdon • Banbury • Bath •
Bristol Kingswood • Cardiff •
Cheltenham • Chippenham •
Cirencester • Cwmbran •
Exeter • Falmouth • Gloucester
• Merthyr Tydfil • Newport •
Oxford • Swindon • Taunton •
Truro • Westbury • Witney •
Worcester • Yeovil
Hertfordshire, Bedfordshire & cambridgeshireBedford • High Wycombe •
Milton Keynes • Northampton •
St Albans • Stamford •
Stevenage • Welwyn
north west & north walesBiddulph • Blackpool • Chester •
Crewe • Lancaster • Liverpool
South • Macclesfield •
Manchester Central •
Manchester Chorlton •
Manchester Prestwich •
Newcastle under Lyme •
Nantwich • Preston • Rochdale •
Stafford • Stockport • Stoke on
Trent • Widnes • Wilmslow •
Wirral Bebington • Wirral
Moreton
southern region
Aldershot • Andover •
Basingstoke • Bognor Regis •
Bournemouth • Camberley •
Chichester • Gosport • Guildford
• Maidenhead • New Milton •
Petersfield • Poole • Portsmouth
• Reading • Reading Caversham •
Ringwood • Salisbury • Slough •
Southampton City •
Southampton Woolston •
Weymouth • Winchester •
Woking
londonBalham • Beckenham • Brentford
• Camden • Caterham • Chelsea
• Croydon • Crystal Palace •
Ealing • Enfield • Fitzrovia •
Islington • Kew Bridge •
London Bridge • London
Riverside • Loughton • Romford
• Ruislip • Staines • Stratford •
Sutton • Twickenham •
Wanstead • Wimbledon
south east Home counties (kent and East Sussex) & south west Home counties (Surrey and West Sussex)
Ashford • Brighton • Burgess
Hill • Canterbury • Crawley •
Dover • Eastbourne •
Folkestone • Leatherhead •
Littlehampton • Maidstone •
Medway • Reigate • Tonbridge,
Tunbridge Wells • Uckfield,
Walton on Thames • Worthing
Established in 1986, Martin & Co provides a local letting and sales service with the backing of a national brand and professional head office support.
At Martin & Co we manage over 44,000 properties, and bring the wealth of knowledge and expertise that we have gleaned from this to each of our clients. We keep our finger on the pulse of the local property market, with offices throughout the UK ready to help you let or rent a property, or buy or sell a home.
As a current or potential landlord, you can rest assured that we know what keeps you awake at night and that our service is built around keeping properties fully let, minimising the risk of rental arrears through state-of-the-art credit checking, and using independent first-class local tradesmen to keep a lid on maintenance costs. We reject “call centre” culture – all of our offices are based where your property is located so we can keep a close eye on things, just like you would if you had the time.
With a network of over 285 offices within the Martin Co pLC group, Martin & Co is the 4th largest estate and letting agent business in the uk.
Disclaimer: This report has been prepared in good faith on the basis of calculations that rely on a set of assumptions that will vary considerably between geographical regions and over time. They illustrate hypothetical examples of returns that may be possible under the given set of assumptions, however no warranty is given as to the accuracy or completeness of information contained in this report. Accordingly, this report is for general information purposes only and no liability is accepted by Martin & Co (UK) Ltd, its associates, employees, directors and representatives for any negligence in relation to the information, forecasts, figures or conclusions contained in this Report or for any loss, damage, or consequence whatsoever, arising from any action taken based on its content. This report does not constitute and must not be treated as investment advice or guidance and users should always obtain independent professional advice before making any investment decision. The content is strictly copyright and reproduction of the whole or part of it in any form is prohibited without the express prior written permission of Martin & Co (UK) Ltd.
Date of publication: April 2015
Compiled by Dataloft, www.dataloft.co.uk