
SPRING 2008
56
SPRING 2008 SPRING 2008 IS THIS PASSENGER A THREAT? IS THIS PASSENGER A THREAT? Since 9/11, Congress has allocated billions of dollars for airport security. Was the money well-spent? Since 9/11, Congress has allocated billions of dollars for airport security. Was the money well-spent? A LSO I NSIDE : • RENAULT’S UP TO SPEED French automaker overhauls supply chain • QUEUE THE VOTE Will long lines decide presidential election? • PATIENT FLOW Analytical antidote for healthcare woes • REALITY CHECK Five misconceptions about an IEOR career • THE (ALMOST) REAL DEAL New frontiers in simulation software • RENAULT’S UP TO SPEED French automaker overhauls supply chain • QUEUE THE VOTE Will long lines decide presidential election? • PATIENT FLOW Analytical antidote for healthcare woes • REALITY CHECK Five misconceptions about an IEOR career • THE (ALMOST) REAL DEAL New frontiers in simulation software A LSO I NSIDE : D RIVING B ETTER B USINESS D ECISIONS D RIVING B ETTER B USINESS D ECISIONS THE NEW COMPETITIVE ADVANTAGE INFORMS conference in Baltimore to focus on the power of analytics PREMIER ISSUE! Free subscription: http://analytics.informs.org PREMIER ISSUE! Free subscription: http://analytics.informs.org
Transcript of SPRING 2008

S P R I N G 2 0 0 8S P R I N G 2 0 0 8
IS THIS PASSENGER A
THREAT?IS THIS PASSENGER A
THREAT?Since 9/11, Congress has allocated billions of dollarsfor airport security. Was the money well-spent? Since 9/11, Congress has allocated billions of dollarsfor airport security. Was the money well-spent?
A L S O I N S I D E:
• RENAULT’S UP TO SPEED French automaker overhauls supply chain
• QUEUE THE VOTEWill long lines decide presidential election?
• PATIENT FLOWAnalytical antidote for healthcare woes
• REALITY CHECKFive misconceptions about an IEOR career
• THE (ALMOST) REAL DEALNew frontiers in simulation software
• RENAULT’S UP TO SPEED French automaker overhauls supply chain
• QUEUE THE VOTEWill long lines decide presidential election?
• PATIENT FLOWAnalytical antidote for healthcare woes
• REALITY CHECKFive misconceptions about an IEOR career
• THE (ALMOST) REAL DEALNew frontiers in simulation software
A L S O I N S I D E:
D R I V I N G B E T T E R B U S I N E S S D E C I S I O N SD R I V I N G B E T T E R B U S I N E S S D E C I S I O N S
THE NEW COMPETITIVEADVANTAGEINFORMS conference in Baltimore to focus on thepower of analytics
PREMIER ISSUE! Free subscription: http://analytics.informs.orgPREMIER ISSUE! Free subscription: http://analytics.informs.org
A N A L Y T I C S http://analytics.informs.org
We hope you enjoy the premiere issue of Analytics. You are receiving this e-magazine aspart of your relationship with one or more of our sponsors. If you would like to continuereceiving Analytics on a quarterly basis, please register (http://analytics.informs.org).
Analytics is brought to you by INFORMS (www.informs.org) – the Institute for Opera-tions Research and the Management Sciences. INFORMS is the largest membership society in the world dedicated to the analytics profession. The society publishes 12 scholar-ly journals and a membership magazine, organizes national and international conferences,bestows awards and prizes, and arranges for communication and networking among analytics professionals.
Peruse the initial issue of Analytics and tell us what you think.You can provide feedbackat http://analytics.informs.org. This digital format allows you to easily page through themagazine, share it with colleagues and click on links to gather additional information.Enjoy the premiere issue with our compliments.
REGISTER FOR A FREE SUBSCRIPTION:http://analytics.informs.org
INFORMS BOARD OF DIRECTORSPresident Cynthia Barnhart
President-Elect Don M. KleinmuntzPast President Brenda Dietrich
Secretary Anton J. KleywegtTreasurer Stephen M. Robinson
Vice President-Meetings Rina SchneurVice President-Publications Terry P. Harrison
Vice President-Sections and Societies Les Servi
Vice President-Information Technology Warren Lieberman
Vice President-Practice Activities R. John Milne
Vice President-International Activities Michel Gendreau
Vice President-Membership and Professional Recognition Pinar Keskinocak
Vice President-Education and Outreach Donna C. Llewellyn
Vice President-Marketing and Outreach Anne G. Robinson
Vice President-Chapters/Fora John W. Fowler
INFORMS OFFICES www.informs.org
Tel: 1-800-4INFORMS
Executive Director Mark G. DohertyMarketing Director Gary Bennett
Communications Director Barry List
Corporate, Member, INFORMS (Maryland)Publications and 7240 Parkway Drive,
Subdivision Services Suite 310Hanover, MD 21076 USATel.: 443.757.3500E-mail: [email protected]
Meetings Services INFORMS (Rhode Island)12 Breakneck Hill Road, Suite 102Lincoln, RI 02865 USATel.: 401.722.2595E-mail: [email protected]
ANALYTICS EDITORIAL AND ADVERTISINGLionheart Publishing Inc., 506 Roswell Street, Suite 220,
Marietta, GA 30060 USATel.: 770.431.0867 • Fax: 770.432.6969
President & Advertising Sales John [email protected].: 770.431.0867, ext.209
Editor Peter R. [email protected].: 770.587.3172
Art Director Alan [email protected].: 770.431.0867, ext.218
Welcome to Analytics
In the good old days, many “savvy” corporate CEOs and other assorted head honchosin the public and private sector routinely made critical decisions by the seat of their pants.They relied on their experience, their intuition and their “gut” to determine a course ofaction that could make or break the organization. Sometimes they were right, sometimesthey were wrong, and sometimes the organization went down the drain.
Today, more and more of these C-level decision-makers are turning to analytics for helpin the decision-making process. The stakes are just too high and the competition is just toofierce to rely on your “gut.” Instead of shouting,“show me the money,”savvy CEOs are nowshouting,“show me the data and the mathematical analysis first . . . and then I’ll show ourshareholders the money.”
The trend toward data-based decision-making is being driven, of course, by astro-nomical increases in data, mathematical modeling capabilities and computing power.Thomas Davenport and Jeanne Harris crystallized this phenomenon in their recent book,“Competing on Analytics: The New Science of Winning” (2007, Harvard Business SchoolPress). Davenport and Harris define analytics as “the extensive use of data, statistical andquantitative analysis, explanatory and predictive models, and fact-based management todrive decisions and actions.” That encompasses the work of hundreds of thousands if notmillions of “analysts” of all stripes around the world.
Which brings us to the online publication you now have opened on your computer.Analytics is designed to inform, enlighten, inspire and, yes, even entertain analysts every-where while bringing them together in an electronic sense to share successes, failuresand lessons learned. Analytics will also strive to promote the analytical profession andthe people who preach and practice it.
Most of the articles in this debut issue were drawn from OR/MS Today(www.lionhrtpub.com/ORMS.shtml), the magazine of membership of INFORMS,so when you see terms like “operations research”(O.R.), think analytics. AlthoughINFORMS officially promotes the “operations research” and “management science”professions, its members represent a galaxy of job titles, scientific fields, technicalmethodologies and special interest groups.
We could have easily filled this premier issue with supply chain stories from the manu-facturing sector or articles on revenue management and crew scheduling from the aviationindustry. Instead, we decided to publish a collection of articles that showcase the power anddiversity of analytics, from preventing potential terrorist attacks to improving patient care.The problems you encounter and the methodologies and job titles you use may be differ-ent, but you now have one thing in common: Analytics. ❙ANALYTICS
Data-Driven Decision-Making
— P E T E R H O R N E R , Editor
— G A R Y B E N N E T T , Director of Market ing, INFORMS
D R I V I N G B E T T E R B U S I N E S S D E C I S I O N SI N S I D E S T O R Y

They’ll never see the big picture.
But you can. With proven optimization and analytic software from SAS.
www.sas.com/sky
SAS and all other SAS Institute Inc. product or service names are registered trademarks or trademarks of SAS Institute Inc. in the USA and other countries. ® indicates USA registration. Other brand and product names are trademarks of their respective companies. © 2007 SAS Institute Inc.All rights reserved. 449537US.0707
Pigs can’t lift their eyes to look up in the sky.

A N A L Y T I C S2 REGISTER NOW TO RECEIVE A FREE SUBSCRIPTION TO ANALYTICS:http://analytics.informs.org
C O N T E N T S
DEPARTMENTS4 Inside Story
6 Viewpoint
8 Was It Something I Said?
10 Forum
46 Roundtable Profile
50 ORacle
52 Last word
FEATURES12 MAKING SKIES SAFER
By Laura Mclay, Sheldon Jacobson and John KobzaApplying analytics to aviation prescreening systems.
18 RENAULT SPEEDS UP DELIVERYBy Alain NguyenAnalytics help French automaker overhaul its supply chain.
22 TO QUEUE OR NOT TO QUEUE?By Alexander S. Belenky and Richard C. LarsonIn ’08 U.S. presidential election, that should not be a question.
28 PATIENT FLOWBy Randolph HallNew queueing theory for healthcare addresses crit ical problem.
34 REALITY CHECKBy Carrie BeamThe top five misconceptions about starting a consult ing career.
38 NEW FRONTIERS IN SIMULATIONBy James SwainSurvey of discrete-event simulation software: traditions and trends
42 NEW COMPETITIVE ADVANTAGEINFORMS practice conference to focus on the power of analytics.
S P R I N G 2 0 0 8
Free SubscriptionTo register for a complimentary subscription to
Analytics, visit: http://analytics.informs.org
Analytics is published quarterly by the Institute for Operations Research and the Management Sciences (INFORMS). For a free subscription, register at http://analytics.informs.org. Address other correspondence to the editor, Peter Horner, [email protected]. The opinions expressed in Analytics are those of the authors, and do not necessarily reflect the opinions of INFORMS, its officers,Lionheart Publishing Inc. or the editorial staff of Analytics. Analytics copyright ©2008 by the Institute for Operations Research and the Management Sciences. All rights reserved.
22
38
42

Only Risk Solver has instant, interactive risk analysis, with lightning-fast simulations run each time you change a number. Charts update instantly, showing a new distribution of outcomes for each change –and new insights for you. No other product comes close to Risk Solver’s speed and interactivity.
Only Risk Solver works with our leading-edge Premium Solver Platform Stochastic Edition to give you breakthrough capabilities for robust optimization, stochastic programming, and simulation optimization. �� ����� ����� ���� ��� � �� �� � ������� ����� �� �� optimal decisions for your risk models.
Only Risk Solver empowers you to explore the new discipline of Probability Management, with built-in ������ ��� �������� �� ��� ������ ��� �������� �� ������� �� �������� �
Only Risk Solver includes a “runtime package,” Risk Solver Engine, with complete Excel and VBAprogrammability, making it easy for you to develop and deploy your applications to end users.
Risk Solver also offers more sampling methods, more analytic distributions, more statistics and risk measures, more �� ��� ����������� �� � �������� ������ more !�"���� ����� �� ����� �� ��#easier, faster graphical interface. All of which is designed to make your analysis more productive. Download a free trial version at www.solver.com today – and see for yourself!
Find out more at www.solver.com/risk-analysis
RISK SOLVER: The New ChoicePowerful, Interactive Risk Analysis in Excel
Frontline Systems, Inc. 775-831-0300 775-831-0314 fax [email protected]

Based on the newest insights from research & academia, requests from our customers, the latest technological developments and our personal ideas and experience, the following major features have been made available in the most recent AIMMS release:
BENDERS DECOMPOSITION FOR STOCHASTIC PROGRAMMINGThe nested Benders decomposition as a user-customizable procedure inside the library for operations on Generated Mathematical Programs (GMP) - similar to the AIMMS Outer Approximation (AOA) solver - for solving (linear) multi-stage stochastic programming problems.
NONLINEAR PRE-SOLVEPowerful pre-solve procedures for NLP and MINLP, like the pre-solve procedures employed by LP/MIP solvers, including inversion of non-linear expressions, solving the variables in the pre-triangular part of the matrix, tightening the bounds of variables based on the linear and non-linear constraints, and reduction of instruction trees to speed up function evaluations.
MULTI-START SOLVE FOR NLPCalling an NLP solver from multiple starting points and reports back the best feasible solution as its final solution (all feasible solutions can be retrieved as well). Again, written as a user-customizable procedure within the GMP library, allowing modelers to adapt the algorithm to their own needs.
NETWORK OBJECT, GIS, AND PIVOT TABLE EXTENSIONSA multiple of extensions will be made to specific GUI objects such as curved & segmented arcs in the network object, extended GIS connectivity (Yahoo® Maps, ESRI® Shape Files), and advanced sorting and controllability in the Pivot table.
A FREELY DISTRIBUTABLE AIMMS VIEWERThe AIMMS Viewer will allow anyone to view & browse the results of an AIMMS-based optimization application through the graphical user interface of the application. Best of all, it is free. Opt to make
your application viewable (if needed in a protected fashion) and start sharing. Combined with the new single project file concept, the AIMMS Viewer provides a convenient way to distribute a complete interactive report or a dynamic dashboard.
For details on AIMMS or to obtain a free trial license of AIMMS, please visit our website.
AIMMS Optimization ModelingBridging the gap between OR & Business!
www.aimms.com
DOWNLOAD YOUR FREE AIMMS TRIAL
AIMMS is a registered trademark of Paragon Decision Technology B.V.
Americas • Kirkland, WA, USA • T +1 (425) 576 4060
Europe • Haarlem, The Netherlands • T +31 (23) 5511 512
Asia Pacific • Singapore • T +65 96404182
Internet: www.aimms.com • E-mail: [email protected]


A N A L Y T I C S6 REGISTER NOW TO RECEIVE A FREE SUBSCRIPTION TO ANALYTICS:http://analytics.informs.org
Analyzing Decisionsto Counter Terrorism
V I E W P O I N T
As the defining issue of his presidency,the decision to invade Iraq is without ques-tion the most important event of GeorgeW. Bush’s political career. Had he used deci-sion analysis in making this momentouschoice, as proposed in “Should the U.S.Have Attacked Iraq” (OR/MS Today,December 2006), perhaps the processwould have been more systematic, and per-haps Bush would have found a way toretain public support for his eventualchoice. But had he used decision analysis, Ihope that Bush would have gone wellbeyond exploration of the odds that Iraqdid or did not possess weapons of massdestruction (WMD), for the success or fail-ure of the mission should certainly not bejudged by this question.
WMD is a nebulous term encompassinga range of weapons, some of which arewidely available and easy to manufacture,others of which are not particularlydestructive compared to conventionalweapons. The “weapons” (box cutters andthe like) used by the terrorists who perpe-trated the 9/11 attacks were so convention-al that they could have been purchased atthe local grocer, and terrorists in the pasthave never depended on non-conventionalweapons to further their cause. The keyquestion here should not have beenwhether Iraq possessed WMD, but whetherit offered a unique conduit of weapons thatwould empower terrorists. Were theweapons suspected of being in Iraq unavail-able elsewhere? Did Iraq not only possessthese weapons, but was it also collaboratingwith terrorists? Were these weapons sothreatening that they substantially added tothe danger of catastrophic terrorism?
More important than WMD, the successor failure of the Iraq mission might bejudged by a less public argument for theinvasion, that of installing a democracy inthe center of the richest oil producingregion of the world, and a hoped for domi-no effect influencing the surrounding
nations. Here we had a truly visionary goal,but one that was harder to explain to thepublic than, for instance, the imagery ofSecretary Rice’s “mushroom cloud” conse-quence of Iraq’s alleged WMD. We also hada considerably more difficult goal toaccomplish, one where military actionwould have been one of many possible tac-tics and which, in retrospect, was not veryeffective. In this context, the uncertaintypreceding the Iraq invasion was not somuch whether WMDs were present, butwhether military intervention would bringabout long-term stability.
I raise these points to frame the questionof how decision analysis might be used toimprove our response to terrorism, and toillustrate three challenges: adversarialbehavior, interdependencies and politics.
Terrorists are by nature agile and adap-tive adversaries; they operate clandestinelyand succeed by surprise. They cannot bestopped by protecting individual targets, orby preventing access to any one group ofweapons because alternatives will alwaysexist. And history does not provide a verysatisfying prediction for the likelihood offuture terrorist actions. While it might benoble to envision decision trees that specifythe likelihoods of alternative futures, theseprobabilities are extraordinarily difficult toestimate.
Our strategies for fighting terrorism arehighly interdependent because our finiteresources are insufficient to protect againstall threats. By selecting Iraq for militaryaction, we have made that one part of thewar on terrorism our first priority for fed-eral budgeting and allocation of militaryassets. We have also made it our first prior-ity for the attention of the commander-in-chief, as well as our congressional leaders.Given our limits, the decision to invade Iraqshould not be judged just on whether itachieved its mission; it should also bejudged on whether Iraq should have beenpicked over its alternatives, such as address-
ing the threats posed by Iran or NorthKorea, or more directly targeting terroriststhemselves.
Lastly, the decision to go to war, aswith most strategic choices in terrorism,must be placed in its political context.President Bush could not have authorizedthe invasion without first gaining supportfrom Congress. Reluctantly, he alsosought support from the United Nations,and more deliberately he sought activeparticipation from our allies. The steps toconvince others to collectively support achoice are in many ways distinct from thesteps of making the choice, making ithard to decipher the true goals from pastpublic statements.
All told, it is no easy task to encapsulatethe Iraq invasion within a decision tree. Yetdecision analysis could have been used toilluminate the question of how best tocounter terrorism; to elicit alternativecourses of action, anticipate the response ofadversaries and specify the goals. Retro-spectively, we might look back at the Iraqwar and evaluate the decision within thenarrow lens of how accurate were our pre-dictions that Iraq possessed WMD. But thedecision was considerably more complex,revolving around two complementarygoals, one immediate – reducing the threatposed by al-Qaeda – and one long-term –building stability and democracy in theMiddle East. And, perhaps most impor-tantly, were we trying to solve the rightproblem?
As the O.R. community engages in thebig challenges of the day, such as how tobest counter terrorism, we should not betempted to squeeze the questions into theframework of our existing models, becausethe problems may go beyond what we haveseen in the past. We should, however, useour skills to stimulate the type of creativethinking envisioned by the 9/11 Commis-sion, in which we reduce the threat of ter-rorism through better understanding of themotivations and tactics of our adversaries,as well as the available alternatives forreducing the threat. ❙ANALYTICS
Randolph Hall is vice provost for researchadvancement at the University of SouthernCalifornia, and was founding principalinvestigator for CREATE, the Center for Riskand Economic Analysis of Terrorism Events.
B Y R A N D O L P H W . H A L L

A N A L Y T I C S8 REGISTER NOW TO RECEIVE A FREE SUBSCRIPTION TO ANALYTICS:http://analytics.informs.org
When we left off last time, I had just fin-ished ranting about the first salespersonwho came rolling into my presence with aslick return-on-investment model and triedto shove it down our throat in order tosomehow close a deal before the close of hisfiscal quarter. Sales managers refer to this as“pulling a rabbit out of a hat.”
Let’s recap a few things about ROI mod-els that this story nicely illustrates.
It’s all about the pronouns. Thissalesman (actually happens to be a malein this example) was basically trying touse his ROI model to justify the pur-chase of his product to enable him tomeet his short-term business goals. Ourbusiness, our goals, our priorities, ourprocesses and our risks were all notice-ably absent from consideration (notethat our costs were specified, thoughnot emphasized).
A couple of things to watch out forhere. Many such ROI models purport tobe built on your data (for things likelabor costs, interest rates and forecastedworkload). Dig in further here. Howsolid is this data? Who within yourcompany has vetted it? How much vari-ability is embedded into it? Moreover,the logic about how this data is used istypically not at all transparent, whichleads to our next key point:
What is the model assuming? Most ROImodels make extravagant claims about costsavings that are based on very specific logi-cal assumptions. In particular (classic phe-nomenon), ROI models typically assumethat optimization based on forecasted val-ues will be implemented as if this demandis the ordained truth. In contrast, everyoneinvolved with a particular process will belooking closely at their own incentives(“management really looks hard at mylabor-to-sales ratio,”“I take a huge amountof flack if my on-time percentage is toolow,”etc.) and will do everything possible to
manage their piece of the puzzle, and theirlocalized risk, accordingly. Frankly, giventhe quality of 99 percent of what people inthe business world call “forecasts,” youwould probably do the same thing if youwere in their shoes.
This is a basic, primal phenomenon.Gene Woolsey has talked about this forroughly the last half century (see Woolsey,R. E. D.,“Real World Operations Research:The Woolsey Papers,” edited by R. L.Hewitt, Lionheart Publishing, 2003). Yetnearly every ROI model I’ve ever seenignores it, for the simple reason that it’shard to model well.
Some key questions. Suppose for themoment that with diligent questioning youhave managed to understand the crux ofthe ROI model that has been created. Thenyou have to ask yourself some fundamentalquestions:• How confident are you about the
savings and the time needed toachieve them? Because the costs arealmost always up-front and definite,and whoever funds this investmentwill notice that immediately.
• Do you believe the underlyingconceptual model? You will have topresent it “up” in your organization,both to your management and tofinance. They will have a muchshorter attention span for the detailsthan you do, so you need to be ableto present the core story succinctly. Ifyou don’t believe it, you can be surethat they will not either.
• What resources and commitment areneeded from which key people orgroups to achieve the results that theROI model claims? Do these peopleunderstand what is expected ofthem? What are their personalmotivations to see this projectsucceed (or fail)? Are any costsassociated with these commitmentsreflected in the ROI model itself?
Skeptics will abound. If you’re notskeptical about the ROI model in front ofyou, either because you believe everythingyou’re told or because you feel that you’vedug into it and understand the answers tothe above questions, great! But, rememberthat others who have less invested in theresults that the model claims, mostnotably executives, are likely to be far moresuspicious.
There are a number of reasons for thissuspicion – overlooked costs, suspiciouscause-and-effect relationships, risks asso-ciated with execution and all of thethings that we’ve already talked about.Beyond all that, there’s also one that weOR types never even think of: Simplysaving money, even in the recent eco-nomic downturn, is not automatically atthe top of the executive agenda. PeterMayer’s recent survey [Meyer, P., 2002, “IsMoney the Right Pitch?” Business andEconomic Review, Vol. 20, No. 3, pgs. 20-22] reinforces well-established ideas(Woolsey again!) that there are in factdifferent questions that most leadersfocus on, such as identifying areas forgrowth, simplifying business processesand eliminating absurd practices whilekeeping the machine moving.
To be fair, ROI models have some realvirtues, even when presented by salespeo-ple. They are an instrument for structureddata collection and business processreview, which is often instructive on itsown. When your own business processesare far more complex than what the modelincludes, it may be an opportunity to con-sider why you do things the way that youdo. ROI model results may enable you,through judicious questioning, to learnsomething about how your competitorsare handling similar situations.
But here’s the kicker: The people whofoist the ROI model upon you are almostnever around to deal with the complexitiesof trying to achieve the results that theirmodel promised would magically appear.The people that you presented the results toalmost always are. ❙ANALYTICS
Vijay Mehrotra ([email protected]) is afaculty member in the Decisions SciencesGroup in the College of Business at SanFrancisco State University and anoperations management consultant.
The Tr oub l e w i t h RO I
B Y V I J A Y M E H R O T R A
WA S I T S O M E T H I N G I S A I D


A N A L Y T I C S10 REGISTER NOW TO RECEIVE A FREE SUBSCRIPTION TO ANALYTICS:http://analytics.informs.org
When I first learned that I was going tothe operations research conference held inVancouver, Canada, last spring, I had beensupporting the Cisco Analytical ForecastingTeam as an information technology analystfor about eight months. The team’s manag-er had decided to bring along the IT coun-terparts to the conference since we hadbeen closely collaborating with team mem-bers for many months. I did not under-stand why I was going at first, and it was notuntil I was at the conference that I realizedwhy I was there. At that time, I had no ideawhat INFORMS or O.R. was about and wasmore confused and nervous than curious. Ithought, “Are there only going to be busi-ness people or statisticians at the confer-ence? Am I going to be the only IT person?”In the end, however, I was very glad that Ihad gone. Before I jump to why that is, letme start from the beginning and explainhow I went from confused to enlightenedin a matter of three days.
Before the conference even started, I hada sense that O.R. was more than just analyt-
ical forecasting when Ilooked through theINFORMS Web siteand saw the catalog ofsessions. “Hmm,” Ithought, “what are allthese companies doingat an operations research conference? Whyare there so many delivery companies here?They don’t have any inventory, so whywould they need to forecast or do anyresearch?”I eventually realized that my mis-take was paying too much attention to thewords “operations” and “research” individ-ually rather than the combined term, oper-ations research.
On my first day in Vancouver, I attend-ed the morning breakfast before the ple-nary session. I figured I might as well getacquainted with people from other com-panies and see what they were doing. Italked to one individual who had been aprofessor at a prestigious university andwho currently works for a big industry. Hedescribed what he had been doing and got
into some details of how he was usingO.R., which was a bit over my head, but Ihad my first taste of what operationsresearch could be about.
When he asked me what I was doingwith O.R., I explained that I was part of theIT support for the analytics team. Therewas an immediate awkward pause.
The man murmured,“IT?”I gave him a nervous nod.“Boy, do I have a few words to say about
IT!” the man said angrily.Thankfully, before he had a chance to
start, it was already time for the plenary andI was saved by the bell. I wondered tomyself, “Am I in the wrong place rightnow?” The experience did not deter mefrom wanting to learn about O.R., however;it ignited more curiosity of what O.R. wasreally about and made me wonder how ITfit in the whole picture.
The turning point of the conferencewas when the sessions started. I satthrough all the sessions that I thoughtcould pertain to learning what O.R. wasall about, as well as sessions thatsparked an interest in me. For example,I attended the “Sports and O.R.” ses-sion, where they used an O.R. tool tooptimize the lineup of different sports
teams. With O.R., you can not onlyoptimize the lineup, but also find theflaws of a non-O.R. lineup and justifychanging it. The presenter used agraphical user interface to do all thesecalculations, and I thought, “Hey this isprobably where I would be useful. Theywould definitely need IT to set up andsupport the application!”
I also attended the sessions on how O.R.can be used by the military for combat sit-uations, hospitals for ambulance dispatch-ing and UPS for optimizing delivery routes(got my answer on how a service providercompany would use O.R.!). These sessionsconvinced me that O.R. is extremely impor-tant, and that IT needs to be involved tohelp execute and support the applications
Wha t ’ s an I T GuyDo ing a t an O .R .
Con f e r ence ?B Y J E R R Y Y A N G
F O R U M
hese sessions convinced me that O.R. is
extremely important, and that IT needs
to be involved to help execute and sup-
port the applications in those situations. T
The Cisco team learned how to improve efficiency and increase revenues at the 2007 INFORMS Practice Conference.

E D I T O R ’ S N O T E :
The 2008 INFORMS Practice Conference (www.informs.
org/Conf/Practice08), which will focus on the
competitive advantage of analytics, will be held April 13-
15 in Baltimore. A preview of the conference appears
on page 42.
in those situations. In addition, I wastremendously glad that my own companyis heading toward that direction and agreesthat the use of O.R. for analytics is critical toour success.
For me, the most useful and mostenlightening part of the O.R. conferencewas participating in the Birds-of-a-Featherdiscussion group. The session I attendedwas “Optimizing the Relationship betweenIT and ORMS.”
Of course, I was very nervous given myexperience at breakfast earlier in the day.But in this session, I was able to discussissues that people are confronting: in par-ticular, issues that O.R. professionals haveencountered when they work with IT. I gota sense that O.R. professionals realize theneed for IT since many applications needIT support in planning and execution, butmany challenges must be addressed. Themain challenge that was discussed in thissession was the quest for an “end state,”or afreeze in the requirements. In practice, ITalways needs an “end state” to the require-ments of a project in order to start thedevelopment and testing process. However,in O.R. there is never a true “end state,”since O.R. is constantly changing to find themost optimal model. By nature, this is acause of conflict and frustration betweenO.R. and IT.
Another interesting topic was whether itis better to use an “out-of-the-box”applica-tion as the solution to an O.R. problem orto use an “in-house”customized tool creat-ed by the IT staff. O.R. professionals, in gen-
eral, are not fond of an out-of-the-boxsolution because the implementation isslower and because most vendors create a“one application fits all”product that hasn’tbeen optimized for O.R.’s specific needs. SoO.R. professionals tend to be bigger fans ofa customized solution. From an IT perspec-tive, we like an out-of-the-box solutionbecause we do not want to reinvent thewheel. If it is on the market already, thenmore than likely the product is a stable andpopular tool that has been well tested andhas support from the vendor to help itsintegration with our existing systems. I wasable to discuss the IT’s point of view. I thinka few of the O.R. professionals at the dis-cussion got a good understanding of howIT staff felt about this, and I got a goodunderstanding of the O.R. perspective.
In the end, we decided that there is noone answer to these differences between ITand O.R. We realized that a compromisehas to be made to fulfill each other’s needsand that collaboration is the key to suc-cess. Overall, this discussion was definitelyworthwhile, and I hope that some O.R.professionals will more actively involvetheir IT partners in their projects. I alsohope that INFORMS continues to havediscussions that involve O.R. and IT infuture conferences.
By the end of the conference, I becamemore knowledgeable in the capabilities ofO.R. and its potential impact on societythrough the way it affects how a companyoperates and the solutions it creates. Irealize that having O.R. can not only have
a significant impact on the company, butcan also be applied in any every field ofwork where a decision needs to be madeor where an area can benefit by optimiza-tion. I would strongly recommend that allcompanies consider bringing their ITpartners to the INFORMS conference tohelp them learn the importance of O.R.and the significant impact O.R. has on thecompany. In the end, if IT team membersknow the importance of what O.R. isdoing, they are more likely to work hard-er to see the success of any O.R. applica-tion and projects. That will reduce theheadaches and sleepless nights worryingabout whether IT will be on the samepage with the O.R. team. I would love togo to the INFORMS Practice Conferenceagain next year to see more of the resultsof some of the groups and many moreapplications of O.R. and how IT played arole in their success. It would be fascinat-ing to see what kind of results came fromthe sessions that I attended this year andwhat progress companies have madeusing O.R. ❙ANALYTICS
Jerry Yang is technical lead on the IT teamsupporting the Analytical Forecasting Teamat Cisco.
w w w . i n f o r m s . o r g 11
ANALYTICS... i n the News
P&G’S WEGRYN ADDRESSES ANALY TICS CONFERENCEProcter & Gamble’s Glenn Wegryn, speaking at the recent CFO Performance Analytics Conference in San Francisco, covered the spec-
trum of analysis methods in use across the company. Wegryn, the associate director of Product Supply Analytics, provided rationale for
the growing need for analytics in business to stay competitive by managing increasing complexity, leveraging the exploding creation and
availability of data, better understanding shifting customer markets, and smarter cost and cash management.
“One of the most important contributions of analytics is the ability to focus on what needs to be decided, then harnessing the right
advanced analysis tools and information to evaluate a wide spectrum of options efficiently, leading to the right course of action to take,”
Wegryn said.
Wegryn went on to describe how analytics is managed within P&G’s shared services organization, enabling availability of the service
to all business units and flowing the right resources at the right time, enabling faster, more informed decisions by executive clients at the
company.
“We focus our skilled analytic resources on the highest-value decisions, keeping to the strategic high-ground,” Wegryn added. “This
enables an extremely high return on investment for the company.”
Wegryn concluded with insights on how analytics changes the competitive playing field both inside the company and with external part-
ners by improving operations and relationships with P&G’s suppliers, service vendors and customers.

Making Skies
Safer
Making Skies
SaferBy Laura A. McLay, Sheldon H. Jacobson and John E. KobzaBy Laura A. McLay, Sheldon H. Jacobson and John E. Kobza
Applying analytics to aviation passenger prescreening systems.
Applying analytics to aviationpassenger prescreening systems.
Images Courtesy of Dreamstime.com
Top left: Fred Goldstein; Main image: Elena Ray
Images Courtesy of Dreamstime.com
Top left: Fred Goldstein; Main image: Elena Ray
A N A L Y T I C S12 REGISTER NOW TO RECEIVE A FREE SUBSCRIPTION TO ANALYTICS:http://analytics.informs.org

HE TERRORIST EVENTS ON SEPT. 11, 2001, WILL FOREVERALTER THE WAY OUR NATION VIEWS AVIATION SECURITY. The
article by Barnett (2001) in OR/MS Today highlighted numerous important
questions and issues surrounding the events of that day and how air travel has
been and will continue to be affected. Since then, aviation security systems
have undergone significant changes, though the analysis of such systems con-
tinues to lag well behind their actual operation. Operations research provides
a unique set of methodologies and tools for designing and analyzing aviation
security systems, since the foundation of operations research is based on
applying analytical methods to optimally allocate and use scarce assets in
making better informed decisions.
The purpose of this article is to provide a brief survey of aviation security sys-
tem applications that have been used or are well positioned to benefit from
operations research modeling and analysis techniques. The research efforts dis-
cussed apply operations research methodologies to address problems in the
area of passenger prescreening, an important and highly visible aspect of avia-
tion security operations. Three specific issues are highlighted: identifying perfor-
mance measures, analyzing how passenger prescreening systems can fail or
succeed, and designing effective passenger screening systems.
Over the past several years, there have been numerous changes to all
aspects of aviation security systems, all designed to prevent a reoccurrence of
the events on Sept. 11, 2001. Some of the changes include reinforcing cock-
pit doors, expanding the federal air marshal program, allowing only ticketed
passengers to enter the enplane side of airport terminals, using bomb-sniffing
dogs and screening all checked baggage for explosives.
Many of the changes implemented have been politically driven – they have
been a direct result of the “kneejerk” emotional response to Sept. 11, rather
than from any coordinated, systematic analysis and planning. For example,
within two months after the attacks, the United States Congress mandated
100-percent screening of checked baggage by a federally certified screening
device or procedure by Dec. 31, 2002, as part of the Aviation and Transporta-
tion Security Act. Prior to Sept. 11, only a small fraction of checked baggage
was screened in this manner. The rapid deployment of explosive detection
devices in order to meet this deadline resulted in several billion dollars being
invested before any type of systematic analysis of baggage screening security
systems was performed. Operations research provides methodologies that can
be used to determine how taxpayer dollars can be optimally spent and how
security system assets can be optimally used.
Tw w w . i n f o r m s . o r g 13
S E C U R I T YA V I A T I O N
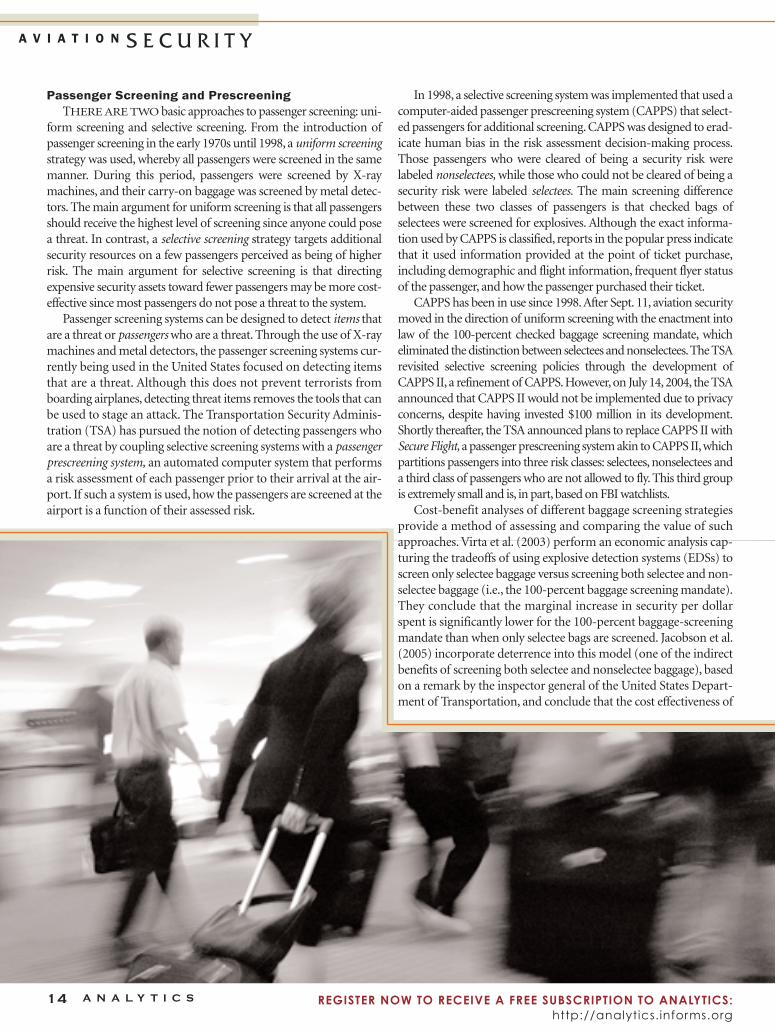
Passenger Screening and PrescreeningTHERE ARE TWO basic approaches to passenger screening: uni-
form screening and selective screening. From the introduction ofpassenger screening in the early 1970s until 1998, a uniform screeningstrategy was used, whereby all passengers were screened in the samemanner. During this period, passengers were screened by X-raymachines, and their carry-on baggage was screened by metal detec-tors. The main argument for uniform screening is that all passengersshould receive the highest level of screening since anyone could posea threat. In contrast, a selective screening strategy targets additionalsecurity resources on a few passengers perceived as being of higherrisk. The main argument for selective screening is that directingexpensive security assets toward fewer passengers may be more cost-effective since most passengers do not pose a threat to the system.
Passenger screening systems can be designed to detect items thatare a threat or passengers who are a threat. Through the use of X-raymachines and metal detectors, the passenger screening systems cur-rently being used in the United States focused on detecting itemsthat are a threat. Although this does not prevent terrorists fromboarding airplanes, detecting threat items removes the tools that canbe used to stage an attack. The Transportation Security Adminis-tration (TSA) has pursued the notion of detecting passengers whoare a threat by coupling selective screening systems with a passengerprescreening system, an automated computer system that performsa risk assessment of each passenger prior to their arrival at the air-port. If such a system is used, how the passengers are screened at theairport is a function of their assessed risk.
A N A L Y T I C S14 REGISTER NOW TO RECEIVE A FREE SUBSCRIPTION TO ANALYTICS:http://analytics.informs.org
In 1998, a selective screening system was implemented that used acomputer-aided passenger prescreening system (CAPPS) that select-ed passengers for additional screening. CAPPS was designed to erad-icate human bias in the risk assessment decision-making process.Those passengers who were cleared of being a security risk werelabeled nonselectees, while those who could not be cleared of being asecurity risk were labeled selectees. The main screening differencebetween these two classes of passengers is that checked bags ofselectees were screened for explosives. Although the exact informa-tion used by CAPPS is classified, reports in the popular press indicatethat it used information provided at the point of ticket purchase,including demographic and flight information, frequent flyer statusof the passenger, and how the passenger purchased their ticket.
CAPPS has been in use since 1998.After Sept. 11, aviation securitymoved in the direction of uniform screening with the enactment intolaw of the 100-percent checked baggage screening mandate, whicheliminated the distinction between selectees and nonselectees.The TSArevisited selective screening policies through the development ofCAPPS II, a refinement of CAPPS.However,on July 14,2004, the TSAannounced that CAPPS II would not be implemented due to privacyconcerns, despite having invested $100 million in its development.Shortly thereafter, the TSA announced plans to replace CAPPS II withSecure Flight, a passenger prescreening system akin to CAPPS II,whichpartitions passengers into three risk classes: selectees, nonselectees anda third class of passengers who are not allowed to fly. This third groupis extremely small and is, in part, based on FBI watchlists.
Cost-benefit analyses of different baggage screening strategiesprovide a method of assessing and comparing the value of suchapproaches. Virta et al. (2003) perform an economic analysis cap-turing the tradeoffs of using explosive detection systems (EDSs) toscreen only selectee baggage versus screening both selectee and non-selectee baggage (i.e., the 100-percent baggage screening mandate).They conclude that the marginal increase in security per dollarspent is significantly lower for the 100-percent baggage-screeningmandate than when only selectee bags are screened. Jacobson et al.(2005) incorporate deterrence into this model (one of the indirectbenefits of screening both selectee and nonselectee baggage), basedon a remark by the inspector general of the United States Depart-ment of Transportation, and conclude that the cost effectiveness of

dollars in losses to the airlines for a single false alarm incident.Other performance measures deal with passenger screening sys-
tems in transition. When CAPPS was used to determine whichchecked baggage was screened for explosives between 1998 and2001, there was an insufficient number of baggage screening devicesavailable in many of the nation’s airports to screen all selectee bagsfor explosives. This partial baggage-screening problem has not beenmade obsolete by the 100-percent baggage-screening mandate fol-lowing Sept. 11. It models any such scenario when a new screeningtechnology has been partially deployed and is used under a selectivescreening system and, because of limited capacity, not all selecteescan be screened by the new technology. These performance mea-sures focus on the types of risk that can be reduced by a singlescreening technology or a series of screening devices workingtogether in a system. There may be other types of risks on a flightthat are not considered by these performance measures.
Fully utilizing baggage-screening devices is one possible per-
formance measure for the partial baggage-screening problem.Intuitively, it is equally desirable to screen additional checked bagssuch that the new screening devices are being used up to theircapacity. Jacobson et al. (2003) introduce two alternate performancemeasures that capture risk across a set of flights and incorporatethem into discrete optimization models. The measures are consid-ered for a set of flights carrying both selectee and nonselectee bag-gage. A flight is said to be covered if all the selectee bags on it havebeen screened and cleared. One measure considers the total num-ber of covered flights. Optimizing over this measure minimizes thenumber of flights that may be subject to a particular risk. Anothermeasure considers the total number of passengers on covered
Image provided by Youssouf Cader | Agency: Dreamstime.comImage provided by Youssouf Cader | Agency: Dreamstime.com
w w w . i n f o r m s . o r g 15
the 100-percent baggage screening mandate depends on the degreeto which it can reduce the underlying threat level.
Barnett et al. (2001) perform a large-scale experiment at severalcommercial airports in the United States to estimate the costs anddisruptions associated with a positive passenger baggage matchingpolicy (PPBM). Under PPBM, unaccompanied checked baggage isremoved from aircraft on originating flights. PPBM can be appliedto all or a portion of checked baggage. The findings of Barnett et al.(2001) counter predictions by the airlines that using PPBM wouldbe expensive and result in widespread delays when used on allchecked baggage. They found that on average, one in seven flightsexperienced a delay, with each such delay averaging approximatelyseven minutes.
Identifying Performance MeasuresBASED ON THE NUMBER of aviation security changes that
have been implemented since Sept. 11, 2001, and the fierce politicaland public debate surrounding these changes, it has become appar-ent that it is a challenge to define what good aviation security is.Identifying performance measures of interest is not only importantfor long-term planning of security systems, but also for efficientlymanaging day-to-day operations and effectively managing securitysystems in transition. These performance measures can be incorpo-rated into various types of passenger screeningproblems, including applications in discrete opti-mization models, applied probability models,cost benefit analyses and risk assessments.
Since Sept. 11, 2001, much of the interest inpassenger screening systems has been limited toreducing the false clear rate – the conditionalprobability that there is no alarm response for athreat passenger or bag. An alternative is toreduce the false alarm rate – the conditionalprobability that there is an alarm response for a nonthreat passen-ger or bag. The false clear and false alarm rates cannot be simulta-neously minimized (Kobza and Jacobson 1997). For example, if allpassengers were allowed to board their flights with no screening, thefalse alarm rate would be 0 percent while the false clear rate wouldbe 100 percent.
Since the vast majority of passengers are not threats, most alarmsare in fact false alarms.A system with a low false clear rate may have alarge false alarm rate, which can be very expensive, since there mustbe secondary screening procedures in place to resolve such alarms. Inrare cases, the bomb squad must inspect a suspect bag or an airportterminal must be shut down for several hours, resulting in millions of
A weakness of any selectivescreening system is that it may bepossible to game it through extensive trial-and-error sampling.

flights. Optimizing over this measure minimizes the total numberof passengers on flights that may be subject to a particular risk. Notethat by optimizing over these measures, the utilization of the bag-gage screening devices is indirectly maximized, though dependingon which measure is chosen, the security of the system can be deter-mined to be optimal in two distinct ways, putting either fewer flightsat risk or fewer passengers at risk.
Analyzing Selective Passenger Screening SystemsAVIATION SECURITY professionals have expressed concern
over the actual effectiveness of selective screening systems likeSecure Flight in preventing attacks, given the variety of ways inwhich such systems can fail. Three research efforts are highlightedto illustrate how operations research tools such as risk analysis, algo-rithm design and applied probability can be used to analyze theflaws in selective screening systems.
A weakness of any selective screening system is that it may bepossible to game it through extensive trial-and-error sampling. Atpresent, passengers are aware of whether they have been classified asselectees or nonselectees each time they travel (most notably, by anindicator on their boarding pass, as well as by the additional screen-ing attention they receive at the security checkpoint.) Terrorists canexploit this information to determine how they are most likely to beclassified as nonselectees by flying on a number of flights and effec-tively sampling the characteristics that result in a nonselectee classi-fication. Therefore, terrorists do not need to understand how theprescreening system works; they merely need to be able to manipu-late the prescreening system to get the desired result (i.e., be classi-fied as nonselectees). Chakrabarti and Strauss (2002) present thisstrategy as the “Carnival Booth” algorithm, which demonstrateshow a system using prescreening may be less secure than systemsthat employ random searches.
Another weakness of any selective screening system is its depen-dence on passenger information to accurately assess passenger risk.The specific details underlying the currently used selective screen-ing system are classified. Moreover, it is not clear how such a systemwill correctly identify terrorists as selectees when compared to ran-dom screening. It is also a challenge to accurately assess whether aselective screening system has been effective, since terrorist attacksare rare events, and how terrorists behaved in the past may not bepredictive of how terrorists will behave in the future.
Barnett (2004) uses risk analysis, applied probability and datamining to analyze these issues regarding prescreening systems. Heconcludes that using a prescreening system such as Secure Flightmay improve aviation security under a particular set of circum-stances, namely, if it does not reduce the screening intensity for non-
selectee passengers, if itincreases the screeningintensity for selectees, andif the fraction of passen-gers identified as selecteesdoes not decrease. For allthese reasons, Barnett(2004) recommends thatSecure Flight be transi-tioned from a security cen-terpiece to one of manycomponents in future avi-ation security systems.
The TSA developed theRegistered Traveler Pro-gram to use in conjunc-tion with Secure Flight.The program is designedto avoid “wasting”securityresources on extremelylow-risk passengers. Toenroll in the RegisteredTraveler Program, a pas-senger must pass a volun-tary background checkand submit biometricinformation for identityverification when travel-ing. Once part of the pro-gram, these passengersundergo expedited screen-ing in designated securitylanes. Barnett (2003) out-lines several potentialproblems with such a pro-gram, and suggests that in the worst-case scenario, the RegisteredTraveler Program improves screening efficiency without improvingthe ability to positively identify terrorists. The Registered TravelerProgram pilot program is currently being tested at airports through-out the United States.
These weaknesses of selective screening systems raise the ques-tion of whether to spend security dollars on improving intelligenceor on building more effective screening technologies. McLay et al.(2005c) explore this issue by performing a cost-benefit analysisusing concepts from applied probability and optimization. In theiranalysis, more effective (though more expensive) screening tech-
nologies are considered for screening selecteebaggage, given a range of accuracy levels for aprescreening system in assessing passengerrisk. Several selective screening scenarios areidentified that are preferable to screening allpassenger baggage with explosive detectionsystems (EDSs), by reducing the number ofsuccessful attacks with moderate cost increas-es. They conclude that the accuracy of the pre-screening system is more critical for reducing
A N A L Y T I C S16 REGISTER NOW TO RECEIVE A FREE SUBSCRIPTION TO ANALYTICS:http://analytics.informs.org
R E F E R E N C E S1. A. Barnett, R. W. Shumsky, M. Hansen, A. Odoni,and G. Gosling, 2001, “Safe at Home? AnExperiment in Domestic Airline Security,”Operations Research, Vol. 49, pgs. 181-195.2. A. Barnett, 2001, “The Worst Day Ever,” OR/MSToday, Vol. 28, No. 6, pgs. 28-31.3. A. Barnett, 2003, “Trust No One at the Airport,”OR/MS Today, Vol. 30, No. 1, pg. 72.4. A. Barnett, 2004, “CAPPS II: The Foundation ofAviation Security?” Risk Analysis, Vol. 24, pgs.909-916.5. V. Butler and R. W. Poole Jr., 2002, “RethinkingChecked-Baggage Screening,’’ Reason PublicPolicy Institute, Policy Study No. 297, Los Angeles,Calif.6. S. Chakrabarti and A. Strauss, 2002, “CarnivalBooth: An Algorithm for Defeating the Computer-Aided Passenger Screening System,” First Monday7, www.firstmonday.org.7. S. H. Jacobson, J. E. Virta, J. M. Bowman, J. E.Kobza, and J. J., Nestor, 2003, “Modeling AviationBaggage Screening Security Systems: A CaseStudy,” IIE Transactions, Vol. 35, pgs. 259-269.8. S. H. Jacobson, T. Karnani, and J. E. Kobza,2005, “Assessing the Impact of Deterrence onAviation Checked Baggage Screening Strategies,”International Journal of Risk Assessment &Management, Vol. 5, No. 1, pgs. 1-15.9. J. E. Kobza and S. H. Jacobson, 1997,“Probability Models for Access Security SystemArchitectures,” Journal of the OperationalResearch Society, Vol. 48, pgs. 255-263.10. L. A. McLay, S. H. Jacobson, and J. E. Kobza,2005(a), “A Multilevel Passenger PrescreeningProblem for Aviation Security,” Technical Report,University of Illinois, Urbana, Ill.11. L. A. McLay, S. H. Jacobson, and J. E. Kobza,2005(b), “Integer Programming Models andAnalysis for a Multilevel Passenger ScreeningProblem,” Technical Report, University of Illinois,Urbana, Ill.12. L. A. McLay, S. H. Jacobson, and J. E. Kobza,2005(c), “When is Selective Screening Effectivefor Aviation Security?” Technical Report, Universityof Illinois, Urbana, Ill.13. J. E. Virta, S. H. Jacobson, and J. E. Kobza,2003, “Analyzing the cost of Screening Selecteeand Non-selectee Baggage,” Risk Analysis, Vol. 23,No. 5, pgs. 897-908.
S E C U R I T YA V I A T I O N
Should security dollars be spent onimproving intelligence or on building more effective screeningtechnologies?

the number of successful attacks than the effectiveness of the bag-gage screening devices used to screen selectee baggage when theproportion of the passengers classified as selectees is small.
Designing Effective Selective Passenger Screening Systems
PROHIBITIVE COSTS, long security lines and questionable effec-tiveness in preventing attacks have impeded passenger screening ini-tiatives. Significant infrastructure changes have been made at severalairports to accommodate new screening devices, and passengers havebeen subjected to long lines in airport lobbies awaiting screening.Pas-senger screening system designs must consider the potential impact ofcost, space, throughput and effectiveness. Three research efforts arehighlighted that use operations research methodologies to designselective screening systems.
One solution to this situation focuses on designing multilevel pas-senger prescreening systems. Multilevel systems are those in which anarbitrary number of classes for screening passengers are considered,rather than the two classes (i.e., selectees and nonselectees) currentlybeing used. A class is a set of procedures using security devices forscreening passengers. The nonselectee class, for example, may screenchecked baggage with EDSs, passengers with X-ray machines andcarry-on baggage with metal detectors.
One way to improve selective screening systems is to use expen-sive baggage screening technologies with low throughput to screenpassengers perceived as higher-risk. This has the potential to be amore cost-effective approach to screen passengers primarily byincreasing throughput. Butler and Poole (2002) design a layeredapproach to screening passengers and baggage instead of the exist-ing TSA policy of 100-percent checked baggage screening usingEDSs by considering the economic impact of using different screen-ing technologies. They consider three groups of passengers: lower-risk passengers who have volunteered for extensive backgroundchecks, lower-risk passengers about whom little is known and high-er-risk passengers. They recommend screening baggage with threelayers of baggage screening devices. By weaving passengers throughthree layers of security devices composed of EDSs, high-throughputbackscatter and dual-energy X-ray devices, and hand searches,throughput is increased while the overall false clear rate remains ata level comparable to that of the 100-percent baggage screeningmandate. Butler and Poole make similar recommendations for pas-senger screening. One implication of this screening system is thatthe resulting improved throughput indirectly decreases spacerequirements and waiting times in airport lobbies, which is of inter-est because many airport lobbies were not designed to accommo-date extensive screening systems and excessively long waiting lines.
Two multilevel passenger screening problems (that are formulat-ed as discrete optimization models) give insight into how screeningdevices should be purchased and deployed (McLay et al. 2005a,b).Ananalysis of a greedy heuristic for the first problem suggests that usingonly two classes is particularly effective, which supports the two-classparadigm of Secure Flight. For the first problem, each of the classes isdefined in terms of its fixed cost (the overhead costs), its marginalcost (the additional cost to screen a passenger) and its false clear rate,with a passenger prescreening system such as Secure Flight used todifferentiate passengers. The objective is to minimize the overall false
clear rate subject to passenger assignments and budget constraints.The second problem, a complementary problem to the first, consid-ers screening devices that have been purchased and installed. The sec-ond problem illustrates how devices shared by multiple classes areused. Each class is defined by the device types it uses, and each devicetype has an associated capacity (throughput) in a given unit of time.Optimal solutions to examples with more available classes are moresensitive with respect to changes in passenger volume and devicecapacity. This research suggests that incorporating prescreening sys-tems into discrete optimization models provides insight into efficientselective screening systems.
ConclusionsOPERATIONS RESEARCH practitioners have the unique
opportunity to make a difference in aviation security. New direc-tions in aviation security need not merely be makeshift politicalsolutions for mending complex problems; they can be the result ofmodeling, analysis and planning. By illustrating several ways inwhich operations research has made an impact in passenger pre-screening systems, it is shown to have a place in the design andanalysis of aviation security systems. However, there are some limi-tations. When doing operations research modeling (or in fact,mathematical modeling of any type), one must often make assump-tions that may limit the applicability of the results obtained. Thoughsuch assumptions are often based on reasonable and realistic factors,they may pose difficulties in facilitating the transfer of the opera-tions research analysis to decision-makers, since errors can lead tosecurity breakdowns that may place people at an unnecessary risk.Second, operations research models quite often look at an applica-tion’s average or mean performance. In aviation security systems,average performance does not always capture the most interestingand salient aspects of such operations, which are often concernedwith rare events and events “at the extremes.”
The issues discussed here represent but the tip of the iceberg.There are numerous problems in aviation security that can benefitfrom operations research methodologies, including improvingperimeter access security with respect to airport employees, design-ing models for cargo screening, analyzing passenger throughput andspace associated with security lines, and modeling secondary screen-ing of passengers and their baggage when screening devices give analarm response, to name just a few. By using operations researchmethodologies to gain insight into ways to improve aviation securitysystem operations and performance, our field can make a lastingimpression on our nation’s security and well-being. ❙ANALYTICS
Sheldon H. Jacobson ([email protected]) is a professor at theDepartment of Mechanical and Industrial Engineering and directorof the Simulation and Optimization Laboratory, University of Illinoisat Urbana-Champaign. Laura A. McLay ([email protected]) is aPh.D. candidate at the same department. John E. Kobza([email protected]) is a professor at the Department ofIndustrial Engineering, Texas Tech University.
w w w . i n f o r m s . o r g 17
A C K N O W L E D G M E N T SThe authors would like to thank Professor Arnold Barnett, George Eastman Professor
of Management Science at MIT’s Sloan School of Management, for his insightful
comments that resulted in a significantly improved manuscript, as well as his
numerous insights into applying operations research methodologies to improve
aviation security. The research on aviation security conducted by Professor Jacobson
and Professor Kobza has been supported in part by the National Science Foundation
(DMI-0114499, DMI-0114046). Professor Jacobson’s research has also been
supported in part by the Air Force Office of Scientific Research (FA9550-04-1-0110).

A N A L Y T I C S18 REGISTER NOW TO RECEIVE A FREE SUBSCRIPTION TO ANALYTICS:http://analytics.informs.org
In the face of a very competitive Western European market,French automaker Renault decided in 1999 to launch the “NewDelivery Project” aimed at offering its customers all the diversityof the product range while shortening delivery times. Lead timesbetween the customer order and the arrival in dealerships were tobe reduced from six weeks on average to three weeks in WesternEurope. The three weeks include the production and transporta-tion of the customer vehicle.
The assumption was that if a client can get exactly the rightmodel with the right color and all the options he or she wishesin a “reasonably short” delay (i.e. three weeks), Renault will gainbenefits simultaneously on three levels:
• Reduction of car inventory level. (Thanks to short deliverytimes, customers can wait for their cars, so that dealershipscan lower their stock levels.)
• Reduction of the price discounts designed to sell cars thatdo not match exactly clients’ desires.
• Since all the options are available to customers with shortdelivery times, expectation of selling a more profitableproduct mix.
In other words, Renault decided to switch its supply chainfrom a built-to-inventory to a built-to-order perspective, whileoffering a more diverse product range with shorter deliverytimes!
Such an ambitious strategy required a tremendous speed-upof the entire planning process, ranging from the national salescompanies (NSC) to the assembly plants via the headquarters.Let us examine this planning process. At the start of each month,NSCs all over Europe define monthly sales forecasts for everymodel for years Y and Y+1. Then the headquartered salesdepartment reviews the figures with industrial planners so as toensure that resulting productions comply with plants’ capacities,those of Renault and of its suppliers. The discussion betweensales and industrial departments may lead to the upgrading ofindustrial capabilities or to the lowering of sales targets, due toindustrial bottlenecks. This planning process took nearly amonth each month! The New Delivery Project required theplanning process to be shortened to three weeks.
Alongside the planning process, customer orders taken indealerships are sent daily to headquarters, which in turn dis-patches them to vehicle plants once a week. At the end of thesupply chain, assembly plants perform daily the planning andscheduling of their productions. The New Delivery Projectrequired the customer orders to go down a continuous pipelinefrom dealerships straight to assembly plants, thus bypassing theweekly dispatch by headquarters.
Unfortunately, except for the last step (the planning andscheduling in assembly plants), the whole planning processwas supported by legacy information systems (IS) on main-
INTERNATIONAL O.R.
Analytics help French
automaker overhaul
its supply chain
from a built-to-inventory
to a built-to-order
perspective.
B Y A L A I N N G U Y E N
Renault Speeds Up

w w w . i n f o r m s . o r g 19
frame environments. These IS represented a huge bottleneck.They could no longer deliver because of the wider variety ofproduct range (more models, more options, more combina-tions of options, etc.). All the computations were performed byhours-long night batches. Simulations were naturally impossi-ble, nor any kind of interactivity between end-users and IS.
In addition, severe misunderstandings between salespeopleand industrial planners were caused by divergent productdescription languages and lack of thorough answers to basicquestions: What are the objectives of the respective planningprocesses of sales and industrial departments? What are thedecision variables of each other? What kind of common con-straints should be taken into account?
O.R. Rides to the RescueSINCE WE WERE SUCCESSFUL in developing the tools for
the planning and scheduling in vehicle plants, our O.R. team wascharged with handling the overhaul of Renault’s supply chainmanagement IS.
Renault’s O.R. team staff varies from three (today) to eightmembers (at peak time in the project). The team works mainlyon logistics, which is sourced to numerous optimization issues.Timid contacts were made with sales and marketing depart-ments, but optimization issues are much less visible in theseareas. The O.R. team focuses on the development of optimiza-
tion components, while the logistics information technologydepartment is in charge of the data management and GUImodules.
A thorough analysis led us towards in-house developmentsversus generic ERP software, because of the great specifics ofRenault product range description (which fit poorly into gener-ic tools frameworks) and the experience of the O.R. team,acquired from the developing of planning optimization tools forvehicle plants. However decision-makers, especially from thesales department, were more interested in “attractive” ERP soft-ware, the likes of I2, SAP, Manugistics and so on. Compared tothe aggressive marketing of software suppliers, the dull image ofthe IT department did not help the O.R. effort.
Reluctantly, we started developments of the planning toolswith a well-known ERP software. The result could not be worsemid-course. We encountered cumulated problems from oursupplier: badly managed transition of the ERP software from aclient-server to a Web-based architecture, mismatch between thedistinctive features of automotive product range and the frame-work provided by the ERP software, and misunderstandingsbetween the in-house team and supplier’s consultants. After acommon agreement (the supplier did admit its failures), wereversed to in-house developments, trashing all the work donewith the ERP software (a few men-years).
A MILP-based (mixed integer linear programming) opti-mization tool (3P) was rolled out in all the NSCs to help themfine-tune their sales forecasts so as to comply with industrialcapacities and product range constraints. 3P implements MILP-based, multi-objective goal programming techniques. Takingsales forecasts as inputs, 3P minimizes mix changes needed tosatisfy product range and capacity constraints. Sales forecasts aredefined as goals, and the objective function is to minimize thesum of slack variables (representing mix changes). The trick wasto perform goal programming while remaining in a linearframework, thus taking full advantage of powerful linear solverslike CPLEX or XPRESS.
This optimization is multi-objective, since it focuses first onmodel mix, then on critical options mix (engine, gearbox), thenon secondary options mix. There is an optimization computa-tion at each step, which takes as constraints the objective func-tions values of all the preceding steps. Such lexicographic imple-mentation of multi-objective optimization may seem bruteforce; however this approach is well understood and comfort-able for end-users. Indeed it is much more difficult for them todefine compensation levels between objectives, that is to answerquestions like “How much can one lower model mix quality inorder to improve critical options mix?” and so on.
“Feasible” sales forecasts are then sent to headquarters,where industrial planners handle a MILP-based optimizationtool (OPTIM), which also performs multi-objective goal-pro-gramming to define the optimal weekly output of car factoriesso as to satisfy the sales targets. In this step, very detailed indus-trial constraints are taken into account, as well as smoothingobjectives in the dividing of monthly plant productions intoweekly figures.
Delivery

But in order to be used in OPTIM, sales forecasts were firsttranslated into detailed volumes for every vehicle option. Indeed,sales figures were defined by sales managers only in terms of mod-els and a few highly visible options, which is clearly incompleteinformation for industrial systems. Again an LP-based optimiza-tion IS (SAPHIR) is used to generate detailed volumes for every caroption as coherent as possible with historical statistical trends,while satisfying sales targets and product range constraints.
Industrial planners also plan the weekly output of powertrain plants so as to supply engines and gearboxes to vehicleplants. A MILP-based optimization tool (OPM) solves amulti-item, multi-period lot-sizing problem with finite capac-ities, demand and inventory shortages in order to generate aproduction plan for power train facilities. Again, the opti-mization is multi-objective since OPM must: (1) meet thedemands of vehicle plants, then (2) maximize the satisfactionof security inventory levels of power train factories, and final-ly (3) minimize the overall costs (production, inventory andtransportation costs).
On the vehicle plant floor, operators handle both the buildingof a production plan on a day-by-day basis with a MILP-basedIS (CARNETS), and the car sequencing of each production daywith a simulated annealing algorithm. The car sequence is builtso as to smooth the workload on the assembly line and to mini-mize production costs in the paint shop due to colorchangeovers in the car sequence, which require the washing ofpainting tubes.
The O.R. tools described above are all live since the years2000-2002 at Renault. They were implemented with an in-houseMILP-toolkit that is interfaced with well-known linear solvers(CPLEX, XPRESS, LPSOLVE, COIN) and which integrates goal-programming techniques. This toolkit is the result of years ofexperience in goal programming, solvers tuning, memory andresponse times optimizations. It now represents a major asset todevelop quickly O.R. proof of concept prototypes.
The coherence of all these O.R. tools results from the simplefact that they were hard-coded by the same team. It also demon-strates a complete mastering of Renault’s O.R. tools by the in-house O.R. team, whose members are now recognized as O.R.experts within Renault.
With O.R. modeling, we brought a completely new approachto our end-users. Instead of focusing on how they do the planning(all their tricks, heuristics and so on), we define with them whatthe planning problem is (and not how they solve it): What are theconstraints? What are the decision variables? Which objectives areto be optimized? Then we focus on what should be the character-istics of a “good” solution, so as to be sure to take into account allthe business rules.
Such questions may seem very basic from an O.R. viewpoint,but they brought a great clarification to business people. Animportant lesson was that the modeling of the objective func-tion must be validated by business people, even though O.R.technicalities are not easy to grasp for them. But since the solu-tions quality depends completely on this critical objective func-tion, its modeling is not a mere technical issue.
We also impose the same language for sales and industrialdepartments, by defining a common body of decision variables,industrial and sales constraints, and objective functions. Eachdepartment selects in this body the items relevant to its process.For instance, the sales department focuses on monthly modelmix and options mix satisfaction on a country-by-country basis,while industrial planners work on weekly model production vol-umes on a plant-by-plant basis.
All the O.R. tools were initiated with proof of concept pro-totypes that enable us to get validations from end-users beforegoing into full-scale software developments. These prototypeswere critical in getting user validation, since more often thannot the business process is overhauled with the arrival of opti-mization tools, and it is quite difficult for end-users to validateon paper only the couple new process-new tool.
Thanks to the highly visible level of the New DeliveryProject (it was called the CEO’s project!), we could make the top management take the major and clarifying strategicdecisions, so that O.R. tools can follow crystal clear and undis-puted directions in optimization objectives. For instance, itwas stated that in factory production planning, the satisfac-tion of customer delivery deadline outweighs costoptimizations. Period.
The ROADEF ChallengeAFTER THE COMPLETE ROLLOUT of the supply chain
management O.R. tools in the years 1999-2003, came the stressof the top management on further production costs optimiza-tion. We cited above an in-house car-sequencing tool based on asimulated annealing algorithm. It was rolled out in 1993. In2003, plant operators were complaining about the poor qualityof car sequences (too many color changeovers and mitigatedsatisfaction of assembly line constraints). They asked for anoverhaul of this algorithm.
In order to benchmark the best O.R. algorithms, we submit-ted the Renault’s Car Sequencing Problem to a competitionamong O.R. teams, the ROADEF Challenge, hosted by theFrench O.R. society (ROADEF). The competition attracted arecord 55 research teams from Europe, Canada and Brazil.
The results were so astounding that we acquired the winners’code and put it into production in our plants. Although we didnot expect such an outcome, we did specify the real-life prob-lem with real-life data and impose execution time constraints(runs were limited to 10 minutes on a Pentium-IV PC). Inreturn, we were able to plug-in quickly the winner’s local searchalgorithm in our car sequencing tool with very few adaptations.This algorithm is clearly a best in class. One telling statistic: Itperforms more than 140 million evaluations of the objectivefunction in the 10 minutes runtime! Decision-makers werethrilled by the ROADEF challenge. If only they could bench-mark all Renault’s IT software among world class competitors,and acquire the best for their business! ❙ANALYTICS
Alain Nguyen ([email protected]) is the head of the O.R.team at Renault’s IT Department and thus the resident O.R. expertwithin Renault.
A N A L Y T I C S20 REGISTER NOW TO RECEIVE A FREE SUBSCRIPTION TO ANALYTICS:http://analytics.informs.org
INTERNATIONAL O.R.


A N A L Y T I C S22 REGISTER NOW TO RECEIVE A FREE SUBSCRIPTION TO ANALYTICS:http://analytics.informs.org
In a U.S. presidential election, that should NOT be a question!
By Alexander S. Belenky and Richard C. Larson
To Queue or Not
to Queue? ©
Pho
togr
aphe
r: A
li M
azra
ie s
hadi
| A
genc
y: D
ream
stim
e.co
m

w w w . i n f o r m s . o r g 23
ill the 2008 U.S. presidential
election be decided by election queues? We don’t know, but operations research could be used to make every vote count and
help secure the integrity of the voting process.
Queues in U.S. presidential elections first drew national attention in the 2000 elec-
tion, when voters queued for more than two hours to cast their votes in some coun-
ties in Florida [1], and the election hours were extended due to the queues in some
battleground states [2]. In the 2004 election, Ohio voters queued for as many as 10
hours in some precincts in Columbus, Cincinnati and Toledo [3], and long queues
were reported in other states as well [4, 5, 6].
WWBesides the inconvenience of waiting, why is this important? Think
of two words from queueing theory: balking and reneging. Potentialvoters who see a long queue may balk from entering it. Others mayenter the queue but leave it later, renege, due to frustration at the slowpace of the line. Unwillingness to wait may be due to time personalconstraints, such as job or family obligations,or maybe just impatience.If those who balk or renege are differentially more from one politicalparty than another, then the party most affected will complain, sayingthat some of “its voters”did not vote due to long lines.
Did election queues decide the 2000 and 2004 U.S. presidential elections?
THEY WELL MIGHT HAVE. In each of the two elections, onestate decided the fate of the election: Florida in 2000 and Ohio in2004. In 2000, more than 5,801,000 votes were cast in Florida, andthe official vote tally favored the winner by only 537 votes. Withwidely reported long queues in the precincts, nobody knows howmany of those who came to vote balked or reneged. If there were at
least 538 such voters, less than 0.01 percent of all the counted votes,one cannot be sure which candidate could have won Florida – in theabsence of balking and reneging. In reviewing the 2000 election, onenews analyst summed it up this way: “There were a variety of rea-sons for these votes not being cast or counted.” After recountingtechnological problems, he states, “Finally at some voting stationsthe lines of voters were simply too long and many voters abandonedtheir attempt to vote because they were not willing to queue forhours” [7]. Abandonment = reneging.
In the 2004 election, with the Ohio winner’s margin less than119,000 votes, 4-plus hour queue delays [3, 8] could have affected theoutcome. Consider the math: 12 of the 88 Ohio counties account for6,560 of the 11,360 Ohio precincts, and John Kerry won a majority ofthe votes in these 12 counties [9]. With 72 percent voter turnout ofregistered voters, 119,000 voters constitute less than 1.5 percent of theregistered voters. Anecdotal evidence is compelling: In Columbus,which has 472 precincts, between 5,000 and 15,000 voters werereported to be frustrated and thus balked or reneged [3]. If only 19
© P
hoto
grap
her:
Bob
Den
elze
n |
Age
ncy:
Dre
amst
ime.
com

A N A L Y T I C S24 REGISTER NOW TO RECEIVE A FREE SUBSCRIPTION TO ANALYTICS:http://analytics.informs.org
potential voters who came to votein each precinct in these 12 coun-ties balked or reneged, one cannotbe sure that the 2004 election out-come in Ohio would have beenthe same.
Result: the queues might havedecided or at least substantiallyaffected the 2000 and 2004 elec-tion outcomes.
The political controversy creat-ed by misallocation of votingmachines is illustrated in thisquote by Sen. Barbara Boxer, aDemocratic from California: “So,it seems to me that under theConstitution of the United Statesof America, which guarantees theright to vote, we must ask ourselves several questions today. Why didvoters in Ohio wait hours and hours and hours in the rain to vote?Why were voters at one precinct, for example, made to wait in lineuntil nearly 4 a.m., four in the morning, to vote because there wereonly two machines? At Kenyon College, there were 1,300 voters. Theyneeded 13 machines; they had two. Why did poor and predominant-ly African-American communities have disproportionately longwaits? Why in Franklin County did election officials use only 2,798machines,when they said they needed 5,000? Why did they hold back68 machines in warehouses that were perfectly good? Why were 42 ofthose machines in predominantly African-American districts?”[10].
We take no sides in this debate.But we point out that the substanceof the debate is balking, reneging, long waits and the deployment ofvoting machines – just the types of issues made for O.R. analyses.
Can election queues decide the 2008 U.S.presidential election?
YES, PERHAPS – if nothing is done about managing thevoter queues, and if the 2008 election is as close as were thelast two elections.
In the course of the 2000 election, the slogan “Every vote counts,and every vote must be counted” became popular, and soon after-wards, the Carter-Ford Commission on Federal Election Reform wasformed to improve the system of electing a U.S. president. However,due to “hanging chads”and related iconic images of the Florida elec-tion, most of attention has been paid to the second part of this slo-gan, i.e., to voting machines and technologies to audit votes alreadycast. Only after the 2004 election in Ohio were two bills initiatedjointly by two groups of congressmen and U.S. senators [11]. Thesebills for the first time address the problem of establishing certain vot-ing standards, including the maximum time in queue to cast a vote.Though both bills are pending, their chances to reach the floor of theU.S. Congress seem slim, and the attention of the media to the prob-lem of queues in U.S. presidential elections seems to have faded away.
In the absence of queueing standards and related decision-aidingtools, the allocation of voting machines and personnel to precincts willbe at the discretion of local election officials. Queues in the 2008 elec-
tion may then appear either as a result of poor judgment or intention-al manipulation of voting resources.And,with the deployment by bothpolitical parties of information technologies for developing “digitalstates”[12], it becomes even easier to design situations in which votersfavoring a particular political party are discouraged to vote by longqueues caused by insufficient numbers of voting machines.
Top nine reasons for queueing in U.S. presidential elections.1. Underestimated voter turnout. A bigger-than-expected
voter turnout may catch off guard election officials who aresupposed to respond quickly to such an event if/when itoccurs.
2. The election budget. An insufficient election budget mayimply that rho >1.0 during all or part of Election Day. Hererho = p is the queue utilization factor. As we all know, p >1implies queues that grow.
3. Types of voting machines. Different types of votingmachines have different service times and thus affectqueueing differently. As far as we know, no research showinghow particular types of voting machines may affect queueson Election Day has so far been conducted.
4. Activities aimed at mobilizing voters. The 2004 electiondemonstrated that political parties can increase theparticipation of low-propensity voters [13]. Success atbringing new voters or reluctant voters to the pollingprecincts can increase the queueing lambda, or (�), thearrival rates to the queues, thereby making the queueslonger.
5. The demography of the electorate. Changes of the numberand types of voters in a county affect service times and thuselection-day queues, even if the voter turnout is unchangedcompared to the previous election year.
6. Early voting options. Many states now allow voting infederal elections several days before Election Day in order
V O T I N G Q U E U E S
© P
hoto
grap
her:
Chr
istia
n B
ernf
eld
| A
genc
y: D
ream
stim
e.co
m
© P
hoto
grap
her:
Sco
tt R
oths
tein
|A
genc
y: D
ream
stim
e.co
m

w w w . i n f o r m s . o r g 25
not to lose voters who are unwilling to stand in queues onElection Day. This decreases Election-Day (�).
7. Training voters to operate voting machines. Some types ofvoters – for instance, elderly people, undereducated voters,new immigrants and first-time young voters – generallyrequire more assistance in the precincts than, say, educated35-year-olds. Out-of-queue training of these voters mayreduce service times and thus queues on Election Day.
8. Weather. Voter turnout is dependent on weather. Goodweather usually implies higher turnout; bad weather thereverse. This makes even more difficult the prior estimationof queue parameters.
9. Unscientific deployments of voting machines and pollworkers. The deliberate or accidental misallocation of votingmachines among the precincts seems to remain the majorcause for long queues in national elections.
A strategy to deal with queues in U.S. presidential elections.
TO START TO USE O.R. in a serious way, we need queue waitstandards to be set and agreed upon by stakeholders in the votingprocess. A standard may be stated in the form, “No more than 5 per-cent of the voters should wait more than 30 minutes in the voterqueue.” Of course, the 5 percent may be 1 percent or 10 percent orany other percentage, just as the 30 minutes could be 10 or even 60minutes. Whatever the standard, it must be stated in a way thatacknowledges that less than 100 percent of the voters will enjoy thestandard – due to unavoidable random fluctuations in the queuearrival and service processes.
Standards can be agreed on even in the public sector. The U.S.Postal Service (USPS) has a five-minute standard to serve retail cus-tomers. And, to motivate the approach we are proposing, their goalis met in large part by “…using the retail analysis staffing and sched-uling model to determine how many employees should be on dutyduring all periods to maintain service levels within these guidelines”[14]. That’s right, the USPS uses queueing models to staff their retailpostal lobbies. If it’s good enough for the U.S. Postal Service, itshould be good enough for ensuring equity of access to America’smost precious right: exercising the right to vote.
Suppose the standard is established by the state law and accept-ed by most if not all stakeholders. Solving the problem of allocatingvoting machines among county precincts now becomes an O.R.problem in queue design and management. First there is a feasibili-ty test: Are there enough voting machines in the county to meet thestandard? If not, how many more do we need? The way we do this,once we have a validated queue model, is to find the minimumnumber of voting machines needed at each precinct to meet thestandard, and then sum over all precincts. Comparing this to thetotal number currently available determines the overage or under-age that we face.
The details of a valid and useful queueing model will of coursedepend on the realities on the ground. Is real-time informationavailable to county managers who can communicate with leader-ship in each of the precincts? If information is available, can vot-ers who appear at a congested precinct be transported to a nearby
uncongested precinct? Or, can voting machines at an uncongest-ed precinct be moved during the voting day to more congestedprecincts, thereby balancing the load and reducing queue delays atthe congested precincts? Would special mobile voting units, whichcould service voters in their neighborhoods early in the morningand be moved to congested precincts during peak hours, be acomparable or even a better solution? Can voters be informed byradio and television about hours of anticipated congestion andhours of small or zero-length queues, thereby redirecting thosewho have vote time flexibility to appear during off-hours? In mea-surement tests of potential voters with long waits, what are thestate-dependent probabilities of balking? What are the dynamicsof reneging? Does steady-state analysis make sense during the vot-ing day, or must the entire model be transient in nature?
All of these questions and more must be settled by carefulresearch. If we are to bring O.R. to bear on America’s voting system,we must do it with the utmost respect and care. Erlang’s famousequations of 1915 – created for analysis of centralized telephoneswitching systems – will not be up to the job. More than likely, newqueueing models will have to be created.
Politicians and their constituents are crying out for proven, test-ed methods for deploying fairly and equitably voting machines andrelated resources to voting places. This is illustrated by a December2004 letter from Rep. John Conyers Jr., Rep. Melvin Watt, Rep. Jer-rold Nadler and Rep. Tammy Baldwin to the Honorable J. KennethBlackwell, Ohio secretary of state:1. How much funding did Ohio receive from the federal
government for voting machines?2. What criteria were used to distribute those new machines?3. Were counties given estimates or assurances as to how many
new voting machines they would receive? How does thisnumber compare to how many machines were actuallyreceived?
4. What procedures were in place to ensure that the votingmachines were properly allocated throughout Franklin andother counties? What changes would you recommend bemade to insure there is a more equitable allocation ofmachines in the future? [15].
On engineering systems for servicing U.S. presidential elections.
U.S. PRESIDENTIAL ELECTIONS have traditionally beenconsidered a subject of politics and political science. Whileestablishing voting standards may involve a political process,scientifically handling the voter queues – once the standard isset – should have nothing to do with politics. Developingdecision-making systems for servicing American votersaccording to their constitutional rights is an important step ininsuring the integrity and fairness of the process. Trainingelection officials in the use of these systems and informing thevoters about the capabilities of these systems should accom-pany the implementation of such decision-support systems.
We hope to develop a prototype of the first system of such a kindwith support of interested organizations that care about the integri-ty of the election process.

SummaryFROM AN O.R. POINT OF VIEW, a voting precinct is a
multi-server queueing system. Problems of allocating availablevoting machines, and perhaps finding the required number ofadditional voting machines, can be formulated as mathematicalprogramming problems. All of these problems are non-routinedue to complications arising in practice: uncertain voter turnout,the ability of the election authorities to deal with long queues,types of machines available, experience of voters, use of early vot-ing options, etc. Whatever the difficulties, we are unaware of anymethod superior to O.R. for sorting out all the issues and creat-ing a valid and unbiased way to deploy scarce voting resources onElection Day. May O.R. save the day! ❙ANALYTICS
Alexander S. Belenky is principle scientist at the MIT Center forEngineering Systems Fundamentals. He is the author of books andscientific articles in the field of optimization and game theory andtheir applications. His recent books include “Extreme Outcomes ofU.S. Presidential Elections” (2003) and “Winning the U.S.Presidency: Rules of the Game and Playing by the Rules” (2004).He was an invited guest on radio and TV shows throughout thecountry in the course of the 2004 election campaign. Hisforthcoming book is “How America Chooses Its Presidents.”Belenky holds a Ph.D. in systems analysis and mathematics and aD.Sc. in applications of mathematical methods.
Richard C. Larson is Mitsui Professor of Engineering Systems andof Civil and Environmental Engineering at MIT, where he serves asdirector of the MIT Center for Engineering Systems Fundamentals.A past president of ORSA (1994-95) and INFORMS (2005), he is amember of National Academy of Engineering, an INFORMSFounding Fellow and recipient of the INFORMS President’s Awardand Kimball Medal. He has published various papers on queueing,including “QIE (Queue Inference Engine),” the “HypercubeQueueing Model” and papers on the psychology of queueing.
A N A L Y T I C S26 REGISTER NOW TO RECEIVE A FREE SUBSCRIPTION TO ANALYTICS:http://analytics.informs.org
R E F E R E N C E S1. “News Hour with Jim Lehrer,” transcript, Nov. 10, 2000.
2. C. Orman, “State Sen. Scott Addresses Pachyderm Club,” Sedalia
Democrat, March 11, 2006.
3. M. Powell, P. Slevin, “Several Factors Contributed to ‘Lost’ Voters in Ohio,”
The Washington Post, Dec. 15, 2004.
4. H. McGee, “My Opponent Looks Like Saddam’s Son,” Irish Examiner, Oct.
27, 2004.
5. P. Donovan, “It was About Poor People’s Right to Vote,” The Irish World,
Nov. 12, 2004.
6. J. Jones (reviewed by), “U.S. Election 2004,” BBC 1, Nov. 2, 2004.
7. R. Bloor, “Electronic Voting and the U.S. Election,” Oct. 27, 2004, www.
it-director.com/article.php?articleid=12348.
8. Rev. Jesse Jackson, “Something Fishy in Ohio,” Chicago Sunday Times,
Nov. 30, 2004.
9. “State results. President by county,” USAToday.com, Nov.4, 2004.
10. “Contesting Ohio Electoral Votes,” transcript of press conference: Sen.
Barbara Boxer and Rep. Stephanie Tubbs Jones, Federal News Service, Jan.
6, 2005.
11. Testimony of Norman J. Ornstein, Commission on Federal Election
Reform, June 30, 2005, James Baker III Institute for Public Policy, Rice
University, Houston, Texas.
12. T. Edswall, “Democrats’ Data Mining Stirs an Intra-party Battle,” The
Washington Post, March 8, 2006.
13. D. King, “Youth Came Through with Big Voter Turnout,” The Boston Globe,
Nov. 4, 2004.
14. Postal Operations Manual, Sec. 125.21: www.lunewsviews.com/pdfs/
Service%20Levels%20-%20POM%20125.2.pdf; and
http://globalresearch.ca/articles/BOX501A.html.
15. http://globalresearch.ca/articles/HRE412A.html (letter dated
Dec. 2, 2004).
V O T I N G Q U E U E S
ANALYTICS... i n the News
BLUMSTEIN GIVES NEW INSIGHT INTO CRACK WARS“When crack first became popular, there was an increase in murders and other crimes associated with the drug. But the bloodshed
was not necessarily the result of something inherent in crack.
“Instead, most of that violence was typical for what happens when any illegal drug is introduced and drug dealers with guns compete
for new markets, said Dr. Alfred Blumstein, a professor of urban systems and operations research at Carnegie-Mellon University.”
Source: Fox News
BEST SOLUTION TO HOLIDAY LINES IS SINGLE QUEUE“North Americans spend a lot of time waiting to be served. In malls. In airports. At amusement parks. In his book ‘On An Average Day,’
writer Tom Heymann claims Americans spend more than 100 million hours a day waiting in line.
“We spend more time queued up, paunch to haunch, in December than in any other month. No surprise there. Last year, according to
Statistics Canada, Canadians spent an average of $874 each in December compared to about $630 in other months.
“With so much money at stake – Canadian stores reaped nearly $30 billion last December alone – you’d figure retailers would have
reached a consensus on how best to keep lineups moving briskly. Nope.
“There are two basic queue management models. Banks and airports use what’s called the single-line, multiple-server model. First
come, first served. Most stores, however, use the traditional multiple-line, multiple-server system. This is how supermarkets work. You pick
a line and hope it’s a fast one.
“Mahmut Parlar, a management science professor at McMaster University, favours the one-line system. ‘Both math and practical expe-
rience tells us that if you have a single queue with multiple servers, you get more efficient service,’ he says.”
Source: Ottawa Citizen


PATIENTFLOW
The new queueing theory for healthcare.
From birth to death, we are all part of the
healthcare system. We rely on both public and private
organizations to provide preventive care (such as
inoculations) and to treat our illnesses, diseases and
injuries. Healthcare is perhaps the strongest determinant of
both our quality of life and our longevity.
Worldwide, and in the United Statesin particular, healthcare consumes an increasing
percentage of our economic product. This rising cost can be
attributed in part to aging populations and the expense of
new, advanced treatments. Just as importantly, it can be
attributed to inefficiencies in healthcare delivery. Simply put,
the science of healthcare has progressed much more rapidly
than our ability to manage healthcare as a truly integrated
system.
By Randolph W. Hall
A N A L Y T I C S28 REGISTER NOW TO RECEIVE A FREE SUBSCRIPTION TO ANALYTICS:http://analytics.informs.org

Patient FlowPATIENT FLOW represents the ability of the
healthcare system to serve patients quickly and effi-ciently as they move through stages of care. When thesystem works well, patients flow like a river, meaningthat each stage is completed with minimal delay.When the system is broken, patients accumulate likea reservoir, as in the chronic delays experienced inmany big city emergency departments. Put anotherway, good patient flow means that patient queueing isminimized; poor patient flow means that patientssuffer considerable queueing delays.
Healthcare systems resemble any complex queueingnetwork in that delays can be reduced through: (1) syn-chronization of work among service stages (e.g., coordi-nation of tests, treatments, discharge processes), (2)scheduling of resources (e.g., doctors and nurses) tomatch patterns of arrival, and (3) constant system moni-toring (e.g., tracking number of patients waiting by loca-tion, diagnostic grouping and acuity) linked to immedi-ate actions. But healthcare has unique features that makequeueing problems particularly difficult to solve:
• Waiting creates additional work for clinicians.Patients must be monitored and served while waiting,and their conditions even deteriorate, necessitatingadditional work once they are seen. Thus, as queuesbecome large, the workload increases and the capacityto serve patients deteriorates.
• It can be difficult to distinguish productive wait-ing (e.g., recovery) from unproductive waiting (e.g.,waiting for tests). In a traditional queueing system themost desirable outcome is a zero time in system withinstantaneous service; in a hospital, it is undesirable topush length of stay all the way to zero, as patients needto be monitored and cared for during recovery periods.The result can be conflicting objectives in managinghospital beds as a limited resource.
• Healthcare organizations operate within aunique regulatory and business environment that fallspartly in the private sector and partly in the public sec-tor. Hospitals may find it impossible to manage queuesthrough pricing, and reimbursement schemes may bemisaligned with costs. For example, under the Emer-gency Medical Treatment and Active Labor Act(EMTALA), hospitals are mandated to see all patientspresenting to emergency rooms independent of theirability to pay. Thus, the economic environment pre-cludes queueing solutions often found in the privatesector, such as peak-period pricing. At the same time,physicians frequently act like independent entrepre-neurs, making it difficult for healthcare organizationsto fully integrate their systems under sound manager-ial practices.
Characterizing Patient FlowMY FIRST EXPOSURE to the field of patient flow
came through the Institute for Healthcare Improve-
w w w . i n f o r m s . o r g 29

ment (IHI), an outstanding organization devoted to improving thequality and value of healthcare. IHI’s approach centers on the opensharing of best practices within “collaboratives,” groupings of hos-pitals and clinics, clinicians and managers, organized around com-mon objectives, such as reliability, safety or patient flow.
Important to the operations research community, IHI hasemphasized evidence-based decision-making, meaning that per-formance measures and patient outcomes should be tracked andintegrated into a system of continual improvement. Though notdirectly linked to industrial engineering, management science oroperations research, IHI has adopted these field’s methods,focused on making radical improvements in health, not throughcreating new technology or treatments, but through using what wehave now to maximum benefit.
At the University of Southern California, my colleaguesDavid Belson, Maged Dessouky and I have used this philoso-phy as the launching point for a comprehensive evaluation ofthe Los Angeles County/University of Southern California(LAC/USC) General Hospital, one of the largest hospitals inthe country. Like many urban public hospitals, healthcare atLAC/USC is dominated by the flow of patients through itsemergency department. Patients by and large come toLAC/USC for one of two reasons: They believe that they haveno other option due to lack of health insurance or they havesuffered trauma or another emergency condition somewherein the hospital’s vicinity and were taken there by ambulanceor helicopter.
As at all hospitals, care is provided through many special-ized departments, such as radiology, surgery and various typesof patient wards, as well as by ancillary departments, such asadmissions, medical records, laboratory, pharmacy, house-keeping and transportation. A patient arriving through theemergency department encounters repeated waits as he or sheprogresses from stage to stage, waiting for rooms, equipment,physicians, nurses, technicians, beds, medications, records, gur-neys, orderlies and continuing care facilities once the patient isready for discharge. As in other hospitals, when the systembecomes overloaded, the patient may wait hours or even daysfrom being seen in the emergency department until placementin a ward. A patient may have to wait days or even weeks for asurgery. These conditions are in some respect extreme, but cer-tainly not unusual throughout the United States.
Our work has revealed that healthcare professionals are unusu-ally committed to their jobs, even when working under extremelychallenging conditions. They show a passion for their work and acamaraderie that is unlike what we have seen in other economic sec-tors. Yet clinicians, in particular, are frustrated because they cannotcontrol activities that occur outside their own departments.We havealso observed three major causes of queues in hospitals:• Idle capacity due to a failure to synchronize complementary
resources (e.g., ensuring that needed technicians, nurses,physicians, supplies, patients, etc. are present at the sametime to provide a needed service).
• Inadequate communication to ensure downstreamdepartments are prepared to receive patients from upstream
Managing length of stay (LOS) is one of the most vexing challenges for
any hospital. Though patients do need minimum stays for recovery and
monitoring, LOS is sometimes too long because patients are forced to
wait for surgeries. As a result, patients suffer and hospitals incur “denied
days” – an insurer’s rejection of reimbursement because the stay is not
medically necessary.
A research team at the University of Southern California, consisting
of the authors and graduate students Pavankumar Murali and Bo
Zhang, is addressing the LOS problem at the Los Angeles County Gen-
eral Hospital by targeting surgical scheduling and operations through
process modeling, process improvement, optimization and simulation.
We focus here on the last two steps: optimization and simulation.
Operating rooms are a scarce resource that must be properly allocat-
ed among a set of specialties. Each surgical specialty (cardiac, ortho,
neuro, etc.) wants its share of the available time. A common hospital
surgery scheduling method is “block scheduling” where operating rooms
are assigned weekly among each specialty and then the specialty
selects among its patients to fill up its allotted block time. The planned
weekly block times are a result of compromises among the competing
demands.
A reduction of patient waiting times could be accomplished by accu-
rately balancing the room allocation blocks with amount of demand for
surgeries from each specialty. In the past, allocation decisions were the
result of many factors. For example, since this is a teaching hospital,
each specialty requested sufficient time to provide learning experiences
for its medical students.
Surgery demand could be forecast based on the past frequency of
surgeries by specialty. The average length of surgeries follows a consis-
tent distribution. The surgeries within each specialty include inpatients
who occupy a hospital bed until served, outpatients who are scheduled
in advance and “red blanket” emergency patients who must be served
immediately by preempting the existing schedule. All three of these sub-
categories follow a consistent pattern that we could use for allocating
blocks.
Based on the demand pattern, we formulated a finite-horizon integer
programming (IP) model that determines a weekly operating room
allocation template that maximizes patient service. A number of
patient type priorities (e.g., emergency over inpatient) and clinical con-
straints (e.g., minimum number of hours allocated to each specialty)
are included in the formulation. The solution from the optimization
model is entered into a computer simulation that captures the ran-
domness of the processes (e.g., surgery time, demand, arrival time)
and no-show rate of the outpatients) and non-linearties. Our models
were created in conjunction with nurses, anesthesiologists and sur-
geons to assure the relevance of the system to their practice.
Results have been significant. The answers from our approach provide
daily plans that reduce patient waiting and assure that the correct surgi-
cal team and surgery suite is available when needed.
Maged Dessouky is a professor and David Belson is a seniorresearch associate and lecturer in the Daniel J. EpsteinDepartment of Industrial and Systems Engineering in the ViterbiSchool of Engineering at the University of Southern California.Randolph Hall is vice provost for research advancement at USC.
30 A N A L Y T I C S REGISTER NOW TO RECEIVE A FREE SUBSCRIPTION TO ANALYTICS:http://analytics.informs.org
P A T I E N T F L O W
REDUCING DELAYS Through Improved SurgicalSchedulingBy Maged Dessouky, David Belson and Randolph Hall

OPTIMIZATION
Europe
GAMS Software GmbH
Eupener Strasse 135-13750933 Cologne, Germany
[email protected]://www.gams.de
USA
GAMS DevelopmentCorporation
1217 Potomac Street, NWWashington, DC 20007, USA
phone [email protected]://www.gams.com
www.gams.com
High-Level ModelingThe General Algebraic Modeling System (GAMS) is a high-level modeling system for mathematical programming problems. GAMS is tailored for complex, large-scale modeling applications, and allows you to build large maintainable models that can be adapted quickly to new situations. Models are fully portable from one computer platform to another.
State-of-the-Art SolversGAMS incorporates all major commercial and academic state-of-the-art solution technologies for a broad range of problem types.
GAMS/COIN-ORIn 2004 two linear mixed integer solvers from COIN-OR were introduced as part of the GAMS distri-bution. Since then, the COIN-OR/GAMS cooperation has resulted in various activities mutually benefi-cial to GAMS clients and the open source community.
Ready to use COIN-OR solvers are part of the regular GAMS distribution (free of charge).
Close collaboration with the Department ofMathematics at Humboldt-Universität zu Berlin results in the COIN-OR project GAMSlinks (https://projects.coin-or.org/GAMSlinks,project leader Stefan Vigerske), open-sourcing the linking code for all supported solvers.
Addition of (mixed-integer) non-linear COIN-OR solvers to the GAMS distribution.
Continuous performance improvement (see performance plot) of COIN-OR solvers.
GAMSWorld QA tools (e.g. PAVER www.gamsworld.org/performance/paver) are being used to automate test and performance procedures, providing feedback to the COIN-OR community.
Open source solvers part of the GAMS system:Bonmin (MINLP), Clp/Cbc (LP/MIP), Glpk (LP/MIP), and Ipopt (NLP).
Support for popular platforms: Windows, MacOS, Linux, and Sun Solaris on Intel.
GAMS Integrated Developer Environment for editing, debugging, solving models, and viewing data.
Performance Profile of LP Models from GamsWorld's LINLIB.
32 A N A L Y T I C S REGISTER NOW TO RECEIVE A FREE SUBSCRIPTION TO ANALYTICS:http://analytics.informs.org
P A T I E N T F L O W
departments and to ensure that all parties are prepared forforeseeable demand.
• Inefficient processes that require more work than necessaryor un-needed repetition of work.
For example, patients may wait for placement in a hospital bedbecause:• Other patients are waiting too long to complete the
discharge process.• Beds remain idle too long from when a patient departs until
a bed is prepared for the next patient, until “bed control” isnotified of its availability, and until the next patient istransported to the bed.
• Communication is poor between the emergency departmentand the ward as to the exact time patients will arrive and thecare needed immediately upon arrival.
• The suitability of individual beds for individual patientscannot be ascertained due to inadequate processes fortracking patients and their medical records and inadequateprocesses for tracking the state of hospital beds.
Similar observations can be made in surgical and radiologicaldepartments. A patient with a serious fracture cannot be operated onuntil the CAT scan is completed, which is delayed because there is ashortage of technicians, because cycle times are too long (the result ofnot sufficiently prepping patients before the test), or perhaps evenbecause there is an inadequate number of gurneys to transport patients.Surgical capacity is wasted due to cancellations, because surgical timesare mis-estimated or because insufficient hours are scheduled.
TechniquesHEALTHCARE SYSTEMS can be changed for the better
through a strategy that combines participation and creativity. Butchange cannot be sustained without vigilance and without analysisbased on data. Herein lies the opportunity for the O.R. community.For instance, the O.R. community can work with hospital cliniciansand administrators in these areas:• Process modeling to ascertain how patients are currently
served, to determine where inefficiencies exist and toprioritize future changes. Process modeling can revealunnecessary repetition, miscommunication, andinconsistency in methods.
• Simulation modeling both to evaluate new processes and tounderstand and demonstrate the current causes of delay.For instance: simulating delays before and after,
implementing a new appointment system, changing themethodology for assigning patients to beds, orimplementing an electronic patient record system.
• Optimization can be used in many aspects of systemdesign, such as scheduling nurses, scheduling operatingrooms or facility layout.
• Queue analysis is invaluable when executed on a real-timebasis to highlight the delays currently experiencedthroughout a hospital, and to make this informationavailable to all key decision-makers, so that they can betterunderstand delays both upstream and downstream, and acton these delays through reallocation of resources andappropriate prioritization of patients.
Future ChallengesTHE RESEARCH CHALLENGE in patient flow goes back to the
uniqueness of healthcare queues, namely understanding the humanelements of the queueing system.• In some hospitals, the demand for patient care is
perpetually larger than the capacity to serve patients. Unlikewhat theory may predict, queues do not grow withoutbound – instead, the system is brought to equilibrium bypatients who leave without being seen.
• The capacity and motivation to serve patients are greatlyimpeded when queues grow long, in the form of crowdedwaiting rooms, queues of patients waiting for placement tobeds, and patients occupying beds while waiting forsurgeries or tests. The performance of healthcare systemsand its many actors (patients, nurses, doctors,administrators) under these stressed conditions is largelyunknown and, for this reason, it can be extremely difficultto predict the effects of change.
Beyond these two examples, it is critical to create an environmentwhereby change is embraced throughout the organization and, in par-ticular, to change the perspective from “how others are causing prob-lems for my area”to “how I can make the entire system operate better.”The collaborative approach advocated by IHI is therefore essential.
The O.R. community can make a difference in the field ofpatient flow. This is not just a matter of improving efficiency.It is a case where our methods and talents can reduce suffer-ing and save lives. ❙ANALYTICS
Randolph Hall is vice provost for research advancement at theUniversity of Southern California and editor for “Patient Flow,Reducing Delay in Healthcare Delivery” (Springer, 2006).
ANALYTICS... i n the News
SCHEDULE YOUR NEXT CHILD WITH DECISION ANALYSIS “The science of decision-making is available to help women determine when to have a child, two U.S. business scholars suggest.
“Professor Ralph Keeney and doctoral student Dinah Vernik of Duke University’s Fuqua School of Business developed a logical
decision model to help a woman weigh her options according to her values in a systematic way.
“ ‘This decision is too complex to logically consider all the relevant aspects intuitively in one’s head,’ the researchers say in a
statement. ‘Yet, for many, it too important and consequential to simply go with one’s feeling.’
“The model, published in the journal Decision Analysis, doesn’t discount emotion or a partner’s input but aims to balance the
benefits of motherhood against the effects on career ...”
Source: EarthTimes.org
© 2008 Fair Isaac Corporation. All rights reserved.
DECISION MANAGEMENT HAS JUST BEEN OPTIMIZED
Fair Isaac is pleased to announce we’ve acquired Dash Optimization,
the world’s leading developer of optimization software.
Now Dash’s Xpress-MP suite—including Xpress-Optimizer, Xpress-Mosel,
and Xpress-IVE—joins Fair Isaac’s expertise and leading solutions in
predictive analytics and business rules technology. Together, Dash and
Fair Isaac can bring a new level of precision, power and agility to your most
complex business challenges.
To find out how our unique analytic partnership can help you, visit:
www.fairisaac.com/dash.
www.fairisaac.com/dash

The top five misconceptions about starting
an IEOR consulting career.
The top five misconceptions about starting
an IEOR consulting career.
A N A L Y T I C S34 REGISTER NOW TO RECEIVE A FREE SUBSCRIPTION TO ANALYTICS:http://analytics.informs.org
BY CARRIE BEAMBY CARRIE BEAM
Imag
e ©
20
06
Jup
iterI
mag
es C
orpo
ratio
n

So here you are, starting your last school year. Perhaps you’re finishing a B.S. in opera-tions research, with a double minor in something utterly practical, like computer science and accounting, and an unholyfascination with the left nullspace of a certain type of sparse matrix. Or perhaps you’re polishing off a Ph.D. in indus-trial engineering, while managing to take as many Italian art classes as you can for free while you’re still a full-time stu-dent. Or perchance you’re an undergrad majoring in applied mathematics because your school doesn’t offer a full-blownOR/MS major, and while you can program a little and learned to order another cappuccino in Italian while in Romelast summer, you have spent the vast majority of the past few years working your way up to being president of yoursorority, a position which now quite frankly consumes more of your time than your senior thesis.
Every time you run into a grownup, he or she asks,“So what’s next? What are you going to do after graduation?”You’ve been thinking of consulting – OR/MS consulting, to be exact. This idea of being paid to tell other people whatto do while being your own boss and doing interesting technical work really appeals to you. If you have had this thought,my friend, this column’s for you. I’m writing from the perspective of a sole proprietor who has built an OR/MS con-sulting practice from the ground up, immediately following graduate school, with three major tools: a telephone, a lap-top and a Ph.D.
How many of these misconceptions do you entertain, however briefly?
CHECKReality
w w w . i n f o r m s . o r g 35
1. I don’t need to know how to dress well, schmoozeor make pretty PowerPoint presentations. In schoolthey assigned me hard problems and I solved them.I’ll do the same when I go to work.
If you are going to be working for yourself, this is not only false,but deadly.A small-time practitioner is much better off dressing well,schmoozing exceptionally and using excellent PowerPoint to presentmediocre mathematical results. Why?
First, according to veteran O.R. consultant Harlan Crowder, in thereal world,“you not only have to determine the ‘answer’ to the ques-tion, you also need to figure out the question. Most executives andmanagers you work for – as an employee or consultant – will knowthey have a problem, but will not be able to articulate what has gonewrong in their organization or business.” Crowder says some of hisgreatest successes as an O.R. practitioner have come from the ability towork with clients to help determine exactly what problem needs to besolved. The real skills needed for real-world problem formulation are:1) interpersonal, 2) communication 3) ingenuity and, above all, 4)patience.
Second, in general, your clients hire you because you are better atmath than they are, and hence they can’t really judge how optimal aparticular solution is. What they can judge are clothing and Power-
Point, and (for better or worse) they will often decide how valid yourmathematical results are based upon your shoes and the colorscheme on a slide. Third, the sad reality is that much of the businessworld is run on eighth-grade algebra. The silver lining inside thiscloud is that with an OR/MS major under your belt, you should bebatting very close to 1.000 on all of these, even the story problemsinvolving trains leaving Chicago and St. Louis at different times.
2. Delivering great work on time and within budget is enough.
Possibly false again. If you work for a big company, your careerskill ladder will look something like this: do the work (entry-level),manage the work, sell the work, build the brand (partner). At the“do-the-work” level, yes, doing great work on time and within bud-get will make your manager quite happy, especially if you get alongwell with the client while you do it.
If you work for yourself, your skill ladder will look somethinglike this: sell the work, do the work, sell more and more work, hiresomebody so you can manage the work, sell even more work, buildthe brand and continue selling more work. The on-time and with-in-budget bit is nice to have but certainly not a requirement. You’llbe better off with excellent sales skills and good project management

As a sole proprietor, you are the boss and you will be talking aboutmoney in every other sentence,and you simply will have to get over thesocial aversion.You will be asking prospects for the sale.You will be ask-ing about corporate discounts on travel. You will be negotiating withvendors and contractors to get the best rate. You will be dealing withyour bankers about lines of credit that they will only grant once youdon’t really need the money. You will be dealing with your brokersabout retirement plans.As I write this, I am finishing up Project B for aclient and knee-deep in Project C for them,and they have still not paidfor Project A, for which I sent the invoice two months ago.
Money, money, money drives the small-time operator’s world.And between the thoughts about dollars and selling, you can thinkabout linear programming, inventory systems or, in a flash of inspi-ration, see if you can come up with a snazzy rhyme for “stochasticprocess.” (The best I can do is “gymnastic bosses” or “spastic rhi-noceros,” and I must admit I actually spent a good deal of my firstyear in the Ph.D. program at Berkeley contemplating this preciseissue. It’s a wonder I passed my comps.)
5. Running a consulting practice is the same asrunning a consulting business.
False again. A consulting practice is typically one “expert” (this isyou) person hiring themselves out, with possibly a small supportstaff, such as an administrative assistant, an accountant and a travelagent. The expert bills by the hour. As every good process engineerknows, the expert should be the bottleneck, and if the expert is busy,the work has to wait. If the expert retires or quits, the practice is near-ly worthless.
A consulting business looks much like any other professional ser-vices business (think Accenture,KinderCare or Jiffy Lube).The work iswell-understood and repeatable. It can be subcontracted out or doneby employees. It can be sold by somebody who can’t actually do thework.And it is typically done on a fixed-bid basis, a certain deliverablefor a certain amount of money. If the founder retires, the business isworth something – these sorts of things can be sold for the value of theclient list plus the employees, methodology and work in progress.
As soon as you move from running a practice to running a busi-ness, you no longer desperately need only an administrative assis-tant. You also desperately need nerdly people whom you can teachto do the work, and even more desperately you need non-nerdlypeople who can’t necessarily do the work but who can manage it,budget it and above all, sell it.
If you are remotely close to the proverbial OR/MS student who ispresident of your sorority, whose ambition it was to be the weakeststudent the department ever had who still got the degree, and whohas successfully sold anything from Girl Scout Cookies to life insur-ance, please e-mail me. The only thing harder to find than goodnerds are good nerds who can sell. ❙ANALYTICS
Carrie Beam ([email protected]) received herPh.D. in industrial engineering and operations research from U.C.Berkeley in 1999 and has been self-employed as an IE/ORconsultant for nearly a decade. Her projects have run the gamutfrom benchmarking the DMV to segmenting a database of rumdrinkers, and her clients have ranged from other sole proprietors toFortune 100 companies. She lives in the San Francisco Bay Areawith her family.
skills, so you can gently let a client know you’ll be late and runningover budget, and spin it so he’s delighted to hear that news.
3. I’m looking forward to working; $150 an houramounts to $300,000 a year! I’ll have a nice car, a great place to live and an expense account. What a life!
Maybe false again, my friend. If you work for a big company,some of this plus a daily Grande at Starbucks can be yours immedi-ately after signing on the dotted line. According to executiverecruiter Ray Fortney, a partner in a Bay-Area based executive searchfirm,“Salaries for upper-level executives with an O.R. backgroundcan easily start at $150,000 and range to $250,000, not countingbonus. And don’t forget benefits including a 401k or stock options.Compensation packages like this are particularly true if the individ-ual is an excellent manager, has strong leadership skills and strongcustomer skills. These skills are generally learned working for toptier companies. Picking the right company early in your career canbe key to your long term success.” And with that sort of start, youcan quickly upgrade your Starbucks habit to the Venti, and evenprogress to the ones with the whipped cream and the chocolateswizzles and the big plastic bubble thing on the top.
And now for the sad news. If you start your own company, youget paid last: after Kinko’s, after your liability insurance, after the hotelstay in Manhattan that the client will take seven months to reimburseyou for, after the $2,000 for attending a trade conference at which yougot food poisoning and didn’t make any contacts after all.
Those professors who make $300+ an hour to consult? They havetwo things going for them that beginners typically don’t. First, they’reworld experts and have years of experience going for them. Second,they’re selling time at the margin; they don’t need to fill 40 hours aweek, 50 weeks a year at those sorts of rates. The university pays theirbread and butter, so the professors have the luxury of waiting for thebig, juicy job to come along, all the while sharpening their expertiseand broadening their spectrum on the university’s nickel.
My first year in business my income was something like minus$4,000. That’s right, my bank account was $4,000 smaller after thatfirst year. For my first big out-of-town job, rather than spendingmoney on hotels or restaurant meals, I dug up a grad school friendin that city, stored groceries in her kitchen and slept on her floor.And my first three years in consulting, I was driving a 1984 blueVolvo station wagon with the right front headlight alternately hang-ing off at a wild angle or stuck on with duct tape. I parked aroundthe corner when I went on sales calls, because I was sure that anyprospect who saw that car would immediately count me out.
For those of you keeping track of these things, I’m now driving a1998 Saturn with Cheerios all over the back seat, and every time Idrive a client anywhere I have to get worked up into a wild vacuum-ing frenzy first. The only exception to this rule is if the client also haschildren and has let me into his or her fully-Cheerio-laden car first.
4. It’s rude to talk about money.This is somewhat true.You have to be careful what figure you share
with whom.At a big company,you’ll be responsible for tallying up youraccomplishments each year and negotiating with your boss for a raise.
36 A N A L Y T I C S REGISTER NOW TO RECEIVE A FREE SUBSCRIPTION TO ANALYTICS:http://analytics.informs.org
C a r e e r C h o i c e s


WWE USE SIMULATION TO REALIZE OUR IMAGI-NATION in a specific and detailed way – renderingwhat we imagination in a way that we can grasp. Forinstance, one may use laser devices to simulate the effectof actual arms during a military exercise, while preserv-ing the dust, heat and fatigue that soldiers experienceduring actual operations; or simulate the equations ofmotion to provide the sensation of flying an airlinerunder adverse conditions to prepare a pilot to deal withan emergency; or model the interactions among pro-ducers and suppliers to predict the performance of aninternational supply chain. However we use it, simula-tion tools are there to aid our imagination to probe thefrontiers of knowledge, to teach or simply to entertain.
Simulation has grown ubiquitous: the widespreadavailability of personal computers (and gaming comput-ers) means that everyone has access to this technology. Inthe last decade simulation has moved out of the class-room and lab and into the public domain, becomingwidely familiar and accepted though games and movies. This emer-gence into the public consciousness has already opened new busi-ness opportunities and will no doubt open new frontiers for theapplication of simulation.
The migration of simulation into the public arena over the lastdecade may prove to be the most significant recent change in thefield. For most of the history of simulation, specialized technicalapplications have driven the development of simulation, whichtended to limit the field’s growth. By contrast, commercial simula-tion products in entertainment open lucrative new markets thatmay very well spur an increasingly rapid pace of innovations. Aca-demic programs are now being offered to train the next generationof games developers. Simulation has not had a large impact on theclassroom as yet, but advances in gaming will contribute to devel-opment of simulation-based teaching tools.
The widespread availability of simulation technology also meansnovel fields of application. For instance, psychologists are using
A N A L Y T I C S38 REGISTER NOW TO RECEIVE A FREE SUBSCRIPTION TO ANALYTICS:http://analytics.informs.org
existing military games as the basis for a treatment of Post Trau-matic Stress Disorder (PTSD). One treatment approach is exposuretherapy, in which stressful situations are relived in such a way thatthey can be faced. One advantage of simulation is that the exposurecan be graduated, allowing the patient to approach the stressfulmemory slowly, through different levels of detail and intensity. Onetool in development for Iraq War veterans includes virtual realityimmersion complete with sounds, a shaker platform that providesvibration to simulate the passage of a helicopter flying overhead ornearby explosions, and even scents that can be used to complete thesensations associated with the memory. The treatment is made pos-sible by the existing simulation games and virtual reality compo-nents that drastically reduce the cost of development.
Simulation-based training is already in use for commercial appli-cations, such as specialized maintenance activities for aircraft equip-ment. Simulation-based instruction is not yet widespread in the col-lege classroom. Yet, games such as America’s Army illustrate that
Biennial survey of discrete-event simulation software tools
New Frontiersin Simulation
By James J. Swain
S o f t w a r e
S u r v e yS
Image courtesy of Wolverine Software

w w w . i n f o r m s . o r g 39
simulations can be used toimmerse the players within arealistic simulated environmentthat can be used for role-playing.Many of these games are alsostructured to provide interactionbetween multiple players.Immersive activities might bedeveloped that provide a contextfor problem-solving in a coursesuch as design of experiments orquality control in statistics,model formulation and applica-tion in operations research orengineering design. Such animmersive approach would pro-vide both more realism and also match the interactive activities thatthe current generation is used to.
SurveyTHE ACCOMPANYING ONLINE SURVEY (www.lionhrt
pub.com/orms/surveys/Simulation/Simulation.html) is the eighthbiennial survey of simulation software for discrete-event systemssimulation and related products (Swain, 2005). All product infor-mation has been provided by the vendors. Products that run on per-sonal computers to perform discrete-event simulation have beenemphasized, since these are the most suitable for usage in manage-ment science and operations research. Simulation products whoseprimary capability is continuous simulation (systems of differentialequations observed in physical systems) or training (e.g., aircraftand simulators) are omitted here.
Forty-eight products are listed in the survey, taken from 65 prod-ucts submitted,making it one of the larger surveys.The range and vari-ety of these products continues to grow,reflecting the robustness of theproducts and the increasing sophistication of the users. The informa-tion elicited in the survey is intended to provide a general gauge of theproduct’s capability, special features and usage. This survey includesinformation about experimental run control (e.g., batch run or exper-imental design capabilities) and special viewing features, including theability to produce animations or demonstration that can run indepen-dent of the simulation software itself. A separate listing gives contactinformation for all of the vendors whose products are in the survey.Anexpanded version of the survey is available on the Lionheart PublishingWeb site (www.lionhrtpub.com) and will include vendors who missedthe publishing deadline. Of course, most of the vendors provide theirown Web sites with further details about their products. Many of thevendors also have active users groups that share experience in the spe-cialized use of the software and are provided with special access totraining and program updates.
A number of technical and professional organizations and con-ferences are devoted to the application and methodology of simula-tion. The INFORMS publications Management Science, OperationsResearch and Interfaces publish articles on simulation. TheINFORMS Simulation Society sponsors simulation sessions at thenational INFORMS meeting and makes awards for both the bestsimulation publication and recognition of service in the area, includ-
ing the Lifetime AchievementAward for service to the area ofsimulation. Further informationabout the Simulation Society canbe obtained from the Web sitewww.informs-cs.org. This sitenow provides the complete con-tents of the Proceedings of theWinter Simulation Conferencefrom 1997 to 2006, and also con-tains links to many vendors ofsimulation products and sourcesof information about simula-tion, simulation education andreferences about simulation. TheSociety for Modeling and Simu-
lation International (www.scs.org) is also devoted to all aspects ofsimulation. Their conferences include the Huntsville SimulationConference that takes place annually in Huntsville, Ala.
The Simulation Society and the Society for Modeling and Simu-lation are sponsors of the annual Winter Simulation Conference(WSC). The 2008 WSC will be held Dec. 7-10 at the InterContinen-tal Hotel in Miami. The program includes tutorial, methodology andapplications tracks, including specialized areas such as computermodeling, financial models, transportation and logistics and otheroperations. Further information and registration information isavailable from the site www.wintersim.org. The sponsors of the con-ference are also ready sources of information about simulation.
Legacy of Simulation: Ancient Roots, Modern Application
THE USE OF SIMULATION is so central to the modern Depart-ment of Defense (DoD) that there is probably no aspect of procure-ment, operations or doctrine that is not currently studied by simula-tion. Simulation is also used extensively in training. The DoD hasextensively invested in all aspects of distributed simulations, wheremodels of individual fighting units of all types are joined to modelsthat determine what sensors (such as radar) can “see,” how commu-nications will perform under field conditions, and how commandand control will function. The DoD has evolved standards for valida-tion and model certification, and is actively exploring the means forthe effective reuse of code developed in one model for use in other,newer models. Visualization has also been brought to a high level ofdevelopment to make training as realistic as possible.
The reliance on simulation is anything but new – the military hasused gaming for several centuries to train its officers, to plan futureoperations and to perform staff studies to update doctrine. Militarywar gaming using sand tables and maps using various counters to rep-resent bodies of troops predate computer models.A major limitationwas the manual evaluation of casualties units using dice and specialtables. Our own military academies included war gaming into theircurriculum from their inception.
The rapid changes in technology during the last century neces-sitated ongoing studies to determine how the new weapons couldbe utilized and to provide an appreciation of their effectiveness. Forinstance, during the interwar period many nations formed experi-
Image courtesy of AnalyCorp. Inc.

mental armored units to study the size, composition and operationsof the new units. Many of these units evolved from exclusivelyarmored formations to the combined arms units that predominat-ed during WWII. Likewise, the U.S. Navy conducted a series of fleetexercises in the Pacific in the 1930s to study the effectiveness and theproper role of aircraft carriers. Over time, these studies led to anappreciation of their offensive capability and a transformation innaval doctrine. For instance, Fleet Exercise XIX in March of 1938presaged the attack on Pearl Harbor, when planes from the Sarato-ga simulated a pre-dawn attack on aircraft at Hickam and Wheelerair fields in Hawaii. These exercises had a definite impact on navalthinking that prepared officers and planners for the conduct ofoperations in the Pacific during WWII.
The phenomenal growth of simulation throughout industry andparticularly within the DoD has led to a growing demand for simu-lation professionals to develop models and modeling tools, and tomanage large and complex simulation based projects.Academic pro-grams in modeling and simulation have appeared at the Universityof Arizona, University of Central Florida, Old Dominion University,Georgia Tech and the University of Alabama in Huntsville, amongothers. Organizations such as the Alabama Modeling and SimulationCouncil (www.amsc.to) have been formed to represent all aspects ofsimulation, including the commercial, technical standards and train-ing, academics and applications.
FrontiersMILITARY AND INDUSTRIAL operations rarely operate from a
single symphonic “score,” but more nearly resemble improvisationsamong interacting players. A limitation of the traditional simulationhas been the limits on autonomy provided in the modeling con-structs. Even entities that represent workers typically operate by rulesthat are not dissimilar to those of the machines. For instance, in atypical manufacturing simulation, products may be pushed throughthe system using a schedule of orders to be processed. Workers tendto individual or groups of machines according to well-defined rules,priorities and characteristics of the work. Few models provide anymeaningful autonomy to make decisions, to learn from their envi-ronment or to cooperate with each other when problems arise.
Newer simulation products arebeginning to provide autonomousagents that can act on their ownand interact among themselves.These agent-based simulations(Samuelson and Macal, 2006) haveevolved from earlier studies of complex systems whose behavior hasdefied easy explanation. Models of biological systems involving inter-acting members have been built to understand how these complexbehaviors have led to social behaviors in foraging. Generalizing whathas been learned from these studies has led to simulation agents withthe ability to sense their surroundings, interact with other agents, rea-son and choose a course of action. Software has been developed thatmake it possible to program agents to sense their surroundings,learn, remember or to make decisions. One example is available inthis survey, as the AnyLogic (XJ Technologies) software supportssimulation agents.
Modeling using simulation agents is being applied in trans-portation and other areas where interaction and local decision-making might play an essential role.Agents have been used in trafficsimulations, where driving behaviors are affected by local condi-tions, variations among drivers, and may include the decision tochange routes based on traffic density and the awareness of alterna-tive routings. Large simulations of air traffic include the provisionfor centralized traffic control and the autonomous control of theirpilots. Other applications include crowd simulations, tactical war-fare and pedestrian traffic. ❙ANALYTICS
James J. Swain ([email protected]) is professor and chair of theISEEM department at the University of Alabama in Huntsville.
Editor’s note: We received more than 65 packages for this survey. Dueto space constraints, we could only list 48 in the printed version ofOR/MS Today. Among the submissions left out were multiple versionsof simulation packages from certain vendors, packages that didn’t fitthe parameters of the survey [such as Expert Fit (www.averill-law.com)and Stat::Fit (www.geerms.com), which are not actually simulationprograms, though they support simulation] and packages that arrivedafter the deadline. A more complete list of packages, including thosenot seen here and those that arrived after the deadline, can be foundonline at: http://lionhrtpub.com/orms/surveys/Simulation/Simulation.html.
A N A L Y T I C S40 REGISTER NOW TO RECEIVE A FREE SUBSCRIPTION TO ANALYTICS:http://analytics.informs.org
S o f t w a r e
S u r v e yS
R E F E R E N C E S1. J. J. Swain, 2005, “Gaming Reality:Biennial survey of discrete-eventsimulation software tools,” OR/MSToday, Vol. 32, No. 6, pp. 44-55.
2. D. A. Samuelson and C. M. Macal,2006, “Agent-Based SimulationComes of Age,” OR/MS Today, Vol.33, No. 4, pp. 34-38.
Vehicle Routing (February 2008)www.lionhrtpub.com/orms/surveys/Vehicle_Routing/vrss.html
Simulation (October 2007)www.lionhrtpub.com/orms/surveys/Simulation/Simulation.html
Linear Programming (June 2007)http://www.lionhrtpub.com/orms/surveys/LP/LP-survey.html
OR/MS Today (www.lionhrtpub.com/ORMS.shtml), the membership magazine of the Institute for Operations Research and the Management Sciences
(INFORMS), regularly conducts surveys of software of interest to a broad spectrum of analysts. Most of the surveys are updated on a biennial basis.
Each survey includes a directory of vendors and side-by-side comparisons of software packages, including such metrics as system requirements,
performance capabilities, key features, technical support and vendor comments.
Several software surveys are available online, including:
Statistical Analysis (February 2007)www.lionhrtpub.com/orms/surveys/sa/sa-survey.html
Decision Analysis (December 2006)www.lionhrtpub.com/orms/surveys/das/das.html
Forecasting (August 2006)www.lionhrtpub.com/orms/surveys/FSS/fss-fr.html
ANALYTICAL SOFTWARE SURVEYS

Employment Advertising at
WWW.ORMS-TODAY.COM
The premier site for employers and recruiters searching
for professionals in the fields of operations research,
management science and the related information and
decision sciences.
www.orms-today.com averages 45,000 visitors a month
with over 13,000 page views for the job search pages.
To post a job opening go to www.orms-today.com, click
on post job opening and follow the job posting guidelines
and payment procedure.
For Print, and Print + Online Combination
Advertising Contact
Maria Bennett
770.431.0867, ext. 219
(888.3033.5639 Toll Free)
Email: [email protected]
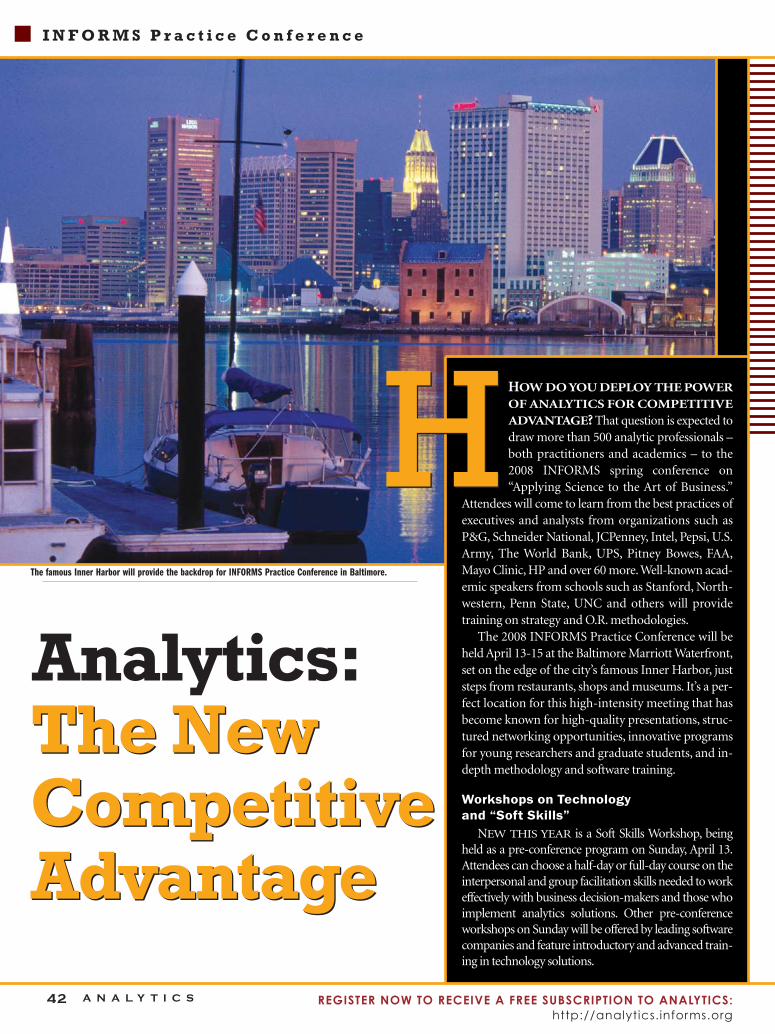
Analytics:The New CompetitiveAdvantage
The New CompetitiveAdvantage
The famous Inner Harbor will provide the backdrop for INFORMS Practice Conference in Baltimore.
HOW DO YOU DEPLOY THE POWEROF ANALYTICS FOR COMPETITIVEADVANTAGE? That question is expected todraw more than 500 analytic professionals –both practitioners and academics – to the2008 INFORMS spring conference on“Applying Science to the Art of Business.”
Attendees will come to learn from the best practices ofexecutives and analysts from organizations such asP&G, Schneider National, JCPenney, Intel, Pepsi, U.S.Army, The World Bank, UPS, Pitney Bowes, FAA,Mayo Clinic, HP and over 60 more. Well-known acad-emic speakers from schools such as Stanford, North-western, Penn State, UNC and others will providetraining on strategy and O.R. methodologies.
The 2008 INFORMS Practice Conference will beheld April 13-15 at the Baltimore Marriott Waterfront,set on the edge of the city’s famous Inner Harbor, juststeps from restaurants, shops and museums. It’s a per-fect location for this high-intensity meeting that hasbecome known for high-quality presentations, struc-tured networking opportunities, innovative programsfor young researchers and graduate students, and in-depth methodology and software training.
Workshops on Technology and “Soft Skills”
NEW THIS YEAR is a Soft Skills Workshop, beingheld as a pre-conference program on Sunday, April 13.Attendees can choose a half-day or full-day course on theinterpersonal and group facilitation skills needed to workeffectively with business decision-makers and those whoimplement analytics solutions. Other pre-conferenceworkshops on Sunday will be offered by leading softwarecompanies and feature introductory and advanced train-ing in technology solutions.
I N F O R M S P r a c t i c e C o n f e r e n c e
HH
A N A L Y T I C S42 REGISTER NOW TO RECEIVE A FREE SUBSCRIPTION TO ANALYTICS:http://analytics.informs.org

w w w . i n f o r m s . o r g 43
Supply Chain Management with “OR Inside”• Procter & Gamble – William Tarlton, Supply Chain R&D Manager, Personal
Beauty Care, on implementing inventory optimization in consumerpackaged goods.
• Pepsi Bottling Group – Arzum Akkas, Senior Project Manager, Supply ChainTechnology, on retail out-of-stock reduction in a direct store delivery environment.
• Penn State University – Terry Harrison, Professor of Business, Supply Chain &Information Systems, and Thomas Robbins, Instructor, S. C. & Info. Systems,on the emerging science of service management.
• Xilinx – Alex Brown, Principal Engineer & Supply Chain Architect, on usingdemand information to improve forecasting and supply chain performance.
• IBM – Markus Ettl, Manager of Supply Chain Analytics & Architecture, IBMResearch, and Blair Binney, Manager of Demand/Supply Planning ProcessTransformation, IBM Integrated Supply Chain, on improving distributor andIBM performance in the supply chain.
• University of North Carolina – Brian Tomlin, Assistant Professor of Operations,Technology and Innovation Management, on supply chain risk management.
Theories of Practice: Deploying Analytics• UPS, HP, P&G, AT&T – High-level panel on how internal analytics is funded
within enterprises. Glenn Wegryn, Associate Director of Global Analytics, P&G;Jack Levis, Director of Package Process Management, UPS; Sam Parker,Executive Director of Research, Quantitative Analysis & Systems, AT&T;Shailendra Jain, HP Solutions & Service. Moderator: Zahir Balaporia, Directorof Decision Engineering, Schneider National.
• Pitney Bowes – Rungson Samroengraja, Vice President, New Product Development, on building better business models.
• ILOG – Jean Pommier, Vice President, Methodology, on ILOG’s methodologyfor implementation of decision-support systems.
• INFORMS Prize Winner – The company that receives the 2008 INFORMSPrize will describe their work in effectively integrating analytics into organizational decision making.
OR Applications in Health Care• Univ. of Texas MD Anderson Cancer Center – Scott B. Cantor, Associate
Professor, Dept. of Biostatistics, on decision analysis in medicine.
• Mayo Clinic – Mark J. Hayward, Vice Chair, Facilities & Systems Support, andAssociate Administrator, Outpatient Operations, on applications of ORapproaches at the Mayo Clinic.
• CHS Medical – Mel Hall, Chairman and CEO, on workforce health management and health risk analysis.
• RTI International - Stephanie R. Earnshaw, Global Head of Health EconomicsUS, and Stephen M. Beard, Global Head, Health Economics and EuropeanOperations, on supporting reimbursement of pharmaceuticals.
• George Mason University– Ariela Sofer, Professor and Chair, Systems Engineering & OR, on OR in cancer treatment.
Analytics for Government, Military and Public Policy• The World Bank – Shanta Devarajan, Chief Economist, South Asia, on the role
of general equilibrium models in national and international policy making.
• US Army and AT&T – Col. Kent Miller, Chief, Army Manpower Strength Analysis & Forecasting, US Army HQDA, DCS-G1, and Judith Kerbel, AT&T, onproducing the active Army military manpower program.
• US Dept. of Agriculture, Economic Research Services – Neil Conklin, Director,on models for policy design and analysis in agriculture.
• International Resources Group – Gary Goldstein, Senior Manager, energy andstrategic planning in a carbon-constrained world.
• Texas A&M – Bruce A. McCarl, Regents Professor of Agricultural Economics,on modeling for government policy analysis.
• US Army, Center for Army Analysis – LTC Robert D. Bradford, OR Analyst, onthe Army Reserve stationing study.
Managing Uncertainty• Intel – Jay W. Hopman, Researcher/Strategic Analyst, on managing demand
risk using forecasting markets.
• InfoLogix – Douglas A. Samuelson, President, and Principal Decision Scien-tist, Serco, on managing competing risks.
• Land O’Lakes – Jim Williams, Manager, Operations Research, on continuousimprovement for demand planning.
• Applied Quantitative Sciences – Michael A. Kubica, President, on applyingsimulation to align supply chains with consumer demand for novel products.
• George Mason University – Robin Hanson, Associate Professor of Economicsand Research Associate, Future of Humanity Institute at Oxford University, onprediction markets and OR.
Applying Decision Analysis Tools• Innovative Decisions Inc.– Kenneth P. Kuskey, Senior Principal, on a
framework and scalable process of deliberative decision analysis.
• CH2M Hill – Daniel R. Pitzler, Consulting Economist, Decision Analysis, on decision analysis applications in local government.
• Strata Decision Technology – Don N. Kleinmuntz, Executive VP & CFO, andProfessor, USC, on resource allocation models for terrorism risk management.
• Decision Strategies Inc. – Patrick Leach, Engagement Leader, and author ofWhy Can’t You Just Give Me the Number?, on the battle against Bayesianamnesia.
• Kromite – Homie Razavi, Senior Partner, on pharmaceutical industry DA froma consultant’s viewpoint.
• Innovative Decisions Inc.– Dennis M. Buede, Executive Vice President, onmaking product development (system design) decisions with DA.
Methodology Tutorials• Probability Management - Sam Savage, Consulting Professor, Management
Science & Engineering, Stanford University.
• Open Source Solvers and OR - Brady Hunsaker, Software Engineer, Google.
• Nonlinear Complementarity and Extensions - Michael C. Ferris, Professor of Computer Sciences and Industrial & Systems Engineering, University of Wisconsin.
• Urban Network Design – Hani S. Mahmassani, Patterson Distinguished Chairof Transportation, Northwestern University.
• Reverse Supply Chains: Maximize Value Recovery for Product Returns - DanielGuide, Associate Professor, Operations & Supply Chain Management, Pennsylvania State University.
• System Dynamics - Jim Hines, Senior Consultant, Ventana Systems; President, System Dynamics Society.
• Achieving Optimal Solution Performance - Bjarni Kristjansson, President, Max-imal Software.
• The Art of Modeling - Jeffrey D. Camm, Professor and Department Head,Quantitative Analysis and Operations Management, University of Cincinnati.
• Designing Distribution Networks Using Simulation and Optimization -Thomas Cartwright, Sr. Manager, Logistics Planning Strategy & Analytics,JCPenney.
CONFERENCE TRACKS
The Franz Edelman Competition is a highlight of the meeting.Six finalists will demonstrate their applications of high-impact ana-lytics during the day on Monday (see accompanying story), with the2008 winner announced at a gala awards ceremony and banquet thatevening.Admission to the banquet is included in the conference reg-istration fee. This year for the first time, the winner of the INFORMSPrize will also be announced. The INFORMS Prize is awarded annu-ally to the company that effectively integrates analytics into organiza-tional decision-making and has repeatedly applied O.R. principles innovel and lasting ways.
From Analyst to CEOCHRISTOPHER LOFGREN, CEO of Schneider National, will
open the conference on Monday morning with a plenary talk on
“Making the Transition from Analyst to CEO.” Holder of a Ph.D.from Georgia Tech, Lofgren began his career as a supply chain ana-lyst and later took the steps into management as VP, CIO and COOat Schneider, the largest truckload carrier in North America. Lofgrenwill reveal how his perspective on the value of analytics has changedas he made that transition.
On Tuesday, the morning plenary will reprise the 2008 winningEdelman presentation. In the afternoon, Edward Kaplan, Professorof Management Sciences, Public Health and Engineering at YaleUniversity, will describe some “Adventures in Modeling.” An elect-ed member of both the National Academy of Engineering and theInstitute of Medicine of the U.S. National Academies, Kaplan’sresearch has been reported in the New York Times, Wall Street Jour-nal and Newsweek, as well as in numerous professional journals.

Real-World ApplicationsTHE CONFERENCE PROGRAM incorporates more than 80
sessions in eight tracks each day, including these focus areas: supplychain management, deploying analytics, health care applications,managing uncertainty, public policy and military, and decisionanalysis (see accompanying story). A 21-member council of practi-tioners and academics, chaired by Karl Kempf, Director of DecisionTechnologies at Intel, identified topics and invited speakers toaddress those topics.
Additional select presentations were chosen through a rigoroussubmission and review process.“We hope the program overall pro-vides attendees with a cross-industry view of high-impact analyticsapplications in the real world, along with some skill-building tuto-rials and software training,” Kempf says.
Two special programs are designed for young researchers andgraduate students nominated by department chairs or senior man-agers. The Young Researcher Connection provides junior facultyand young industry professionals with new perspectives into criti-cal problems facing industry. The INFORMS Professional Collo-quium offers career guidance to master’s and Ph.D. students whoare interested in practice careers.
Analytics readers can register for a conference at a discountedrate of $820. Click here and use password: Analytics12. For contin-uing updates on the meeting, go to: http://meetings.informs.org/Practice08; 800-343-0062 or 401-722-2595; [email protected]. Early hotel reservations are advised since rooms in theINFORMS block at the Marriott Waterfront may sell out before thecut-off date of March 14. ❙ANALYTICS
How do you deploy the
Power of Analyticsfor competitive advantage?
Get a cross-industry view of high-impactanalytics applications in the real world.
Learn from best practices in using analytics to optimize business processes and make fact-based business decisions.
Sharpen your skills in quantitativemethodologies and technologies.
Help decision-makers in your companyunderstand the value of analyticsas a competitive driver.
��
��
2 0 0 8 I N F O R M S C O N F E R E N C E O N O . R . P R A C T I C E
APPLYING SCIENCETO THEArt of Business
April 13-15, 2008Marriott Waterfront
Baltimore, Maryland
Find the answers at the
http://meetings.informs.org/Practice08
EDELMAN COMPETITION AND AWARDS GALA
A N A L Y T I C S44 REGISTER NOW TO RECEIVE A FREE SUBSCRIPTION TO ANALYTICS:http://analytics.informs.org
Six finalists will compete for the top prize in the 2008 Edel-
man Competition, the “super bowl” of O.R. practice, show-
casing analytics projects that had major impacts on their
client organizations. The competition takes place April 14
at the INFORMS Practice Conference and is open to all
conference registrants. That evening, the six finalists will
be honored and the 2008 winner announced at a gala
awards ceremony and banquet. In addition, the winner of
the 2008 INFORMS Prize, a company that effectively inte-
grates analytics into organizational decision-making, will
also be announced.
2008 EDELMAN FINALISTS:• City of Stockholm, Sweden – “O.R. Improves Quality and
Efficiency in Home Health Care”
• StatoilHydro and Gassco – “Optimizing the Offshore
Pipeline System for Natural Gas in the North Sea”
• Federal Aviation Agency with Metron Aviation and The
Volpe Center, U.S. Department of Transportation –
“Airspace Flow Programs”
• Netherland Railways – “The New Dutch Timetable:
The O.R. Revolution”
• U.S. Environmental Protection Agency – “Reducing
Security Risks in American Drinking Water Systems”
• Xerox – “LDP Lean Document Production®: Dramatic Pro-
ductivity Improvements for the Printing Industry”
I N F O R M S P r a c t i c e C o n f e r e n c e

Get an inside look at how successful organizations are using data, models and prediction to make better decisions.
SCHNEIDER NATIONAL Christopher Lofgren, President & CEO
JC PENNEY Thomas Cartwright, Sr. Manager, Logistics Planning Strategy & Analytics
P&G Glenn Wegryn, Associate Director of Global Analytics
THE WORLD BANK Shanta Devarajan, Chief Economist, South Asia
YALE Edward Kaplan, Beach Professor of Management Sciences, Public Health & Engineering
PITNEY BOWES Rungson Samroengraja, VP, New Product Development
ILOG Jean Pommier, VP, Methodology
STANFORD Sam Savage, Consulting Professor, Management Science
US ARMY Col. Kent Miller, Chief, Army Manpower Strength Analysis & Forecasting
MAYO CLINIC Mark Hayward, Vice Chair, Facilities & Support Services
XILINX Alex Brown, Principal Engineer & Supply Chain Architect
UPS Jack Levis, Director of Package Process Management
NORTHROP GRUMMAN John Tingle, Senior Decision Analyst
NORTHWESTERN Hani Mahmassani, Patterson Distinguished Chair of Transportation
LOGITECH Dennis Arnow, Director, WW Demand Planning
LAND O’LAKES James Williams, Operations Research Manager
CHS MEDICAL Mel Hall, Chairman & CEO
US DEPT. of AGRICULTURE Neil Conklin, Director, Economic Research Services
…plus 60 more companies, consultants and researchers.
2008 EDELMAN COMPETITION The best applications of the year, showcasing analyticsprojects that had major impacts on their organizations.
NEW! WORKSHOP ON SOFT SKILLS The interpersonal and group facilitation skills youneed to partner with business decision-makers, speak their language and “sell” the power of analytics.
TECHNOLOGY WORKSHOPS Training by leading solutions companies; free to conferenceregistrants.
YOUNG RESEARCHER CONNECTION Exclusive networking program for junior faculty andyoung industry researchers.
CAREER GUIDANCE Full-day, intensive colloquium for master’s and PhD students interestedin analytics practice.
Thanks to our sponsors!
Click here for a special registration rate; available now ONLY to Analyticsreaders – $820. Use password: Analytics12
✔
http://meetings.informs.org/Practice08
Plus...

A N A L Y T I C S46 REGISTER NOW TO RECEIVE A FREE SUBSCRIPTION TO ANALYTICS:http://analytics.informs.org
ROUNDTABLE PROFILES
The Schneider Enterprise
B Y T E D G I F F O R D Editor’s note: This is another in a series of articles profiling members of theINFORMS Roundtable.
Operations Research at SchneiderOPERATIONS RESEARCH-INSPIRED work at
Schneider has developed along two somewhat dis-tinct threads, both driven by business opportunitiesand the need to leverage sophisticated mathematics-based approaches to realize these opportunities.Work around the first thread began in 1976, whenthe Schneider truckload freight network had grownto the point where complex planning models couldbe easily justified. Initial development began on twoapplications. The first was a precursor to later rev-enue management models and was formulated todetermine the “optimal” freight mix given a selec-tion of load opportunities and fixed set of assets.The second was a linear programming formulationwith a sophisticated pre-processing engine to solvethe classic driver-to-load matching problem. To ourknowledge, Schneider was the first truckload com-pany to address these problems with modeling andoptimization.
With the deregulation of the trucking industryin the early 1980s, Schneider grew from its upper
Midwestern base to encompass a national transportation network.To support this growth, engineers at Schneider helped develop plansfor a broad network of operating centers using set-covering modelsin combination with available information on national freight flows.In the late 1980s, O.R. projects included the development of tech-niques to design dedicated network tours routing of inter-plantmovements. This period also fostered the implementation of statis-tical tools to address a variety of customer-specific analyses.
The second thread of activity began in the early 1990s whenSchneider realized the opportunity to expand from an asset-focusedtransportation provider to a broader offering of freight manage-ment and logistics services that were asset-light. In 1993, a separateentity, Schneider Logistics, was incorporated to meet this need; itnow provides a broad range of domestic and international logisticsservices ranging from transportation management to supply chainmanagement and warehousing.
These new service and product offerings generated additionalopportunities and demands for O.R.-based projects. For the expand-ing third-party logistics (3PL) business, shipment planning and car-rier selection tools were developed. A sophisticated shipment plan-ning system included components for mode selection, consolidationand multi-stop routing. The carrier selection module utilized integerprogramming to model complex carrier commitment constraints.For the truckload business, numerous regression models were devel-
SchneiderNational,Inc.
FROM ITS BEGINNING IN 1935 WHEN AL SCHNEIDER
SOLD THE FAMILY CAR TO BUY HIS FIRST TRUCK, Schnei-der National, Inc. has grown to become a premier provider oftransportation, logistics and intermodal services. With combinedrevenues of $3.7 billion, the Schneider enterprise portfolio of inte-grated services includes truckload, intermodal, transportationmanagement, dedicated, bulk, supply chain management, ware-housing and international logistics services. Schneider operatesmore than 14,000 tractors and 48,000 trailers with over 15,000 dri-vers. Last year, Schneider trucks moved two million loads anddrove 2.5 billion miles. Schneider Logistics, a part of the Schnei-der National enterprise, is an international logistics provider totwo-thirds of the FORTUNE 500 companies.
Schneider Logistics helps customers capture strategic businessvalue from their supply chains in the form of lower distributioncosts, reduced inventory, improved customer service and increasedavailability to working capital. Schneider Logistics operates twounits in China: Schneider Enterprise Consultancy (Shanghai) Co.Ltd. and Schneider Logistics (Tianjin) Co. Ltd. Services include sup-ply chain consulting, as well as transportation and logistics servicesfor the domestic market. Schneider National conducts business inmore than 28 countries in North America, Europe and Asia, andcontinues to grow its international service offerings.

w w w . i n f o r m s . o r g 47
INFORMS has two types of members: individual and institutional. The latter (usu-
ally a company) joins by joining the INFORMS Roundtable and appointing as its
representative the person in overall charge of O.R.
The Roundtable has been very active since its founding in 1982, with three
meetings each year and much communication in between. It, its member insti-
tutions and its member representatives take a strong interest in how INFORMS
serves the needs of practitioners, and have undertaken many initiatives and pro-
vided many services toward this end. These involve, for example, public aware-
ness of O.R., both of the annual INFORMS conferences, continuing professional
education, one of the prizes and various committees.
In addition, the Roundtable has an advisory responsibility to INFORMS. One
bylaw states that it “… shall regularly share with INFORMS leadership its views,
its suggested initiatives and its implementation plans on the important problems
and opportunities facing operations research and the management sciences as
a profession and on the ways in which INFORMS can deal proactively with those
problems and opportunities …” By tradition, it meets with the newly elected
INFORMS president-elect each spring to discuss practice-related topics of inter-
est to him or her, and with the entire INFORMS Board each fall to discuss topics
of mutual concern.
The Roundtable membership comprises about 50 organizations. Further infor-
mation is available at http://roundtable.informs.org.
This series of articles aims to share with the INFORMS membership at large
some information and insights into how O.R. is carried on in practice today.
All About the Roundtable
oped to better understand the profitability impact of freight flowsand characteristics. In support of the information technology infra-structure, fast approximation algorithms and highly efficient datastructures were developed for distance and rating engines. The ratingengine technology was subsequently patented.
During this period, a supply chain engineering group was com-missioned within Schneider Logistics. This group, which developedmany of its own tools for facility location and network modeling, wasengaged primarily in business development and in fee-based con-sulting for logistics and 3PL customers. Through the late 1990s andearly 2000s, these two spheres of O.R. activity continued to flourishin two separate groups. Enterprise software-based, decision-supportsystems continued to be developed and enhanced by the DecisionAnalytics group which was housed within the Application Develop-ment arm of the IT organization, while the Supply Chain Engineer-ing group, responsible for both internal and external O.R. consulting,supply chain modeling and business development support, reporteddirectly into the Schneider Logistics business unit.
In 2003, as collaboration and resource-sharing had steadilyincreased, Schneider decided to merge the two teams into a singleEngineering and Research Department headed by a vice presidentreporting to the CIO, while maintaining close ties to the Logisticsbusiness unit. This integration proved to be a precursor to muchcloser alignment and product integration that soon followed acrossthe company’s customer-facing business units.
Today, the Engineering and Research Department is comprised of44 professionals with varied academic backgrounds and industryexperience. The group’s academic backgrounds range across not onlyoperations research, but also industrial engineering, mathematics,computer science, finance and business administration, with a com-bination of bachelor’s master’s and Ph.D. degrees.A number of teammembers bring significant prior transportation operations experi-ence, which helps ensure that the department pursues solutions thatare relevant, practical and credible. The group is organized into fouractivity-specific teams, each lead by a director with accountability todeliver business value to a corresponding constituency.With overlap-ping skill sets, cross-training and resource sharing, these groups areable to both maintain specific focus as outlined below, as well as toflex in size to support changing business needs.
Business Development: Design and operational planning fordedicated fleet networks, modeling to support feasibility studies,analysis for new business proposals, international logistic support.Primarily supporting internal business units and key sole-sourcecustomer accounts.
Supply Chain Engineering: Development of solutions for routedesign, scheduling and facility location problems. Primarily servingafter-market parts distribution systems for heavy equipment, auto-motive manufacturers and tier one suppliers.
Research: Development of algorithms and optimization modelsthat form the basis for decision support engines embedded in corpo-rate-wide operational planning and execution systems. Developmentand execution of off-line simulation and optimization models tosupport strategic and tactical planning and policy development.
Consulting: Statistics and data mining, industrial engineeringanalysis, business process simulations, general consulting and prob-
lem analysis using a wide-range of O.R. techniques. Developmentof productivity tools to support the work of the E&R group.
A Diverse Spectrum of Opportunities SCHNEIDER APPLIES O.R. in a comprehensive array of deci-
sion-making contexts. The following examples will serve to illustratethe breadth of application areas and the variety of skills andmethodologies represented by the organization.
Network Value Engine: Schneider has created a number of pro-prietary applications to institute revenue management principlesin its truckload and intermodal lines of business. Chief amongthese applications is Network Value Engine (NVE), which estimatesthe profitability of individual loads. NVE estimates these network-related profit impacts of loads using marginal values produced bysolving a large, complex math programming model. While NVEwas originally developed to support load acceptance decisions, net-work value has become central to the mindset of decision-makersin other contexts including load solicitation, asset repositioning,and spot pricing.
Tactical Planning Simulator: TPS is a large-scale modeling envi-ronment that is particularly effective for analyzing problems andpolicies which are sensitive to micro-level details and, therefore, notaddressable via more traditional aggregated-flow, min-cost type models. Developed jointly with CASTLE Laboratory at PrincetonUniversity, TPS uses approximate dynamic programming in con-junction with mathematical optimization at sub-problem nodes andsophisticated pattern-matching techniques to enforce operationalpolicy adherence. The system has been used to improve businessdecisions related to the geography of driver hiring, driver work-ruleimpacts, driver time-at-home policies, new business profitabilityanalysis and other areas.
Driver recruiting: Recruiting and training drivers represent sig-nificant costs for the trucking industry. Schneider has developed sev-eral data-mining approaches (regression trees, cluster analysis, etc.)

A N A L Y T I C S48 REGISTER NOW TO RECEIVE A FREE SUBSCRIPTION TO ANALYTICS:http://analytics.informs.org
to improve its understanding of relationships between applicantcharacteristics and measures of driver effectiveness, including time-to-hire, productivity, retention and safety.
Forecasting: Utilizing the tool set of a third-party forecast-ing package, the group has refined and extended statisticaltechniques to generate impressive improvements in forecastaccuracy for monthly load volume (1.7 percent error enter-prise-wide over the second half of 2005). The group is nowworking on new operational (0-7 day) forecasting models tobetter predict network flow imbalances so such situations canbe addressed proactively rather than reactively.
Dedicated fleet analysis: Dedicated networks operate semi-autonomously within the Schneider One-way truckload network.Using both third-party and internally developed optimizationsoftware, Engineering and Research sizes and designs these sub-networks to minimize operating costs, maximize synergy with thebroader network, and reduce the impact of freight surges and flowimbalance. In 2005, incremental revenue for Schneider fromdesigned networks accounted for more than 6 percent of totaldedicated revenue.
Customer service: Over the past five years, Schneider hasembarked on a pervasive process redesign journey. Industrial engi-neers within the Analytics group have played a key role in this work.Using statistical process control methodologies adapted from man-ufacturing (e.g., Six Sigma and control charting), the group has beeninstrumental in facilitating, understanding and improving workflow, customer service representative productivity, on-time perfor-mance and other areas. The group has developed simulation mod-els to evaluate alternative workflows for newly structured call centeroperations.
Shipment consolidation: Schneider’s internally developed opti-mization engine for shipment planning, consolidation and routinghas been continually upgraded over the last 10 years as software andhardware capabilities have advanced. As originally conceived, thesystem relied primarily on simulated annealing and a palette of localsearch heuristics. The current version uses a novel combination ofconstraint programming and integer programming to provide opti-mal solutions for most problems and near-optimal solutions for theremaining, largest problems.
PartnershipsA KEY COMPONENT in the success of O.R. at Schneider has
been an organizational willingness to invest in applied research, aswell as projects specifically focused on delivering near-term businessbenefits. In addition to internally staffed activities, the group isactively engaged in joint projects with several leading universitiesand with domain-specific external consultants. Among current aca-demic relationships are projects to improve inter-modal schedulingand dray optimization (University of Wisconsin-Madison), toexplore the use of control-theory techniques to better understandand address network stability and flow balance (Michigan Techno-logical Institute), and the development of a large-scale transporta-tion network simulator, based on approximate dynamic program-ming, to evaluate the effect of operating policies, resource allocationmodels and revenue management strategies (Princeton University).
Recently completed projects include development of a short-haulschedule and route optimizer utilizing column-generation schemes(Georgia Institute of Technology) and studies of driver behaviorand preferences (University of Minnesota-Morris).
Perspectives on Success SCHNEIDER’S USE OF O.R. began more than 25 years ago.
Over the subsequent decades, Schneider’s O.R. applications havegrown more sophisticated and diverse, taking advantage of techno-logical advances and responding to growth and expansion ofSchneider’s business portfolio. In addition to providing the organi-zation and its customers with a competitive edge through well-informed decision-making, the use of O.R. has made positivecontributions to Schneider’s bottom line: Annual earnings haveincreased by more than $10 million.
Success through O.R. does not come overnight, nor does itoccur in a vacuum. Keys to the long-running success of theO.R. effort at Schneider are:• Commitment of time, resources and leadership to
mentoring and training, both technical and soft skills.• Commitment of dedicated resources to the development
and maintenance of productivity tools.• Adopting a philosophy of high bandwidth interaction with
customers. This takes two forms: enabling non-engineeringbusiness associates to take on lower-level engineering tasksand moving engineers into business leadership roles.
• The vigilant search for new opportunities and applicationareas for O.R. This helps keep the staff fresh and motivatedand helps condition the business to realize the broad rangeof areas where O.R. can deliver value. The complexities ofmoving and managing freight throughout an internationalsupply chain continue to surface in today’s global economy.For global supply chain service providers like SchneiderNational, O.R. will continue to play a significant and lastingrole in managing those complexities, mitigating risks andultimately delivering the type of service, visibility andreliability customers require. ❙ANALYTICS
Ted Gifford ([email protected]) is the vice president ofEngineering and Research at Schneider National. Schneider won the2006 INFORMS Prize for its “effective integration of operationsresearch into organizational decision-making.”
ROUNDTABLE PROFILES

For a FREE trial visit www.xlminer.com
XLMiner is a Cytel product distributed by Resampling Stats Inc.
� Partitioninginto training,validation, andtest data sets
� Sampling from& scoring todatabases
� Binning & cate-gorical datatransformation
� Missing data
� Multiple linearregression withsubset selection
� Logisticregression withsubset selection
� Discriminantanalysis
� Naïve Bayesclassification
� Classificationand regressiontrees
� K-nearest-neighbors
� Neural nets
� Associationrules
� Principalcomponents
� Clustering (K-means &hierarchical)
� Time Series
XLMiner offers classification, prediction,affinity analysis, data exploration, datareduction, and graphics. It was developedby Cytel Software Corp. (world leaders insoftware for exact statistical methods), andcombines Cytel’s advanced, reliable algorithms(implemented as DLL’s that do not dependon Excel’s statistical routines) with Excel’sfamiliar interface and workspace.
XLMiner's Education Edition, in use atYale, MIT, Georgetown, Univ. of Chicago,Indiana, Maryland, Pepperdine, Fordham,Temple, UConn, Univ. de los Andes, Universitadi Pavia, Katholieke Hogeschool Leuven,and elsewhere, is highly affordable, eitheras individual student purchase or class license.
Come see XLMiner at INFORMS
The Most Comprehensive and Affordable Set of Data Mining Tools Available Anywhere
Resampling Stats Inc.612 N. Jackson Street, Arlington, VA 22201
tel: 703-522-2713 [email protected]
� Fidelity Investments� Blackstone Group� Lockheed Martin� U.S. Army� Daimler Chrysler� Boston Celtics� Experian� VNU Business
Publications� Centers for Disease
Control
� Bell Atlantic Services� Pitney Bowes� Consumer Credit
Counseling� Monsanto� ExxonMobil� FDA� NIST� ACNielsen, Dubai� Gillette, UK� SEB Merchant Banking
Organizations that use XLMiner include:
The premier site for employers and recruiters
searching for professionals in the fields of
operations research, management science and
the related information and decision sciences.
Employment Advertising at
WWW.ORMS-TODAY.COM

REGISTER NOW TO RECEIVE A FREE SUBSCRIPTION TO ANALYTICS:http://analytics.informs.org
50
The junior O.R. analyst was troubled andfrustrated. “I just don’t see why this modelisn’t tracking right,” he sputtered.“I’ve beenover the code carefully, half a dozen times. Iran some test cases that came out right. Butsome of the data points we’re trying to fore-cast in the holdout sample are just way off.There don’t appear to be coding errors inthe data, either – I’ve gone back and checkedthe bad points against source documents.Help, Carl! What more can I do?”
“Well, let’s see, Bob,” the older analystsaid soothingly. “You’re trying to modelloan behavior, right? And your ‘bad’ datapoints are loans that did much better orworse than expected?”
Bob nodded.“Then it’s probably not a mathematical
error,” Carl told him. “More likely there’ssome simplifying assumption, one you did-n’t even realize you’d made, that is violatedin these few cases. And are the bad pointsrelated in time, somehow?”
“I’m not sure,” Bob admitted. “Wegroup them by cohorts, sets of loans thatwere made at the same time. The problemsoccur at different times since origination.”
“Aha,” Carl responded,“but that meansthey could be at the same time, couldn’tthey?” Bob looked confused.
“I saw this in a military manpowermodel I worked on several years ago,” Carlexplained. “We’d see these sets of similarmisfits in different cohorts. But after a whilewe figured out that an error in month 24since they joined for a group of people whojoined in, say, May 1996, and an error inmonth 23 for a group that joined in June1996, and so on, were really simultaneous.We’d go back and ask the sergeant majorwhat had happened in that month, and italways turned out he’d say, ‘Oh! That’s themonth we announced such-and-such achange in the bonus program.’ What we’dseen as a complicated modeling issue reallywas an event we didn’t know about, affect-ing whole sets of people at the same time inthe same way. I’ll bet your problems in your
loan analyzer are alsocoming from eventsyou didn’t knowabout, like changes inthe loan programsthat were offered.”
“I’ll check,” Bobaffirmed, but he stilllooked dubious.
“This sort of thing is more commonthan you realize,” Carl added. “A fewyears ago, I got to hear a seminar byDennis Cook, who’s famous for one ofthe best books on applied regressionanalysis. He said he’d discovered, afteryears of work, that what looked like acomplicated model often turned out tobe a mixture of subpopulations, eachwith a simple model. The real, underly-ing trouble was that some analyst haddecided to consider the whole popula-tion as more or less alike, and didn’trealize there was this mixing going on.”
Now Bob was getting excited. “Howcome, with all the stuff that’s been writ-ten out there about statistical analysis,this sort of thing isn’t mentioned moreoften?” he asked.
“Oh, it is out there in the literature,”Carlsaid, “although admittedly not as often asthe newest and fanciest new technical add-ons to help build those more complicatedmodels. But people often don’t see thatthey’ve overlooked something simple – andit’s hard to admit to a client when you findout that’s what you’ve done! And then, ofcourse, there’s the additional problem ofanalysis plans.”
Bob looked puzzled again. “What doanalysis plans have to do with it?” heinquired.
“That’s where the hidden assumptionsget set in concrete,” Carl replied. “Mostclients and bosses want a plan of analysisfirst, before you’ve had any chance to seewhat the data really look like. So it’s easy tofall into the trap of planning, let’s say, linearregressions, and then find out the data vio-
late some of the assumptions of the tech-nique you intended to use. They’re not lin-ear, or they have relationships you didn’texpect among variables that are supposedto be independent, or they’re discrete whenyou need them to be continuous. And tryexplaining that sort of thing to a client!
“Napoleon wrote, ‘No plan of battleever survives the first contact with theenemy,’” Carl concluded. “From myexperience I’d add: No plan of analysisever survives the first contact with thedata.”
“I won’t argue,” Bob agreed, “from myown experience. But what can you do?”
Carl suggested, “Write your plan tostart with an exploratory stage, whereyou’ve proposed some techniquesdepending on what the data will sup-port, and your first step is to determinewhether the data are what you expectedand whether they fit the assumptions ofthe technique you wanted to use. Yournext step, as you can probably guess,usually is to come up with differentways to analyze, depending on whatnasty surprises you got. Build in somesteps of going back and verifyingwhether important events have been leftout and need to be included – like thechanges in bonus programs in the man-power model. And, of course, don’tforget the most important – and leastoften stated – assumption in any analyt-ical modeling method.”
“What’s that?” Bob asked.Carl smiled and said,“The assumption
that the future will be like the past. If whathappens next isn’t, in the ways that count,pretty much like what you saw before andanalyzed, you have no chance of getting itright, no matter what analytical methodyou use.” ❙ANALYTICS
Doug Samuelson is president of InfoLogix,Inc., a consulting firm in Annandale, Va.,specializing in analysis of complex systems.
Napo l eon ’ sPa r ab l e
B Y D O U G S A M U E L S O N
O R A C L E
A N A L Y T I C S
nalysis plans: the place
where hidden assumptions
get set in concrete.A

Now available in MultiLingual Edition — 4 interchangeable languages! Download a FREE trial copy at www.statgraphics.com
There’s statgraphics®
…
then there is
EVERYTHING else.
Refine Processes.
Enhance Performance.
Improve Quality.
Increase Profit.©2007 StatPoint, Inc.
STATGRAPHICS is a registered trademark of StatPoint, Inc.STATGRAPHICS Centurion is a trademark of StatPoint, Inc.
Choose the software that lets you create TRUE QUALITY… CHOOSE statgraphics®
Think you are using the best
statistical software because it calls
itself the leader?
Think Again.
The most widely used product is not always
the superior one. It may simply have a
bigger advertising budget.
At StatPoint, we produce a superior
product, not superior hype. So our
software is superior, not our ad budget.
lets
you perform advanced
routines effortlessly,
without sacrificing
reliability. It gives you
functionality absent in
other stat programs.

A N A L Y T I C S52 REGISTER NOW TO RECEIVE A FREE SUBSCRIPTION TO ANALYTICS:http://analytics.informs.org
R E F E R E N C E S
1. Frye, C., “Business Rules are Back,” Application
Development Trends, July 2002. See also
http://www.adtmag.com/article.asp?id=6492.
Businesses devote tremendous effort tomanaging rules. Whether the rules dictatepayment terms under a contract or compli-ance with government regulations, rules arean important part of running a business.
Software for managing rules has re-emerged in the market of late following a“near death experience” [1]. Originallyknown as expert systems and later knowl-edge-based systems, the term “businessrules engines” has gained favor in recentyears as vendors seek to capitalize on mar-ket opportunities.
Business rules engines are certainly agood approach to automating rules ofcompliance such as billing procedures, butare they an appropriate framework fordecision-making? Consider a company sell-ing travel packages over the Web. A visitorto the company’s Web site might click on“warm weather deals” and be taken to apage that lists Caribbean destinations. Rulesof this nature go beyond compliance to thevery foundation of the sales process. ShouldCaribbean or desert destinations be dis-played? Both? What options? By analyzingthe continuous flow of information on howcustomers purchase, a company can adjustits actions to better achieve sales goals. In anutshell, this is the e-sales promise of ana-lytics/operations research.
Analytics and rules offer very differentconceptual approaches to e-sales. Whilethey are not altogether contradictory per-spectives, the practical reality is that theyevolved from different roots on differentpaths. As operations researchers, we appre-ciate the power of analytics as embodied inmodels, algorithms and data analysis. Butrules constitute a view of the world manykey decision-makers are more comfortablewith; a world in which decisions are madeand then executed. Attractive as businessrules may appear, many hidden problemsare often overlooked when adopting abusiness rules framework. Among theproblems:
• Adopting a business rulesframework postpones the difficulttask of making decisions. Businessrules engines provide a means bywhich to implement rules. It is easyto be enticed by a business rulesengine’s ability to implement rulesonly to find that when it is deployedthe question of what rules toimplement still remains. Withoutsupporting analytics, a business rulesengine represents a means by whichto make poor decisions far morequickly and efficiently. Off-lineanalytics can be performed to helpwrite the rules, but this circumventsthe real-time potential of the e-commerce model.
• Performance measurement isdifficult in a business rulesframework. Businesses are adamantabout justifying projects based ontheir return-on-investment. Since thevalue proposition of business rulesengines is implementing rules, theirreturn-on-investment is implicit –streamlining processes or providing amechanism to apply rules moreefficiently (again, sidestepping thevalue of the rules themselves).Systems based on analytics aredesigned from the outset to monitorrevenue improvement againstbaseline metrics.
• Business rules proliferate. With apowerful tool in hand, it is easy forbusiness users to create new rules,causing the list of rules to grow everlarger and more complex. Eventually itbecomes difficult to determine if therules are doing what they are intendedto do. When instances are discoveredwhere rules are not leading to expectedresults, the response is typically to addmore rules.
• Business rules can impede analyticalinquiry. Analytical approaches to e-sales derive their value from inferringfuture customer behavior. Theseinferences are more dependable whenoffers are made in a way that lendsitself to analysis, specifically, limitingthe type of offers in order to developstatistically significant conclusions.Business rules engines generate a webof offers that often make it difficult toinfer what caused a customer tobehave in a particular way: if A then Bunless C except when D, in whichcase perform F until G or H.
• Suboptimal legacy practices areeasily institutionalized. An earlyselling point of expert systems wasthe ability to automate the decisionprocesses of human experts. If theseprocesses can be improved upon byanalytics, then business rules enginesonly serve to institutionalizesuboptimal legacy practices.
The growth of the Internet is providing arare opportunity to fundamentally rethinkhow we sell. By understanding what cus-tomers want and responding accordingly,higher sales and customer satisfaction canbe achieved. While analytics and rules bothhave their place, decision processes withdemonstrable value require an analyticalfoundation. Realizing the full potential ofthe Internet as a sales channel requires thedynamic application of analytical tools.
As systems for driving e-sales evolve, it isimportant that we remain sensitive to deci-sion-makers’ comfort with rules. But it isalso important that we provide the intellec-tual leadership necessary for analytics toflourish at this critical period in the evolu-tion of commerce. ❙ANALYTICS
E. Andrew Boyd is chief scientist and seniorvice president of science and research atPROS Revenue Management,www.prosrm.com. He received his Ph.D. inoperations research from MIT in 1987 andcan be reached at [email protected].
Should Analyt ics orRules Drive e-Sales?
B Y A N D R E W B O Y D
L A S T W O R D


The Excel Solver’s Big Brother Gives You Optimization Technology You Can’t Get Anywhere Else – at Any Price.
Use all the modern technologies for optimization of uncertain models – in one unified modeling framework. Easily define chance constraints and recourse decision variables. Automatically diagnose your model type, and apply robust optimization, stochastic linear programming and simulation optimization using our twelve Solver Engines.
More Power than the Best Algebraic Modeling Languages.
Save time building stochastic and deterministic models, with automatic detection of model linearity, convexity and sparsity, automatic linearization of IF and conditional expressions, automatic differentiation of nonlinear models, and easy definition of integer, semicontinuous, alldifferent and conic decision variables.
More Capacity and Speed for Industrial Strength Models.
Solve LP models up to millions of variables. Solve your toughestLP/MIP models with XpressMP, SOCP models with MOSEK, huge nonlinear models with KNITRO, non-smooth models with OptQuest, and much more.
The Most Powerful Technologies – Made Easy to Use.
Models that once required huge budgets, teams of experts, and months of effort can now be created and solved with the PSP in Excel by smart business users – even your MBA students. Shouldn’t you be on board?
Premium Solver Platform, XpressMP, MOSEK, KNITRO, and OptQuest are trademarks owned by their respective vendors.
Download a Free Trial at www.solver.com.Download a FREE trial version (limited to 15 days) of Premium Solver Platform V8.0 Stochastic Edition from our Website. Ask us about academic pricing, upgrades, support contracts, and flexible licensing for deployment.
OPTIMIZE UNCERTAIN MODELS with
PREMIUM SOLVER PLATFORM
The Leader in Spreadsheet Optimization
ROBUST OPTIMIZATION, STOCHASTIC PROGRAMMING,AND SIMULATION OPTIMIZATION MADE EASY TO USE
Frontline Systems Inc.
Tel 775 831 0300 • Fax 775 831 0314 • [email protected]