Spreadsheet Engineering ⋆ - Domain specific languages
71
Lecture Notes on Spreadsheet Engineering ? Domain Specific Languages Summer School Cluj - Romania, July 2013 J´ acome Cunha 1, 2 , Jo˜ ao Paulo Fernandes 1, 3 , and Jo˜ ao Saraiva 1 1 High-Assurance Software Laboratory (HASLab/INESC TEC) & Universidade do Minho, Portugal {jacome,jpaulo,jas}@di.uminho.pt 2 CIICESI, ESTGF, Instituto Polit´ ecnico do Porto, Portugal [email protected] 3 Reliable and Secure Computation Group ((rel)ease), Universidade da Beira Interior, Portugal [email protected] Abstract. This tutorial notes presents techniques for spreadsheet engi- neering. First, data mining and database techniques are used to reason about spreadsheet data. These techniques are used to compute relation- ships between spreadsheet elements (cells/columns/rows), which are then used to infer a model defining the business logic of the spreadsheet. Such a model of a spreadsheet data is the building block to define techniques for model-driven spreadsheet development techniques. Thus, model-driven engineering approaches are used to allow spreadsheet users to introduce correct data - by suing the model-instance conformance relation - and to allow the evolution of model and the automatically co-evolution of the spreadsheet data. Data refinement and bidirectional techniques are used to synchronize the models and instances after a user updates on of the software artifacts. These notes briefly describes a model-driven spreadsheet environment, the MDSheet environment, that implements the presented techniques. To evaluate the proposed techniques and the MDSheet environment we have conducted an empirical study with real spreadsheet users. The results of this study are presented in these notes and show that a model-driven engineering techniques do improve users productivity. ? This work is part funded by ERDF - European Regional Development Fund through the COMPETE Programme (operational programme for competitive- ness) and by National Funds through the FCT - Funda¸ c˜ ao para a Ciˆ encia e a Tecnologia (Portuguese Foundation for Science and Technology) within projects FCOMP-01-0124-FEDER-010048, and FCOMP-01-0124-FEDER-022701. The two first authors were funded by FCT grants SFRH/BPD/73358/2010, and SFRH/BPD/46987/ 2008, respectively.
Transcript of Spreadsheet Engineering ⋆ - Domain specific languages

Lecture Notes on
Spreadsheet Engineering ?
Domain Specific Languages Summer School
Cluj - Romania, July 2013
Jacome Cunha1,2, Joao Paulo Fernandes1,3, and Joao Saraiva1
1 High-Assurance Software Laboratory (HASLab/INESC TEC) &Universidade do Minho, Portugal{jacome,jpaulo,jas}@di.uminho.pt
2 CIICESI, ESTGF, Instituto Politecnico do Porto, [email protected]
3 Reliable and Secure Computation Group ((rel)ease),Universidade da Beira Interior, Portugal
Abstract. This tutorial notes presents techniques for spreadsheet engi-neering. First, data mining and database techniques are used to reasonabout spreadsheet data. These techniques are used to compute relation-ships between spreadsheet elements (cells/columns/rows), which are thenused to infer a model defining the business logic of the spreadsheet. Such amodel of a spreadsheet data is the building block to define techniques formodel-driven spreadsheet development techniques. Thus, model-drivenengineering approaches are used to allow spreadsheet users to introducecorrect data - by suing the model-instance conformance relation - and toallow the evolution of model and the automatically co-evolution of thespreadsheet data. Data refinement and bidirectional techniques are usedto synchronize the models and instances after a user updates on of thesoftware artifacts.These notes briefly describes a model-driven spreadsheet environment,the MDSheet environment, that implements the presented techniques. Toevaluate the proposed techniques and the MDSheet environment we haveconducted an empirical study with real spreadsheet users. The results ofthis study are presented in these notes and show that a model-drivenengineering techniques do improve users productivity.
? This work is part funded by ERDF - European Regional Development Fundthrough the COMPETE Programme (operational programme for competitive-ness) and by National Funds through the FCT - Fundacao para a Ciencia e aTecnologia (Portuguese Foundation for Science and Technology) within projectsFCOMP-01-0124-FEDER-010048, and FCOMP-01-0124-FEDER-022701. The two firstauthors were funded by FCT grants SFRH/BPD/73358/2010, and SFRH/BPD/46987/
2008, respectively.


Table of Contents
Lecture Notes on Spreadsheet Engineering Domain SpecificLanguages Summer School Cluj - Romania, July 2013 . . . . . . . . 1
Jacome Cunha,, Joao Paulo Fernandes,, and Joao Saraiva1 Spreadsheets: A History of Success? . . . . . . . . . . . . . . . . . . . . . . . . . . . . . . 1
1.1 History of Spreadsheets . . . . . . . . . . . . . . . . . . . . . . . . . . . . . . . . . . . . 11.2 The Horror Stories . . . . . . . . . . . . . . . . . . . . . . . . . . . . . . . . . . . . . . . . 4
2 Spreadsheet Analysis . . . . . . . . . . . . . . . . . . . . . . . . . . . . . . . . . . . . . . . . . . . 62.1 Spreadsheet Data Mining . . . . . . . . . . . . . . . . . . . . . . . . . . . . . . . . . . . 62.2 Databases Technology . . . . . . . . . . . . . . . . . . . . . . . . . . . . . . . . . . . . . . 72.3 Programming Languages Technologies . . . . . . . . . . . . . . . . . . . . . . . 11
3 Model-driven Spreadsheet Engineering . . . . . . . . . . . . . . . . . . . . . . . . . . . . 133.1 Spreadsheet Models . . . . . . . . . . . . . . . . . . . . . . . . . . . . . . . . . . . . . . . . 133.2 Inferring Spreadsheet Models . . . . . . . . . . . . . . . . . . . . . . . . . . . . . . . 173.3 Mapping Strategy . . . . . . . . . . . . . . . . . . . . . . . . . . . . . . . . . . . . . . . . . 223.4 Generation of Model-driven Spreadsheets . . . . . . . . . . . . . . . . . . . . . 233.5 Embedding ClassSheet Models in SpreadSheets . . . . . . . . . . . . . . . 25
4 Evolution of Model-driven Spreadsheets . . . . . . . . . . . . . . . . . . . . . . . . . . . 294.1 Model Evolution and Data Co-Evolution . . . . . . . . . . . . . . . . . . . . . 294.2 A Framework for Evolution of Spreadsheets in Haskell . . . . . . . . . 30
5 Bidirectional Evolution of Model-driven Spreadsheets . . . . . . . . . . . . . . . 415.1 The MDSheet Framework . . . . . . . . . . . . . . . . . . . . . . . . . . . . . . . . . . 435.2 Specification of Spreadsheets and Models . . . . . . . . . . . . . . . . . . . . . 435.3 Operations on Spreadsheet Instances . . . . . . . . . . . . . . . . . . . . . . . . . 445.4 Operations on Models . . . . . . . . . . . . . . . . . . . . . . . . . . . . . . . . . . . . . . 465.5 Bidirectional Transformation Functions . . . . . . . . . . . . . . . . . . . . . . 475.6 Bidirectional Transformation Properties . . . . . . . . . . . . . . . . . . . . . . 49
6 Model-Driven Spreadsheet Development in MDSheet . . . . . . . . . . . . . . . 507 Model-driven Spreadsheets: An Empirical Study . . . . . . . . . . . . . . . . . . . 52
7.1 Design . . . . . . . . . . . . . . . . . . . . . . . . . . . . . . . . . . . . . . . . . . . . . . . . . . . 527.2 Execution . . . . . . . . . . . . . . . . . . . . . . . . . . . . . . . . . . . . . . . . . . . . . . . . 557.3 Analysis . . . . . . . . . . . . . . . . . . . . . . . . . . . . . . . . . . . . . . . . . . . . . . . . . . 567.4 Interpretation . . . . . . . . . . . . . . . . . . . . . . . . . . . . . . . . . . . . . . . . . . . . . 607.5 Discussion . . . . . . . . . . . . . . . . . . . . . . . . . . . . . . . . . . . . . . . . . . . . . . . . 62
8 Conclusion . . . . . . . . . . . . . . . . . . . . . . . . . . . . . . . . . . . . . . . . . . . . . . . . . . . . 63
Acknowledgements . . . . . . . . . . . . . . . . . . . . . . . . . . . . . . . . . . . . . . . . . . . . . . . 63


1. SPREADSHEETS: A HISTORY OF SUCCESS?
1 Spreadsheets: A History of Success?
1.1 History of Spreadsheets
The use of a tabular-like strucuture to organize data has been used for manyyears. A good example of structuring data in this way is the Plimpton 322tablet (figure 1), dated from around 1800 BC [59]. The Plimpton 322 tablet isan example of a table containing four columns and fifteen rows with numericaldata. For each column there is a descriptive header, and the fourth columncontains a numbering of the rows from one to fifteen, written in the Babyloniannumber system. This tablet contains Pythagorean triples [12], but was morelikely built as a list of regular reciprocal pairs [59].
Fig. 1: Plimpton 322 – a tablet from around 1800 BC.4
A tabular layout allows a systematic analysis of the information displayedand it helps to structure values in order to perform calculations.
Spreadsheets have been used for years, manually, long before the computerwas invented. Acutally, The term spreadsheet originated before computers fromthe use of tables that were spread across two pages (e.g., records in a ledger).This term came to mean table of data arranged in columns and rows often usedin business and financial applications [61]. Accountants used a spreadsheet orworksheet to prepare their budgets and other tasks. The accountants would usea pencil and paper with columns and rows. They would place the accounts in one
3 A good explanation of the Plimpton 322 tablet is available at Bill Casselman’swebpage http://www.math.ubc.ca/~cass/courses/m446-03/pl322/pl322.html
1

1. SPREADSHEETS: A HISTORY OF SUCCESS?
column, the corresponding amount in the next column, etc. Then they wouldmanually total the columns and rows, as in the example shown in Figure 2.
Fig. 2: A hand-written budget spreadhseet
This works fine, except when the accountant needs to make a change to oneof the numbers. This change would result in having to recalculate, by hand,several different totals!
Thee benefits make (paper) tables applicable to a great variety of domains,like for example on student inquiries or exams, taxes submission, gathering andanalysis of sport statistics, or any purpose that requires input of data and/orperforming calculations. An example of such a table used by students is themultiplication table as displayed in figure 3.
Fig. 3: Paper spreadsheet for a multiplication table.
This spreadsheet has eleven columns and eleven rows, where the first row/columnwork as a header to identify the information, and the actual results of the mul-tiplication table are shown in the other cells of the table.
Tabular layouts are also common in games. The chess game is a good exampleof a tabular layout game as displayed in figure 4.
Electronic Spreadsheets In 1979, VisiCal [11] was realeased together withthe popular Apple personal computer the Apple II microcomputer. VisiCal not
2

1. SPREADSHEETS: A HISTORY OF SUCCESS?
8rmblkans7opopopop60Z0Z0Z0Z5Z0Z0Z0Z040Z0Z0Z0Z3Z0Z0Z0Z02POPOPOPO1SNAQJBMR
a b c d e f g h
Fig. 4: Chess boards have a tabular layout, with letters identifying columns andnumbers identifying rows.
only made spreadsheets available to a wider audience, but also led to make per-sonal computers more popular by introducing them to the financial and businesscommunities and others. VisiCal consisted of a column/row tabulation programwith an WYSIWYG interface. It provided cell references (format A1, A3..A6;very similar with the one used for chess boards as the one depicted in Figure 4)and instant automatic recalculation of formulas, among other novel features stillpresent in current spreadsheet host systems.
After VisiCal, many commercial spreadsheet systems were developed for per-sonal computers, like Lotus 123 (wich became very popular when MS-DOS wasthe PC operating system of choice) and Microsoft Excel5 that is the referencespreadsheet system today. In the mid eighties the free software movement startedand soon free open source alternatives can be used, namely Gnumeric6, OpenOf-fice Calc7 and derivatives like LibreOffice Calc8.
More recently, web/cloud-based spreadsheet host systems have been devel-oped, e.g., Google Drive9, Microsoft Office 36510, and ZoHo Sheet11 which aremaking spreadsheets available in different type of mobile devices (from laptops,to tablets and mobile phones!). These systems are not dependent on any par-ticular operating system, allow to create and edit spreadsheets in an onlinecollaborative environment, and provide import/export of spreadsheet files foroffline use.
5 Microsoft Excel: http://office.microsoft.com/en-us/excel/6 Gnumeric: http://projects.gnome.org/gnumeric/7 OpenOffice: http://www.openoffice.org8 LibreOffice: http://www.libreoffice.org9 Google Drive: http://drive.google.com
10 Microsoft Office 365: http://www.microsoft.com/en-us/office365/
online-software.aspx11 ZoHo Sheet: http://sheet.zoho.com/
3

1. SPREADSHEETS: A HISTORY OF SUCCESS?
In fact, spreadsheet systems have evolved into powerful systems. However, thebasic features provided by spreadsheet host systems remain roughly the same:
– a spreadsheet is a tabular structure composed by cells, where the columnsare referenced by letters and the rows by numbers;
– cells can contain either values or formulas;– formulas can have references for other cells (e.g., A1 for the individual cell
in column A and row 1 or A3:B5 for the range of cells starting in cell A3 andending in cell B5);
– instant automatic recalculation of formulas when cells are modified;– ease to copy/paste values, with references being updated automatically.
Spreadsheets are a relevant research topic, as they play a pivotal role in mod-ern society. Indeed, they are inherently multi-purpose and widely used both byindividuals to cope with simple needs as well as by large companies as integra-tors of complex systems and as support for business decisions [40]. Also, theirpopularity is still growing, with an almost impossible to estimate but stagger-ing number of spreadsheets created every year. Spreadsheet popularity is due tocharacteristics such as their low entry barrier, their availability on almost anycomputer and their simple visual interface. In fact, being a conventional lan-guage that is understood by both professional programmers and end users [51],spreadsheets are many times used as bridges between these two communitieswhich often face communication problems. Ultimately, spreadsheets seem to hitthe sweet spot between flexibility and expressiveness.
Spreadsheets have probably passed the point of no return in terms of impor-tance. There are several studies that show the success of spreadsheets:
– it is estimated that 95% of all U.S. firms use them for financial reporting [55],– it is also known that 90% of all analysts in industry perform calculations in
spreadsheets [55]– finally, studies show that 50% of all spreadsheets are the basis for deci-
sions [40].
This importance, however, has not been achieved together with effectivemechanisms for error prevention, as shown by several studies [54,56].
1.2 The Horror Stories
Spreadsheets are known to be error-prone. This claim is supported also by thelong list of real problems that were blaimed on spreadsheets, which is compiledand available at the European Spreadsheet Risk Interest Group (EuSpRIG) website12. Next, we show several stories that caused social impact on people asreported by relevant media.
– 2012 Olimpic Games Ticket Error!
12 This list of horror stories is available at: http://www.eusprig.org/
horror-stories.htm
4

1. SPREADSHEETS: A HISTORY OF SUCCESS?
London 2012 Olympics: lucky few to get 100m final tickets aftersynchronised swimming was overbooked by 10,000
Around 200 people who thought their only experience of the London 2012Olympic Games would be minor heats of synchronised swimming have re-ceived an unexpected upgrade to the men’s 100m final following an embar-rassing ticketing mistake.
...
Locog said the error occurred in the summer, between the first and secondround of ticket sales, when a member of staff made a single keystrokemistake and entered ‘20,000’ into a spreadsheet rather than the correctfigure of 10,000 remaining tickets.
The Telegraph, 04 January 201213
– European Union Debt Policy
In a 2010 paper* Carmen Reinhart, now a professor at Harvard KennedySchool, and Kenneth Rogoff, an economist at Harvard University...arguedthat GDP growth slows to a snail’s pace once government-debt levels ex-ceed 90% of GDP. The 90% figure quickly became ammunition in politicalarguments over austerity...This week a new piece of research poured fuelon the fire by calling the 90% finding into question.
The Economist, 17 April 201314
Harvard University economists Carmen Reinhart and Kenneth Rogoff haveacknowledged making a spreadsheet calculation mistake in a 2010 researchpaper, “Growth in a Time of Debt”, which has been widely cited to justifybudget-cutting.
Business Week, 18 April 201315
– Envelope 9 : Privat Information Revealed
Perante os deputados, Souto Moura relembrou o dia em que o jornal 24Horas divulgou a existencia de uma listagem de chamadas de titulares dealtos cargos de Estado, constantes de disquetes anexas ao processo CasaPia . ’Foi um dia que nunca esquecerei, foi terrıvel, dramatico’, susten-tou o agora juiz-conselheiro do Supremo Tribunal de Justica. Nesse dia(13 de janeiro de 2006), diz ter chamado a PGR os procuradores JoaoGuerra e as procuradoras adjuntas Paula Ferraz e Cristina Faleiro. Vistasas disquetes - com o programa Excel, que continha um filtro informaticoque ocultava parte da informacao -, a conclusao foi que nao haveria nadanaquele suporte para alem das listagens de Paulo Pedroso. ’Aqui so hanumeros do dr. Paulo Pedroso’ foi a conclusao do visionamento.
Diario de Notıcias, 10 February 200716
13 news available at http://www.telegraph.co.uk/sport/olympics/8992490/
London-2012-Olympics-lucky-few-to-get-100m-final-tickets-after-synchronised-swimming-was-overbooked-by-10000.
html14 news available at http://www.economist.com/blogs/freeexchange/2013/04/
debt-and-growth15 news available at http://www.businessweek.com/articles/2013-04-18/
faq-reinhart-rogoff-and-the-excel-error-that-changed-history16 news available at http://www.dn.pt/especiais/interior.aspx?content_id=
1611088\&especial=Casa\%20Pia\&seccao=SOCIEDADE
5

2. SPREADSHEET ANALYSIS
2 Spreadsheet Analysis
Spreadsheets, like other software systems, usually start as simple, single usersoftware systems and rapidly evolve into complex and large systems developedby several users. Such spreadsheets become hard to maintain and evolve becauseof the large amount of data they contain, the complex dependencies and formulasused (that very often are poor documented), and finally because the developersof those spreadsheets may not be available (because they may have left thecompany/project). In these cases to understand the business logic defined insuch legacy spreadsheets is a hard and time consuming task.
In this section we study techniques to analyze spreadsheet data using tech-niques from both database and programming languages technology. Databasetechnology is used to mine the spreadsheet data in order to automatically com-pute a model describing the business logic of the underlying spreadsheet data.Programming languages techniques are used to detect bad smells in spreadsheets.
2.1 Spreadsheet Data Mining
Before we present these techniques, let us consider the example spreadsheetmodeling an airline scheduling system which we adapted from [49] and illustratedin Figure 5.
Fig. 5: A spreadsheet representing pilots, planes and flights.
The labels in the first row have the following meaning: PilotID representsa unique identification code for each pilot, Pilot-Name is the name of the pi-lot, and column labeled Phone contains his phone number. Columns labeledDepart and Destination contain the departure and destination airports, re-spectively. The column Date contains the date of the flight and hours definesthe number of hours of the flight. Next columns define the plain used in theflight: N-Number is a unique number of the plain, Mode is the model of theplane, and Plane-Name is the name of the plane.
This spreadsheet defines a valid model to represent the information for schedul-ing flights. However, it contains redundant information. For example, the dis-played data specifies the name of the plane Magalhaes twice. This kind of re-dundancy makes the maintenance and update of the spreadsheet complex anderror-prone. In fact, two well-known database problems occur when organizingour data in a non-normalized way [65]:
6

2. SPREADSHEET ANALYSIS
– Update Anomalies: this problem occurs when we change information in onetuple but leave the same information unchanged in the others.In our example, this may happen if we change the property adress of propertynumber pg4 on row 4, but not on row 2. As a result the data will becomeinconsistent!
– Deletion Anomalies: problem happens when we delete some tuple and we loseother information as a side effect.For example, if we delete row 5 in the original spreadsheet all the informationconcerning property pg36 is eliminated.
As a result, a mistake is easily made, for example, by mistyping a name andthus corrupting the data. The same information can be stored without redun-dancy. In fact, in the database community, techniques for database normalizationare commonly used to minimize duplication of information and improve data in-tegrity. Database normalization is based on the detection and exploitation offunctional dependencies inherent in the data [49,66]
2.2 Databases Technology
In order to infer a model representing the business logic of a spreadsheet data,we need to analyze the data and define relationships between data entities. Ob-jects that are contained in a spreadsheet and the relationships between themare reflected by the presence of functional dependencies between spreadsheetcolumns. Informally, a functional dependency between a column C and anothercolumn C ′ means that the values in column C determine the values in columnC ′, that is, there are no two rows in the spreadsheet that have the same valuein column C but differ in their values in column C ′.
For instance, in our running example the functional dependency betweencolumn A (Pilot − Id) and column B (Pilot −Name) exists, meaning that theidentification number of a pilot determines its name. That is to say that, thereare no two rows with the same id number (column A), but differ in their names(column B). A similar functional dependency occurs between identifier (i.e., num-ber) of a plane N −Numver and its name Plane −Name.
This idea can be extended to multiple columns, that is, when any two rowsthat agree in the values of columns C1, . . . , Cn also agree in their value in columnsC ′
1, . . . , C′m, then C ′
1, . . . , C′m are said to be functionally dependent on C1, . . . , Cn.
In our running example, the following functional dependencies hold:
Depart ,Destination ⇀ Hours
stating that the departure and destination airports determines the numberof hours of the flight.
Definition 21 A functional dependency between two sets of attributes A andB, written A ⇀ B, holds in a table if for any two tuples t and t′ in that tablet[A] = t′[A] =⇒ t[B] = t′[B] where t[A] yields the (sub)tuple of values for the
7

2. SPREADSHEET ANALYSIS
attributes in A. In other words, if the tuples agree in the values for attribute setA, they agree in the values for attribute set B. The attribute set A is also calledantecedent, and the attribute set B consequent.
Let us returning to our running example, and we have the following func-tional dependencies:
Pilot Id ⇀ Pilot Name
N Number ⇀ Plane Name
Formulas define functional dependencies. It should be noticed that the lastfunctional dependency is induced by the formula =I2*K2*0.2, as describedin [27].
Our goal is to use the data in a spreadsheet to identify functional depen-dencies. Although we use all the data available in the spreadsheet, we considera particular instance of the spreadsheet domain only. However, there may ex-ist counter examples to the dependencies found, but these just happen not tobe included in the spreadsheet. Thus, the dependencies we discover are alwaysan approximation. On the other hand, depending on the data, it can happenthat many “accidental” functional dependencies are detected, that is, functionaldependencies that do not reflect the underlying model.
For instance, in our example we can identify the following dependency thatjust happens to be fulfilled for this particular data set, but that does certainlynot reflect a constraint that should hold in general: Model ⇀ Plane Name, thatis to say that the model of a plane determines its name! In fact, the data con-tained in the spreadsheet example supports over 30 functional dependencies.Here are a few more.
Pilot ID ⇀ Pilot Name
Pilot ID ⇀ Phone
Pilot ID ⇀ Pilot Name,Phone
Depart ,Destination ⇀ Hours
Hours ⇀ Model
Because spreadsheet data may induce too many functional dependencies, thenext step is therefore to filter out as many of the accidental dependencies as pos-sible and keep the ones that are indicative of the underlying model. The processof identifying the “valid” functional dependencies is, of course, ambiguous ingeneral. Therefore, we employ a series of heuristics for evaluating dependencies.
Note that several of these heuristics are possible only in the context of spread-sheets. This observation supports the contention that end-user software engi-neering can benefit greatly from the context information that is available in aspecific end-user programming domain. In the spreadsheet domain rich contextis provided, in particular, through the spatial arrangement of cells and throughlabels [32].
8
2. SPREADSHEET ANALYSIS
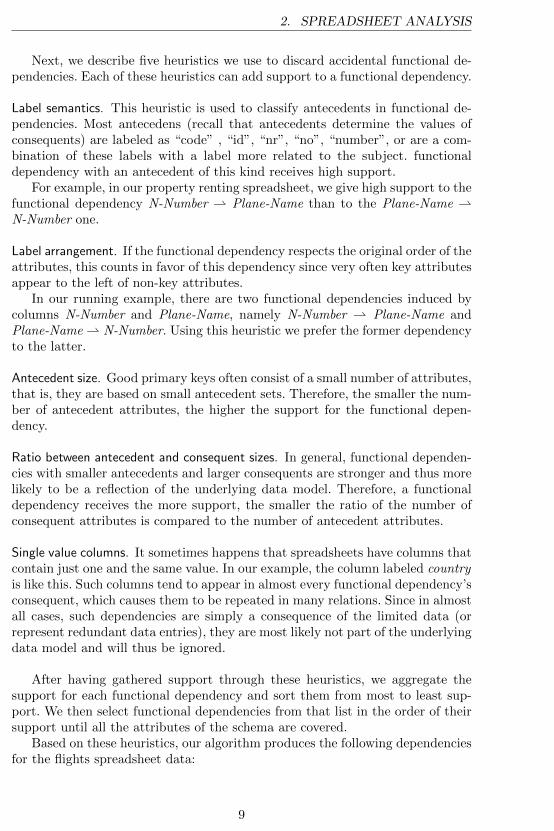
Next, we describe five heuristics we use to discard accidental functional de-pendencies. Each of these heuristics can add support to a functional dependency.
Label semantics. This heuristic is used to classify antecedents in functional de-pendencies. Most antecedens (recall that antecedents determine the values ofconsequents) are labeled as “code” , “id”, “nr”, “no”, “number”, or are a com-bination of these labels with a label more related to the subject. functionaldependency with an antecedent of this kind receives high support.
For example, in our property renting spreadsheet, we give high support to thefunctional dependency N-Number ⇀ Plane-Name than to the Plane-Name ⇀N-Number one.
Label arrangement. If the functional dependency respects the original order of theattributes, this counts in favor of this dependency since very often key attributesappear to the left of non-key attributes.
In our running example, there are two functional dependencies induced bycolumns N-Number and Plane-Name, namely N-Number ⇀ Plane-Name andPlane-Name ⇀ N-Number. Using this heuristic we prefer the former dependencyto the latter.
Antecedent size. Good primary keys often consist of a small number of attributes,that is, they are based on small antecedent sets. Therefore, the smaller the num-ber of antecedent attributes, the higher the support for the functional depen-dency.
Ratio between antecedent and consequent sizes. In general, functional dependen-cies with smaller antecedents and larger consequents are stronger and thus morelikely to be a reflection of the underlying data model. Therefore, a functionaldependency receives the more support, the smaller the ratio of the number ofconsequent attributes is compared to the number of antecedent attributes.
Single value columns. It sometimes happens that spreadsheets have columns thatcontain just one and the same value. In our example, the column labeled countryis like this. Such columns tend to appear in almost every functional dependency’sconsequent, which causes them to be repeated in many relations. Since in almostall cases, such dependencies are simply a consequence of the limited data (orrepresent redundant data entries), they are most likely not part of the underlyingdata model and will thus be ignored.
After having gathered support through these heuristics, we aggregate thesupport for each functional dependency and sort them from most to least sup-port. We then select functional dependencies from that list in the order of theirsupport until all the attributes of the schema are covered.
Based on these heuristics, our algorithm produces the following dependenciesfor the flights spreadsheet data:
9

2. SPREADSHEET ANALYSIS
Pilot ID ⇀ Pilot Name,PhoneN-Number ⇀ Model ,Plane NamePilot ID ,N-Number,Depart ,Destiantion,Date,Hours ⇀ ∅
Relational Model Knowledge about the functional dependencies in a spread-sheet provides the basis for identifying tables and their relationships in the data,which form the basis for defining models for spreadsheet. The more accurate wecan make this inference step, the better the inferred models will reflect the actualbusiness models.
It is possible to construct a relational model from a set of observed functionaldependencies. Such a model consists of a set of relation schemas (each givenby a set of column names) and expresses the basic business model present inthe spreadsheet. Each relation schema of such a model basically results fromgrouping functional dependencies together.
For example, for the spreadsheet in Figure 5 we could infer the followingrelational model (underlined column names indicate those columns on which theother columns are functionally dependent).
Pilots (Pilot Id, Pilot Name, Phone)Planes (N-Number, Model, Plane NameFlights (Pilot ID, N-Number, Depart, Destination, Date, Hours)
The model has three relations: Pilots stores information about pilots; Planescontains all the information about planes, and Flights stores the information onflights, that is, for a particular pilot, a specific number of a plane, it stores thedepart and destination airports and the data ans number of hours of the flights.
Note that several models could be created to represent this system. We willsee in Section ?? that the models our tool automatically generates are compa-rable in quality to the ones designed by database experts.
Although a relational model is very expressive, it is not quite suitable forspreadsheets since spreadsheets need to have a layout specification.
In contrast, the ClassSheet modeling framework offers high-level, object-oriented formal models to specify spreadsheets and thus present a promisingalternative [31].
ClassSheets allow users to express business object structures within a spread-sheet using concepts from the Unified Modeling Language (UML). A spreadsheetapplication consistent with the model can be automatically generated, and thusa large variety of errors can be prevented.
We therefore employ ClassSheet as the underlying modeling approach forspreadsheets and transform the inferred relational model into a ClassSheet model.
Exercises: give spreadsheets and ask for FDs, keys, tables, etc
Querying Google query data normalizationexamples from: (VL/HCC 2013 paper)
10

2. SPREADSHEET ANALYSIS
Exercises: define one or two queries.
2.3 Programming Languages Technologies
Code Smells The concept of code smell (or smell, for simplicity) was introducedby Martin Fowler as a first symptom that may correspond to a deeper problemin a system [37].
Firstly a smell is by definition something that’s quick to spot - or sniffable asI’ve recently put it. A long method is a good example of this - just looking atthe code and my nose twitches if I see more than a dozen lines of java.
The second is that smells don’t always indicate a problem. Some long methodsare just fine. You have to look deeper to see if there is an underlying problemthere - smells aren’t inherently bad on their own - they are often an indicatorof a problem rather than the problem themselves.
Martin Fowler, Code Smells17
Along with the definition of smell, Martin Fowler also proposed an initialcatalog of potential problems in the form of smells. Although this catalog wasoriginally defined for source code, the smells identified in it may sometimes beapplied to other artifacts, such as spreadsheets.
In fact, Fowler’s work inspired several authors to propose different catalogsof smells for spreadsheets. In the context of our work, we have taken the unionof all the proposed catalogs, obtaining the comprehensive list that we shownext. The first six smells in this list were proposed in [22, 23], and exploit, forexample, statistical properties of spreadsheet data in the same row/column. Thefollowing five smells have appeared in [41], and refer to smells that occur inspreadsheet formulas. Finally, the last four smells in this list deal with inter-worksheet smells [38].
– Standard Deviation: This smell detects, for a group of cells holding numericalvalues, the ones that do not follow their normal distribution.
– Empty Cell: Cells that are left empty but that occur in a context that suggeststhey should have been filled in are detected by this smell.
– Pattern Finder: This smell finds patterns in a spreadsheet such as a rowcontaining only numerical values except for one cell holding a label or aformula, or being empty.
– String Distance: Typographical errors are frequent when typing in a com-puter. In order to try to detect these type of errors in spreadsheets, this smellsignals string cells that differ minimally with respect to other surroundingcells.
– Reference to Empty Cells: The existence of formulas pointing to empty cells isa typical source of errors in spreadsheets. This smell detects such occurrences.
17 Fowler’s code smell webpage: http://martinfowler.com/bliki/CodeSmell.html
11

2. SPREADSHEET ANALYSIS
– Quasi-Functional Dependencies (QFD): In [13] it is described a technique toidentify dirty values using a slightly relaxed version of Functional Dependen-cies (FD) [14]. There exists a FD from a column A to a column B if multipleoccurrences of the same value in A always correspond to the same value inB. When equal values in a column correspond to the same values in anothercolumn, except for a small number of cases, this is a situation that this smellflags.
– Multiple Operations: This smell is inspired by the well-known code smell LongMethod. As in long methods, formulas with many different operations willlikely be hard to understand. This is especially problematic in spreadsheetssince in most spreadsheet systems, there is limited space to view a formula,causing long ones to be cut off.
– Multiple References: Like in Many Parameters code smell, when a formulareferences many different cells, like SUM(A1:A5;B7;C18;C19;F19), its under-standability decreases. In this case the intention is clear, but to locate eachcell referenced can be a challenge.
– Conditional Complexity: As it happens in source code, this smell detectsformulas with many conditional operations, like for instance the formulaIF(A3=1,IF(A4=1,IF(A5<34700,50)),0).
– Long Calculation Chain: Spreadsheet formulas can create chains of calculationsince they can refer to other formulas. To understand the purpose of suchformulas, users must trace along multiple steps to find the origin of the dataand intermediate calculations.
– Duplicated Formulas: This smell indicates that similar snippets of code areused throughout a class. This also happens in spreadsheets since some formu-las are partly the same as others. Consider two example formulas: SUM(A1:A6)+10%and SUM(A1:A6)+20%. The first part of the formula, SUM(A1:A6), is du-plicated.
– Inappropriate Intimacy: This smell was initially proposed to flag classes withtoo many dependencies of another class. In spreadsheets this can be adaptedto recognize a worksheet that is too much related to a second one.
– Feature Envy: This smell appears when a method seems more interested inthe fields of another class than of the class that contains it. In the context ofspreadsheets this can be detected when a formula is more interested in cellsfrom another worksheet.
– Middle Man: A middle man is a class that delegates most of its operationsto other classes, and does not contain enough logic to justify its own exis-tence. In spreadsheets this occurs if a ’middle man’ formula contains onlya reference to another cell and calculations, like, for example, the formula=Sheet1!A2.
– Shotgun Surgery: This occurs in source code when one change results inthe need of making a lot of little changes in several classes. This happensin spreadsheets when a formula is referred by many different formulas indifferent worksheets.
12

3. MODEL-DRIVEN SPREADSHEET ENGINEERING
The technique that we have devised in this paper starts by automaticallyprocessing spreadsheets and determining their smelly cells. A subset of thesecells is then selected, and automatically feeds a fault localization process.
3 Model-driven Spreadsheet Engineering
3.1 Spreadsheet Models
The use of abstract models to reason about concrete artifacts has successfullyand widespreadly been employed in science and in engineering. In fact, thereare many fields for which model-driven engineering is the default, uncontestedapproach to follow: it is a reasonable assumption that, excluding financial orcultural limitations, no private house, let alone a bridge or a skyscraper, shouldbe built before a model for it has been created and has been thoroughly analyzedand evolved.
Being itself a considerably more recent scientific field, not many decadeshave passed since software engineering has seriously considered the use of mod-els. In this section, we study model-driven approaches to spreadsheet softwareengineering.
In an attempt to overcome the issue of spreadsheet errors using model-driven approaches, several techniques have been proposed, namely the creationof spreadsheet templates [5], the definition of ClassSheet [31] models and the useof class diagrams to specify spreadsheets [39]. These proposals guarantee thatusers may safely perform particular editing steps on their spreadsheets and theyintroduce a form of model-driven software development: a spreadsheet businessmodel is defined from which a customized spreadsheet application is generatedguaranteeing the consistency of the spreadsheet with the underlying model.
Despite of its huge benefits, model-driven software development is sometimesdifficult to realize in practice. In the context of spreadsheets, for example, theuse of model-driven software development requires that the developer is familiarboth with the spreadsheet domain (business logic) and with model-driven soft-ware development. In the particular case of the use of templates, a new tool isnecessary to be learned, namely Gencel [33]. By using this tool, it is possible togenerate a new spreadsheet respecting the corresponding model. This approach,however, has several drawbacks: first, in order to define a model, spreadsheetmodel developers will have to become familiar with a new programming envi-ronment. Second, and most important, there is no connection between the standalone model development environment and the spreadsheet system. As a result,it is not possible to (automatically) synchronize the model and the spreadsheetdata, that is, the co-evolution of the model and its instance is not possible.
The first contribution of our work is the embedding of ClassSheet spread-sheet models in spreadsheets themselves. Our approach closes the gap betweencreating and using a domain specific language for spreadsheet models and a to-tally different framework for actually editing spreadsheet data. Instead, we unifythese operations within spreadsheets: in one worksheet we define the underlying
13
3. MODEL-DRIVEN SPREADSHEET ENGINEERING
model while another worksheet holds the actual data, such that the model andthe data are kept synchronized by our framework. A summarized description ofthis work has been presented in [20,26], a description that we revise and extendin this paper, in Section 3.5.
ClassSheet Models ClassSheets are a high-level, object-oriented formalism tospecify the business logic of spreadsheets [31]. This formalism allows users toexpress business object structures within a spreadsheet using concepts from theUML [63].
ClassSheets define (work)sheets (s) containing classes (c) formed by blocks(b). Both sheets and classes can be expandable, i.e., their instances can be re-peated either horizontally (c→) or vertically (b↓). Classes are identified by labels(l). A block can represent in its basic form a spreadsheet cell, or it can be acomposition of other blocks. When representing a cell, a block can contain abasic value (ϕ, e.g., a string or an integer) or an attribute (a = f), which iscomposed by an attribute name (a) and a value (f). Attributes can define threetypes of cells: 1), an input value, where a default value gives that indication, 2),a named reference to another attribute (n.a, where n is the name of the classand a the name of the attribute) or 3), an expression built by applying functionsto a varying number of arguments given by a formula (ϕ(f, . . . , f)).
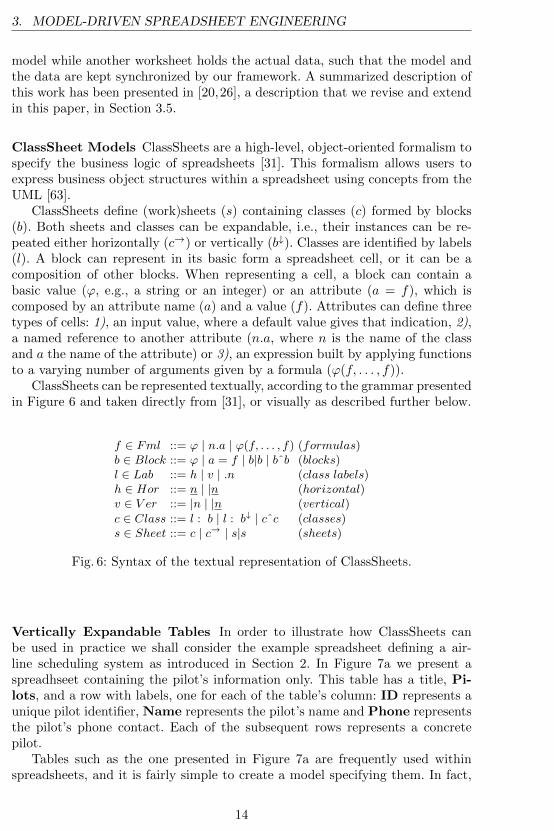
ClassSheets can be represented textually, according to the grammar presentedin Figure 6 and taken directly from [31], or visually as described further below.
f ∈ Fml ::= ϕ | n.a | ϕ(f, . . . , f) (formulas)b ∈ Block ::= ϕ | a = f | b|b | bˆb (blocks)l ∈ Lab ::= h | v | .n (class labels)h ∈ Hor ::= n | |n (horizontal)v ∈ V er ::= |n | |n (vertical)
c ∈ Class ::= l : b | l : b↓ | cˆc (classes)s ∈ Sheet ::= c | c→ | s|s (sheets)
Fig. 6: Syntax of the textual representation of ClassSheets.
Vertically Expandable Tables In order to illustrate how ClassSheets canbe used in practice we shall consider the example spreadsheet defining a air-line scheduling system as introduced in Section 2. In Figure 7a we present aspreadhseet containing the pilot’s information only. This table has a title, Pi-lots, and a row with labels, one for each of the table’s column: ID represents aunique pilot identifier, Name represents the pilot’s name and Phone representsthe pilot’s phone contact. Each of the subsequent rows represents a concretepilot.
Tables such as the one presented in Figure 7a are frequently used withinspreadsheets, and it is fairly simple to create a model specifying them. In fact,
14

3. MODEL-DRIVEN SPREADSHEET ENGINEERING
(a) Pilots’ table.(b) Pilots’ visual ClassSheet model.
Pilots : Pilots p t p t ˆPilots : ID p Name p Phone ˆ
Pilots : (id= "" p name= "" p phone= 0)↓
(c) Pilots’ textual ClassSheet model.
Fig. 7: Pilots’ example.
Figure 7b represents a visual ClassSheet model for this pilot’s table, whilst Fig-ure 7c shows the textual ClassSheet representation. In the next paragraphs weexplain such a model. To model the labels we use a textual representation andthe exact same names as in the data sheet (Pilots, ID, Name and Phone). Tomodel the actual data we abstract concrete column cell values by using a sin-gle identifier: we use the one-worded, lower-case equivalent of the correspondingcolumn label (so, id, name and phone). Next, a default value is associated witheach column: columns A and B hold strings (denoted in the model by the emptystring “” following the = sign), and column C holds integer values (denoted by0 following =). Note that the last row of the model is labeled on the left hand-side with vertical ellipses. This means that it is possible for the previous blockof rows to expand vertically, that is, the tables that conform to this model canhave as many rows/pilots as needed. The scope of the expansion is between theellipsis and the black line (between labels 2 and 3). Note that, by definition,ClassSheets do not allow for nested expansion blocks, and thus, there is no pos-sible ambiguity associated with this feature. The instance shown in Figure 7ahas three pilots.
Horizontally Expandable Tables In the lines of what we described in theprevious section, airline companies must also store information on their airplanes.This is the purpose of table Planes in the spreadsheet illustrated in Figure 8a,which is organized as follows: the first column holds labels that identify each row,namely, Planes (labeling the table itself), N-Number, Model and Name;cells in row N-Number (respectively Model and Name) contain the uniquen-number identifier of a plane, (respectively the model of the plane and the nameof the plane). Each of the subsequent columns contains information about oneparticular aircraft.
The Planes table can be visually modeled by the illustration in Figure 8band textually by the definition in Figure 8c. This model may be constructed fol-lowing the same strategy as in the previous section, but now swapping columns
15

3. MODEL-DRIVEN SPREADSHEET ENGINEERING
(a) Planes’ table. (b) Planes’ visual ClassSheet model.|Planes: Planes ˆ
p
N-Number:N-NumberModel: Model ˆName: Name
|Planes: t ˆ
→
N-Number:n-number= ""
Model: model= "" ˆName: name= ""
(c) Planes’ textual ClassSheet model.
Fig. 8: Planes’ example.
and rows: the first column contains the label information and the second onethe names abstracting concrete data values: again, each cell has a name and thedefault value of the elements in that row (in this example, all the cells have asdefault values empty strings); the third column is labeled not as C but with el-lipses meaning that the immediately previous column is horizontally expandable.Note that the instance table has information about three planes.
Relationship Tables The examples used so far (the tables for pilots andplanes) are useful to store the data, but another kind of table exists and canbe used to relate information, being of more practical interest.
Having pilots and planes, we can set up a new table to store informationfrom the flights that the pilots make with the planes. This new table is calleda relationship table since it relates two entities, which are the pilots and theplanes. A possible model for this example is presented in Figure 9, which alsodepicts an instance of that model.
The flights’ table contains information from distinct entities. In the model(Figure 9a), there is the class Flights that contains all the information, includ-ing:
– information about planes (class PlanesKey, columns B to E), namely areference to the planes table (cell B2);
– information about pilots (class PilotsKey, rows 3 and 4), namely a referenceto the pilots table (cell A4);
– information about the flights (in the range B3:E4), namely the depart loca-tion (cell B4), the destination (cell C4), the time of departure (cell D4) andthe duration of the flight (cell E4);
– the total hours flown by each pilot (cell F4), and also a grand total (cell F5).We assume that the same pilot does not appear in two different rows. Infact, we could use ClassSheet extensions to ensure this [20,25].
16

3. MODEL-DRIVEN SPREADSHEET ENGINEERING
(a) Flights’ visual ClassSheet model.
(b) Flights’ table.
Fig. 9: Flights’ table, relating Pilots and Planes.
For the first flight stored in the data (Figure 9b), we know that the pilot hasthe identifier pl1, the plane has the n-number N2342, it departed from OPO indirection to NAT at 14:00 on December 12, 2010, with a duration of 7 hours.
Note that we do not show the textual representation of this part of the modelbecause of its complexity and because it would not improve the understandabilityof this document.
3.2 Inferring Spreadsheet Models
In this section we explain in detail the steps to automatically extract a ClassSheetmodel from a spreadsheet [19]
Essentially, our method involves the following steps:
1. Detect all functional dependencies and identify model-relevant functionaldependencies
2. Determine relational schemas with candidate, foreign, and primary keys3. Generate and refactor a relational graph4. Translate the relational graph into a ClassSheet
In the following sub-sections we will explain the steps 1, 3, and 4. Step 2 isa standard inference procedure borrowed from relational database theory [8].
The Relational Intermediate Directed Graph The next step in the re-verse engineering process is to produce a Relational Intermediate Directed (RID)Graph [8]. This graph includes all the relationships between a given set of sche-mas. Nodes in the graph represent schemas and directed edges represent foreignkeys between those schemas. For each schema, a node in the graph is created,and for each foreign key, an edge with cardinality “*” at both ends is added tothe graph.
Figure 10 represents the RID graph for the flights scheduling. This graphcan generally be improved in several ways. For example, the information about
17

3. MODEL-DRIVEN SPREADSHEET ENGINEERING
Flights
Pilots
*
*
Planes
*
*
Fig. 10: RID graph for our running example.
foreign keys may lead to additional links in the RID graph. If two relations refer-ence each other, their relationship is said to be symmetric [8]. One of the foreignkeys can then be removed. In our example there are no symmetric references.
Another improvement to the RID graph is the detection of relationships, thatis, whether a schema is a relationship connecting other schemas. In such cases,the schema is transformed into a relationship. The details of this algorithm arenot so important and left out for brevity.
Since the only candidate key of the schema Sale is the combination of all theother schemas’ primary keys, it is a relationship between all the other schemasand is therefore transformed into a relationship. The improved RID graph canbe seen in Figure 11.
Flights
Pilots
*
Planes
*
Fig. 11: Refactored RID graph.
Generating ClassSheets The RID graph generated in Section 3.2 can be di-rectly translated into a ClassSheet diagram. By default, each node is translatedinto a class with the same name as the relation and a vertically expanding block.In general, for a relation of the form
A1, . . . , An, An+1, ..., Am
18

3. MODEL-DRIVEN SPREADSHEET ENGINEERING
and default values da1, . . . , dan, dn+1, ..., dm, a ClassSheet class/table is gener-ated as shown in Figure 1218. From now on this rule is termed rule 1.
Fig. 12: Generated class for a relation A.
This ClassSheet represents a spreadsheet “table” with name A. For eachattribute, a column is created and is labeled with the attribute’s name. Thedefault values depend on the attribute’s domain. This table expands vertically,as indicated by the ellipses. The key attributes become underlined labels.
A special case occurs when there is a foreign key from one relation to another.The two relations are created basically as described above but the attributes thatcompose the foreign key do not have default values, but references to the cor-responding attributes in the other class. Let us use the following generic relations:
M(M1, ...,Mr,Mr+1, ...,Ms)N(N1, ..., Nt,Mm, ...,Mn,Mo, ...,Mp, Nt+1, ..., Nu)
Note that Mn, ...,Mm,Mo, ...,Mp are foreign keys from the relation N to therelation M , where 1 6 n,m, o, p 6 r, n 6 m, and o 6 p. This means that theforeign key attributes in N can only reference key attributes in the M . Thecorresponding ClassSheet is illustrated in Figure 13. This rule is termed rule 2.
Fig. 13: Generated ClassSheet for relations with foreign keys.
Relationships are treated differently and will be translated into cell classes.We distinguish between two cases: (A) relationships between two schemas, and(B) relationships between more than two schemas.
For case (A), let us consider the following set of schemas:
18 We omit here the column labels, whose names depend on the number of columns inthe generated table.
19

3. MODEL-DRIVEN SPREADSHEET ENGINEERING
M(M1, ...,Mr,Mr+1, ...,Ms)N(N1, ..., Nt, Nt+1, ..., Nu)R(M1, ...,Mr, N1, ..., Nt, R1, ..., Rx, Rx+1, ..., Ry)
The ClassSheet that is produced by this translation is shown in Figure 14 andexplained next.
Fig. 14: ClassSheet of a relationship connecting two relations.
For both nodes M and N a class is created as explained before (lower part ofthe ClassSheet). The top part of the ClassSheet is divided in two classes and onecell class. The first class, NKey, is created using the key attributes from the Nclass. All its values are references to N. For example, n1 = N.N1 references thevalues in column A in class N. This makes the spreadsheet easier to maintainwhile avoiding insertion, modification and deletion anomalies [14]. Class Mkey iscreated using the key attributes of the class M and the rest of the key attributesof the relationship R. The cell class (with blue border) is created using the restof the attributes of the relationship R.
In principle, the positions of M and N are interchangeable and we have tochoose which one expands vertically and which one expands horizontally. Wechoose whichever combination minimizes the number of empty cells created bythe cell class, that is, the number of key attributes from M and R should besimilar to the number of non-key attributes of R. This rule is named rule A.Three special cases can occur with this configuration.
Case 1. The first case occurs when one of the relations M or N might haveonly key attributes. Let us assume that M is in this situation:
M(M1, ...,Mr)N(N1, ..., Nt, Nt+1, ..., Nu)R(M1, ...,Mr, N1, ..., Nt, R1, ..., Rx, Rx+1, ..., Ry)
20

3. MODEL-DRIVEN SPREADSHEET ENGINEERING
In this case, and since all the attributes of that class are already included inthe class MKey or NKey, no separated class is created for it. The resultantClassSheet would be similar to the one presented in Figure 14, but a separatedclass would not be created for M or for N or for both. Figure 15 illustrates thissituation. This rule is from now on termed rule A1.
Fig. 15: ClassSheet where one entity has only key attributes.
Case 2. The second case occurs when the key of the relationship R is onlycomposed by the keys of M and N (defined as before), that is, R is defined asfollows:
M(M1, ...,Mr,Mr+1, ...,Ms)N(N1, ..., Nt, Nt+1, ..., Nu)R(M1, ...,Mr, N1, ..., Nt, R1, ..., Rx)
The resultant ClassSheet is shown in Figure 16.
Fig. 16: ClassSheet of a relationship with all the key attributes being foreignkeys.
21

3. MODEL-DRIVEN SPREADSHEET ENGINEERING
The difference between this ClassSheet model and the general one is that theMKey class on the top does not contain any attribute from R: all its attributesare contained in the cell class. This rule is from now on named rule A2.
Case 3. Finally, the third case occurs when the relationship is composedonly by key attributes as illustrated next:
M(M1, ...,Mr,Mr+1, ...,Ms)N(N1, ..., Nt, Nt+1, ..., Nu)R(M1, ...,Mr, N1, ..., Nt)
In this situation, the attributes that appear in the cell class are the non-keyattributes of N and no class is created for N. Figure 17 illustrates this case.From now on this rule is named rule A3.
Fig. 17: ClassSheet of a relationship composed only by key attributes.
For case (B), that is, for relationships between more than two tables, wechoose between the candidates to span the cell class using the following criteria:
1. M and N should have small keys;2. the number of empty cells created by the cell class should be minimal.
This rule is from now on named rule B.After having chosen the two relations (and the relationship), the generation
proceeds as described above. The remaining relations are created as explainedin the beginning of this section.
3.3 Mapping Strategy
In this section we present the mapping function between RID graphs and Class-Sheets, which builds on the rules presented before. For that, we use the commonstrategic combinators listed below [48,67,68]:
. :: Rule → Rule → Rule -- sequential composition� :: Rule → Rule → Rule -- left-biased choice
22
3. MODEL-DRIVEN SPREADSHEET ENGINEERING
many :: Rule → Rule -- repetitiononce :: Rule → Rule -- arbitrary depth rule application
In this context, Rule encodes a transformation from RID graphs to Class-Sheets.
Using the rules defined in the previous section and the combinators listedabove, we can construct a strategy that generates a ClassSheet:
genCS =many (once (rule B)) Bmany (once (rule A)) Bmany (once (rule A1 ) � once (rule A2 ) � once (rule A3 )) Bmany (once (rule 2)) Bmany (once (rule 1))
The strategy works as follows: it tries to apply rule B as many times aspossible, consuming all the relationships with more than two relations; it thentries to apply rule A as many times as possible, consuming relationships withtwo relations; next the three sub-cases of rule A are applied as many times aspossible consuming all the relationships with two relations that match some ofthe sub-rules; after consuming all the relationships and corresponding relations,the strategy consumes all the relations that are connected through a foreign keyusing rule 2 ; finally, all the remaining relations are mapped using rule 1.
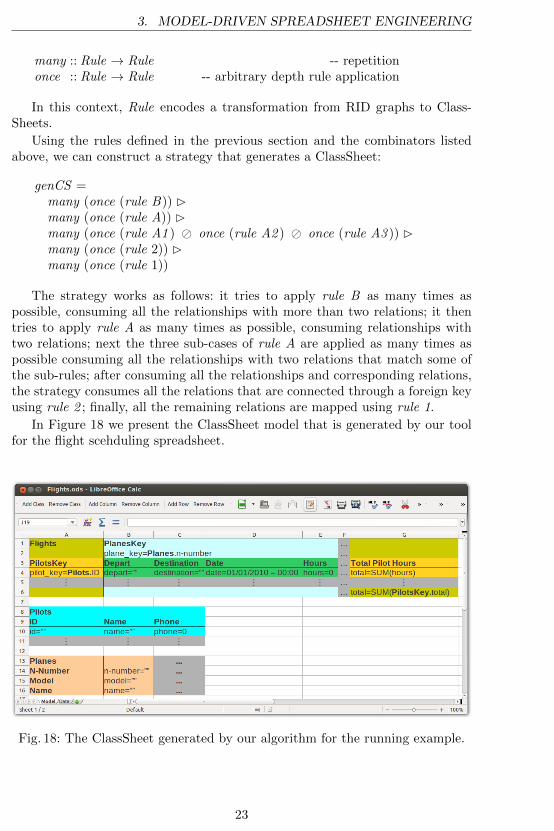
In Figure 18 we present the ClassSheet model that is generated by our toolfor the flight scehduling spreadsheet.
Fig. 18: The ClassSheet generated by our algorithm for the running example.
23

3. MODEL-DRIVEN SPREADSHEET ENGINEERING
3.4 Generation of Model-driven Spreadsheets
Together with the definition of ClassSheet models, Erwig et al. develop a visualtool to allow the easy creation and manipulation of the visual representationClassSheet models: the Gencel [5]. Moreover, from the constructed model, theGencel tool generates an initial Excel spreadsheet that embeds some of the busi-ness logic defined in the model. The idea is that, when using such generatedspreadsheets, end-users are restricted to only perform operations that are logi-cally and technically correct for that model.
The generated spreadsheet not only guides end-users to introduce correctdata, but it also provides operations to perform some repetitive tasks like therepetition of a set of columns with some default values.
[6] introduced a visual specification language for spreadsheets called Vitsl[6]. This language is visually similar to spreadsheets and it has also a formaltextual representation. A tool was developed to design Vitsl templates (seefigure 19)
Fig. 19: Screenshot of the Vitsl editor, taken from [5].
The implementation of the Gencel tool follows a traditional compiler con-struction architecture [7]: first a language is defined (a visual domain specificlanguage, in this case). Then a specific compiler (the Gencel tool, in this case)compiles it into a target lower level representation: an Excel spreadsheet withembeded operations and the model’s business logic. This generated represen-tation is then interpreted by a diferent software system: the Excel spreadsheetsystem. The achitecture of the Gencel tool is shown in Figure 20.
to be given as input to Gencel presented above, but the architecture of thissystem (Vitsl template editor + Gencel + spreadsheet system, see figure 20)is not evolution friendly since after editing the template a new spreadsheet iscreated and the user needs to populate it again.
This method has the disadvantage that when a template is modified, a newspreadsheet is generated and the user has to migrate the data manually.
3.5 Embedding ClassSheet Models in SpreadSheets
.
24

3. MODEL-DRIVEN SPREADSHEET ENGINEERING
Model Development Spreadsheet Use
Spreadsheet TemplateSpreadsheet TemplateViTSL EditorViTSL Editor GencelGencel Spreadsheet FileSpreadsheet File
Microsoft Excel / Gencel add-inMicrosoft Excel / Gencel add-in
Fig. 20: Vitsl-based environment for spreadsheet development.
The ClassSheet language is a domain specific language to represent the busi-ness model of spreadsheet data. Furthermore, as we have seen in the previoussection, the visual representation of ClassSheets very much resembles spread-sheets themselves. Indeed, the visual representation of ClassSheet models is aVisual Domain Specific Language (VDSL). These two facts combined motivatedthe use of spreadsheet systems to define ClassSheet models [26], i.e., to na-tively embed ClassSheets in a spreadsheet host system. In this line, we haveadopted the well-known techniques to embed DSLs in a host general purposelanguage [64]. In this way, both the model and the spreadsheet can be stored inthe same file, and model creation along with data editing can be handled in thesame environment that users are familiar with.
The embedding of ClassSheets within spreadsheets is not direct, since Class-Sheets were not meant to be embedded inside spreadsheets. Their resemblancehelps, but some limitations arise due to syntactic restrictions imposed by spread-sheet host systems. Several options are available to overcome the syntactic re-strictions, like writing a new spreadsheet host system from start, modifyingan existing one, or adapting the ClassSheet visual language. The two first op-tions are not viable to distribute Model-Driven Spreadsheet Engineering (MDSE)widely, since both require users to switch their system, which can be inconve-nient. Also, to accomplish the first option would be a tremendous effort andwould change the focus of the work from the embedding to building a tool.
The solution adopted modifies slightly the ClassSheet visual language so itcan be embedded in a worksheet without doing major changes on a spreadsheethost system (see Figure 21). The modifications are:
1. identify expansion using cells (in the ClassSheet language, this identificationis done between columns/rows letters/numbers);
2. draw an expansion limitation black line in the spreadsheet (originally this isdone between column/row letters/numbers);
3. fill classes with a background color (instead of using lines as in the originalClassSheets).
The last change (3) is not mandatory, but it is easier to identify the classesand, along with the first change (2), eases the identification of classes’ parts.This way, users do not need to think which role the line is playing (expansionlimitation or class identification).
25

3. MODEL-DRIVEN SPREADSHEET ENGINEERING
Fig. 21: Embedded ClassSheet for the flights’ table.
We can use the flights’ table to compare the differences between the originalClassSheet and its embedded representation:
– In the original ClassSheet (Figure 9a), there are two expansions: one denotedby the column between columns E and F for the horizontal expansion, andanother denoted by the row between rows 4 and 5 for the vertical one.Applying change 1 to the original model will add an extra column (F) andan extra row (5) to identify the expansions in the embedding (Figure 21).
– To define the expansion limits in the original ClassSheet, there are no linesbetween the column headers of columns B, C, D and E which makes thehorizontal expansion to use three columns and the vertical expansion onlyuses one row. This translates to a line between columns A and B and anotherline between rows 3 and 4 in the embedded ClassSheet as per change 2.
– To identify the classes, background colors are used (change 3), so that theclass Flights is identified by the green19 background, the class PlanesKeyby the cyan background, the class PilotsKey by the yellow background,and the class that relates the PlanesKey with the PilotsKey by the darkgreen background. Moreover, the relation class (range B3:E5), called Pi-lotsKey PlanesKey, is colored in dark green.
Given the embedding of the spreadsheet model in one worksheet, it is nowpossible to have one of its instances in a second worksheet, as we will shortlydiscuss. As we will also see, this setting has some advantages: for once, usersmay evolve the model having the data automatically coevolved. Also, havingthe model near the data helps to document the latter, since users can identifyclearly the structure of the logic behind the spreadsheet. Figure 22a illustratesthe complete embedding for the ClassSheet model of the running example, whilstFigure 22b shows one of its possible instances.
To be noted that the data also is colored in the same manner as the model.This allows a correspondence between the data and the model to be made quickly,relating parts of the data to the respective parts in the model. This feature is notmandatory to implement the embedding, but can help the end users. One canprovide this coloring as an optional feature that could be activated on demand.
19 We assume colors are visible in the digital version of this paper.
26

3. MODEL-DRIVEN SPREADSHEET ENGINEERING
(a) Model on the first worksheet of the spreadsheet.
(b) Data on the second worksheet of the spreadsheet.
Fig. 22: Flights’ spreadsheet, with an embedded model and a conforming in-stance.
Model Creation To create a model, several operations are available such asaddition and deletion of columns and rows, cell editing, and addition or deletionof classes.
To create, for example, the flights’ part of the spreadsheet used so far, onecan:
1. add a class for the flights, selecting the range A1:G6 and choosing the greencolor for its background;
2. add a class for the planes, selecting the range B1:F6, choosing the cyan colorfor its background, and setting the class to expand horizontally;
27

3. MODEL-DRIVEN SPREADSHEET ENGINEERING
3. add a class for the pilots, selecting the range A3:G5, choosing the yellowcolor for its background, and setting the class to expand vertically; and,
4. set the labels and formulas for the cells.
The addition of the relation class (range B3:E4) is not needed since it isadded automatically when the environment detects superposing classes at thesame level (PlanesKey and PilotsKey are within Flights, which leads to theautomatic insertion of the relation class).
Instance Generation From the flights’ model described above, an instancewithout any data can be generated. This is performed by copying the structureof the model to another worksheet. In this process labels copied as they are, andattributes are replaced in one of two ways: i), if the attribute is simple (i.e., it islike a = ϕ), it is replaced by its default value; ii), otherwise, it is replaced by aninstance of the formula. An instance of a formula is similar to the original onedefined in the model, but the attribute references are replaced by references tocells where those attributes are instantiated. Moreover, columns and rows withellipses have no content, having instead buttons to perform operations of addingnew instances of their respective classes.
An empty instance generated by the flights’ model is pictured in Figure 23.All the labels (text in bold) are the same as the ones in the model, and in thesame position, attributes have the default values, and four buttons are availableto add new instances of the expandable classes.
Fig. 23: Spreadsheet generated from the flights’ model.
28
4. EVOLUTION OF MODEL-DRIVEN SPREADSHEETS
Data Editing The editing of the data is performed like with plain spreadsheets,i.e., the user just edits the cell content. The insertion of new data is differentsince editing assistance must be used through the buttons available.
For example, to insert a new flight for pilot pl1 in the Flights table, withoutmodels one would need to:
1. insert four new columns;2. copy all the labels;3. update all the necessary formulas in the last column; and,4. insert the values for the new flight.
With a large spreadsheet, the step to update the formulas can be very errorprone, and users may forget to update all of them. Using models, this processconsists on two steps only:
1. press the button with label “· · · ” (in column J, Figure 22b); and,2. insert the values for the new flight.
The model-driven environment automatically inserts four new columns, thelabels for those columns, updates the formulas, and inserts default values in allthe new input cells.
Note that, to keep the consistency between instance and model, all the cells inthe instance that are not data entry cells are non-editable, that is, all the labelsand formulas cannot be edited in the instance, only in the model. In Section 4we will detail how to handle model evolutions.
Embedded Domain Sprcific Languages Discussion about embedding orcompiling a DSL: Advantages and Disadvantages
4 Evolution of Model-driven Spreadsheets
4.1 Model Evolution and Data Co-Evolution
The example we have been using manages pilots, planes and flights, but it missesa critical piece of information about flights: the number of passengers. In thiscase, additional columns need to be inserted in the block of each flight. Fig-ure 24 shows an evolved spreadsheet with new columns (F and K) to store thenumber of passengers (Figure 22b), as well as the new model that it instantiates(Figure 22a).
Note that a modification of the year block in the model (in this case, insertinga new column) captures modifications to all repetitions of the block throughoutthe instance.
In this section, we will demonstrate that modifications to spreadsheet modelscan be supported by an appropriate combinator language, and that these modelmodifications can be propagated automatically to the spreadsheets that instan-tiate the models [28]. In the case of the flights example, the model modificationis captured by the following expression:
29

4. EVOLUTION OF MODEL-DRIVEN SPREADSHEETS
(a) Evolved flights’ model.
(b) Evolved flights’ instance.
Fig. 24: Evolved spreadsheet and the model that it instantiates.
addPassengers =once (inside "PilotsKey_PlanesKey" (after "Hours" (insertCol "Passengers")))
The actual column insertion is done by the innermost insertCol step. The afterand inside combinators specify the location constraints of applying this step. Theonce combinator traverses the spreadsheet model to search for a single locationwhere these constraints are satisfied and the insertion can be performed.
The application of addPassengers to the initial model (Figure 22a) will yield:
1. the modified model (Figure 24a),2. a spreadsheet migration function that can be applied to instances of the
initial model (e.g. Figure 22b) to produce instances of the modified model(e.g. Figure 24b), and
3. an inverse spreadsheet migration function to backport instances of the mod-ified model to instances of the initial model.
In the remaining of this section we will explain the machinery required forthis type of coupled transformation of spreadsheet instances and models.
4.2 A Framework for Evolution of Spreadsheets in Haskell
Data refinement theory provides an algebraic framework for calculating withdata types and corresponding values [50, 52, 53]. It consists of type-level cou-pled with value-level transformations. The type-level transformations deal withthe evolution of the model and the value-level transformations deal with theinstances of the model (e.g. values). Figure 25 depicts the general scenario of atransformation in this framework.
Each transformation is coupled with witness functions to and from, whichare responsible for converting values of type A into type A′ and back.
2LT is a framework written in Haskell implementing this theory [9,16–18]. Itprovides the basic combinators to define and compose transformations for datatypes and witness functions. Since 2LT is statically typed, transformations areguaranteed to be type-safe ensuring consistency of data types and data instances.
30

4. EVOLUTION OF MODEL-DRIVEN SPREADSHEETS
A
to
&&6 A′
from
ffA, A′ data type and transformed data typeto witness function of type A→ A′ (injective)from witness function of type A′ → A (surjective)
Fig. 25: Coupled transformation of data type A into data type A′.
ClassSheets and Spreadsheets in Haskell The 2LT was originally designedto work with algebraic data types. However, this representation is not expres-sive enough to represent ClassSheet specifications or their spreadsheet instances.To overcome this issue, we extended the 2LT representation so it could sup-port ClassSheet models, by introducing the following Generalized Algebraic DataType20 (GADT) [44,57]:
data Type a where...V alue :: V alue→ Type V alue -- plain valueRef :: Type b → PF (a → RefCell)→ PF (a → b)→ Type a → Type a
-- referencesRefCell :: Type RefCell -- reference cellFormula :: Formula1 → Type Formula1 -- formulas
LabelB :: String → Type LabelB -- block label· = · :: Type a → Type b → Type (a, b) -- attributes· p · :: Type a → Type b → Type (a, b) -- block horizontal composition· ˆ · :: Type a → Type b → Type (a, b) -- block vertical compositionEmptyB :: Type EmptyB -- empty block· :: String → Type HorH -- horizontal class label| · :: String → Type V erV -- vertical class label| · :: String → Type Square -- square class labelLabRel :: String → Type LabS -- relation class
· : · :: Type a → Type b → Type (a, b) -- labeled class
· : (·)↓ :: Type a → Type b → Type (a, [b ]) -- labeled expandable class· ˆ · :: Type a → Type b → Type (a, b) -- class vertical composition
SheetC :: Type a → Type (SheetC a) -- sheet class·→ :: Type a → Type [a ] -- sheet expandable class· p · :: Type a → Type b → Type (a, b) -- sheet horizontal compositionEmptyS :: Type EmptyS -- empty sheet
The comments should clarify what the constructors represent. The values of typeType a are representations of type a. For example, if t is of type Type V alue,then t represents the type V alue. The following types are needed to constructvalues of type Type a:
20 “It allows to assign more precise types to data constructors by restricting the vari-ables of the datatype in the constructors’ result types.”
31

4. EVOLUTION OF MODEL-DRIVEN SPREADSHEETS
data EmptyBlock -- empty blockdata EmptySheet -- empty sheettype LabelB = String -- labeldata RefCell = RefCell1 -- referenced celltype LabS = String -- square labeltype HorH = String -- horizontal labeltype V erV = String -- vertical labeldata SheetC a = SheetCC a -- sheet classdata SheetCE a = SheetCEC a -- expandable sheet classdata V alue = V Int Int | V String String | V Bool Bool | V Double Double -- valuesdata Formula1 = FValue V alue | FRef | FFormula String [Formula1 ] -- formula
Once more, the comments should clarify what each type represents. To explainthis representation we will use as an example a small table representing the costsof maintenance of planes. We do not use the running example as it would be verycomplex to explain and understand. For this reduced model only four columnswere defined: plane model, quantity, cost per unit and total cost (product ofquantity by cost per unit). The Haskell representation of such model is shownnext.
costs =| Cost : Model p Quantity p Price p Totalˆ
| Cost : (model = "" p quantity = 0 p price = 0 p total = FFormula "×" [FRef ,FRef ])↓
This ClassSheet specifies a class called Cost composed by two parts verticallycomposed as indicated by the ˆ operator. The first part is specified in the firstrow and defines the labels for four columns: Model , Quantity , Price and Total .The second row models the rest of the class containing the definition of thefour columns. The first column has default value the empty string (""), the twofollowing columns have as default value 0, and the last one is defined by a for-mula (explained latter on). Note that this part is vertical expandable. Figure 26represents a spreadsheet instance of this model.
Fig. 26: Spreadsheet instance of the maintenance costs ClassSheet.
Note that in the definition of Type a the constructors combining parts of thespreadsheet (e.g. sheets) return a pair. Thus, a spreadsheet instance is writtenas nested pairs of values. The spreadsheet illustrated in Figure 26 is encoded inHaskell as follows:
((Model , (Quantity , (Price,Total))),[("B747", (2 , (1500 ,FFormula "×" [FRef ,FRef ]))),("B777", (5 , (2000 ,FFormula "×" [FRef ,FRef ])))])
32

4. EVOLUTION OF MODEL-DRIVEN SPREADSHEETS
The Haskell type checker statically ensures that the pairs are well formed andare constructed in the correct order.
Specifying References Having defined a GADT to represent ClassSheet mod-els, we need now a mechanism to define spreadsheet references. The safer way toaccomplish this is making references strongly typed. Figure 27 depicts the sce-nario of a transformation with references. A reference from a cell s to the a cellt is defined using a pair of projections, source and target. These projections arestatically-typed functions traversing the data type A to identify the cell definingthe reference (s), and the cell to which the reference is pointing to (t). In thisapproach, not only the references are statically typed, but also always guaran-teed to exist, that is, it is not possible to create a reference from/to a cell thatdoes not exist.
|s|
A
to
&&
target --
source11
T +3 A′
from
ff
source′
mm
target′qq|t|
source Projection over type A identifying the referencetarget Projection over type A identifying the referenced cell
source′ = source ◦ fromtarget′ = target ◦ from
Fig. 27: Coupled transformation of data type A into data type A′ with references.
The projections defining the reference and the referenced type, in the trans-formed type A′, are obtained by post-composing the projections with the witnessfunction from. When source′ and target′ are normalized they work on A′ directlyrather than via A. The formula specification, as previously shown, is specifieddirectly in the GADT. However, the references are defined separately by definingprojections over the data type. This is required to allow any reference to accessany part of the GADT.
Using the spreadsheet illustrated in Figure 26, an instance of a referencefrom the formula total to price is defined as follows (remember that the secondargument of Ref is the source (reference cell) and that the third is the target(referenced cell)):
costWithReferences =Ref Int (fhead ◦ head ◦ (π2 ◦ π2 ◦ π2)? ◦ π2) (head ◦ (π1 ◦ π2 ◦ π2)? ◦ π2) cost
The source function refers to the first FRef in the Haskell encoding shown afterFigure 26. The target projection defines the cell it is pointing to, that is, itdefines a reference to the the value 1500 in column Price.
To help understand this example, we explain how source is constructed. Sincethe use of GADTs requires the definition of models combining elements in a
33

4. EVOLUTION OF MODEL-DRIVEN SPREADSHEETS
pairwise fashion, π2 is used to get the second element of the model (a pair), thatis, the list of planes and their cost maintenance. Then, we apply (π2 ◦ π2 ◦ π2)?
which will return a list with all the formulas. Finally head will return the firstformula (the one in cell D2) from which fhead gets the first reference in a listof references, that is, the reference B2 that appears in cell D2.
Note that our reference type has enough information about the cells andthus we do not need value-level functions, that is, we do not need to specify theprojection functions themselves, just their types. In the cases we reference a listof values, for example, constructed by the class expandable operator, we need tobe specific about the element within the list we are referencing. For these cases,we use the type-level constructors head (first element of a list) and tail (all butfirst) to get the intended value in the list.
Rewriting Systems We are now able to completely represent ClassSheets inHaskell. In this section we discuss the definition of the witness functions fromand to. Once again we rely on the definition of a GADT:
data PF a whereid :: PF (a → a) -- identity functionπ1 :: PF ((a, b)→ a) -- left projection of a pairπ2 :: PF ((a, b)→ b) -- right projection of a pairpnt :: a → PF (One → a) -- constant· 4 · :: PF (a → b)→ PF (a → c)→ PF (a → (b, c)) -- split of functions· × · :: PF (a → b)→ PF (c → d)→ PF ((a, c)→ (b, d)) -- product of functions· ◦ · :: Type b → PF (b → c)→ PF (a → b)→ PF (a → c) -- composing func.·? :: PF (a → b)→ PF ([a ]→ [b ]) -- map of functionshead :: PF ([a ]→ a) -- head of a listtail :: PF ([a ]→ [a ]) -- tail of a listfhead :: PF (Formula1 → RefCell) -- head of the arguments of a formulaftail :: PF (Formula1 → Formula1 ) -- tail of the arguments of a formula
This GADT represents the types of the functions used in the transformations.For example, π1 represents the type of the function that projects the first part ofa pair. The comments should clarify which function each constructor represents.Given these representations of types and functions, we can turn to the encodingof refinements. Each refinement is encoded as a two-level rewriting rule:
type Rule = ∀ a . Type a → Maybe (View (Type a))
data View a where View :: Rep a b → Type b → View (Type a)
data Rep a b = Rep {to = PF (a → b), from = PF (b → a)}
Although the refinement is from a type a to a type b, this can not be directlyencoded since the type b is only known when the transformation completes, sothe type b is represented as a view of the type a. A view expresses that a typea can be represented as a type b, denoted as Rep a b, if there are functionsto :: a → b and from :: b → a that allow data conversion between one and theother.
34

4. EVOLUTION OF MODEL-DRIVEN SPREADSHEETS
To better explain this system we will show a small example. The followingcode implements a rule to transform a list into a map (represented by ·⇀ ·):
listmap :: Rulelistmap ([a]) = Just (View (Rep {to = seq2index , from = tolist }) (Int ⇀ a))listmap = mzero
The witness functions have the following signature (for this example their codeis not important):
tolist :: (Int ⇀ a)→ [a] seq2index :: [a]→ (Int ⇀ a)
This rule receives the type of a list of a, [a], and returns a view over the typemap of integers to a, Int ⇀ a. The witness functions are returned in the rep-resentation Rep. If other argument than a list is received, then the rule failsreturning mzero. All the rules contemplate this last case and so we will not showit in the definition of other rules.
Given this encoding of individual rewrite rules, a complete rewrite systemcan be constructed via the following constructors:
nop :: Rule -- identity. ::Rule → Rule → Rule -- sequential composition� ::Rule → Rule → Rule -- left-biased choicemany :: Rule → Rule -- repetitiononce :: Rule → Rule -- arbitrary depth rule application
Details on the implementation of these combinators can be found elsewhere [16].
Evolution of Spreadsheets In this section we define rules to perform spread-sheet evolution. These rules can be divided in three main categories: Combina-tors, used as helper rules, Semantic rules, intended to change the model itself(e.g. add a new column), and Layout rules, designed to change the visual ar-rangement of the spreadsheet (e.g. swap two columns).
Combinators The semantic and the layout rules are defined to work on aspecific part of the model. The combinators defined next are then used to applythose rules in the desired places.
Pull up all references To avoid having references in different levels of the models,all the rules pull all references to the topmost level of the model. This allowsto create simpler rules since the positions of all references are know and do notneed to be changed when the model is altered. To pull a reference in a particularplace we use the following rule (we show just its first case):
pullUpRef :: RulepullUpRef ((Ref tb fRef tRef ta) p b2 ) = do
return (View idrep (Ref tb (fRef ◦ π1) (tRef ◦ π1) (ta p b2 )))
The representation idrep has the id function in both directions. If part of themodel (in this case the left part of a horizontal composition) of a given type has a
35

4. EVOLUTION OF MODEL-DRIVEN SPREADSHEETS
reference, it is pulled to the top level. This is achieved by composing the existingprojections with the necessary functions, in this case π1. This rule has two cases(left and right hand side) for each binary constructor (e.g. horizontal/verticalcomposition).
To pull up all the references in all levels of a model we use the rule
pullUpAllRefs = many (once pullUpRef )
The once operator applies the pullUpRef rule somewhere in the type and themany ensures that this is applied everywhere in the whole model.
Apply after and friends The combinator after finds the correct place to apply theargument rule (second argument) by comparing the given string (first argument)with the existing labels in the model. When it finds the intended place, it appliesthe rule to it. This works because our rules always do their task on the right-handside of a type.
after :: String → Rule → Ruleafter label r (label ′ p a) | label ≡ label ′ = do
View s l ′ ← r label ′
return (View (Rep {to = to s × id, from = from s × id}) (l ′ p a))
Note that this code represents only part of the complete definition of the func-tion. The remaining cases, e.g. ·ˆ·, are not shown since they are quite similar tothe one presented.
Other combinators were also developed, namely, before, bellow , above, insideand at . Their implementations are not shown since they are similar to the aftercombinator.
Semantic Rules Given the support to apply rules in any place of the modelgiven by the previous definitions, we now present rules that change the semanticsof the model, that is, that change the meaning and the model itself, e.g., addingcolumns.
Insert a block The first rule we present is one of the most fundamentals: theinsertion of a new block into a spreadsheet. It is formally defined as follows:
Block
id4(pnt a)
**6 Block p Block
π1
jj
This diagram means that a horizontal composition of two blocks refines a blockwhen witnessed by two functions, to and from. The to function, id4(pnt a),is a split: it injects the existing block in the first part of the result withoutmodifications (id) and injects the given block instance a into the second part ofthe result. The from function is π1 since it is the one that allows the recovery ofthe existent block. The Haskell version of the rule is presented next.
36

4. EVOLUTION OF MODEL-DRIVEN SPREADSHEETS
insertBlock :: Type a → a → RuleinsertBlock ta a tx | isBlock ta ∧ isBlock tx = do
let rep = Rep {to = (id4(pnt a)), from = π1}View s t ← pullUpAllRefs (tx p ta)return (View (comprep rep s) t)
The function comprep composes two representations. This rule receives the typeof the new block ta, its default instance a, and returns a Rule. The returnedrule is itself a function that receives the block to modify tx , and returns aview of the new type. The first step is to verify if the given types are blocksusing the function isBlock . The second step is to create the representation repwith the witness functions given in the above diagram. Then the references arepulled up in result type tx p ta. This returns a new representation s and anew type t (in fact, the type is the same t = tx p ta). The result view has asrepresentation the composition of the two previous representations, rep and s,and the corresponding type t .
Rules to insert classes and sheets were also defined, but since these rules aresimilar to the rule to insert blocks, we omit them.
Insert a column To insert a column in a spreadsheet, that is, a cell with a labellbl and the cell bellow with a default value df and vertically expandable, we firstneed to create a new class representing it: clas =| lbl : lblˆ(lbl = df ↓). The labelis used to create the default value (lbl , [ ]). Note that since we want to create anexpandable class, the second part of the pair must be a list. The final step is toapply insertSheet :
insertCol :: String → VFormula → RuleinsertCol l f @(FFormula name fs) tx | isSheet tx = do
let clas =| lbl : lblˆ(lbl = df ↓)((insertSheet clas (lbl , [ ])) B pullUpAllRefs) tx
Note the use of the rule pullUpAllRefs as explained before. The case shown inthe above definition is for a formula as default value and it is similar to the valuecase. The case with a reference is more interesting and is shown next:
insertCol l FRef tx | isSheet tx = do
let clas =| lbl : Ref ⊥ ⊥ ⊥ (lblˆ((lbl = RefCell)↓))((insertSheet clas (lbl , [ ])) B pullUpAllRefs) tx
Recall that our references are always local, that is, they can only exist withthe type they are associated with. So, it is not possible to insert a column thatreferences a part of the existing spreadsheet. To overcome this, we first createthe reference with undefined functions and auxiliary type (⊥). We then set thesevalues to the intended ones.
setFormula :: Type b → PF (a → RefCell)→ PF (a → b)→ RulesetFormula tb fRef tRef (Ref t) = return (View idrep (Ref tb fRef tRef t))
37

4. EVOLUTION OF MODEL-DRIVEN SPREADSHEETS
This rule receives the auxiliary type (Type b), the two functions representingthe reference projections and adds them to the type. A complete rule to inserta column with a reference is defined as follows:
insertFormula =(once (insertCol label FRef )) B (setFormula auxType fromRef toRef )
Following the original idea described previously in this section, we want to in-troduce a new column with the number of passengers in a flight. In this case, wewant to insert a column in an existing block and thus our previous rule will notwork. For these cases we write a new rule:
insertColIn :: String → VFormula → RuleinsertColIn l (FValue v) tx | isBlock tx = do
let block = lbl ˆ(lbl = v)((insertBlock block (lbl , v)) B pullUpAllRefs) tx
This rule is similar to the previous one but it creates a block (not a class) andinserts it also after a block. The reasoning is analogous to the one in insertCol .
To add the column "Passengers" we can use the rule insertColIn, but ap-plying it directly to our running example will fail since it expects a block andwe have a spreadsheet. We can use the combinator once to achieve the desiredresult. This combinator tries to apply a given rule somewhere in a type, stop-ping after it succeeds once. Although this combinator already existed in the 2LTframework, we extended it to work for spreadsheet models/types.
Make it expandable It is possible to make a block in a class expandable. For this,we created the rule expandBlock :
expandBlock :: String → RuleexpandBlock str (label : clas) | compLabel label str = do
let rep = Rep {to = id× tolist, from = id× head}return (View rep (label : (clas)↓))
It receives the label of the class to make expandable and updates the class toallow repetition. The result type constructor is · : (·)↓; the to function wrapsthe existing block into a list, tolist ; and the from function takes the head of it,head. We developed a similar rule to make a class expandable. This correspondsto promote a class c to c→. We do not show its implementation here since it isquite similar to the one just shown.
Split It is quite common to move a column in a spreadsheet from on place toanother. The rule split copies a column to another place and substitutes theoriginal column values by references to the new column (similar to create apointer). The rule to move part of the spreadsheet is presented in Section 4.2.The first step of split is to get the column that we want to copy:
getColumn :: String → RulegetColumn h t (l ′ˆb1 ) | h ≡ l ′ = return (View idrep t)
38

4. EVOLUTION OF MODEL-DRIVEN SPREADSHEETS
If the corresponding label is found, the vertical composition is returned. Notethat as in other rules, this one is intended to be applied using the combinatoronce. As we said, we aim to write local rules that can be used at any level usingthe developed combinators.
In a second step the rule creates a new a class containing the retrieved block:
do View s c′ ← getBlock str c
let nsh =| str : (c′)↓
The last step is to transform the original column that was copied into referencesto the new column. The rule makeReferences :: String → Rule receives the labelof the column that was copied (the same as the new column) and creates thereferences. We do not shown the rest of the implementation because it is quitecomplex and will not help in the understanding of the paper.
Layout Rules We will now describe rules focused on the layout of spreadsheets,that is, rules that do not add/remove information to/from the model, but onlyrearrange it.
Change orientation The rule toVertical changes the orientation of a block fromhorizontal to vertical.
toVertical :: RuletoVertical (a p b) = return (View idrep (a ˆb))
Note that since our value-level representation of these compositions are pairs,the to and the from functions are simply the identity function. The neededinformation is kept in the type-level with the different constructors. A rule todo the inverse was also designed but since it is quite similar to this one, we donot show it here.
Normalize blocks When applying some transformations, the resulting types maynot have the correct shape. A common example is to have as result the followingtype:
A p B ˆC p DˆE p F
However, given the rules in [31] to ensure the correctness of ClassSheets, thecorrect result is the following:
A p B p DˆE p C p F
The rule normalize tries to match these cases and correct them. The types arethe ones presented above and the witness functions are combinations of π1 andπ2.
normalize :: Rulenormalize (a p b ˆc p d ˆe p f ) = do
39

4. EVOLUTION OF MODEL-DRIVEN SPREADSHEETS
let to = id× π1 × id ◦ π14π1 ◦ π24π2 ◦ π1 ◦ π2 × π2from = π1 ◦ π14π1 ◦ π2 × π1 ◦ π24π2 ◦ π2 ◦ π14id× π2 ◦ π2
return (View (Rep {to = to, from = from}) (a p b p d ˆe p c p f ))
Although the migration functions seem complex, they just rearrange the orderof the pairs so they have the correct arrangement.
Shift It is quite common to move parts of the spreadsheet across it. We designeda rule to shift parts of the spreadsheet in the four possible directions. We showhere part of the shiftRight rule, which, as suggested by its name, shifts a piece ofthe spreadsheet to the right. In this case, a block is moved and an empty blockis left in its place.
shiftRight :: Type a → RuleshiftRight ta b1 | isBlock b1 = do
Eq ← teq ta b1let rep = Rep {to = pnt (⊥ :: EmptyBlock)4id, from = π2}return (View rep (EmptyBlock p b1 ))
The function teq verifies if two types are equal. This rule receives a type and ablock, but we can easily write a wrapper function to receive a label in the samestyle of insertCol .
Another interesting case of this rules occurs when the user tries to move ablock (or a sheet) that has a reference.
shiftRight ta (Ref tb frRef toRef b1 ) | isBlock b1 = doEq ← teq ta b1let rep = Rep {to = pnt (⊥ :: EmptyBlock)4id, from = π2}return (View rep (Ref tb (frRef ◦ π2) (toRef ◦ π2) (EmptyBlock p b1 ))
As we can see in the above code, the existing reference projections must becomposed with the selector π2 to allow to retrieve the existing block b1 . Onlyafter this it is possible to apply the defined selection reference functions.
Move blocks A more complex task is to move a part of the spreadsheet to anotherplace. We present next a rule to move a block.
moveBlock :: String → RulemoveBlock str c = do
View s c′ ← getBlock str clet nsh =| str : c′
View r sh ← once (removeRedundant str) (c p nsh)return (View (comprep s r) sh)
After getting the intended block and creating a new class with it, we need toremove the old block using removeRedundant .
removeRedundant :: String → RuleremoveRedundant s (s ′) | s ≡ s ′ = do
40

5. BIDIRECTIONAL EVOLUTION OF MODEL-DRIVENSPREADSHEETS
let rep = Rep {to = pnt (⊥ :: EmptyBlock), from = pnt s ′}return (View rep EmptyBlock)
This rule will remove the block with the given label leaving an empty block inits place.
5 Bidirectional Evolution of Model-driven Spreadsheets
This section presents a bidirectional spreadsheet evolution environment. We con-struct a framework of bidirectional transformations for ClassSheets and spread-sheet instances, so that a change in an artifact is automatically reflected toits correlated one [21]. This framework provides the usual end-user operationson spreadsheets like adding a column/row or deleting a column/row, for exam-ple. These operations can be realized in either a model or an instance, and theframework guarantees the automatic synchronization of the two. This bidirec-tional engine, that we describe in detail in the next section, is defined in thefunctional programming language Haskell [47].
Finally, we extend the widely used spreadsheet system Calc, which is part ofOpenOffice, in order to provide a bidirectional model-driven environment to end-users. Evolution steps at the model and the instance level are available as newbuttons that extend the functionalities originally built-in the system. A scriptin OpenOffice Basic was developed to interpret the evolution steps and to makethe bridge with the Haskell framework. An OpenOffice extension is available atthe SSaaPP project web page: http://ssaapp.di.uminho.pt/.
In Figure 28, we present an overview of the bidirectional spreadsheet envi-ronment that we propose [24]. On the left, the embedded ClassSheet is presentedin a Model worksheet while the data instance that conforms to it is given on theright, in a Data worksheet. Both worksheets contain buttons that perform theevolution steps at the model and instance levels.
Every time a (model or instance) spreadsheet evolution button is pressed,the system responds automatically. Indeed, it was built to propagate one updateat a time and to be highly interactive by immediately giving feedback to users.A global overview of the system’s architecture is given in Figure 29.
Also, our bidirectional spreadsheet engine makes some natural assumptionson the models it is able to manipulate and restricts the number of operationsthat are allowed on the instance side.
Model evolution steps. On the model side, we assume the ClassSheet on which anediting operation is going to be performed is well-formed. By being well-formedwe mean a model respecting the original definition of ClassSheets [31], whereall references made in all formulas are correctly bound. Also, a concrete modelevolution operation is only actually synchronized if it can be applied to the initialmodel and the evolved model remains well-formed; otherwise, the operation isrejected and the original model remains unchanged. The intuition behind thisis that operations which cannot be applied to one side should not be put to theother side, but rejected by the environment. A similar postulate is made in [45].
41
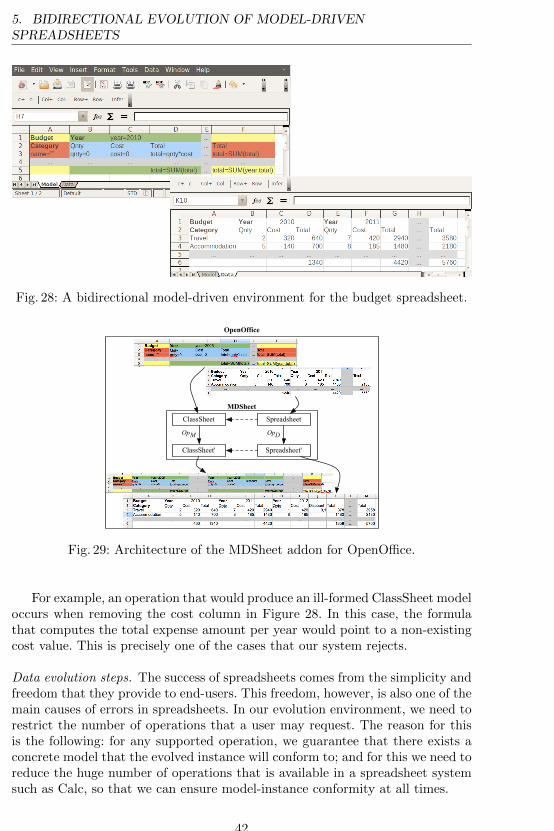
5. BIDIRECTIONAL EVOLUTION OF MODEL-DRIVENSPREADSHEETS
Fig. 28: A bidirectional model-driven environment for the budget spreadsheet.
MDSheet
ClassSheet Spreadsheet
ClassSheet' Spreadsheet'
OpM OpD
OpenOffice
Fig. 29: Architecture of the MDSheet addon for OpenOffice.
For example, an operation that would produce an ill-formed ClassSheet modeloccurs when removing the cost column in Figure 28. In this case, the formulathat computes the total expense amount per year would point to a non-existingcost value. This is precisely one of the cases that our system rejects.
Data evolution steps. The success of spreadsheets comes from the simplicity andfreedom that they provide to end-users. This freedom, however, is also one of themain causes of errors in spreadsheets. In our evolution environment, we need torestrict the number of operations that a user may request. The reason for thisis the following: for any supported operation, we guarantee that there exists aconcrete model that the evolved instance will conform to; and for this we need toreduce the huge number of operations that is available in a spreadsheet systemsuch as Calc, so that we can ensure model-instance conformity at all times.
42

5. BIDIRECTIONAL EVOLUTION OF MODEL-DRIVENSPREADSHEETS
As an example of an operation on an instance that we are not able to propa-gate to its conforming model is the random addition of data rows and columns.Indeed, if such an edit disrespects the structure of the original spreadsheet, wewill often be unable to infer a new model to which the data conforms. Therefore,the operations (such as addColumn) that may affect the structure of a spread-sheet instance need to be performed explicitly using the corresponding buttonof our framework. The remaining editing operations are performed as usually.
5.1 The MDSheet Framework
In this section, we present our framework for bidirectional transformations ofspreadsheets. The implementation is done using the functional programminglanguage Haskell and we will use some of its notation to introduce the maincomponents of our framework. After defining the data types that encode mod-els and instances, we present two distinct sets of operations over models andinstances. We then encode a bidirectional system providing two unidirectionaltransformations to and from that map operations on models into operationson instances, and operations on instances to operations on models, respectively.Figure 30 illustrates our bidirectional system:
conforms to conforms to
Op
Op
tofrom
M
D
ClassSheet
Spreadsheet
ClassSheet'
Spreadsheet'
Fig. 30: Diagram of our spreadsheet bidirectional transformational system.
Given a spreadsheet that conforms to a ClassSheet model, the user can evolvethe model through an operation of the set OpM , or the instance through anoperation of the set OpD. The performed operation on the model (data) is thentransformed into the corresponding operation on the data (model) using the toand from transformations, respectively. A new model and data are obtained withthe new data conforming to the new model.
5.2 Specification of Spreadsheets and Models
The operations defined in the next sections operate on two distinct, but similar,data types. The first data type, named Model , is used to store information abouta model. It includes the list of classes that form the model and a grid (a matrix)that contains the definition of the ClassSheet cells. The second type, Data, isused to store information about model instances, i.e., the spreadsheet data. It
43

5. BIDIRECTIONAL EVOLUTION OF MODEL-DRIVENSPREADSHEETS
also stores a list of classes and a matrix with the cell contents. The definition ofthese data types is as follows:
data Model = Model {classes :: [ModelClass ], grid :: Grid }data Data = Data {classes :: [DataClass ], grid :: Grid }
The difference between the two data types lies in the kind of classes used.Models define classes with repetitions, but do not have repetitions per se. How-ever, the data can have several instances, and that information is stored withinthe class. For a class, we store its name, the position of its top-left and bottom-right points (respectively tl and br in the data structure below) and the kind ofexpansion of the class.
data ModelClass = ModelClass {classname :: String, tl :: (Int , Int), br :: (Int , Int), expansion :: Expansion ()}
data DataClass = DataClass {classname :: String, tl :: (Int , Int), br :: (Int , Int), expansion :: Expansion Int }
In DataClass, the number of instances is stored in the expansion field. InModelClass, the expansion is used to indicate the kind of expansion of a class.It is possible to store the number of instances for horizontal and for verticalexpansions, and for classes that expand both horizontally and vertically. It isalso possible to represent static classes (i.e., that do not expand).
Having introduced data types for ClassSheet models and spreadsheet in-stances, we may now define operations on them. The next two sections presentsuch operations.
5.3 Operations on Spreadsheet Instances
The first step in the design of our transformational system is to define the op-erations available to evolve the spreadsheets. The grammar shown next definesthe operations the MDSheet framework offers.
data OpD : Data → Data =addColumnD Where Index -- add a column| delColumnD Index -- delete a column| addRowD Where Index -- add a row| delRowD Index -- delete a row| AddColumnD Where Index -- add a column to all instances| DelColumnD Index -- delete a column from all instances| AddRowD Where Index -- add a row to all instances| DelRowD Index -- delete a row from all instances| replicateD ClassName Direction Int Int -- replicate a class| addInstanceD ClassName Direction Model -- add a class instance| setLabelD (Index , Index ) Label -- set a label| setV alueD (Index , Index ) · -- set a cell value
44

5. BIDIRECTIONAL EVOLUTION OF MODEL-DRIVENSPREADSHEETS
| SetLabelD (Index , Index ) Label -- set a label in all instances| SetV alueD (Index , Index ) · -- set a cell value in all instances
To each entry in the grammar corresponds a particular function with the samearguments. The application of an update opD :OpD to a data instance d : Datais denoted by opD d : Data.
The first operation, addColumnD, adds a column in a particular place inthe spreadsheet. The Where argument specifies the relative location (Beforeor After) and the given Index defines the position where to insert the newcolumn. This solves ambiguous situations, like for example when inserting acolumn between two columns from distinct classes. The behavior of addColumnDis illustrated in Figure 31.
Before 8
A B C D E F G H I
=>addColumn D =>
A B C D E F G H I A B C D E F G ◊ H I
Fig. 31: Application of the data operation addColumnD.
In an analogous way, the second operation, delColumnD, deletes a givencolumn of the spreadsheet. The operations addRowD and delRowD behave asaddColumnD and delColumnD, but work on rows instead of on columns. Anoperation in all similar to addColumnD (delColumnD, addRowD and delRowD)is AddColumnD (DelColumnD, AddRowD and DelRowD). This operation is infact a mapping of addColumnD over all instances of a class: it adds a columnto each instance of an expandable class. The operation replicateD allows toreplicate (or duplicate) a class, with the two last integer arguments being thenumber of instances of the class provided as first argument and the numberof the instance to replicate, respectively. This operation will be useful for ourbidirectional transformation functions, and will be explained in more detail later.The operation addInstanceD performs a more complex evolution step: it adds anew instance of a given class to the spreadsheet. For the example illustrated inFigure 28, it could be used to add a new instance of the year class. The operationsdescribed so far work on sets of cells (e.g. rows and columns), whereas the lasttwo OpD operations, setLabelD and setV alueD, work on a single cell. The formerallows to set a new label to a given cell while the latter allows to update thevalue of a cell. Versions of these last two operations that operate on all instancesare also available: SetLabelD and SetV alueD, respectively.
When adding a single column to a particular instance with several columns,the chosen instance becomes different than the others. Therefore, this operationis based on two steps: firstly, the chosen instance is separated from the others(note that the second dashed line becomes a continuous line); secondly, a newcolumn, indicated by ♦, is inserted in the specified index. This operation can be
45

5. BIDIRECTIONAL EVOLUTION OF MODEL-DRIVENSPREADSHEETS
used to evolve the data of the budget example as suggested at the beginning ofthis (and illustrated in Figure 29).
5.4 Operations on Models
In this section we present the operations that allow transformations on the modelside. The grammar shown next declares the existing operations:
data OpM : Model → Model =addColumnM Where Index -- add a new column| delColumnM Index -- delete a column| addRowM Where Index -- add a new row| delRowM Index -- delete a row| setLabelM (Index , Index ) Label -- set a label| setFormulaM (Index , Index ) · -- set a formula| replicateM ClassName Direction Int Int -- replicate a class| addClassM ClassName (Index , Index ) (Index , Index ) -- add a static class| addClassExpM ClassName Direction (Index , Index ) (Index , Index )
-- add an expandable class
As it occurred with OpD for instances, the OpM grammar represents the func-tions operating on models. The application of an update opM :OpM to a modelm : Model is denoted by opM m : Model .
The first five operations are analogous to the data operations with the samename. New operations include setFormulaM which allows to define a formula ona particular cell. On the model side, a formula may be represented by an emptycell, by a default plain value (e.g., an integer or a date) or by a function appli-cation (e.g., cell F5 in Figure 28 is defined as the result of SUM(Year.total)).The operation replicateM allows to replicate (or duplicate) a class. This willbe useful for our bidirectional transformation functions. The last two opera-tions allow the addition of a new class to a model: addClassM adds a new static(non-expandable) class and addClassExpM creates a new expandable class. TheDirection parameter specifies if it expands horizontally or vertically.
To explain the operations on models, we present in Figure 32 an illustrationof the execution of the composition of two operations: firstly, we execute anaddition of a row, addRowM (where the new row is denoted by ♦); secondly, weadd a new expandable class (addClassExpM ) constituted by columns B and C(denoted by the blue rectangle and the grey column labeled with the ellipsis).
The first operation, addRowM , adds a new row to the model between rows 2and 3. The second operation, addClassExpM , adds a new class to the model. Asa first argument, this operation receives the name of the class, which is ”Blue-Class” in this case. Its second argument specifies if the class expands verticallyor horizontally (the latter in this case). The next two arguments represent theupper-left and the right-bottom indexes limiting the class, respectively. The lastargument is the model itself.
These operations allow to evolve models like the one presented in Figure ??.However, the problem suggested in Figures ?? and ??, where the data evolves
46

5. BIDIRECTIONAL EVOLUTION OF MODEL-DRIVENSPREADSHEETS
Before 3addRowM
A B C D123
A B C D12◊3
=> =>
A B C D12◊3
...
; addClassExpM "BlueClass" Horizontal (2,1) (3,4)
Fig. 32: Application of the model operations addRowM and addClassExpM .
as a result of an end-user operation and the model automatically co-evolves, isnot yet handled by transformations we presented so far. In the next section, wegive a bidirectional setting where co-evolution is automatic.
5.5 Bidirectional Transformation Functions
In this section, we present the bidirectional core of our spreadsheet transforma-tion framework. In our context, a bidirectional transformation is defined as apair of unidirectional transformations with the following signature:
to : Model × OpM → Op?Dfrom : Data × OpD → Op?M
Since these transformations are used in an online setting, in which the systemreacts immediately to each user modification, the general scheme of our trans-formations is to transform a single update into a sequence of updates. That said,the forward transformation to propagates an operation on models to a sequenceof operations on underlying spreadsheets, and the backward transformation frompropagates an operation on spreadsheets to a sequence of operations on overlyingmodels. We denote a sequence of operations on models op? as being either theempty sequence ∅, an unary operation op, or a sequence of operations op?1; op?2.Our transformations take an additional model or instance to which the origi-nal modifications are applied. This is necessary because most of the operationscalculate the indexes of the cells to be updated based on the operation itself,but also based on the previous model or spreadsheets, depending on the kind ofoperation.
We now instantiate the to and from transformations for the operations onmodels and instances defined in the previous two sections. We start by presentingthe to transformation: it receives an operation on models and returns a sequenceof operations on data. Although, at least currently, the translation of modeloperations returns an empty or singleton sequence of data operations, we keepits signature consistent with from to facilitate its understanding and evidencethe symmetry of the framework.
to :OpM → Op?Dto (addColumnM w i ) = AddColumnD w (columnIndexD i)to (delColumnM w i ) = DelColumnD (columnIndexD i)to (addRowM w i ) = AddRowD w (rowIndexD i)
47
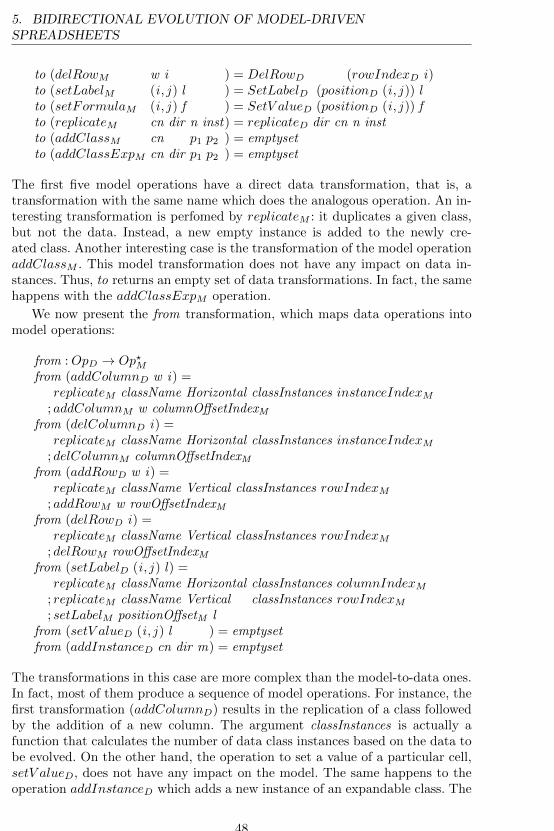
5. BIDIRECTIONAL EVOLUTION OF MODEL-DRIVENSPREADSHEETS
to (delRowM w i ) = DelRowD (rowIndexD i)to (setLabelM (i , j ) l ) = SetLabelD (positionD (i , j )) lto (setFormulaM (i , j ) f ) = SetV alueD (positionD (i , j )) fto (replicateM cn dir n inst) = replicateD dir cn n instto (addClassM cn p1 p2 ) = emptysetto (addClassExpM cn dir p1 p2 ) = emptyset
The first five model operations have a direct data transformation, that is, atransformation with the same name which does the analogous operation. An in-teresting transformation is perfomed by replicateM : it duplicates a given class,but not the data. Instead, a new empty instance is added to the newly cre-ated class. Another interesting case is the transformation of the model operationaddClassM . This model transformation does not have any impact on data in-stances. Thus, to returns an empty set of data transformations. In fact, the samehappens with the addClassExpM operation.
We now present the from transformation, which maps data operations intomodel operations:
from :OpD → Op?Mfrom (addColumnD w i) =
replicateM className Horizontal classInstances instanceIndexM; addColumnM w columnOffsetIndexM
from (delColumnD i) =replicateM className Horizontal classInstances instanceIndexM
; delColumnM columnOffsetIndexMfrom (addRowD w i) =
replicateM className Vertical classInstances rowIndexM; addRowM w rowOffsetIndexM
from (delRowD i) =replicateM className Vertical classInstances rowIndexM
; delRowM rowOffsetIndexMfrom (setLabelD (i , j ) l) =
replicateM className Horizontal classInstances columnIndexM; replicateM className Vertical classInstances rowIndexM; setLabelM positionOffsetM l
from (setV alueD (i , j ) l ) = emptysetfrom (addInstanceD cn dir m) = emptyset
The transformations in this case are more complex than the model-to-data ones.In fact, most of them produce a sequence of model operations. For instance, thefirst transformation (addColumnD) results in the replication of a class followedby the addition of a new column. The argument classInstances is actually afunction that calculates the number of data class instances based on the data tobe evolved. On the other hand, the operation to set a value of a particular cell,setV alueD, does not have any impact on the model. The same happens to theoperation addInstanceD which adds a new instance of an expandable class. The
48

5. BIDIRECTIONAL EVOLUTION OF MODEL-DRIVENSPREADSHEETS
definition of from for the (non-empty) data operations in the range of to (e.g.,AddColumnD, DelRowD) is simply the inverse of to.
5.6 Bidirectional Transformation Properties
Since the aim of our bidirectional transformations is to restore the conformitybetween instances and models, a basic requirement is that they satisfy correct-ness [62] properties entailing that propagating edits on spreadsheets or on modelsleads to consistent states:
d :: m
(to m opM ) d :: opM mto-Correct
d :: m
opD d :: (from d opD) mfrom-Correct
Here, we say that a data instance d conforms to a model m if d :: m, for abinary consistency relation (::) ⊆ Data × Model .
As most interesting bidirectional transformation scenarios, spreadsheet in-stances and models are not in bijective correspondence, since multiple spread-sheet instances may conform to the same model, or vice versa. Another bidi-rectional property, hippocraticness [62], postulates that transformations are notallowed to modify already consistent pairs, as defined for from:
d :: m opD d :: m
from d opD = ∅from-Hippocratic
Reading the above law, if an operation on data opD preserves conformitywith the existing model, then from produces an empty sequence of operationson models ∅. Operationally, such a property is desired in our framework. Forexample, if a user adds a new instance to an expandable class, preserving con-formity, the original model is expected to be preserved because it still reflectsthe structure of the data. However, hippocracticness for to is deemed too strongbecause even if the updated model is still consistent with the old data, we stillwant to update the data to reflect a change in the structure, making a bettermatch with the model [29]. For example, if the user adds a column to the model,the intuition is to insert also a new column to the data, even if the old dataremains consistent.
Usually, bidirectional transformations are required to satisfy “round-tripping”laws that ensure a certain degree of invertibility [30, 36]. In our application,spreadsheet instances refine spreadsheet models, such that we can undo thetranslation of an operation on models with an application of from (except whenthe operation on models only concerns layout, such as addClassM , and is notreflexible on the data):
to m opM = op?D op?D 6= ∅ d :: m
from? d op?D = opMto-Invertible
However, the reverse implication is not true. For example, the transforma-tion steps from addColumnD = replicateM ; addColumnM and to? (replicateM ;addColumnM ) = replicateD;AddColumnD do not give equal data operation.
49

6. MODEL-DRIVEN SPREADSHEET DEVELOPMENT IN MDSHEET
Since an operation on data may issue a sequence of operations on models,we introduce the transformation to? which applies to to a sequence of operations:
to? ∅ = ∅ to? opM = to opM
to? opM?1 = opM
?1 to? opM
?2 = opM
?2
to? (opM?1; opM?
2) = to? opM?1; to? opM?
2
A dual definition can be given for from?. As common for incremental trans-formations (that translate edits rather than whole states), our sequential trans-formations naturally satisfy an history ignorance [29] property meaning that thetranslation of consecutive updates does not depend on the update history.
6 Model-Driven Spreadsheet Development in MDSheet
The embedding and evolution techniques presented previously have been im-plemented as an add-on to a widely used spreadsheet system, the OpenOf-fice/LibreOffice system. The add-on provides a model-driven spreadsheet de-velopment environment, named MDSheet, where a (model-driven) spreadsheetconsists of two type of worksheets: Sheet 0, containing the embedded Class-Sheet model, and Sheet 1, containing the spreadsheet data that conforms to themodel. Users can interact both with the ClassSheet model and the spreadsheetdata. Our techniques guarantee the synchronization of the two representations.
In such an model-driven environment, users can evolve the model by usingstandard editing/updating techniques as provided by spreadsheets systems. Ouradd-on/environment also provides predefined buttons that implement the usualClassSheets evolution steps. Each button implements an evolution rule, as de-scribed in Section 4. For each button, we defined a Basic script that interpretsthe desired functionality, and sends the contents of the spreadsheet (both themodel and the data) to our Haskell-based co-evolution framework. This Haskellframework implements the co-evolution of the spreadsheet models and data pre-sented in Section 4.
MDSheet also allows the development of ClassSheet models from scratchby using the provided buttons or by traditional editing. In this case, a firstinstance/spreadsheet is generated from the model which includes some businesslogic rules that assist users in the safe and correct introduction/editing of data.For example, in the spreadsheet presented in Figure 28, if the user presses thebutton in column H, four new columns will automatically be inserted so theuser can add more flights. This automation will also automatically update allformulas in the spreadsheet.
The global architecture of the model-driven spreadsheet development we con-structed is presented in Figure 33.
Tool and demonstration video availability The MDSheet tool [24] and a videowith a demonstration of its capabilities are available at
http://ssaapp.di.uminho.pt.
50

6. MODEL-DRIVEN SPREADSHEET DEVELOPMENT IN MDSHEET
Sync
Sync
Button pressed
Sheet 0Sheet 1
Sheet 0Sheet 1
From the model MDSheet generates a template
Haskell ClassSheet data type
Application of evolution rule chosen by the user
New Haskell ClassSheet data type
Forward and backward transformations
New Haskell spreadsheet representation
BASIC sends sheet 1 (data) to MDSheet the back-end
Haskell spreadsheet representation
Application of the forward/backward tansformation
BASIC sends sheet 0 (model) to the MDSheet back-end
Fig. 33: Model-driven spreadsheet development environment.
In the next section we present in detail the empirical study we have organizedand conducted to assess model-driven spreadsheets running through MDSheet.
51

7. MODEL-DRIVEN SPREADSHEETS: AN EMPIRICAL STUDY
7 Model-driven Spreadsheets: An Empirical Study
In the context of software engineering research, empirical validation is widelyrecognized as essential in order to assess the validity of newly proposed tech-niques or methodologies [69]. While our previous works on the construction of amodel-driven spreadsheet development environment have received good feedbackfrom the research community, the fact is that their assessment in a realistic andpractical context was still lacking. In this line, we have designed an empiricalstudy that we describe in this section and whose results we also analyze in detailhere.
The experiment that we envisioned is then motivated by the need to under-stand the differences in individual performance that users achieve under MD-Sheet (using what we call model-driven spreadsheets) against traditional spread-sheet systems (from now on termed plain). The perspective of the experiment isfrom the point of view of a researcher who would like to know whether there isa systematic difference in the users performance.
In the remaining of this section we go in detail through the different stagesthat we underwent in preparing and designing our study (Section 7.1), in runningit (Section 7.2), and in analyzing (Section 7.3) and interpreting (Section 7.4) theresults that were generated which are discussed afterwards (Section 7.5). Finally,we can summarize the scope of this study as suggested in [69] as follows:
Analyze the spreadsheet development processfor the purpose of evaluationwith respect to its effectiveness and efficiencyfrom the point of view of the researcherin the context of the usage of two different spreadsheets by Master stu-dents.
7.1 Design
The goal of our study is to analyze several aspects of spreadsheet development,and to evaluate the implications of using a model-driven approach against themore commonly used approach of designing and introducing spreadsheet datafrom scratch and immediately within spreadsheets themselves.
The study that we conducted was designed for a controlled environmentmostly because our tool was never tested in production. In order to achieve thiscontrolled environment, we decided to perform the study in an off-line setting(in an academic environment and not in industry), and with university studentsattending a Master’s degree. Nevertheless, our study analyzes the specific useof ClassSheet-based models, and does not consider generic model-driven spread-sheet development. Finally, in our study, participants were asked to solve realisticproblems, in situations that were closely adapted from real-world situations.
Hypotheses MDSheet uses ClassSheet-based models to specify spreadsheets,hence it benefits from ClassSheet advantages such as: i) users being alleviated
52

7. MODEL-DRIVEN SPREADSHEETS: AN EMPIRICAL STUDY
of the need to deal directly with formula references, or ii) to identify partsof the spreadsheet that are repeatable (class expansions). In theory, i) reducesthe number of errors and ii) improves spreadsheet development performance.However, this needs to be tested. Thus, we can informally state two hypotheses:
1. In order to perform a given set of tasks, users spend less time when usingmodel-driven spreadsheets instead of plain ones.
2. Spreadsheets developed in the model-driven environment hold less errorsthan plain ones.
Formally, two hypotheses are being tested: HT for the time that is needed toperform a given set of tasks, and HE for the error rate found in different typesof spreadsheets. They are respectively formulated as follows:
1. Null hypothesis, HT0: The time to perform a given set of tasks using MD-
Sheet is not lesser than with plain spreadsheets. HT0 : µd 6 0, where µd isthe expected mean of the time differences.
Alternative hypothesis, HT1: µd > 0, i.e., the time to perform a given set of
tasks using MDSheet is lesser than with plain spreadsheets.
Measures needed : time taken to perform the tasks.
2. Null hypothesis, HE0: The error rate in spreadsheets when using MDSheet
is not smaller than with plain spreadsheets. HE0 : µd 6 0, where µd is theexpected mean of the differences of the error rates.
Alternative hypothesis, HE1: µd > 0, i.e., the error rate when using MDSheet
is smaller than with plain spreadsheets.
Measures needed : error rate for each spreadsheet.
Variables The independent variables are: for HT the time to perform the tasks,and for HE the error rate.
Subjects and Objects The subjects for this study were first year Masterstudents undergoing a course on Analysis and Construction of Software at Uni-versidade do Minho. Out of a total number of 30 students that were invited,17 actually accepted the invitation and participated in our study. More detailsabout the subjects participating in the study are presented in Section 7.3.
The objects for the study consisted in three different kinds of spreadsheetsthat are described later in this paper, in Section 7.1. One spreadsheet was usedto support a in-study tutorial that was given to participants before they wereactually asked to perform a series of tasks on the model-driven versions of theremaining two spreadsheets. This design choice attempts to minimize the threatsto construct validity, namely the mono-operation bias (please refer to Section 7.4for more details on threats to validity).
53

7. MODEL-DRIVEN SPREADSHEETS: AN EMPIRICAL STUDY
Design In our study, we followed a standard design with one factor and twotreatments, as presented in [69]. The factor is the development method, that is,spreadsheet development without using MDSheet. The treatments are plain andmodel-driven. The dependent variables are measurable in a ratio scale, and hencea parametric test is suitable.
Moreover, blocking is provided in the sense that each hypothesis is tested in-dependently for each object. This enables to reduce the impact of the differencesbetween the two spreadsheets.
Instrumentation As we have been describing, our study was supported bythree distinct kinds of spreadsheets. For the spreadsheet that was used in thetutorial, we have only constructed its model-driven version, but for the tworemaining spreadsheets we have used both their model-driven and plain versions.
The spreadsheet that was used in the tutorial was designed to record (sim-plified) information on the flights of an airline company, namely its planes, theircrew and the meals available on-board. As for the two remaining kinds of spread-sheets, they were selected based on their practical interest: one of them, fromnow on termed budget, is an adapted version of the Personal budget worksheetthat is available from Microsoft Office’s webpage21, and that was received over4 million downloads; the other, payments is an adapted version of a spreadsheetthat is being used to register the entire information regarding the payments thatoccur in the municipal company agere22 that is responsible for the water supplyin the city of Braga, Portugal. In order to be usable, we have reduced the sizeof both spreadsheets, without changing their complexity.
Guidelines were also provided to participants: they consist of the list of tasksto be performed. From this list, we present the two following task excerpts, beingthe first associated with budget and the second with payments:
i) “Add a new month to the spreadsheet, and in that month insert the followingdata [...].”
ii) “Remove all the information regarding payments of kind [...].”
In order to realize the background of the subjects and the difficulties theyexperienced when participating in the study, two questionnaires were prepared:one answered before the study itself (pre-questionnaire) and another after (post-questionnaire).
The data collected consists in the modified spreadsheets by the participants,and some information about the performance of our model-driven environment.For that, the MDSheet addon was modified in order to provide a log of the useractions when working with the model-driven spreadsheet. This log contains theaction performed (e.g., “add instance” and “remove class”), and how much timeeach action took.
21 http://office.microsoft.com/en-us/templates/personal-budget-worksheet-TC006206279.aspx
22 http://www.agere.pt/
54
7. MODEL-DRIVEN SPREADSHEETS: AN EMPIRICAL STUDY
Data Collection Procedure To run the study, the following steps were planned:
1. Filling the pre-questionnaire.2. Performing the sets of tasks on the two plain spreadsheets, with a time limit
of fifteen minutes.3. Attending the tutorial on MDSheet.4. Performing the sets of tasks on the two model-driven spreadsheets, with a
time limit of fifteen minutes.5. Filling the post-questionnaire.6. Collecting all spreadsheets, questionnaires and logs.
In steps (3) and (6), our team was expected to have a direct participation,giving the tutorial in step (3) and retrieving, in step (6), all the artifacts usedor created by the subjects.
All the subjects of our study were expected to perform the two sets of taskson the respective spreadsheets. The goal of the study is not to compare onespreadsheet against another, but instead to compare two methods to developspreadsheets. This means that the order by which users address each of thetwo spreadsheet problem domains is not important. In fact, it is the order ofthe treatments that is important: first the subjects performed the tasks withplain spreadsheets, and then they performed the tasks within the model-drivenenvironment. Again, this design choice attempts to minimize the learning effectsbetween treatments and so the validity threats.
Analysis Procedure and Evaluation of Validity The analysis of the col-lected data is achieved performing paired tests where the performance of eachsubject on the plain version of the spreadsheet is tested against the model-drivenversion. For this, the following tests are available: paired t-test, Wilcoxon signrank test, and the dependent-samples sign-test.
To ensure the validity of the data collected, several kinds of support wereplanned: constant availability to clarify any doubt, tutorial to teach the model-driven development process, and supervise lightly the work done by the subjectsin a way that do not interfere with their work. This last point consists in navi-gating through the room and see which subjects look like having problems andtry to help them if it is about something that does not influence the results ofthe study.
7.2 Execution
The study was performed in a classroom with seventeen university students, allat the same time.
The participants first started filling the pre-questionnaire, with generic infor-mation about them (gender, age range, and undergraduate major). They also an-swered some questions so we could assess their previous experience with spread-sheets.
55

7. MODEL-DRIVEN SPREADSHEETS: AN EMPIRICAL STUDY
While they filled the questionnaire, we checked if their environment was cor-rectly set. This environment consisted in a virtual machine with Lubuntu 11.10as the installed operating system, where we pre-installed LibreOffice Calc, andour addon – MDSheet. At this stage, one of the subjects (subject 7) could notset up correctly the environment and its data was not taken into account for theanalysis.
Then, the list of tasks to be done was distributed amongst the participants,and they had fifteen minutes to perform all the tasks on the spreadsheets, butwithout the assistance of our framework.
Before telling the participants to perform the tasks on the spreadsheets withthe models, they attended the tutorial that we prepared on how to use theMDSheet framework. During the tutorial, we answered all the questions thatthe participants had, making sure that they could use the framework.
Having teached the participants how to use the framework, the subjects hadfifteen minutes to perform the tasks using the model-driven spreadsheets.
At the end, we gave the post-questionnaire to the participants to evaluatethe confidence that they had on their performance during the study. Finally, wecollected the modified spreadsheet files, so that we could analyze them later on.
7.3 Analysis
Descriptive Statistics
Subjects Basic information about the subjects was gathered, namely their gen-der, age, studies’ background, and familiarity with spreadsheets. All subjects aremales, with ages between 20 and 25 years old, with background in informaticsor computer science. All subjects have previously worked with spreadsheets, butwith different levels of experience.
Time spent As expected, differences were found in the time that subjects usedto perform the tasks. We will now show in detail these differences.
Table 1 presents some interesting numbers collected from the results achievedby participants in the budget spreadsheet.
Table 1: Budget times.Min Max Average
Plain 579 900 761
Model-Driven 234 743 417
The minimum time achieve was from a participant using the model-drivenenvironment. On the other hand, the slowest one was recorded when using theplain spreadsheet. Indeed, in average, participants using model-driven spread-sheets were faster than using the plain spreadsheet. Figure 34 shows the time
56

7. MODEL-DRIVEN SPREADSHEETS: AN EMPIRICAL STUDY
each participant took to achieve the given tasks, both with and without themodel-driven environment, for the budget spreadsheet.
1 2 3 4 6 8 9 10 11 12 13 14 16 170
200
400
600
800
1000
Plain
Model-Driven
Subject
Tim
e (s
)
Fig. 34: Time used to perform the tasks on the budget spreadsheet.
Table 2 presents some interesting numbers recorded when participants workedon the payments spreadsheet.
Table 2: Payments times.Min Max Average
Plain 487 900 810
Model-Driven 224 640 367
Once again we can see that the results obtained for the budget spreadsheethold for the payments one. Figure 35 presents all the times recorded for thepayments spreadsheet.
1 2 3 4 5 6 8 9 10 11 13 14 15 16 170
200
400
600
800
1000
Plain
Model-Driven
Subject
Tim
e (s
)
Fig. 35: Time used to perform the tasks on the payments spreadsheet.
57

7. MODEL-DRIVEN SPREADSHEETS: AN EMPIRICAL STUDY
As a consequence of these results some subjects did not perform all thegiven tasks. When using model-driven spreadsheets, some tasks were not fullyperformed in the budget spreadsheet, maybe due to oblivion (e.g., the subjectadded an instance of a class, but did not insert the values).
In the results for the budget spreadsheet (Figure 36), three subjects did notfinish all the tasks using the model-driven environment, while only one subjectdid all of them without the model-driven environment (subject 14).
1 2 3 4 6 8 9 10 11 12 13 14 16 170%
20%
40%
60%
80%
100%
Plain
Model-Driven
Participant
Com
pletio
n
Fig. 36: Number of tasks performed on the budget spreadsheet.
In the results for the payments spreadsheet (Figure 37), only one subject didnot finish all the tasks using the model-driven environment (subject 10), while,similarly to the results of the budget spreadsheet, only one subject did all of themwithout the model-driven environment (subject 9). However, the percentage ofaccomplishment of the tasks is lower for the plain payments spreadsheet thanfor the plain budget spreadsheet.
1 2 3 4 5 6 8 9 10 11 13 14 15 16 170%
20%
40%
60%
80%
100%
Plain
Model-Driven
Subject
Completion
Fig. 37: Number of tasks performed on the payments spreadsheet.
58

7. MODEL-DRIVEN SPREADSHEETS: AN EMPIRICAL STUDY
Error rates To evaluate the correctness of the spreadsheets produced during thestudy, error rates are used. Absolute numbers cannot be used, since not all thesubjects did all asked tasks.
The error rates for the budget spreadsheet are not very high, but some ex-ceptions are present (see Figure 38). Note that even when the error rate of plainspreadsheets is high, the error rate of model-driven spreadsheets is low, which isdue to the reduced kinds of mistakes that can be done when using models. More-over, three subjects did not make any error when using either kind of spreadsheet– without models or with models.
1 2 3 4 6 8 9 10 11 12 13 14 16 170%
20%
40%
60%
80%
100%
Plain
Model-Driven
Subject
Err
or R
ate
Fig. 38: Error rate in the budget spreadsheet.
For the payments spreadsheet, all subjects made mistakes when workingwith the version without model (see Figure 39). When using models, most of thesubjects did not make mistakes.
1 2 3 4 5 6 8 9 10 11 13 14 15 16 170%
20%
40%
60%
80%
100%
Plain
Model-Driven
Subject
Err
or R
ate
Fig. 39: Error rate in the payments spreadsheet.
Hypothesis Testing The significance level used throughout the evaluation ofall the tests is 0.05. The evaluation of the tests was performed using the Renvironment for statistical computing [58].
59
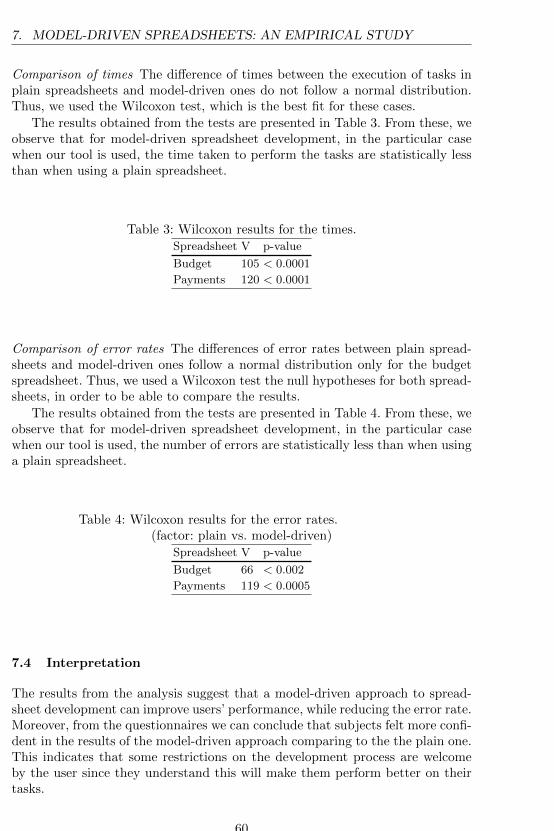
7. MODEL-DRIVEN SPREADSHEETS: AN EMPIRICAL STUDY
Comparison of times The difference of times between the execution of tasks inplain spreadsheets and model-driven ones do not follow a normal distribution.Thus, we used the Wilcoxon test, which is the best fit for these cases.
The results obtained from the tests are presented in Table 3. From these, weobserve that for model-driven spreadsheet development, in the particular casewhen our tool is used, the time taken to perform the tasks are statistically lessthan when using a plain spreadsheet.
Table 3: Wilcoxon results for the times.Spreadsheet V p-value
Budget 105 < 0.0001
Payments 120 < 0.0001
Comparison of error rates The differences of error rates between plain spread-sheets and model-driven ones follow a normal distribution only for the budgetspreadsheet. Thus, we used a Wilcoxon test the null hypotheses for both spread-sheets, in order to be able to compare the results.
The results obtained from the tests are presented in Table 4. From these, weobserve that for model-driven spreadsheet development, in the particular casewhen our tool is used, the number of errors are statistically less than when usinga plain spreadsheet.
Table 4: Wilcoxon results for the error rates.(factor: plain vs. model-driven)
Spreadsheet V p-value
Budget 66 < 0.002
Payments 119 < 0.0005
7.4 Interpretation
The results from the analysis suggest that a model-driven approach to spread-sheet development can improve users’ performance, while reducing the error rate.Moreover, from the questionnaires we can conclude that subjects felt more confi-dent in the results of the model-driven approach comparing to the the plain one.This indicates that some restrictions on the development process are welcomeby the user since they understand this will make them perform better on theirtasks.
60

7. MODEL-DRIVEN SPREADSHEETS: AN EMPIRICAL STUDY
Threats to validity The goal of the study is to demonstrate a causal rela-tionship between the use of a model-driven approach and improvements in thespreadsheet development process. Moreover, this study is defined to ensure thatthe actual setting used represents the theory we developed.
Next, validity threats for this study are analyzed, divided in four categories asdefined in [15], namely: conclusion validity, internal validity, construct validity,and external validity.
Conclusion validity The main concern is the low statistical power due to thelow number of participants. To overcome this issue more powerful statisticaltests were performed where possible, having always into account the necessaryassumptions.
Problems related to measures can also arise, e.g., the times that the subjectstook to perform the tasks. Nevertheless no significant differences to the realvalues are expected. Moreover, subjects performed the same tasks and in an en-vironment that they are used to. Also, subjects have a similar background, whichminimizes the risk of the variation being due to do individual differences insteadof the use of different treatments, but introduces problems when generalizing(see further on).
Internal validity In order to minimize the effects on the independent variablesthat would reflect on the causality, several actions were taken. First, this study,with these subjects, is realized only one time, starting with plain spreadsheetsand subsequently with the model-driven environment, which limits learning ef-fects. Second, the time to perform the study was reduced as much as possibleso that the subjects could remain focused during all the study. Third, the in-struments used (e.g., spreadsheets and questionnaires) were defined so that wecould collect just what was needed. Fourth, all the subjects performed the sametasks, so issues from having different groups with distinct treatments do notarise. Specifying as much as possible the study, we obtained more control andreduced possible internal validity threats.
Construct validity For this validity, several hypotheses to cover the aspects toanalyze were defined with much detail, and mono-operation bias was reducedusing two spreadsheets to collect data. Furthermore, the subjects were guaran-teed to not be affected by this study, since they were not under evaluation (thiswas said to them several times during the study execution), and they were putat ease so that they would perform as much like in a real-world setting.
External validity This validity is related to the ability to generalize the results ofthe experiment to industrial practice. For that, the spreadsheets used to collectthe data were based on real-world ones. However, since this study was performedwith a small homogeneous group, the results from this study cannot be general-ized without analyzing the domain where to apply.
61

7. MODEL-DRIVEN SPREADSHEETS: AN EMPIRICAL STUDY
Inferences Since this study was performed in a very specific setting, we cannotgeneralize to every case. Nevertheless, our setting was the most similar possibleto a real one, where spreadsheets were based on real ones and Master studentsstudies can come close to ones with professionals [46], so the results could beas if it was performed in a industry setting with professionals. This can bringthe possibility that model-driven spreadsheet development can be useful, andstudies in the industry can be used to assess the methodology in specific cases.
7.5 Discussion
The empirical study we conducted reveals very promising results for model-driven spreadsheets. Although participants had little time to learn model-drivenspreadsheets, they completed their tasks faster and with less errors using suchspreadsheets compared to the ones without models. This suggests that with littletraining user can greatly benefit from the use of models guiding spreadsheetusers. Moreover, as we theorized, it was apparently easy to use the model-drivensetting in an environment users are used to, that is, a spreadsheet system.
Nevertheless, from the study results we can also see how to improve ourframework. The errors committed by participants in the model-driven environ-ment were similar to the ones found in the plain spreadsheets. Two kinds oferrors were found: values (correct or incorrect) inputted in the wrong cell andincorrect inputted values (in the correct cell). To improve the input values in thewrong place we believe we are in conditions to propose some possible solutions:
– Labels’ context: as often happens in spreadsheets, the ones we gave to par-ticipants had blocks of cells repeated over columns/rows (e.g. payments overmonths, budgets over years). Given this scenario, it is quite easy to scroll overthe spreadsheet and lose visual contact with labels. In general this holds forlarge spreadsheets. We believe that to keep labels always visible would helpusers to input the values in the correct cells. Thus, we plan to make labelsas visible as possible. This can be achieve in two ways: first, one could usethe spreadsheet mechanism that allows to keep some columns/rows visiblealways ensuring that labels are visible; second, given that our spreadsheetshave a corresponding model where labels are known, MDSheet could repeatlabel cells every number of columns/rows it would see appropriate, or itcould also suggest the person creating the model to repeat such labels whenagain it would see fit.
– Complete row/column context: we believe the previous solution can stillbe improved. Even with labels visible, if the user is inputing values “far”from labels, it can be error-prone. A possible helper mechanism would beto highlight the column/row corresponding to the cell the user is currentlyselecting. This would give extra context to the users’ actions and wouldpossibly minimizing inputing values in the wrong cells.
Both solutions proposed need, of course, to be empirically validated. Weplan to include them in MDSheet and pursue further validation of each andcombinations of them.
62

8. CONCLUSION
To improve the second problem, the wrong values, we propose the integrationof known techniques such as testing [1–4,34,35,60] and smell finders [10,22,42,43].It is quite difficult to know if an inputted value is correct or not, but testingtechniques could aid the user to know better. Moreover, smells can help users tosearch for places that can be potentially dangerous in the sense that errors canarise from those spreadsheet locations.
8 Conclusion
This document presents a set of techniques and tools to analyze and evolvespreadsheets. First, it presents data mining and database techniques to infera ClassSheet that represents the business logic of spreadsheet data. Next, wepresent model-driven engineering techniques to evolve the model/instance andhave the instance/model automatically co-evolved. This techniques are imple-mented in the MDSheet framework: a plug-in for widely used, open source,spreadsheet system.
These techniques have been described in great detail in several PhD andMSc thesis, and in research papers. These documents, together with the MD-Sheet framework are available at the SSaaPP - Spreadsheets as a ProgrammingParadigm project’s webpage:
http://ssaapp.di.uminho.pt
Acknowledgments
The theories, techniques and tools presented in this tutorial paper were devel-oped under the project SSaaPP - SpreadSheets as a Programming Paradigm: aresearch project funded by the Portuguese Science Foundation (contract num-ber FCOMP-01-0124-FEDER-010048). We would like to thank the members andconsultants of this project who made important contributions for the resultspresented in this document, namely: Rui Maranhao Abreu, Tiago Alves, LauraBeckwith,, Orlando Belo, Martin Erwig, Pedro Martins, Jorge Mendes, HugoPacheco, Christophe Peixoto, Rui Pereira, Alexandre Perez, Hugo Ribeiro, AndreRiboira, Andre Silva, and Joost Visser.
References
1. Abraham, R., Erwig, M.: UCheck: A spreadsheet type checker for end users. J.Vis. Lang. Comput. 18(1), 71–95 (2007)
2. Abraham, R., Erwig, M.: Autotest: A tool for automatic test case generation inspreadsheets. In: Proceedings of the 2006 IEEE Symposium on Visual Languagesand Human-Centric Computing (VL/HCC ’06). pp. 43–50. IEEE Computer Soci-ety (2006)
63

8. CONCLUSION
3. Abraham, R., Erwig, M.: Goaldebug: A spreadsheet debugger for end users. In:ICSE ’07: Proceedings of the 29th international conference on Software Engineer-ing. pp. 251–260. IEEE Computer Society, Washington, DC, USA (2007)
4. Abraham, R., Erwig, M.: Mutation operators for spreadsheets. IEEE Trans. Soft-ware Eng 35(1), 94–108 (2009), http://dx.doi.org/10.1109/TSE.2008.73
5. Abraham, R., Erwig, M., Kollmansberger, S., Seifert, E.: Visual Specificationsof Correct Spreadsheets. In: VL/HCC’05: IEEE Symp. on Visual Languages andHuman-Centric Computing. pp. 189–196. IEEE Computer Society (2005)
6. Abraham, R., Erwig, M., Kollmansberger, S., Seifert, E.: Visual Specificationsof Correct Spreadsheets. In: Proceedings of the 2005 IEEE Symposium on Vi-sual Languages and Human-Centric Computing. pp. 189–196. VL/HCC ’05, IEEEComputer Society (2005), http://dx.doi.org/10.1109/VLHCC.2005.70
7. Aho, A.V., Sethi, R., Ullman, J.D.: Compilers: Principles, Techniques and Tools.Addison Wesley (1986)
8. Alhajj, R.: Extracting the extended entity-relationship model from a legacy rela-tional database. Information Systems 28(6), 597 – 618 (2003)
9. Alves, T., Silva, P., Visser, J.: Constraint-aware Schema Transformation. In: TheNinth International Workshop on Rule-Based Programming (2008)
10. Asavametha, A.: Detecting Bad Smells in Spreadsheets. Master’s thesis, OregonState University (2012)
11. Bricklin, D.: VisiCalc: Information from its creators, Dan Bricklin and BobFrankston, http://www.bricklin.com/visicalc.htm, http://www.bricklin.
com/visicalc.htm (last retrieved: 2012-09-01)
12. Bruins, E.: On Plimpton 322. Pythagorean Numbers in Babylonian Mathematics.Koninklijke Nederlandse Akademie van Wetenschappen 52, 629–632 (1949)
13. Chiang, F., Miller, R.J.: Discovering data quality rules. The Proceedings of theVLDB Endowment. 1, 1166–1177 (August 2008)
14. Codd, E.F.: A relational model of data for large shared data banks. Commun.ACM 13(6), 377–387 (1970)
15. Cook, T.D., Campbell, D.T.: Quasi-experimentation: design & analysis issuesfor field settings. Houghton Mifflin (1979), http://books.google.pt/books?id=9Up-AAAAIAAJ
16. Cunha, A., Oliveira, J., Visser, J.: Type-safe two-level data transformation. In:Misra, J., et al. (eds.) Proc. Formal Methods, 14th Int. Symp. Formal MethodsEurope. LNCS, vol. 4085, pp. 284–299. Springer (2006)
17. Cunha, A., Visser, J.: Strongly typed rewriting for coupled software transformation.ENTCS 174(1), 17–34 (2007), 7th Workshop on Rule-Based Programming
18. Cunha, A., Visser, J.: Transformation of structure-shy programs: applied to XPathqueries and strategic functions. In: Ramalingam, G., Visser, E. (eds.) Proceedingsof the 2007 ACM SIGPLAN Workshop on Partial Evaluation and Semantics-basedProgram Manipulation, 2007, Nice, France, January 15-16, 2007. pp. 11–20. ACM(2007)
19. Cunha, J., Erwig, M., Saraiva, J.: Automatically inferring classsheet models fromspreadsheets. In: VL/HCC’10: IEEE Symp. on Visual Languages and Human-Centric Computing. pp. 93–100. IEEE Computer Society (2010)
20. Cunha, J., Fernandes, J.a.P., Mendes, J., Saraiva, J.a.: Extension and implementa-tion of classsheet models. In: Proceedings of the 2012 IEEE Symposium on VisualLanguages and Human-Centric Computing. pp. 19–22. VLHCC ’12, IEEE Com-puter Society, Washington, DC, USA (2012)
64

8. CONCLUSION
21. Cunha, J., Fernandes, J.P., Mendes, J., Pacheco, H., Saraiva, J.: Bidirectionaltransformation of model-driven spreadsheets. In: ICMT ’12. LNCS, vol. 7307, pp.105–120. Springer (2012)
22. Cunha, J., Fernandes, J.P., Mendes, J., Hugo Pacheco, J.S.: Towards a Catalogof Spreadsheet Smells. In: The 12th International Conference on ComputationalScience and Its Applications. ICCSA’12, vol. 7336, pp. 202–216. LNCS (2012)
23. Cunha, J., Fernandes, J.P., Mendes, J., Martins, P., Saraiva, J.: Smellsheet de-tective: A tool for detecting bad smells in spreadsheets. In: Proceedings of the2012 IEEE Symposium on Visual Languages and Human-Centric Computing. pp.243–244. VLHCC ’12, IEEE Computer Society, Washington, DC, USA (2012)
24. Cunha, J., Fernandes, J.P., Mendes, J., Saraiva, J.: MDSheet: A framework formodel-driven spreadsheet engineering. In: Proc. of the 34rd Int. Conf. on SoftwareEngineering (ICSE). pp. 1412–1415. ACM (2012)
25. Cunha, J., Fernandes, J.P., Saraiva, J.: From Relational ClassSheets toUML+OCL. In: Proc. of the Sof. Eng. Track at the 27th Annual ACM SymposiumOn Applied Computing. pp. 1151–1158. ACM (2012)
26. Cunha, J., Mendes, J., Fernandes, J.P., Saraiva, J.: Embedding and evolution ofspreadsheet models in spreadsheet systems. In: IEEE Symp. on Visual Lang. andHuman-Centric Comp. pp. 186–201. IEEE (2011)
27. Cunha, J., Saraiva, J., Visser, J.: From spreadsheets to relational databases andback. In: PEPM’09: Proc. of the 2009 ACM SIGPLAN workshop on Partial Eval-uation and Program manipulation. pp. 179–188. ACM (2009)
28. Cunha, J., Visser, J., Alves, T., Saraiva, J.: Type-safe evolution of spreadsheets. In:Proc. of the 14th Int. Conf. on Fundamental Approaches to Software Engineering(FASE). pp. 186–201. Springer-Verlag (2011)
29. Diskin, Z.: Algebraic models for bidirectional model synchronization. In: MoDELS2008. pp. 21–36. Springer (2008)
30. Diskin, Z., Xiong, Y., Czarnecki, K., Ehrig, H., Hermann, F., Orejas, F.: Fromstate- to delta-based bidirectional model transformations: the symmetric case. In:MODELS. pp. 304–318. Springer-Verlag, Berlin, Heidelberg (2011)
31. Engels, G., Erwig, M.: ClassSheets: automatic generation of spreadsheet applica-tions from object-oriented specifications. In: Proc. of the 20th IEEE/ACM Int.Conf. on Aut. Sof. Eng. pp. 124–133. ACM (2005)
32. Erwig, M.: Software Engineering for Spreadsheets. IEEE Software 29(5), 25–30(2009)
33. Erwig, M., Abraham, R., Cooperstein, I., Kollmansberger, S.: Automatic genera-tion and maintenance of correct spreadsheets. In: Proc. of the 27th Int. Conf. onSoftware Engineering. pp. 136–145. ACM (2005)
34. Fisher II, M., Cao, M., Rothermel, G., Cook, C., Burnett, M.: Automated test casegeneration for spreadsheets. In: Proceedings of the 24th International Conferenceon Software Engineering (ICSE-02). pp. 141–154. ACM Press, New York (May 19–25 2002)
35. Fisher II, M., Rothermel, G., Brown, D., Cao, M., Cook, C., Burnett, M.: Integrat-ing automated test generation into the WYSIWYT spreadsheet testing methdol-ogy. ACM Transactions on Software Engineering and Methodology 15(2), 150–194(April 2006)
36. Foster, J.N., Greenwald, M.B., Moore, J.T., Pierce, B.C., Schmitt, A.: Combinatorsfor bi-directional tree transformations: a linguistic approach to the view updateproblem. In: POPL. pp. 233–246. ACM (2005)
37. Fowler, M.: Refactoring: Improving the Design of Existing Code. Addison-Wesley(Aug 1999)
65

8. CONCLUSION
38. Hermans, F., Pinzger, M., van Deursen, A.: Automatically extracting class dia-grams from spreadsheets. In: ECOOP. pp. 52–75. Springer-Verlag (2010)
39. Hermans, F., Pinzger, M., van Deursen, A.: Automatically extracting class di-agrams from spreadsheets. In: ECOOP ’10: Proceedings of the 24th EuropeanConference on Object-Oriented Programming. pp. 52–75. Springer-Verlag, Berlin,Heidelberg (2010), http://portal.acm.org/citation.cfm?id=1883978.1883984
40. Hermans, F., Pinzger, M., van Deursen, A.: Supporting professional spreadsheetusers by generating leveled dataflow diagrams. In: Proceedings of the 33rd Inter-national Conference on Software Engineering. pp. 451–460. ICSE ’11, ACM, NewYork, NY, USA (2011), http://doi.acm.org/10.1145/1985793.1985855
41. Hermans, F., Pinzger, M., van Deursen, A.: Detecting code smells in spreadsheetformulas. In: ICSM. pp. 409–418 (2012)
42. Hermans, F., Pinzger, M., van Deursen, A.: Detecting code smells in spreadsheetformulas. In: ICSM (2012), to appear
43. Hermans, F., Pinzger, M., Deursen, A.v.: Detecting and visualizing inter-worksheetsmells in spreadsheets. In: Proceedings of the 2012 International Conference onSoftware Engineering. pp. 441–451. ICSE 2012, IEEE Press, Piscataway, NJ, USA(2012), http://dl.acm.org/citation.cfm?id=2337223.2337275
44. Hinze, R., Loh, A., Oliveira, B.: ”Scrap your boilerplate” reloaded. In: Proc. 8thInt. Symposium on Functional and Logic Programming (2006), to appear
45. Hofmann, M., Pierce, B.C., Wagner, D.: Edit lenses. In: ACM SIGPLAN–SIGACTSymposium on Principles of Programming Languages (POPL), Philadelphia, Penn-sylvania (Jan 2012)
46. Host, M., Regnell, B., Wohlin, C.: Using students as subjects — a compara-tive study of students and professionals in lead-time impact assessment. Em-pirical Softw. Engg. 5(3), 201–214 (Nov 2000), http://dx.doi.org/10.1023/A:
1026586415054
47. Jones, S.P., Hughes, J., Augustsson, L., et al.: Report on the programming languagehaskell 98. Tech. rep. (February 1999)
48. Lammel, R., Visser, J.: A Strafunski Application Letter. In: Dahl, V., Wadler, P.(eds.) Proc. of Practical Aspects of Declarative Programming (PADL’03). LNCS,vol. 2562, pp. 357–375. Springer (Jan 2003)
49. Maier, D.: The Theory of Relational Databases. Computer Science Press (1983)50. Morgan, C., Gardiner, P.: Data refinement by calculation. Acta Informatica 27,
481–503 (1990)51. Nardi, B.A.: A Small Matter of Programming: Perspectives on End User Comput-
ing. MIT Press, Cambridge, MA, USA, 1st edn. (1993)52. Oliveira, J.: A reification calculus for model-oriented software specification. Formal
Asp. Comput. 2(1), 1–23 (1990)53. Oliveira, J.N.: Transforming data by calculation. In: Lammel, R., Visser, J.,
Saraiva, J. (eds.) GTTSE. Lecture Notes in Computer Science, vol. 5235, pp. 134–195. Springer (2007)
54. Panko, R.: Facing the problem of spreadsheet errors. Decision Line, 37(5) (2006)55. Panko, R.R., Ordway, N.: Sarbanes-Oxley: What About all the Spreadsheets?
CoRR abs/0804.0797 (2008)56. Panko, R.: Spreadsheet errors: What we know. what we think we can do. EuSpRIG
(2000)57. Peyton Jones, S., Washburn, G., Weirich, S.: Wobbly types: type inference for
generalised algebraic data types. Tech. Rep. MS-CIS-05-26, Univ. of Pennsylvania(Jul 2004)
66

8. CONCLUSION
58. R Core Team: R: A Language and Environment for Statistical Computing. R Foun-dation for Statistical Computing, Vienna, Austria (2013), http://www.R-project.org
59. Robson, E.: Neither Sherlock Holmes nor Babylon: A Reassessment of Plimpton322. Historia Mathematica 28(3), 167–206 (2001), http://www.sciencedirect.
com/science/article/pii/S0315086001923171
60. Rothermel, G., Burnett, M., Li, L., Sheretov, A.: A methodology for testing spread-sheets. ACM Transactions on Software Engineering and Methodology 10, 110–147(2001)
61. Spreadsheet: The American Heritage R© New Dictionary of Cultural Literacy.Houghton Mifflin Company, third edn. (2012), http://dictionary.reference.
com/browse/spreadsheet
62. Stevens, P.: Bidirectional Model Transformations in QVT: Semantic Issues andOpen Questions. In: MoDELS 2007, LNCS, vol. 4735, pp. 1–15. Springer (2007)
63. Stevens, P., Whittle, J., Booch, G. (eds.): UML 2003 - The Unified Modeling Lan-guage, Modeling Languages and Applications, 6th International Conference, SanFrancisco, CA, USA, October 20-24, 2003, Proceedings, Lecture Notes in ComputerScience, vol. 2863. Springer (2003)
64. Swierstra, S.D., Henriques, P.R., Oliveira, J.N. (eds.): Advanced Functional Pro-gramming, Third International School, Braga, Portugal, September 12-19, 1998,Revised Lectures, Lecture Notes in Computer Science, vol. 1608. Springer (1999)
65. Ullman, J.D., Widom, J.: A First Course in Database Systems. Prentice Hall (1997)66. Ullman, J.: Principles of Database and Knowledge-Base Systems, Volume I. Com-
puter Science Press (1988)67. Visser, E.: A survey of strategies in rule-based program transformation systems.
Journal of Symbolic Computation 40, 831–873 (July 2005)68. Visser, J., Saraiva, J.: Tutorial on strategic programming across programming par-
adigms. In: 8th Brazilian Symposium on Programming Languages. Niteroi, Brazil(May 2004)
69. Wohlin, C., Runeson, P., Host, M., Ohlsson, M., Regnell, B., Wesslen, A.: Ex-perimentation in Software Engineering. Computer Science, Springer (2012), http://books.google.com.my/books?id=Pg7PugAACAAJ
67