SPOTLIGHT: PREVENTION - America's Health Rankings · PDF fileclinical preventive services than...
7
SPOTLIGHT: PREVENTION EXECUTIVE SUMMARY FEBRUARY 2016 JOIN THE CONVERSATION The full report is available at www.americashealthrankings.org/spotlight/prevention
Transcript of SPOTLIGHT: PREVENTION - America's Health Rankings · PDF fileclinical preventive services than...

SPOTLIGHT: PREVENTIONEXECUTIVE SUMMARYFEBRUARY 2016
JOIN THE CONVERSATION
The full report is available at www.americashealthrankings.org/spotlight/prevention

2
FINDING #2 Health care access is critical to overall prevention. States that perform well on access to health care metrics tend to perform well across a wide range of preventive health metrics.
FINDING #3Taking a holistic view of prevention is key. States that perform well in one category of prevention generally perform well across the other two categories in the model, suggesting the importance of taking a holistic view of prevention activities.
FINDING #1 Income, education, geography, racial and ethnicity inequities exist in use of preventive care. Specifically, the report finds a lower percentage of Hispanics access clinical preventive services than non-Hispanic whites and non-Hispanic blacks.
FINDING #4Immunization rates vary among states and lag behind U.S. Department of Health and Human Services’ Healthy People 2020 (HP 2020) targets. For example, childhood immunization rates range from 84.7% in Maine to 63.4% in West Virginia.
KEY FINDINGS
EXECUTIVE SUMMARYINTRODUCTION
Prevention is one of the core pillars of public health and is key to healthier lives and improved quality of life. Clinical preventive services and interventions have been instrumental in everything from lowering rates of illness and disease to helping reduce the overall burden on the health care system.
According to the Centers for Disease Control and Prevention (CDC), Americans use preventive services at
half the recommended rate, meaning tens of millions of individuals miss out on basic preventive care.1 The
Institute of Medicine also estimates that missed prevention opportunities cost the United States $55 billion in
just one year.2
The 2016 America’s Health Rankings® Spotlight: Prevention took an in-depth look at preventive measures
across all 50 states through the lenses of health care access, immunizations and chronic disease prevention.
The objective is to drive awareness and understanding about the role of prevention in improving the health
of individuals and our communities.
ANALYTICAL APPROACHFor the purposes of this report, prevention has been examined through the lenses of access to health care,
immunizations and chronic disease prevention, with each category composed of multiple measures. While not an
exhaustive list of clinical preventive care, each category represents a unique perspective on the way individuals
interact with the health care system to prevent, diagnose and manage infectious and chronic diseases.
1. http://www.cdc.gov/healthcommunication/toolstemplates/entertainmented/tips/preventivehealth.html2. http://resources.iom.edu/widgets/vsrt/healthcare-waste.html
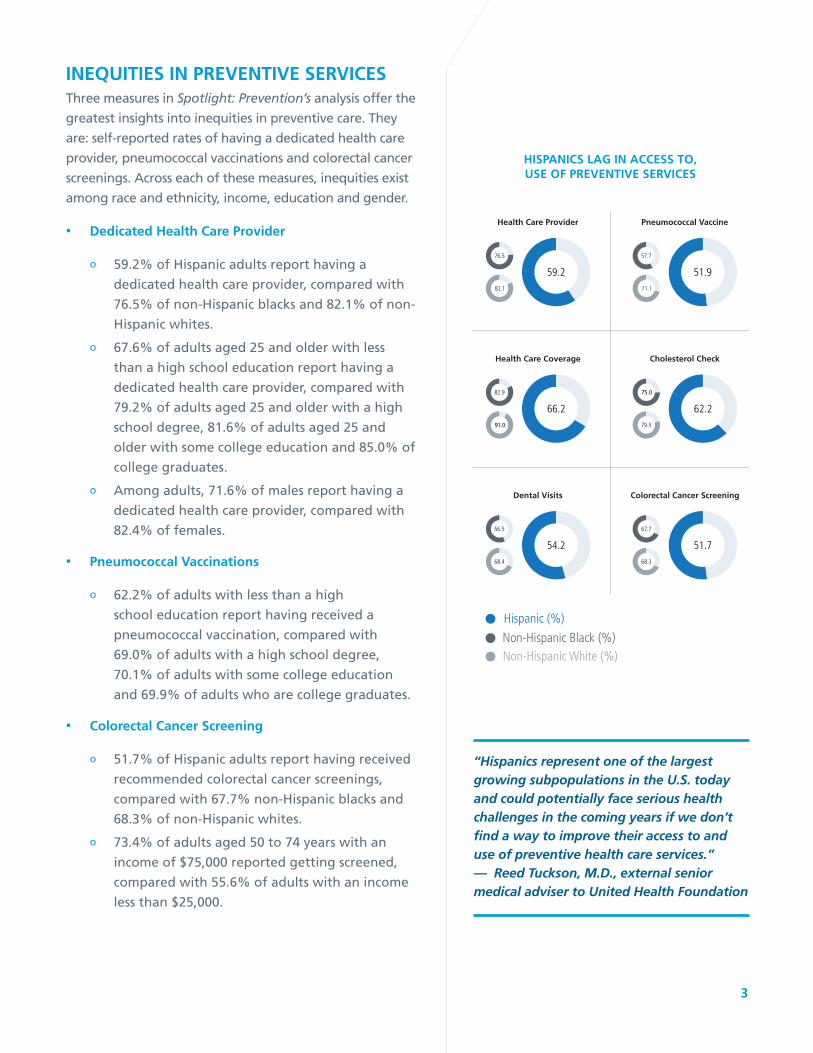
INEQUITIES IN PREVENTIVE SERVICESThree measures in Spotlight: Prevention’s analysis offer the
greatest insights into inequities in preventive care. They
are: self-reported rates of having a dedicated health care
provider, pneumococcal vaccinations and colorectal cancer
screenings. Across each of these measures, inequities exist
among race and ethnicity, income, education and gender.
• Dedicated Health Care Provider
o 59.2% of Hispanic adults report having a
dedicated health care provider, compared with
76.5% of non-Hispanic blacks and 82.1% of non-
Hispanic whites.
o 67.6% of adults aged 25 and older with less
than a high school education report having a
dedicated health care provider, compared with
79.2% of adults aged 25 and older with a high
school degree, 81.6% of adults aged 25 and
older with some college education and 85.0% of
college graduates.
o Among adults, 71.6% of males report having a
dedicated health care provider, compared with
82.4% of females.
• Pneumococcal Vaccinations
o 62.2% of adults with less than a high
school education report having received a
pneumococcal vaccination, compared with
69.0% of adults with a high school degree,
70.1% of adults with some college education
and 69.9% of adults who are college graduates.
• Colorectal Cancer Screening
o 51.7% of Hispanic adults report having received
recommended colorectal cancer screenings,
compared with 67.7% non-Hispanic blacks and
68.3% of non-Hispanic whites.
o 73.4% of adults aged 50 to 74 years with an
income of $75,000 reported getting screened,
compared with 55.6% of adults with an income
less than $25,000.
HISPANICS LAG IN ACCESS TO, USE OF PREVENTIVE SERVICES
3
“Hispanics represent one of the largest growing subpopulations in the U.S. today and could potentially face serious health challenges in the coming years if we don’t find a way to improve their access to and use of preventive health care services.” — Reed Tuckson, M.D., external senior medical adviser to United Health Foundation
Non-Hispanic Black (%)Non-Hispanic White (%)
Hispanic (%)

Spotlight: Prevention examined access to preventive health
care through three, highly correlated measures: health care
coverage, access to a dedicated health care provider and an
annual dental visit. Analyzed together, data in these categories
suggest that health insurance coverage provides an important
entry point to the health care system and preventive services
therein.
Other findings related to health care access:
• Nearly 88% of adults report having some type of health
insurance. This varies from a high of 95.4% in Massachusetts to
a low of 75.1% in Texas.
• Nearly 77% of adults report having a dedicated health care
provider. Among the states, this measure varies from a high of
89.3% in Massachusetts to a low of 64.8% in Nevada.
• Just over 65% of adults report visiting a dentist or dental clinic
in the last year. The rate varies from a high of 74.9% of adults
in Connecticut to a low of 54.2% in West Virginia.
HEALTH CARE ACCESS IS CRITICAL TO PREVENTION
4
Overall Prevention Performance

• States in the West and Southwest have the
lowest percentage of residents reporting
that they have dedicated health care
providers. States in New England have the
highest percentage.
• States with the lowest rates of childhood
immunizations are in the Northwest, South
and Midwest.
• States in the Rocky Mountain region have
the lowest reported prevalence of high
blood pressure among adults, and the
states in the Southeast have the highest
prevalence.
Important lessons from states performing well in
prevention may provide guidance to other states.
TAKING A HOLISTIC VIEW: STATE AND REGIONAL INSIGHTSSpotlight: Prevention provides detailed information about every state’s overall prevention score in access,
immunizations and chronic disease prevention. Prevention performance varies greatly by state, with
Massachusetts, Rhode Island, New Hampshire, Connecticut and Vermont exhibiting the strongest performance.
Texas, Arkansas, Nevada, Alaska and Mississippi have the greatest opportunities for improvements.
5
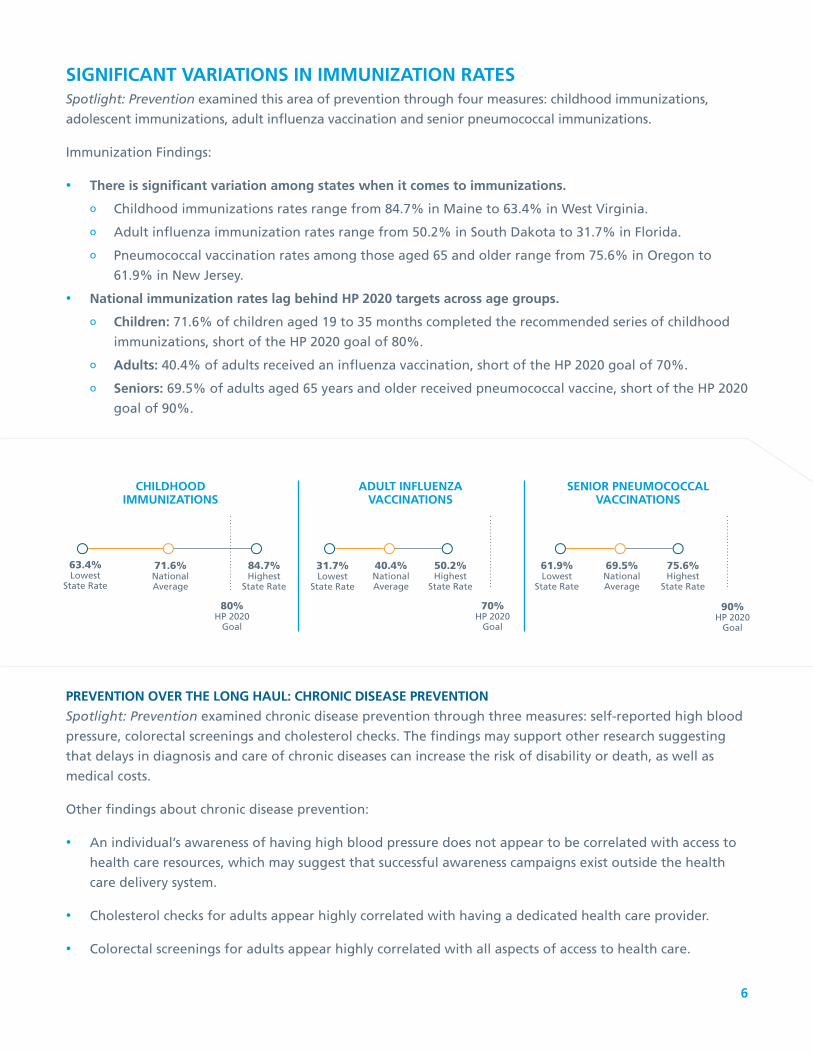
SIGNIFICANT VARIATIONS IN IMMUNIZATION RATESSpotlight: Prevention examined this area of prevention through four measures: childhood immunizations,
adolescent immunizations, adult influenza vaccination and senior pneumococcal immunizations.
Immunization Findings:
• There is significant variation among states when it comes to immunizations.
o Childhood immunizations rates range from 84.7% in Maine to 63.4% in West Virginia.
o Adult influenza immunization rates range from 50.2% in South Dakota to 31.7% in Florida.
o Pneumococcal vaccination rates among those aged 65 and older range from 75.6% in Oregon to
61.9% in New Jersey.
• National immunization rates lag behind HP 2020 targets across age groups.
o Children: 71.6% of children aged 19 to 35 months completed the recommended series of childhood
immunizations, short of the HP 2020 goal of 80%.
o Adults: 40.4% of adults received an influenza vaccination, short of the HP 2020 goal of 70%.
o Seniors: 69.5% of adults aged 65 years and older received pneumococcal vaccine, short of the HP 2020
goal of 90%.
PREVENTION OVER THE LONG HAUL: CHRONIC DISEASE PREVENTION
Spotlight: Prevention examined chronic disease prevention through three measures: self-reported high blood
pressure, colorectal screenings and cholesterol checks. The findings may support other research suggesting
that delays in diagnosis and care of chronic diseases can increase the risk of disability or death, as well as
medical costs.
Other findings about chronic disease prevention:
• An individual’s awareness of having high blood pressure does not appear to be correlated with access to
health care resources, which may suggest that successful awareness campaigns exist outside the health
care delivery system.
• Cholesterol checks for adults appear highly correlated with having a dedicated health care provider.
• Colorectal screenings for adults appear highly correlated with all aspects of access to health care.
6
63.4% Lowest
State Rate
71.6% National Average
84.7% Highest
State Rate
80%HP 2020
Goal
CHILDHOOD IMMUNIZATIONS
ADULT INFLUENZA VACCINATIONS
31.7% Lowest
State Rate
40.4% National Average
50.2% Highest
State Rate
70%HP 2020
Goal
SENIOR PNEUMOCOCCAL VACCINATIONS
61.9% Lowest
State Rate
69.5% National Average
75.6% Highest
State Rate
90%HP 2020
Goal
Read the full Spotlight: Prevention at www.americashealthrankings.org/spotlight/prevention

Read the full Spotlight: Prevention at www.americashealthrankings.org/spotlight/prevention
JOIN THE CONVERSATION
For more information, contact:L. D. Platt, UnitedHealth Group