Spotlight on the South A Demographic and Socioeconomic Profile of the Region Bo Beaulieu, Southern...
48
Spotlight on the South A Demographic and Socioeconomic Profile of the Region Bo Beaulieu, Southern Rural Development Center
-
Upload
kimberly-bruce -
Category
Documents
-
view
215 -
download
0
Transcript of Spotlight on the South A Demographic and Socioeconomic Profile of the Region Bo Beaulieu, Southern...
Spotlight on the South
A Demographic and Socioeconomic Profile of the
Region
Bo Beaulieu, Southern Rural Development Center

Outline of Presentation Population characteristics Family structure Poverty status Residential mobility patterns Economic features Educational status The so whats !!
Examining Population Changes
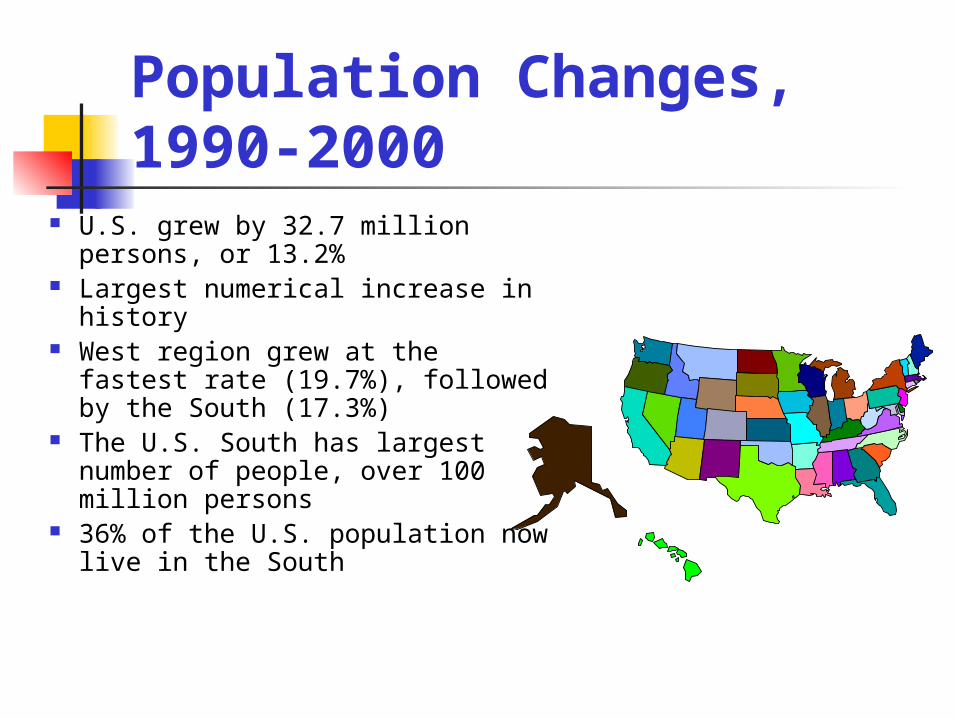
Population Changes,1990-2000
U.S. grew by 32.7 million persons, or 13.2%
Largest numerical increase in history
West region grew at the fastest rate (19.7%), followed by the South (17.3%)
The U.S. South has largest number of people, over 100 million persons
36% of the U.S. population now live in the South

Population Change Varies by State
For the first time in the 20th century, all U.S. states gained population
Nevada grew at the fastest pace : 66%
North Dakota grew the slowest: 0.5%
U.S. : 13.2%

Population Features of the Southern Region
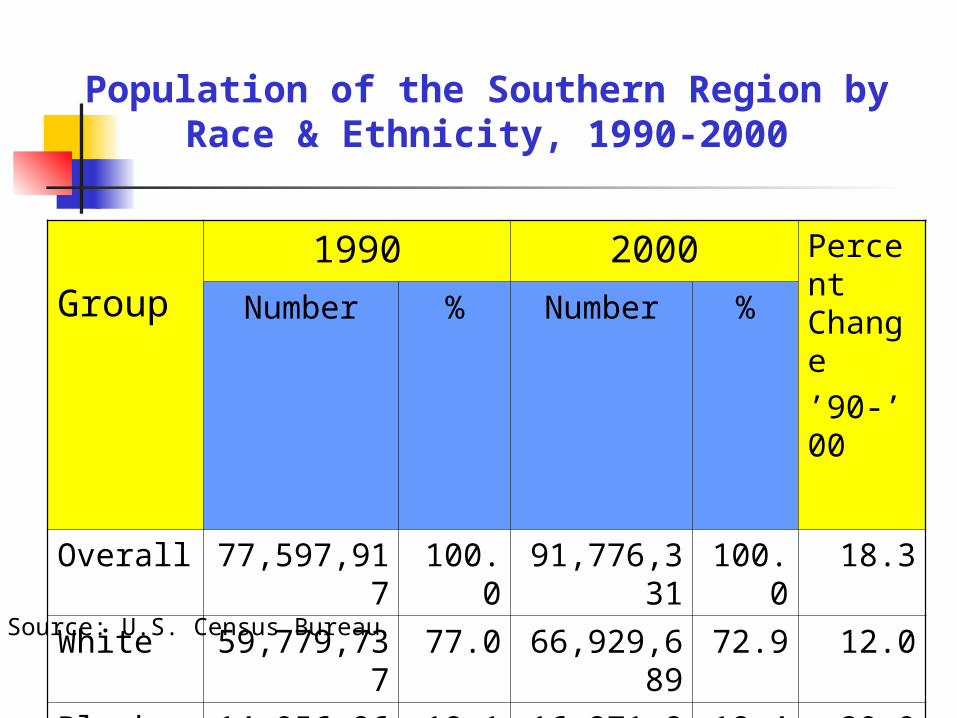
Population of the Southern Region by Race & Ethnicity, 1990-2000
Group1990 2000 Perce
nt Change’90-’00
Number % Number %
Overall 77,597,917
100.0 91,776,331
100.0
18.3
White 59,779,737
77.0 66,929,689
72.9 12.0
Black 14,056,860
18.1 16,871,897
18.4 20.0
Hispanic 6,486,848 8.4 11,230,931
12.2 73.1
Source: U.S. Census Bureau
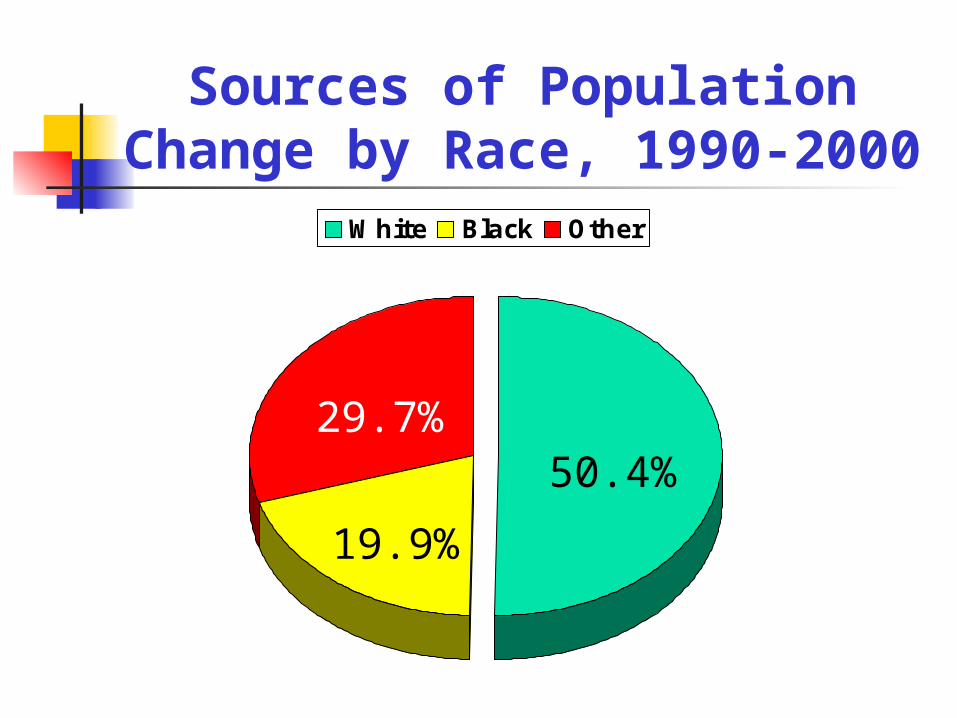
Sources of Population Change by Race, 1990-
2000White Black Other
50.4%
19.9%
29.7%

Population Change in Metro and Nonmetro Areas of the South by
Race, 1990-2000
20.5
12.1 12.99.5
24.1
9.3
73.1 73
0
10
20
30
40
50
60
70
80
Overall White Black Hispanic
Metro Nonmetro

Distribution of Population by Agein the South, 1990-2000
7.3 18.7 61.5 12.6
6.8 18.7 62 12.4
0% 20% 40% 60% 80% 100%
1990
2000
Under 5 15 to 17 18 to 64 65 and over
Source: U.S. Census Bureau

Population Profile of the South by
by Age, 1990 & 2000
Age GroupYear Numerica
l Change1990 2000
Under 5 5,649,286 6,268,462 619,176
5 to 17 14,482,120
17,188,916
2,706,796
18-64 47,706,392
56,931,860
9,225,468
65 and over
9,760,119 11,387,093
1,626,974
Total 77,597,917
91,776,331
14,178,414
Source: U.S. Census Bureau

Percent Change in Population by Age Groupings, 1990-2000
11.0
18.7
19.3
16.7
0.0 5.0 10.0 15.0 20.0
Under 5
5 to 17
18 to 64
65 and over
Source: U.S. Census Bureau

Percentage Growth Within Various Age Groupings in Metro & Nonmetro
Areas of the South,1990-2000
13.1
4.7
23.7
6
20.7
15.4
19.6
10.1
0
5
10
15
20
25
Under 5 18-64 65+
Metro Nonmetro
5-17

The Changing Structure of the Family

Structure of Family Households with Children Under 18 Years Old, 1990 &
2000
FamilyHouseholdType
1990 2000%
Change
No. % No. %
Married couple households
7,705,287
76.8 8,806,122
69.3 14.3
Male only headed households
382,120 3.8 812,020 6.4 112.5
Female only headed households
1,941,463
19.4 3,080,934
24.3 58.7Source: U.S. Census Bureau

Family Structure of Metro and Nonmetro Families With Kids
Under 18 in the South, 1990 and 2000
76.4
3.919.7
77.9
3.918.4
69.4
6.324.3
69.3
6.524.2
0%
20%
40%
60%
80%
100%
Metro Nonmetro Metro Nonmetro
Married Couple Male headed Female headed
1990 2000

Shifts in Family Structure in the South’s Metro and Nonmetro
Areas, 1990-2000
29.9
4.5
113.9108.5
60.254.2
0 20 40 60 80 100 120
Married Couple
Male Headed
Female Headed
Metro Nonmetro

Structure of Family Households with Children Under 18 in 2000,
by Race and Ethnicity
78.7 5.6 15.7
45.3 6.9 47.8
74.4 6.8 18.7
0% 20% 40% 60% 80% 100%
White
Black
Hispanic
Married Couple Single Male Headed Single Female Headed

Poverty Status of Individuals
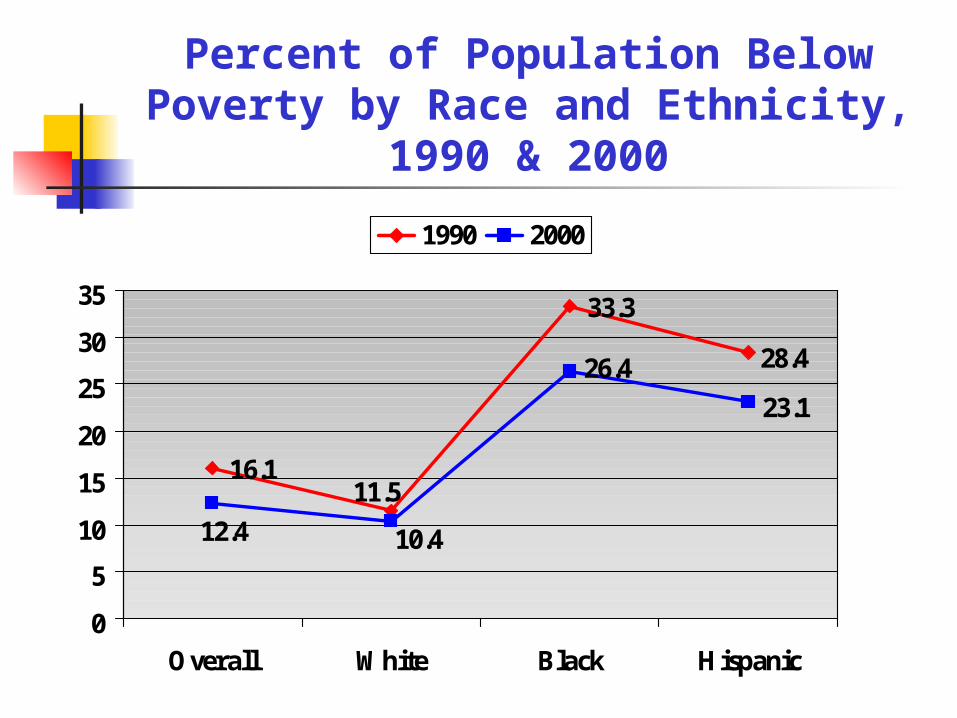
Percent of Population Below Poverty by Race and Ethnicity,
1990 & 2000
28.4
23.1
33.3
16.111.5
26.4
12.4 10.4
0
5
10
15
20
25
30
35
Overall White Black Hispanic
1990 2000

Number of Persons in Poverty,1990 & 2000
GroupYear Numerical
Change1990 2000
White 6,715,377 6,811,078 95,701
Black 4,489,669 4,247,753 -241,916
Hispanic 1,807,293 2,533,139 725,846
Overall 12,182,404
12,635,394
452,990
Source: U.S. Census Bureau

Poverty Shifts in Metro and Nonmetro Areas of the South,
1990-2000
GroupMetropolitan Nonmetropolitan
Number Percent Number Percent
Overall 730,357 9.3 - 277,367
- 6.5
White 265,815 6.4 - 170,114
- 6.7
Black - 40,522
- 1.4 - 201,394
- 13.3
Hispanic
631,023 42.2 94,823 30.2

Residential Mobility Patterns

Mobility Pattern of the Southern Region’s Population 5 and Over, 1990-
2000
Residential Location
Year Change
1990 2000No. %No. % No. %
Overall population 5 +
71,948,631
100 88,507,869 100 13,559,238 18.8
Same house as 5 years ago
37,011,510
51.4 44,501,336 52.0 7,489,826 20.2
Different house, same county
18,128,508
25.2 20,727,263 24.2 2,598,755 14.3
Different house and county, same state
7,385,031 10.3 9,226,972 10.8 1,841,941 24.9
Different state 8,238,849 11.5 8,732,079 10.2 493,230 6.0
Different country
1,184,733 1.6 2,320,219 2.7 1,135,486 95.8

Mobility Patterns in Metro & Nonmetro Areas, 1990 &
2000
0%
20%
40%
60%
80%
100%
1990 2000 1990 2000
Same house Diff house/ same co. Diff co./ same stateDifferent state Different country
Nonmetro Metro

Change in Residential Location by Metro & Nonmetro Areas,
1990-2000
Residential Location
Metro NonmetroNumber %
Change
Number %Chang
e
Same house 6,159,081
24.1 1,330,745
11.6
Diff. House same county
2,397,696
17.4 201,059 4.6
Diff. County, same state
1,286,611
23.7 555,330 28.2
Different state
307,497 4.5 185,733 12.7
Different country
974,493 91.3 160,993 136.8

The Economic Features of the Region

Type of Industries Classified by Each Sector
Goods Producing Farm Agricultural
Services Mining Manufacturing Construction
Service Producing Transportation and
Public Utilities Wholesale Trade Retail Trade Finance, Insurance
and Real Estate Services Government and
Government Enterprises

The Industrial Profile of Full and Part-Time Jobs in the South,1990 and 2000
23.9
76.1
20.6
79.4
0%10%20%30%40%50%60%70%80%90%
100%
1990 2000
Goods Producing Service Producing
Source: Regional Economic Information System (REIS)

Proportion of New Full and Part-Time Jobs Generated by Each Sector, 1990-
2000
0 20 40 60 80 100
Goods Producing
ServiceProducing
91.6 %
Source: Regional Economic Information System (REIS)
8.4 %

Commute to Work by Labor Force Living in the South, 1990-2000
Location of Workforce Employment
Year Change
1990 2000No. %No. % No. %
In the workforce 35,172,33
6100 41,038,70
2100 5,866366 16.
7
Work in county of residence
26,791,818
76.2 29,673,945
72.3 2,882,127
10.8
Work in state, outside county
7,344,257 20.9 10,130,210
24.7 2,785,943
37.9
Work outside state of residence
1,036,251 2.9 1,234,547 3.0 198,296 19.1
Source: U.S. Census Bureau

Commute to Work by Metro & Nonmetro Workforce, 1990 &
2000
76.9 20.2 2.9
73.6 22.9 3.2
73.6 23.6 2.8
68 28.4 3.6
0% 20% 40% 60% 80% 100%
Metro
Nonmetro
Metro
Nonmetro
County of Residence State, outside county Outside state
2000
1990
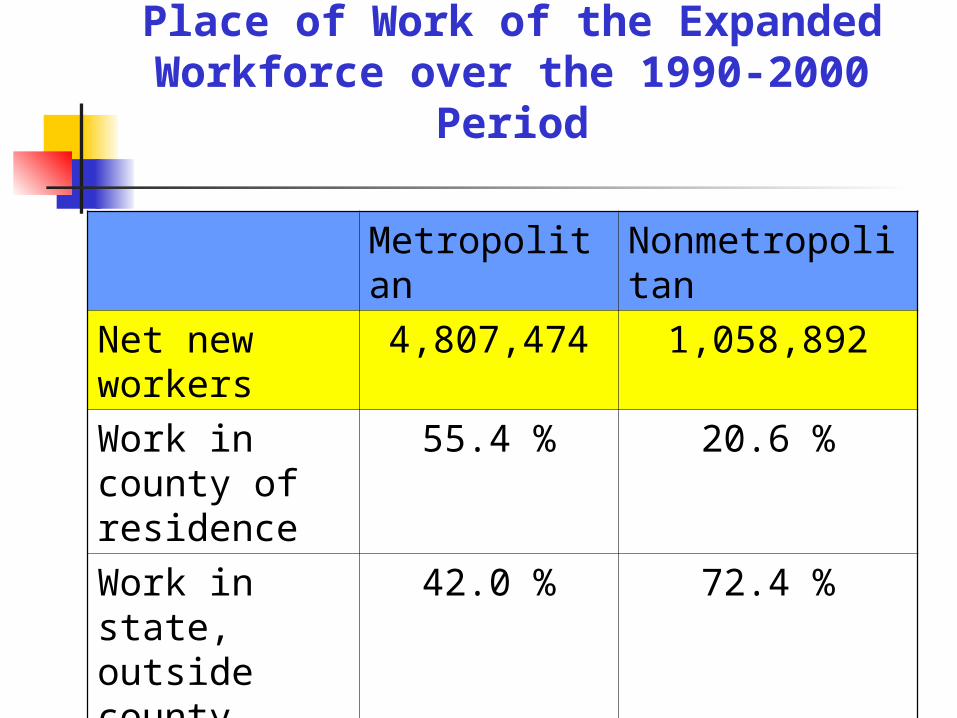
Place of Work of the Expanded Workforce over the 1990-2000
Period
Metropolitan Nonmetropolitan
Net new workers
4,807,474 1,058,892
Work in county of residence
55.4 % 20.6 %
Work in state, outside county
42.0 % 72.4 %
Outside state 2.6 % 6.9 %

Educational Credentials of the Region

Educational Attainment of Adults 25+ Years Old in the South, 1990 & 2000
29.1 28.9 18.4
5.4
18.2
22.6 28.6 21.1
5.7
22.1
0% 20% 40% 60% 80% 100%
1990
2000
LT H.S. H.S. Only Some College Assoc. Degree Bachelors or Higher
Source: U.S. Census Bureau
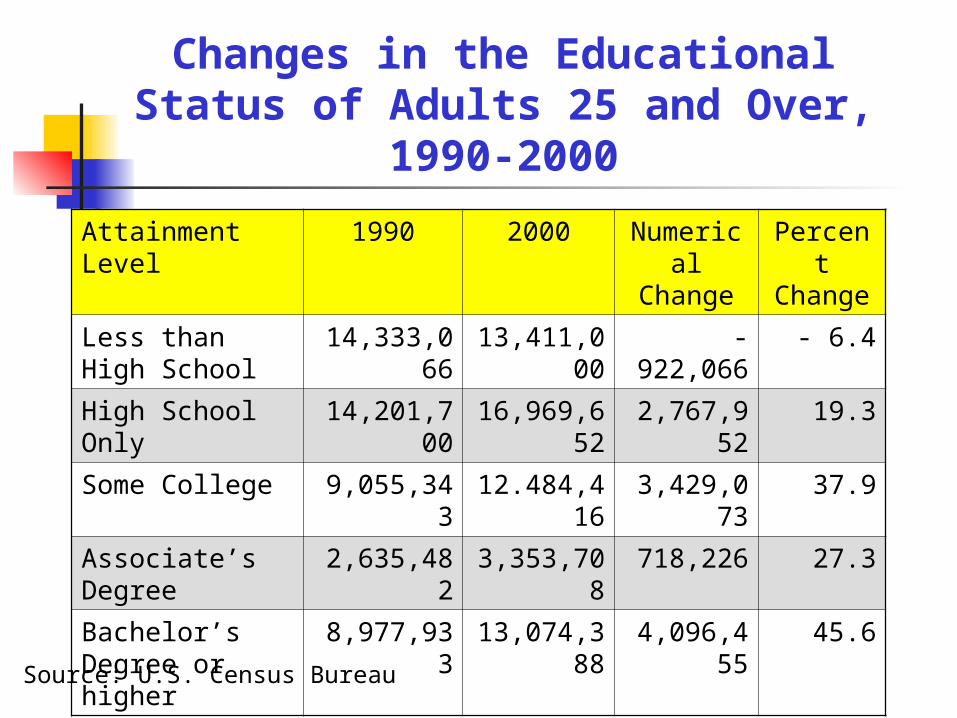
Changes in the Educational Status of Adults 25 and Over,
1990-2000
Attainment Level
1990 2000 Numerical
Change
Percent Change
Less than High School
14,333,066
13,411,000
- 922,066
- 6.4
High School Only
14,201,700
16,969,652
2,767,952
19.3
Some College 9,055,343 12.484,416
3,429,073
37.9
Associate’s Degree
2,635,482 3,353,708
718,226 27.3
Bachelor’s Degree or higher
8,977,933 13,074,388
4,096,455
45.6
Source: U.S. Census Bureau
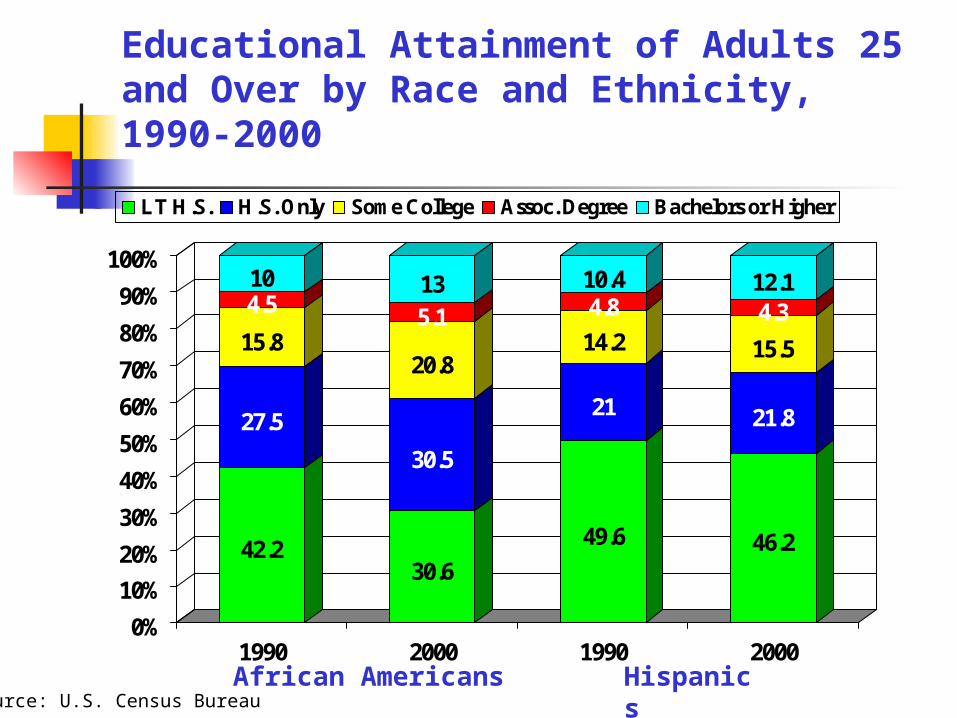
Educational Attainment of Adults 25 and Over by Race and Ethnicity, 1990-2000
42.2
27.5
15.8
4.510
30.6
30.5
20.8
5.113
49.6
21
14.2
4.810.4
46.2
21.8
15.5
4.312.1
0%
10%
20%
30%
40%
50%
60%
70%
80%
90%
100%
1990 2000 1990 2000
LT H.S. H.S. Only Some College Assoc. Degree Bachelors or Higher
African Americans HispanicsSource: U.S. Census Bureau

Educational Status of Metro and Nonmetro Southerners,
1990 and 2000
0% 20% 40% 60% 80% 100%
1990
2000
1990
2000
LT HS HS Some college Associates Bachelors +Nonmetro
Metro
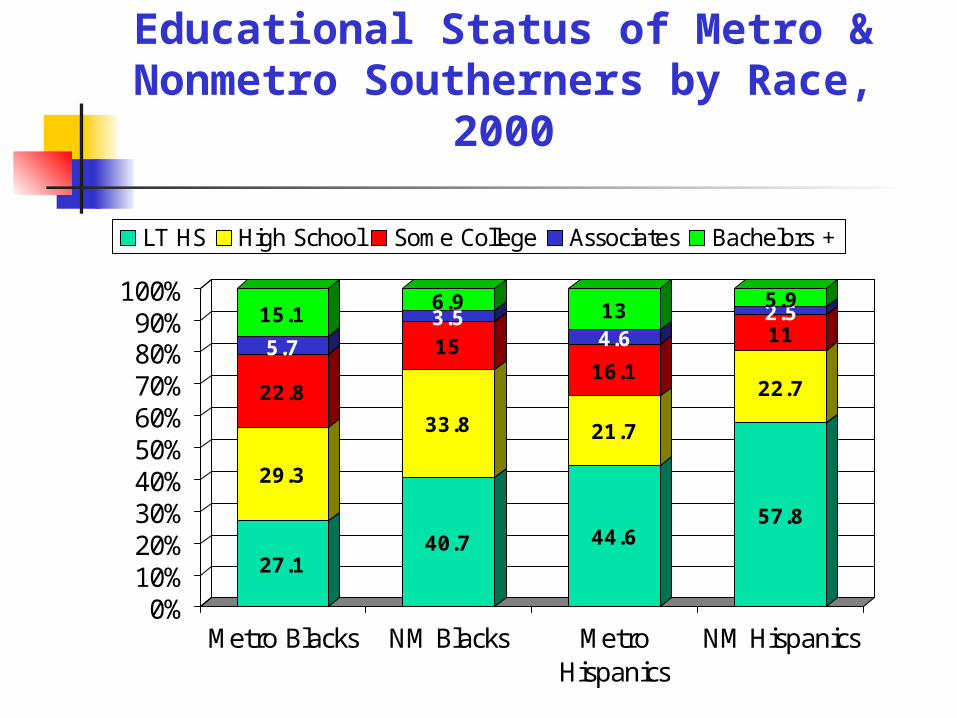
Educational Status of Metro & Nonmetro Southerners by Race,
2000
27.1
29.3
22.8
5.7
15.1
40.7
33.8
153.56.9
44.6
21.7
16.1
4.613
57.8
22.7
112.55.9
0%10%20%30%40%50%60%70%80%90%
100%
Metro Blacks NM Blacks MetroHispanics
NM Hispanics
LT HS High School Some College Associates Bachelors +

What’s the RD Story? Dramatic rise in the influx of
Latinos into the region (+ 73% during the decade). Rural communities will be challenged to: Accept and embrace cultural differences Expand bilingual language capacity in key
service areas (education, health services, public safety services, etc.)
Address housing needs of this growing segment of the population

What’s the Story? Healthy growth occurring in all
age groups. Impact on the rural South? Strong demand will exist for the
provision of key services for youth and senior citizens
Healthy growth of working age population places increased pressure on rural areas to focus on job generation strategies.

What’s the Story? Family structure continues to become
more complex Nonmetro areas no longer more likely to have
married couple families when contrasted with metro areas (both around 69%).
Rapid growth of single-headed families will place pressure for expanded family support systems to be in place (child care, after school programs, community recreation activities).
African American families at greatest risk with over 52 % of families with kids are headed by a single parent.

What’s the Story? Poverty rates have improved during the
1990s, but rates are now on the upswing About half of the growth in the South’s
population growth in the ’90s is linked to growth of minority groups
These are the very groups at highest risk of falling into poverty
These demographic groups will continue to be the drivers of population growth in the region
What efforts must be developed to assist low-wealth individuals and families in the rural South?

What’s the Story? Sizable % increases
in the the in-migration of individuals from different counties in a state, or from different countries. What is driving this increase? What are rural communities doing to respond?

What’s the Story? Economy and Jobs:
Traditional base of the nonmetro South’s economy is declining, replaced by service producing sector jobs. What are the pluses and minuses for rural areas?
Decline of basic industries Job quality Earnings Benefits Security
Need for new economic development strategies beyond business/industry attraction approaches

What’s the Story? Economy and Jobs:
Sizable outflow of nonmetro workers in the South to work sites outside their county or state of residence. Is this:
A lifestyle preference or economic necessity? Daily daily outflow of people to other areas is
likely to have negative impact on social capital resources, civic engagement, family life, local businesses.
Multi-county economic development planning seems logical in light of the regional labor market that appears to be in place.

What’s the Story? Education has improved in the rural
South, but some RD challenges remain. Many individuals completing “some education”
beyond high school, but only a fraction of these individuals are securing an associate’s degree.
The 42 percent growth in the number of persons with a bachelor’s degree or higher in the rural South.
linked to the economy of the region? due to the net migration of individuals who possess better
human capital attributes? Educational progress and expanded training
targeted to racial and ethnic minorities vital to the economic health of the rural South.

Thank You ! !