Spot Speed Study Spot Speed Study
18
1 1 Spot Speed Study Spot Speed is the average speed of vehicles passing a point, or the time mean speed. Spot Speed studies are conducted to estimate the distribution of speeds of vehicles in a stream of traffic at a particular location on a highway. Carried out by recording the speeds of a sample of vehicles at a specified location. 2 Spot Speed Study Application of Spot Speeds 1. Speed Limit Studies 2. Establishing Speed Trends 3. Specific Design Applications 4. Specific Control Applications 5. Investigation of High Accident Locations
Transcript of Spot Speed Study Spot Speed Study
1
1
Spot Speed Study
Spot Speed is the average speed of vehicles
passing a point, or the time mean speed.
Spot Speed studies are conducted to estimate
the distribution of speeds of vehicles in a
stream of traffic at a particular location on a
highway.
Carried out by recording the speeds of a
sample of vehicles at a specified location.
2
Spot Speed Study
� Application of Spot Speeds
1. Speed Limit Studies
2. Establishing Speed Trends
3. Specific Design Applications
4. Specific Control Applications
5. Investigation of High Accident Locations
2
3
Spot Speed StudyTime and duration
� The time of day for conducting a speed study
depends on the purpose of the study.
� In general, when the purpose of the study is to
establish posted speed limits, to observe speed
trends, or to collect basic data, it is recommended
that the study be conducted when traffic is free-
flowing, usually during off-peak hours.
� However, when a speed study is conducted in
response to citizen complaints, it is useful if the time
period selected for the study reflects the nature of
the complaints.
4
Spot Speed StudyTime and duration
� The duration of the study should be such that the minimum number of vehicle speeds required for statistical analysis is recorded.
� Typically, the duration is at least 1 hour and the sample size is at least 30 vehicles.
3
5
Spot Speed StudyMethods
� Methods of Conducting Spot Speed Studies are divided into two main categories:
1. Manual
2. Automatic
�Road Detectors
�Doppler-Principle Meters
� Electronic-Principle Detectors
6
Spot Speed StudyMethods (Manual)
• Spot speeds may be estimated by manually measuring the time it takes a vehicle to travel between two defined points on the roadway a known distance apart (short distance).
• Manual methods are seldom used these days.
4
7
Spot Speed StudyMethods (Automatic)
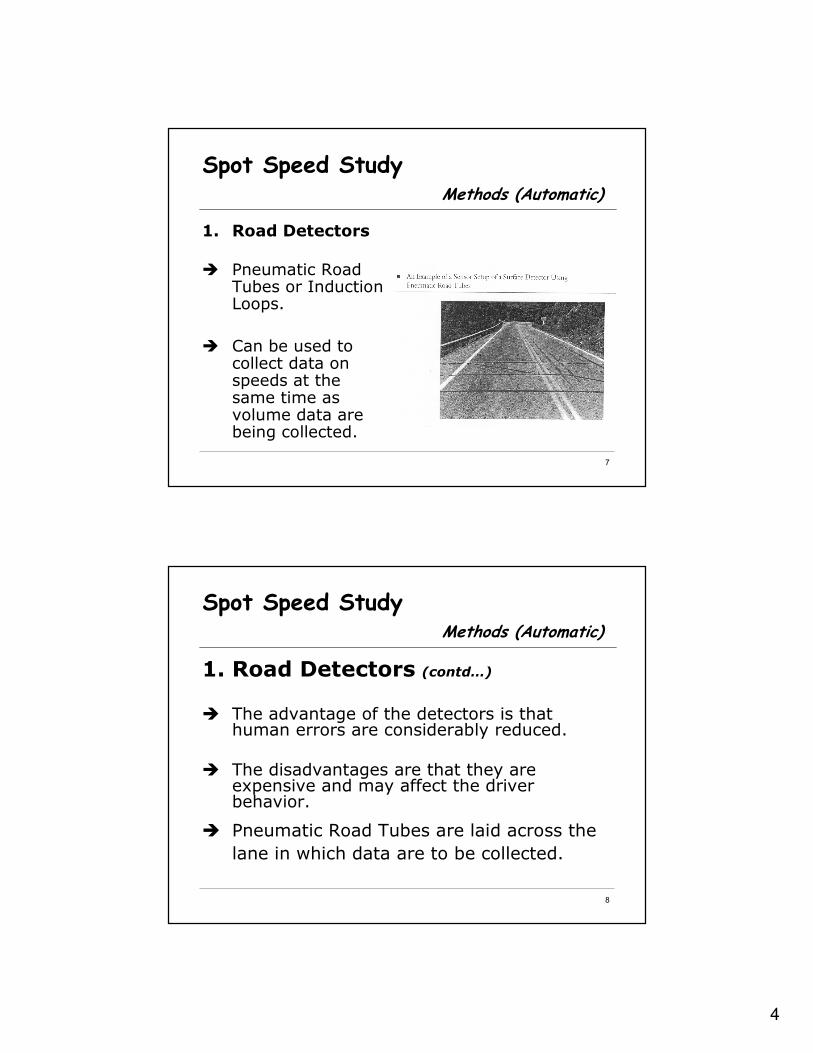
1. Road Detectors
� Pneumatic Road Tubes or Induction Loops.
� Can be used to collect data on speeds at the same time as volume data are being collected.
8
Spot Speed StudyMethods (Automatic)
1. Road Detectors (contd…)
� The advantage of the detectors is that human errors are considerably reduced.
� The disadvantages are that they are expensive and may affect the driver behavior.
� Pneumatic Road Tubes are laid across the
lane in which data are to be collected.
5
9
Spot Speed StudyMethods (Automatic)
1. Road Detectors (contd…)
� Tubes are usually separated by 6 ft (or could also be
between 3 to 15 ft).
� When a moving vehicle passes over the tube, an
impulse is transmitted through the tube to the
counter.
� The time elapsed between the two impulses and the
distance between the tubes are used to compute the
speed of the vehicle.
10
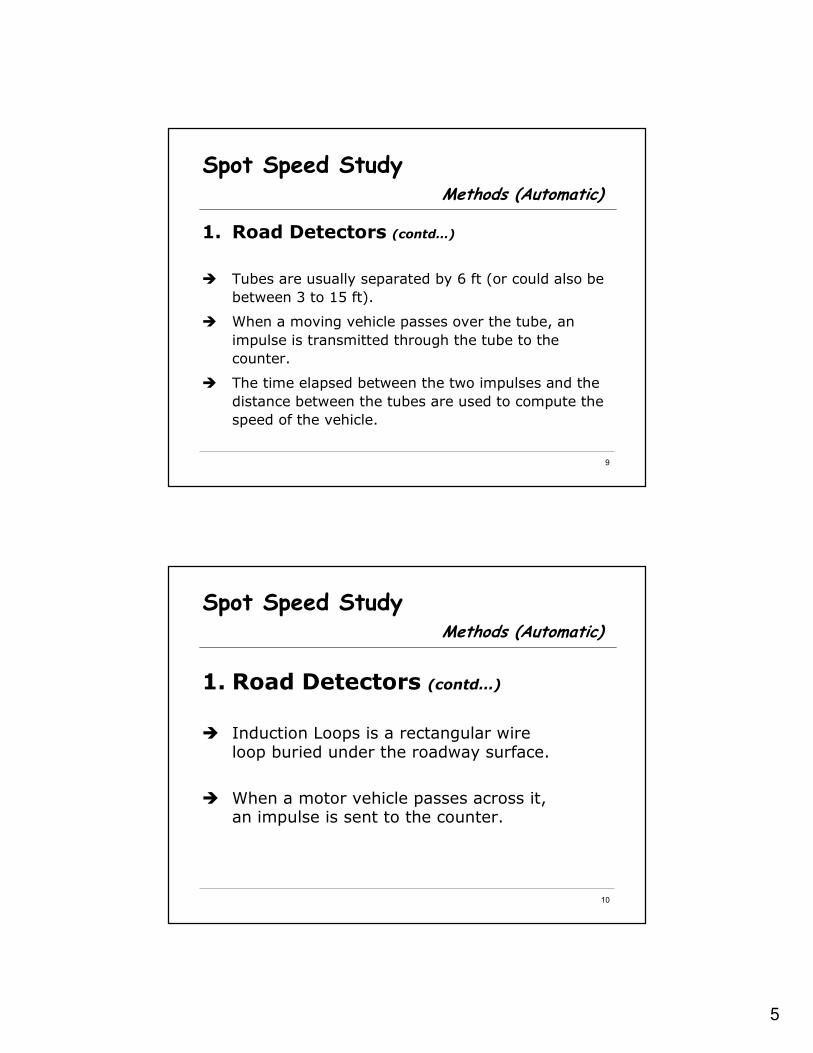
Spot Speed StudyMethods (Automatic)
1. Road Detectors (contd…)
� Induction Loops is a rectangular wire loop buried under the roadway surface.
� When a motor vehicle passes across it, an impulse is sent to the counter.
6
11
Spot Speed StudyMethods (Automatic)
2. Doppler-Principle Meters
� Doppler meters work on the principle that when a
signal is transmitted onto a moving vehicle, the
change in frequency between the transmitted signal
and the reflected signal is proportional to the speed of
the moving vehicle.
� The difference between the frequency of the
transmitted signal and that of the reflected signal is
measured by the equipment, then converted to speed
in mph or km/h.
12
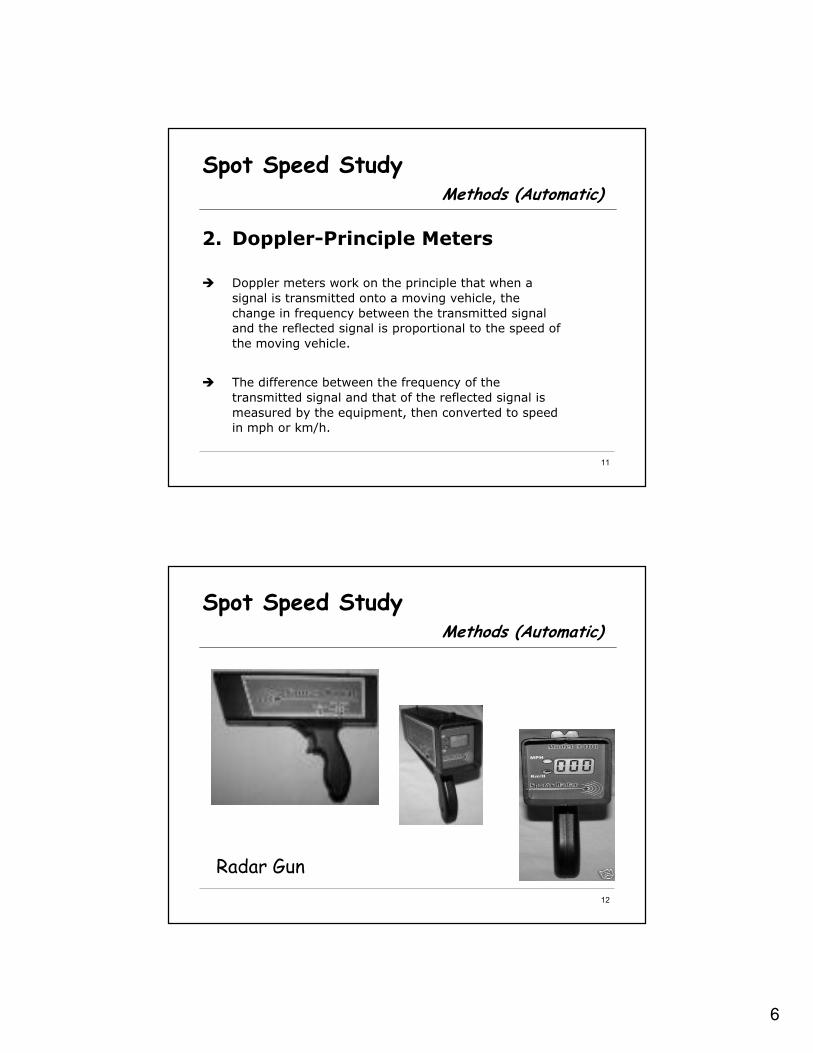
Spot Speed StudyMethods (Automatic)
Radar Gun
7
13
Spot Speed Study
14
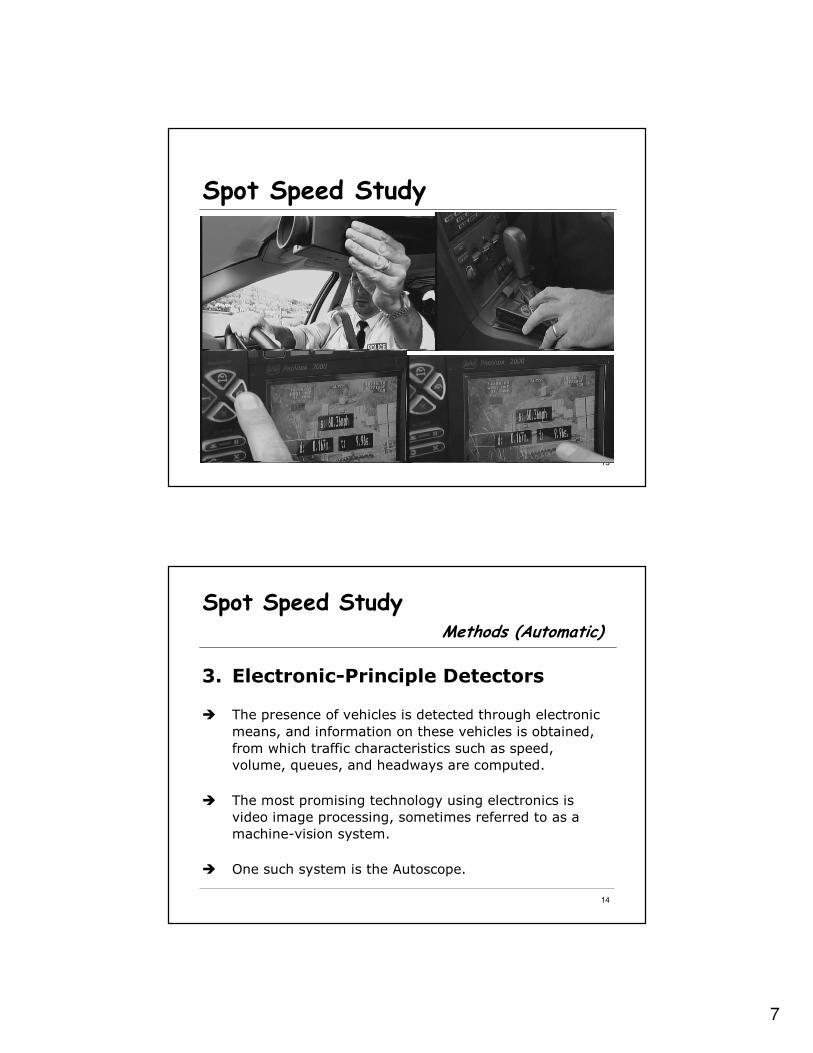
Spot Speed StudyMethods (Automatic)
3. Electronic-Principle Detectors
� The presence of vehicles is detected through electronic
means, and information on these vehicles is obtained,
from which traffic characteristics such as speed,
volume, queues, and headways are computed.
� The most promising technology using electronics is
video image processing, sometimes referred to as a
machine-vision system.
� One such system is the Autoscope.
8
15
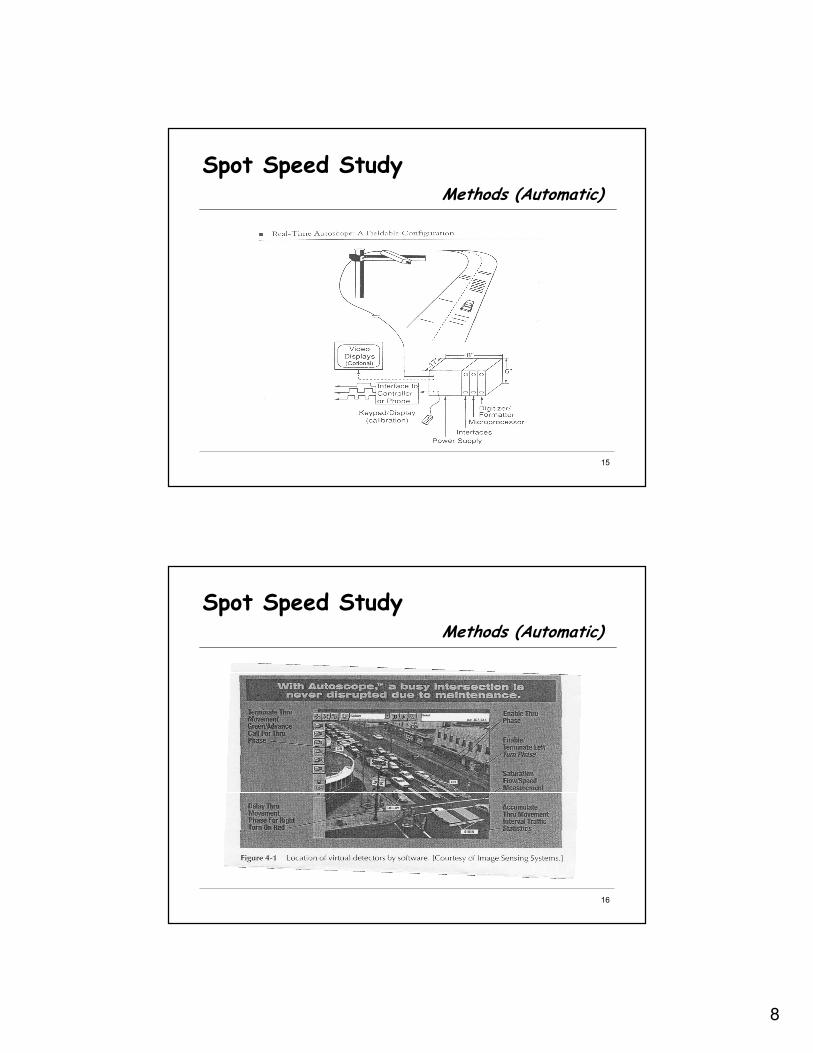
Spot Speed StudyMethods (Automatic)
16
Spot Speed StudyMethods (Automatic)
9
17
Spot Speed StudyData Presentation
� The speed data can be presented by:
1. Frequency Distribution Table, and
2. Frequency and Cumulative Frequency
Distribution Curves
18
Spot Speed Study
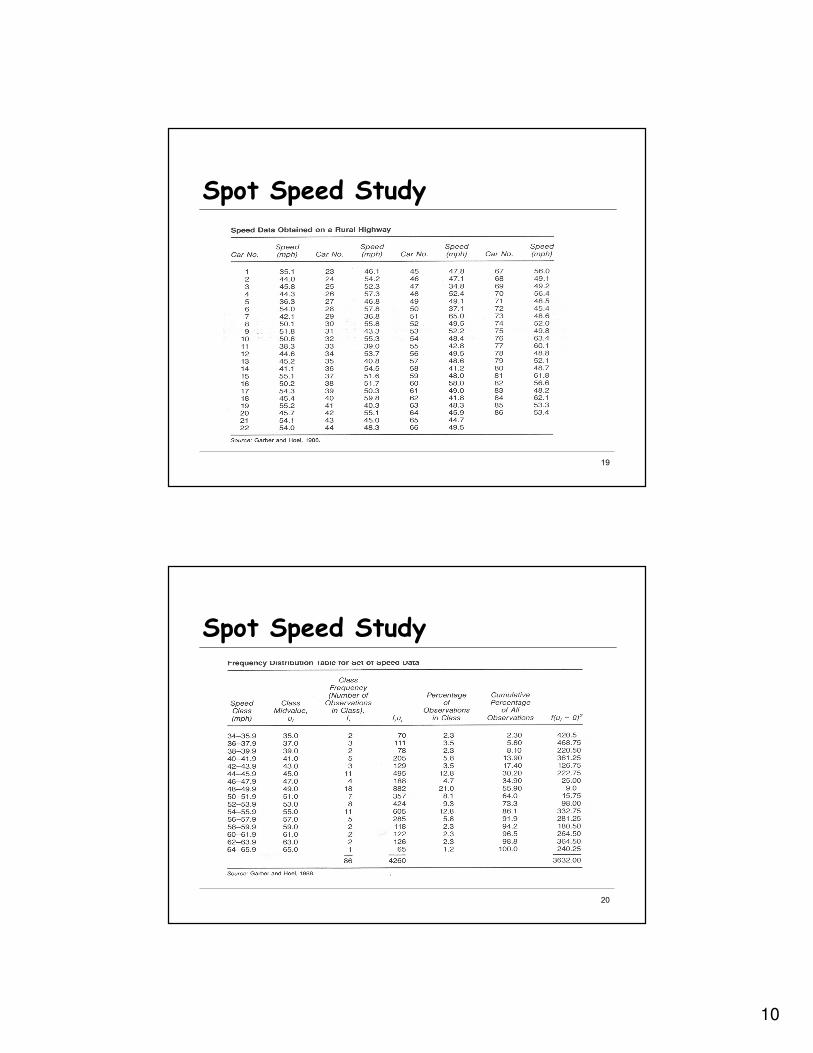
1. Frequency Distribution Table
• The individual speeds of vehicles collected from the field are used to prepare the frequency distribution table.
• The frequency distribution table shows the total number of vehicles observed in each speed group.
• Speed groups of more than 5 mph are not used.
10
19
Spot Speed Study
20
Spot Speed Study
11
21
Spot Speed Study
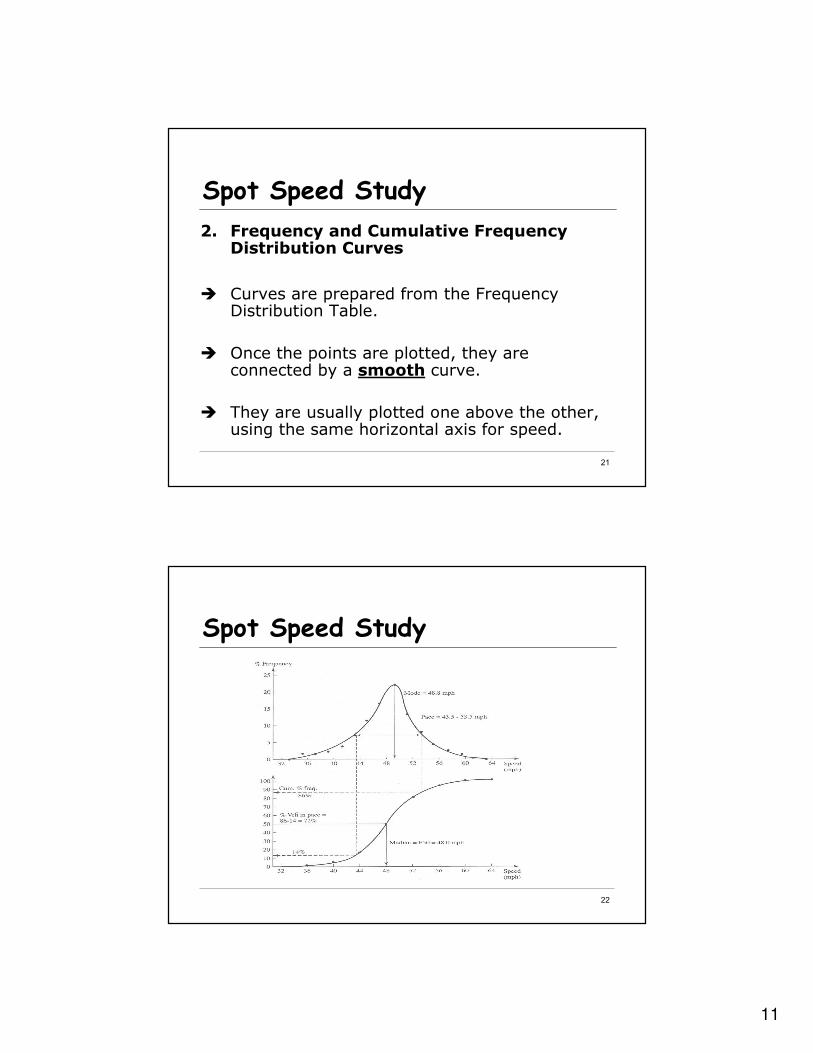
2. Frequency and Cumulative Frequency Distribution Curves
� Curves are prepared from the Frequency Distribution Table.
� Once the points are plotted, they are connected by a smooth curve.
� They are usually plotted one above the other, using the same horizontal axis for speed.
22
Spot Speed Study
12
23
Spot Speed Study
� The frequency distribution curve plots points which represent the middle speed of each speed group versus the % frequency in the speed group.
� Since the cumulative % frequency is defined as the percentage of vehicles traveling at or below a given speed, the cumulative frequency distribution curve plots the upper limit of the speed group (NOT the middle speed).
24
Common Statistics to Describe the Speed Distribution
1. Measures of Central Tendency
I. Average or Mean Speed- summation of all of the
individual observations divided by the number of
observations.
II. Median Speed- the speed that divides the distribution
into halves, i.e., there are as many drivers traveling at
speeds higher than the median as are driving slower
than it. On the cumulative frequency distribution curve,
50th percentile sped is the median speed.
Ni
Si
nx
∑=
13
25
Common Statistics to Describe the Speed Distribution
1. Measures of Central Tendency
III.Pace- defined as the 10 mph increment in speed in
which the highest percentage of drivers were observed.
It is found using the frequency distribution curve.
IV.Modal Speed- the single value of speed that is most
likely to occur.
� If a curve is perfectly symmetric around the mean, then
the average speed, the median speed, and the modal
speed are all the same.
26
Common Statistics to Describe the Speed Distribution
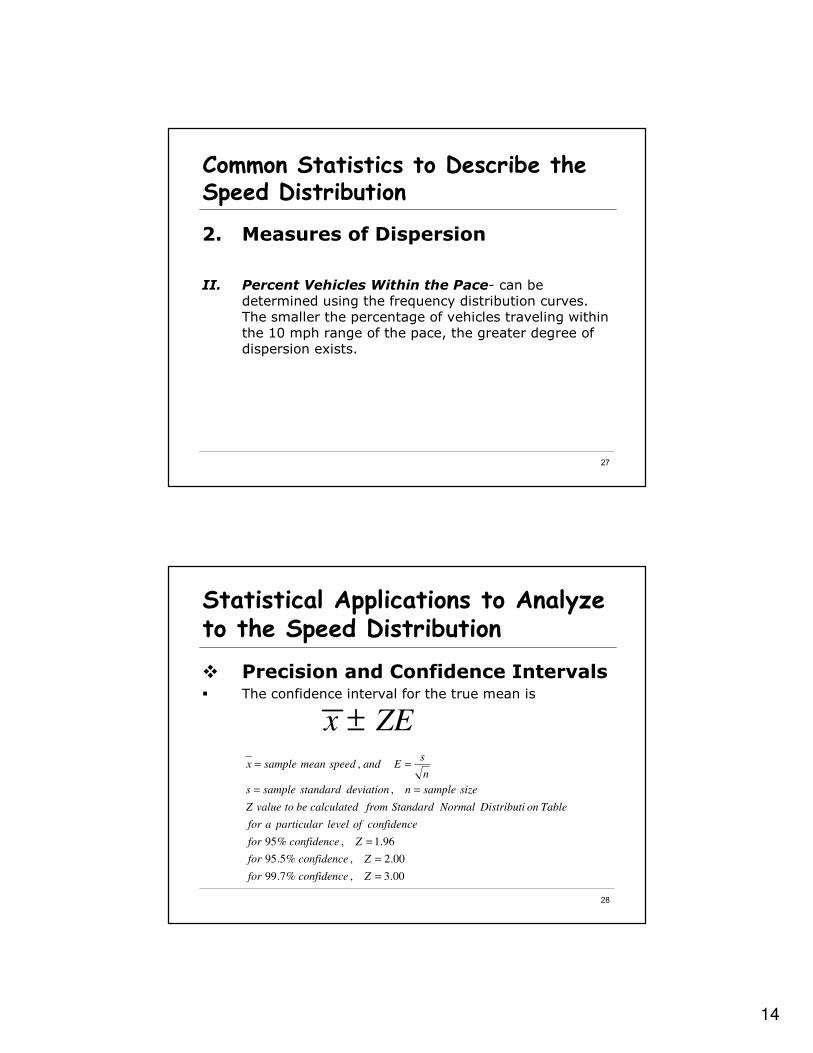
2. Measures of DispersionI. Standard Deviation- the most common measure of
spread of data around a central value.
1
2)(
−
∑ −=
N
xi
xs
1
2)(
−
∑ −=
N
xi
Si
ns
1
22
−
−∑=
N
xNi
Si
ns
14
27
Common Statistics to Describe the Speed Distribution
2. Measures of Dispersion
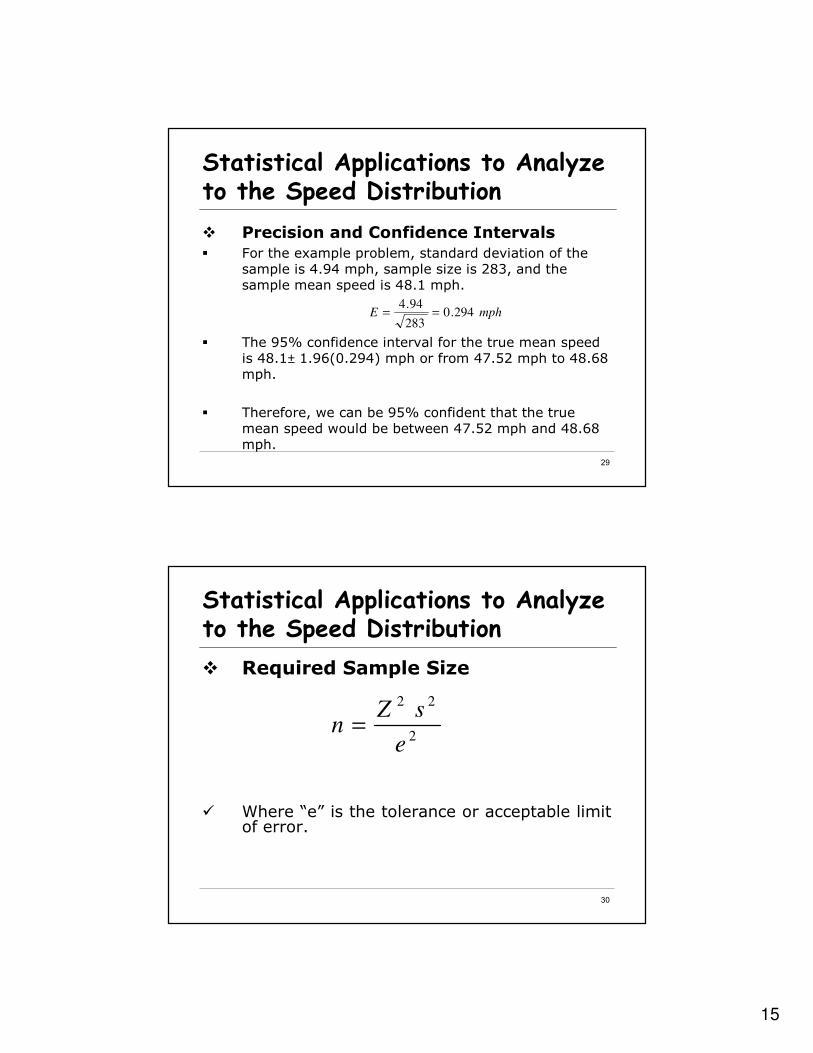
II. Percent Vehicles Within the Pace- can be determined using the frequency distribution curves. The smaller the percentage of vehicles traveling within the 10 mph range of the pace, the greater degree of dispersion exists.
28
Statistical Applications to Analyze to the Speed Distribution
� Precision and Confidence Intervals� The confidence interval for the true mean is
ZEx ±
00.3,%7.99
00.2,%5.95
96.1,%95
,
,
=
=
=
==
==
Zconfidencefor
Zconfidencefor
Zconfidencefor
confidenceoflevelparticularafor
TableonDistributiNormalStandardfromcalculatedbetovalueZ
sizesamplendeviationstandardsamples
n
sEandspeedmeansamplex
15
29
Statistical Applications to Analyze to the Speed Distribution
� Precision and Confidence Intervals
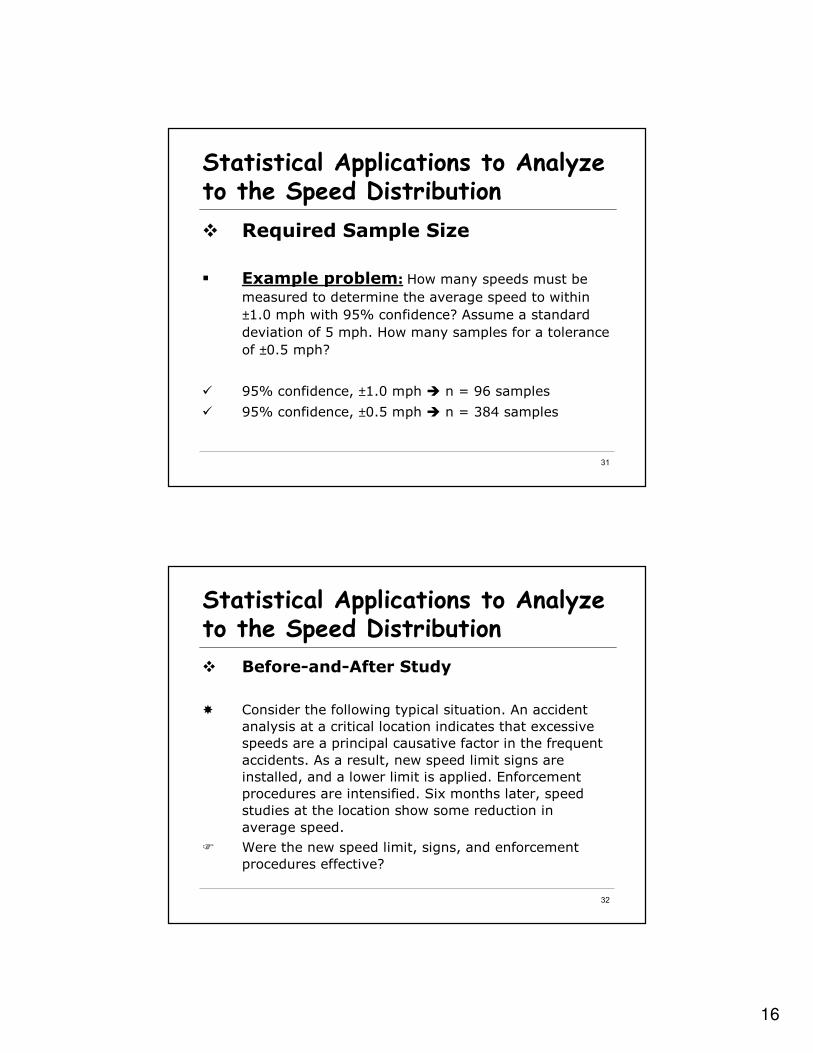
� For the example problem, standard deviation of the sample is 4.94 mph, sample size is 283, and the sample mean speed is 48.1 mph.
� The 95% confidence interval for the true mean speed is 48.1± 1.96(0.294) mph or from 47.52 mph to 48.68 mph.
� Therefore, we can be 95% confident that the true mean speed would be between 47.52 mph and 48.68 mph.
mphE 294.0283
94.4==
30
Statistical Applications to Analyze to the Speed Distribution
� Required Sample Size
� Where “e” is the tolerance or acceptable limit of error.
2
22
e
sZn =
16
31
Statistical Applications to Analyze to the Speed Distribution
� Required Sample Size
� Example problem: How many speeds must be
measured to determine the average speed to within
±1.0 mph with 95% confidence? Assume a standard
deviation of 5 mph. How many samples for a tolerance
of ±0.5 mph?
� 95% confidence, ±1.0 mph � n = 96 samples
� 95% confidence, ±0.5 mph � n = 384 samples
32
Statistical Applications to Analyze to the Speed Distribution
� Before-and-After Study
� Consider the following typical situation. An accident
analysis at a critical location indicates that excessive
speeds are a principal causative factor in the frequent
accidents. As a result, new speed limit signs are
installed, and a lower limit is applied. Enforcement
procedures are intensified. Six months later, speed
studies at the location show some reduction in
average speed.
� Were the new speed limit, signs, and enforcement
procedures effective?
17
33
Statistical Applications to Analyze to the Speed Distribution
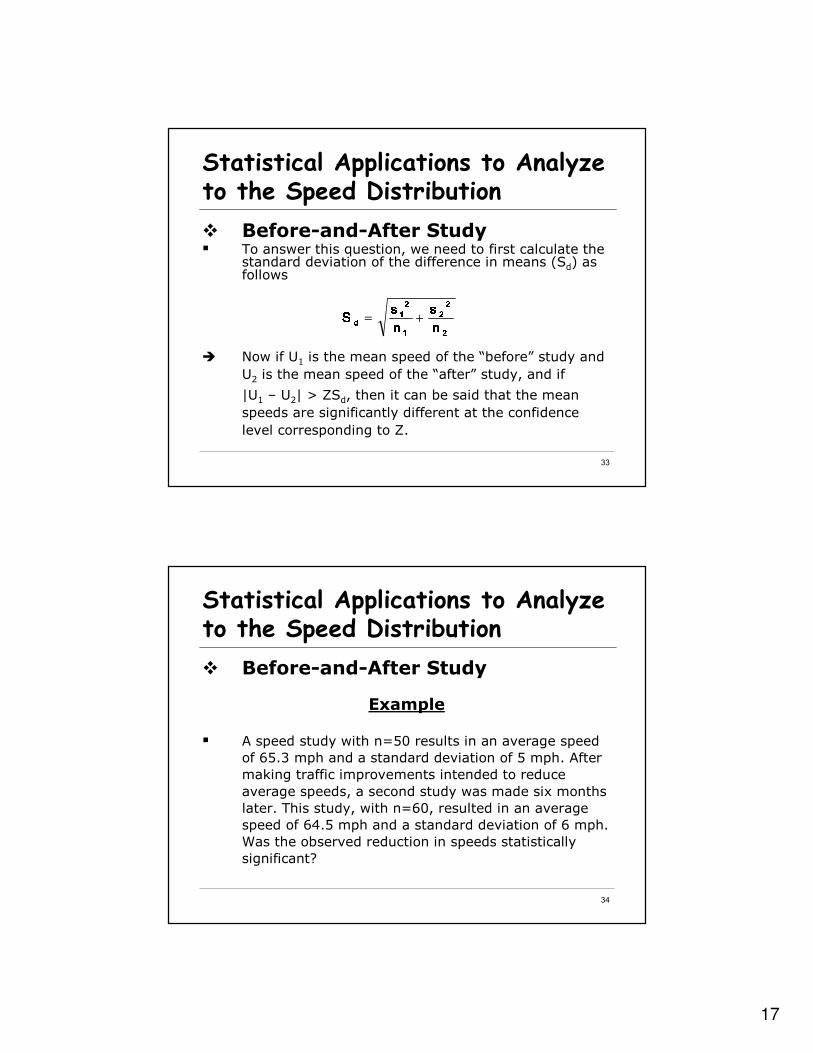
� Before-and-After Study� To answer this question, we need to first calculate the
standard deviation of the difference in means (Sd) as follows
� Now if U1 is the mean speed of the “before” study and
U2 is the mean speed of the “after” study, and if
|U1 – U2| > ZSd, then it can be said that the mean
speeds are significantly different at the confidence
level corresponding to Z.
222222222222111122221111dddd nnnnssssnnnnssssSSSS +=
34
Statistical Applications to Analyze to the Speed Distribution
� Before-and-After Study
Example
� A speed study with n=50 results in an average speed
of 65.3 mph and a standard deviation of 5 mph. After
making traffic improvements intended to reduce
average speeds, a second study was made six months
later. This study, with n=60, resulted in an average
speed of 64.5 mph and a standard deviation of 6 mph.
Was the observed reduction in speeds statistically
significant?
18
35
Statistical Applications to Analyze to the Speed Distribution
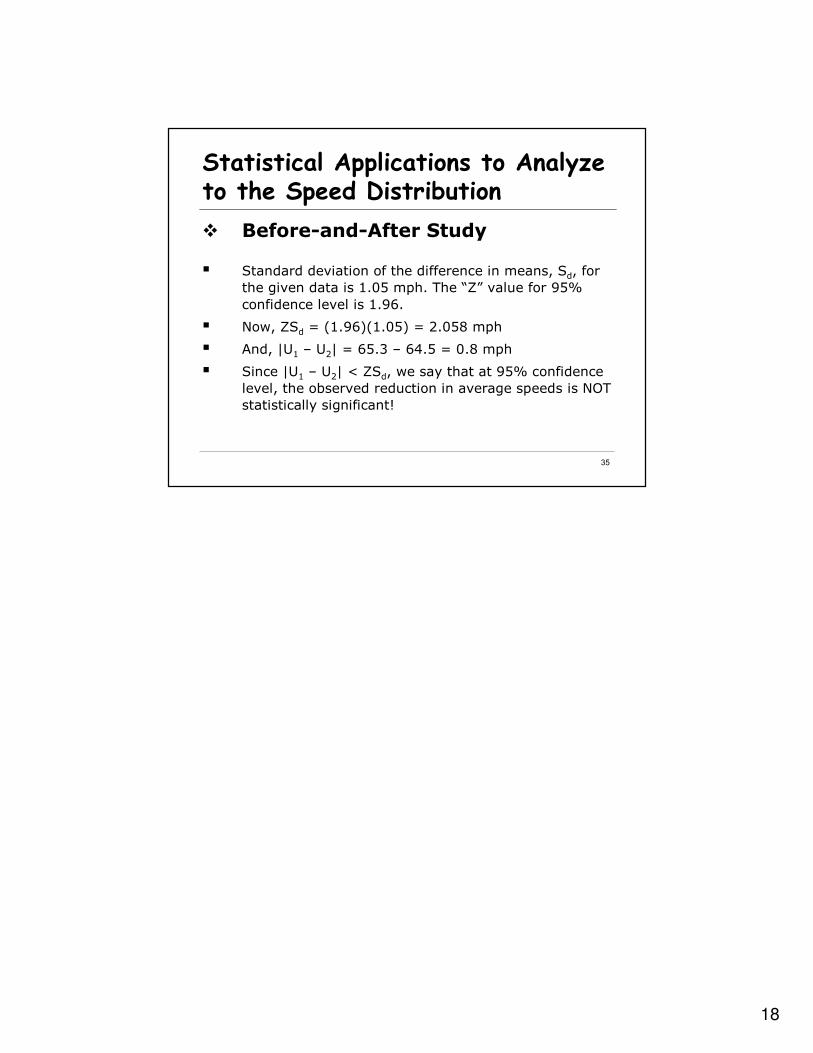
� Before-and-After Study
� Standard deviation of the difference in means, Sd, for
the given data is 1.05 mph. The “Z” value for 95%
confidence level is 1.96.
� Now, ZSd = (1.96)(1.05) = 2.058 mph
� And, |U1 – U2| = 65.3 – 64.5 = 0.8 mph
� Since |U1 – U2| < ZSd, we say that at 95% confidence
level, the observed reduction in average speeds is NOT
statistically significant!