
Spontaneous formation and dynamics of Skyrmions in a ... · The length has been rescaled so that...
21
In the format provided by the authors and unedited. by Andriy Nych, Jun-ichi Fukuda, Uliana Ognysta, Slobodan ˇ Zumer and Igor Muˇ seviˇ c Supplementary Methods Calculation of the orientational order. The free energy density of the bulk chiral liquid crystal is the sum of the local part f local and the elastic part f el , which are written in terms of the orientational tensor order parameter Q αβ as 1–3 f local {Q αβ } = c(T - T * ) TrQ 2 - √ 6b TrQ 3 + a(TrQ 2 ) 2 , (1) f el {Q αβ , ∇} = 1 4 K 1 [(∇× Q) αβ +2q 0 Q αβ ] 2 + 1 4 K 0 [(∇· Q) α ] 2 , (2) where TrQ 2 = Q αβ Q αβ , TrQ 3 = Q αβ Q βγ Q γα ,(∇× Q) αβ ≡ αγδ ∂ γ Q δβ ( αγδ is the Levi- Civita symbol) and (∇·Q) α ≡ ∂ β Q αβ (here and in the following, summations over repeated indices are implied). The parameters a, b and c in eq. (1) depend on the material (and temperature, although in the usual framework of the Landau theory, their temperature dependence is not taken into account), and a must be positive for f local to be positive definite. T * is the temperature below which an isotropic state becomes unstable with respect to small perturbations. In eq. (2), K 0 and K 1 are the elastic constants, and 2π/|q 0 |≡ p is the pitch of the helical order (q 0 = 0 for an achiral nematic). The free energy density of a surface imposing planar degenerate anchoring reads 4 f s {Q αβ } = 1 2 W 1 Tr( ˜ Q - ˜ Q ⊥ ) 2 + 1 2 W 2 (Tr ˜ Q 2 - Q 2 s ) 2 , (3) where a scalar Q s defines the strength of orientational order at the surface, ˜ Q αβ ≡ Q αβ + Spontaneous formation and dynamics of half-skyrmions in a chiral liquid-crystal film © 2017 Macmillan Publishers Limited, part of Springer Nature. All rights reserved. SUPPLEMENTARY INFORMATION DOI: 10.1038/NPHYS4245 NATURE PHYSICS | www.nature.com/naturephysics 1
Transcript of Spontaneous formation and dynamics of Skyrmions in a ... · The length has been rescaled so that...
In the format provided by the authors and unedited.
Supplementary Information for “Spontaneous formation and dynamics of half-
Skyrmions in a chiral liquid-crystal film”
by Andriy Nych, Jun-ichi Fukuda, Uliana Ognysta, Slobodan Zumer and Igor
Musevic
Supplementary Methods
Calculation of the orientational order. The free energy density of the bulk chiral
liquid crystal is the sum of the local part flocal and the elastic part fel, which are written
in terms of the orientational tensor order parameter Qαβ as1–3
flocal{Qαβ} = c(T − T ∗) TrQ2 −√6bTrQ3 + a(TrQ2)2, (1)
fel{Qαβ,∇} =1
4K1[(∇× Q)αβ + 2q0Qαβ]
2 +1
4K0[(∇ · Q)α]2, (2)
where TrQ2 = QαβQαβ, TrQ3 = QαβQβγQγα, (∇ × Q)αβ ≡ εαγδ∂γQδβ (εαγδ is the Levi-
Civita symbol) and (∇·Q)α ≡ ∂βQαβ (here and in the following, summations over repeated
indices are implied). The parameters a, b and c in eq. (1) depend on the material (and
temperature, although in the usual framework of the Landau theory, their temperature
dependence is not taken into account), and a must be positive for flocal to be positive
definite. T ∗ is the temperature below which an isotropic state becomes unstable with
respect to small perturbations. In eq. (2), K0 and K1 are the elastic constants, and
2π/|q0| ≡ p is the pitch of the helical order (q0 = 0 for an achiral nematic). The free
energy density of a surface imposing planar degenerate anchoring reads4
fs{Qαβ} =1
2W1Tr(Q− Q⊥)2 +
1
2W2(TrQ
2 −Q2s )
2, (3)
where a scalar Qs defines the strength of orientational order at the surface, Qαβ ≡ Qαβ +
1
Spontaneous formation and dynamics ofhalf-skyrmions in a chiral liquid-crystal film
© 2017 Macmillan Publishers Limited, part of Springer Nature. All rights reserved.
SUPPLEMENTARY INFORMATIONDOI: 10.1038/NPHYS4245
NATURE PHYSICS | www.nature.com/naturephysics 1

(1/3)Qsδαβ, and Q⊥αβ ≡ PαγQγδPδβ with Pαβ = δαβ − νανβ being the projection operator
where ν is a unit vector normal to the surface (along the z direction in our case). The
total free energy of our system is F =∫dx dy[fs +
∫ L
0dz (flocal + fel)].
For the convenience of the discussion and numerical calculations, we introduce the
following dimensionless quantities:
χαβ =a
bQαβ, (4)
∇ =1
2q0∇, (x, y, z) = 2q0(x, y, z) (5)
ϕlocal =a3
b4flocal = τ Trχ2 −
√6Trχ3 + (Trχ2)2, (6)
ϕel =a3
b4fel = κ2{[(∇ × χ)αβ + χαβ]
2 + η[(∇ · χ)α]2}, (7)
ϕs =2q0a
3
b4fs =
1
2w1Tr(χ− χ⊥)2 +
1
2w2(Trχ
2 − χ2s )
2 (8)
F = (2q0)3a
3
b4F =
∫dx dy[ϕs +
∫ L
0
dz (ϕlocal + ϕel)], (9)
where τ = ac(T − T ∗)/b2 is the rescaled temperature, κ = q0√aK1/b is the measure
of the strength of chirality, η = K0/K1 characterises the anisotropy of elasticity (in the
following, we set η = 1, corresponding to the so-called one-constant approximation), and
w1 = 2q0W1a/b2 and w2 = 2q0W2/a are the rescaled anchoring strengths (χ and χ⊥ are
defined similarly to Q and Q⊥). The length has been rescaled so that the natural pitch
of helical order is equal to 4π.
We chose the following parameters, κ = 0.4 and w1 = w2 = 0.1, except in the phase
diagram shown in Supplementary Fig. 2(b) (where κ = 0.2 and w1 = w2 = 0.05. Note
that κ/w1,2 is independent of q0), and χs = 0.7061 that minimises ϕlocal at τ = 0.2. With
a typical choice of material parameters,2,3 a = 8.0 × 10⁴ J m−3, b = 5.0 × 10⁴ J m−3,
c = 3.0× 10⁴ J m−3 K−1, and K0 = K1 = 10 pN, this choice of dimensionless parameters
2
© 2017 Macmillan Publishers Limited, part of Springer Nature. All rights reserved.
NATURE PHYSICS | www.nature.com/naturephysics 2
SUPPLEMENTARY INFORMATIONDOI: 10.1038/NPHYS4245
corresponds to p � 280nm, and the anchoring strength W1 � 0.7 × 10⁻⁴J m−2 that can
be regarded as weak. This value of p, which is almost equal to the lattice constant of
BP I, a, is slightly smaller than that of the liquid crystal mixture used in experiments
(� 360nm). However, the actual dimensional value of p for given κ depends on the choice
of the material parameters, and in the calculations concerning optics, only the ratio of p
(or a) to the wavelength of the incident light matters. Note that ∆τ = 1 corresponds to
∆T � 1 K.
We used the same calculation code as used in our previous studies2,3 to find the equilib-
rium profiles of χαβ and their lattice constants that minimise the total free energy per unit
area along the xy plane. We first let a profile of χαβ with hexagonal symmetry relax at
different temperatures (τ) and cell thicknesses (L). Once a different profile was obtained,
we let this profile relax at different τ ’s and L’s, and repeated this process recursively. For
κ = 0.4, −0.5 � τ � 0.15, and 0.3 � L/p � 1, only the two profiles given in Fig. 1 were
stable (Supplementary Fig. 2(a)) (Structures shown in Supplementary Figs. 2(c-g) are
stable, at least in the range of L we studied, only in a narrow temperature range below
the isotropic-ordered transition, and therefore are not the scope of the present study).
The cell thickness in Figs. 1(c,d) and (e,f) is L = 0.597p and L = 0.796p, respectively,
and the temperature is τ = −0.1.
In Fig. 1, topological defects with weaker orientational order are identified by the
isosurfaces of Trχ2 = 0.3 depicted in red, and the orientational order (defined by the
eigenvector of χ with the largest eigenvalue) is also illustrated by short cylinders at the
midplane. For the clarity of the structures, 2 × 2 unit cells along the plane of the cell
are presented in Fig. 1(c-f), where the distance between the viewpoint and the centre
of the cell is the same for all the four panels. The lateral size of the unit cell (half of
the dimensions of the cell presented in Fig. 1(c-f)) is 1.437p × 0.812p for the structure
in Figs. 1(c,d) and 1.598p × 0.860p for that in Figs. 1(e,f). The lattice constant of the
hexagonal half-Skyrmion lattice is 0.812p and in real units � 290nm for p = 360nm.
3
© 2017 Macmillan Publishers Limited, part of Springer Nature. All rights reserved.
NATURE PHYSICS | www.nature.com/naturephysics 3
SUPPLEMENTARY INFORMATIONDOI: 10.1038/NPHYS4245

The equation of motion for χαβ to obtain Supplementary Movies 3 and 4 and Supple-
mentary Figures 3 and 4 is the same as that used in Ref. 5 except that a thermal noise
term is included in the present study, namely,
∂
∂tχαβ(r, t) = −Iαβµν
tχ
δF
δχµν(r)+ ξαβ(r, t), (10)
where tχ � 1µs (Ref. 5) is the characteristic time for rotational relaxation, and F
is the free energy functional in terms of χαβ calculated by the bulk and surface free
energy densities ϕlocal, ϕel and ϕs. The isotropic tensor Iαβµν ≡ (1/2)(δαµδβν + δανδβµ)−
(1/3)δαβδµν ensures the symmetry (χαβ = χβα) and the tracelessness of χ. The thermal
noise term ξαβ(r, t) satisfies the fluctuation-dissipation theorem 〈ξαβ(r, t)ξµν(r′, t′)〉 =
2kBTIαβµνt−1χ δ(r − r′)δ(t − t′), with kB and T being the Boltzmann constant and the
absolute temperature, respectively. All the parameters in the free energy are the same as
those for the calculation of the equilibrium structures mentioned above, except that τ is
now set to −0.5 to ensure that the ordered structures are not destroyed by the thermal
noise. The initial condition is χαβ = 0 (isotropic). The cell thickness is L = 0.637p and
0.668p for Supplementary Movies 3 and 4, respectively, and the common lateral dimension
is 8.149p. The duration of Supplementary Movies 3 and 4 is 2 × 10⁵tχ(� 200ms), with
the time interval per frame being 1× 10³tχ(� 1ms). Topological defects are depicted in
the same manner as those for the equilibrium structures.
For the calculation of the profiles of orientational order in Fig. 3(c) leading to Fig. 3(b),
we did the same calculation as mentioned above, except that a smaller lateral dimension of
2.546p (corresponding to 0.92 µm when p = 360 nm) was chosen, because the calculation
of intensity profiles was highly demanding numerically. This lateral size was chosen so
that it is small enough to allow the calculation of intensity profiles, but still large enough
to accommodate interesting reorganisation of disclination lines found in Supplementary
Movie 3 and Supplementary Figure 3. The cell thickness is L = 0.637p. We did the
4
© 2017 Macmillan Publishers Limited, part of Springer Nature. All rights reserved.
NATURE PHYSICS | www.nature.com/naturephysics 4
SUPPLEMENTARY INFORMATIONDOI: 10.1038/NPHYS4245
same calculation for the profile given in Fig. 4(b), except that to focus on an isolated
Skyrmion by suppressing the spontaneous formation of Skyrmions in the background, we
chose a thinner cell L = 0.191p and stronger surface anchoring with w1 = w2 = 0.2 and
χs = 1.225.
For the visualisation of disclination lines in Fig. 3(c), we first calculated the bi-
narised scalar order parameter averaged along the z-direction, defined by s(x, y) =
(1/L)∫ L
0dz H(0.3 − Trχ2(x, y, z)), where H(x) is the Heaviside step function. Note
that s(x, y) is maximised when a disclination line is along the z-axis, because H(0.3 −
Trχ2(x, y, z)) = 1 at the disclination core with weaker orientational order. In Fig. 3(c),
red and black correspond to s(x, y) = 1 and 0, respectively, and small bright spots corre-
spond to disclination lines normal to the cell. Tilted disclination lines appear as darker
blurred spots. For the identification of half-Skyrmion centres where n is oriented along
the z-direction, the average of Qzz along the z-direction (denoted by Qzz(x, y), later)
was calculated and a point (xc, yc) was identified as a half-Skyrmion centre if the local
maximum of Qzz(x, y) in a circle (x − xc)2 + (y − yc)
2 ≤ r2 was at (xc, yc) (Here r was
set to 0.255p, smaller than the typical spacing between two half-Skyrmion centres).
Calculation of the real-space images. The Maxwell equation for the electric field
E of a monochromatic light (with the angular frequency being ω) in a non-magnetic
medium with no electric current or free electric charge reads6
[∇×∇×E]α −(ωc
)2
εαβEβ = 0, (11)
where c is the speed of light in vacuum, and εαβ is the dielectric tensor. The setup of the
geometry is such that the liquid crystal occupies the region 0 ≤ z ≤ L and the light is
incident from z = −∞. The regions z < 0 and z > L are isotropic and uniform in terms of
electromagnetic properties and let ε1 and ε3 denote their dielectric constants, respectively.
5
© 2017 Macmillan Publishers Limited, part of Springer Nature. All rights reserved.
NATURE PHYSICS | www.nature.com/naturephysics 5
SUPPLEMENTARY INFORMATIONDOI: 10.1038/NPHYS4245

We assume the periodicity of the order of the liquid crystal and thus εαβ in the (x, y)
directions, and that the electric field of the incident light is given by E(r) = Ei exp(ikir)
satisfying ki ·Ei = 0 (transverse condition). We define the polar and azimuthal angles θ
and φ by ki = |ki|(sin θ cosφ, sin θ sinφ, cos θ).
The Bloch theorem dictates that E is formally written as
E(r⊥, z) =
Ei exp(iki · r) +∑m,n
E(m,n)r exp[i((ki⊥ +G
(m,n)⊥ ) · r⊥ + k(m,n)
rz z)] (z < 0),
∑m,n
E(m,n)LC (z) exp(i(ki⊥ +G
(m,n)⊥ ) · r⊥) (0 < z < L),
∑m,n
E(m,n)t exp[i((ki⊥ +G
(m,n)⊥ ) · r⊥ + k
(m,n)tz (z − L))] (z > L),
(12)
where G(m,n)⊥ is a 2-dimensional reciprocal vector labelled by integers m and n that is
consistent with the periodicity of liquid crystal ordering, and ki⊥ is ki projected onto the
(x, y) plane. From the dispersion relations, we have |k(m,n)⊥ |2 + (k
(m,n)rz )2 = ε1(ω/c)
2 (=
|ki|2) and |k(m,n)⊥ |2 + (k
(m,n)zt )2 = ε3(ω/c)
2, where we have defined k(m,n)⊥ ≡ ki⊥ +G
(m,n)⊥ .
How to solve eq. (11) for given ki and Ei is presented in our previous work.7
We assume a linear relationship between εαβ and χαβ such that εαβ = εisoδαβ + εaχαβ.
We chose ε1 = ε3 = n2 with the refractive index n = 1.5, close to that of the immersion oil
used in experiments (n = 1.515). The dielectric constants for the liquid crystal material
used in the experiments are not clear, and we set εiso = 2.571 and εa = 0.825 so that the
average refractive index was 1.6. We calculated Eq. (11) for 12749 different ki’s satisfying
|ki| = 0.590, 0 ≤ θ ≤ sin−1(NA/n) and 0 ≤ φ ≤ π, and for two orthogonal transverse Ei’s
that we denote by Eiµ (µ = 1, 2) hereafter. Here NA = 1.4 is the numerical aperture.
We made use of the C2 rotational symmetry about the z-axis, and chose |ki| = 0.590 so
that the ratio of the short edge of the unit cell of the structure shown in Fig. 1 (e) to the
wavelength to be equal to that in experiments (284nm to 420nm).
In the following, we label different ki’s, and relevant variables, by j. We set the phase of
6
© 2017 Macmillan Publishers Limited, part of Springer Nature. All rights reserved.
NATURE PHYSICS | www.nature.com/naturephysics 6
SUPPLEMENTARY INFORMATIONDOI: 10.1038/NPHYS4245
the incident light so that it was focused at a certain point rf = (r⊥f , zf). We let mutually
orthogonal unit vectors pµ (µ = 1, 2) characterise the polarisation of the focused light,
and set the phase of the incident light for each k(j)i such that the electric fields of the
incident light for different k(j)i ’s are in phase at rf , namely,
E(j)iµ exp(ik
(j)i⊥ · rf) = pµ − (k
(j)i · pµ)k
(j)i /|k(j)
i |2 (13)
(The right-hand-side is the projection of pµ onto the plane perpendicular to k(j)i . Note
the transverse condition E(j)iµ · k(j)
i = 0). The (superposed) electric field of the reflected
light for given µ now reads
Erµ(r⊥, z) =∑j
′∑m,n
E(j),(m,n)rµ exp[i((k
(j)i⊥ +G
(m,n)⊥ ) · r⊥ + k(j),(m,n)
rz z)], (14)
whereE(j),(m,n)rµ is the solution of the Maxwell equation (see eqs. 11 and 12) for given µ and
k(j)i , and the prime in the summation
∑′m,n means that only propagating contributions
with real k(j),(m,n)rz are summed (that is, we drop evanescent contributions with imaginary
k(j),(m,n)rz ). The magnetic field of the reflected light is, from the Maxwell equation, given
by Hrµ = (iµ0ω)−1∇×Erµ, where µ0 is the magnetic permeability of the vacuum. The
Poynting vector is Srµ = �Erµ × �Hrµ (� is the real part of a complex variable), and
the intensity profile of reflected light at a given surface z = zr is thus expressed as
Irµ(r⊥, zr; r⊥f , zf) = −z ·Srµ(r, zr), where z is the unit vector along the +z direction, and
for further discussions, the focal point of the incident light (rf , zf) is explicitly specified.
In a usual setup of optical microscope used in our experiments, the focal point rf is
distributed at a focal plane (in our case with fixed zf), and the incident light with the
focal point rf and the label of polarisation µ is not correlated that with different (rf ,µ).
If we assume that the intensity of the incident light for a focal point rf is independent of
r⊥f , and that the incident light is not polarised, the total intensity of the reflected light
is simply given by Ir(r⊥; zr, zf) =∑
µ=1,2
∫dr⊥f Irµ(r⊥, zr; r⊥f , zf). Moreover, zr must be
7
© 2017 Macmillan Publishers Limited, part of Springer Nature. All rights reserved.
NATURE PHYSICS | www.nature.com/naturephysics 7
SUPPLEMENTARY INFORMATIONDOI: 10.1038/NPHYS4245
equal to zf because the same lens condenses the incident light and collects the reflected
light.
In Figs. 2 (d,e), we plotted√
Ir(r⊥; zr = zf = L/2) in the same linear greyscale; black
and white correspond to Ir = 0 and the maximum of Ir for Fig. 2 (e), respectively. Note
that z = L/2 is the midplane of the liquid crystal cell. The intensity profiles for different
zf ’s are presented in Supplementary Figure 5, which indicates that the intensity profile is
insensitive to zf as long as zf is not small (that is, the focal plane is not close to the surface
of the cell facing the light source). We plotted√
Ir(r⊥) instead of Ir(r⊥) to enhance the
visibility in Fig. 2 (d). The scale bar is 2.78p corresponding to 1µm for p = 360nm.
For the images presented in Figs. 3(b), 4 (c), and Supplementary Figs. 6(b,c), the
same procedures as described above were employed, except that the calculations were
carried for 1639 different ki’s with |ki| = 0.643 (for Figs. 3(b)), or 1.050 (for Figs. 4
(c), and Supplementary Figs. 6(b,c)), 0 ≤ θ ≤ sin−1(NA/n) (NA = 1.4, n = 1.5), and
0 ≤ φ < 2π (For Figs. 4 (c), to reproduce the setup with NA = 0.3, we discarded the
calculation results for sin−1(0.3/n) ≤ θ ≤ sin−1(1.4/n)). The smaller number of ki’s was
because of the higher numerical demand, and the different range of φ is because the C2
rotational symmetry could not be exploited. We chose the above-mentioned |ki| so that
the ratio of the cholesteric pitch to the wavelength of the incident light approximately
equals that in the experiments. The greyscale of Fig. 3(b), common to all the panels, is
different from that of Figs. 2 (d,e), and was chosen such that black and white correspond
to Ir = 0 and the maximum of Ir for the middle panel of Fig. 3(b), respectively.
8
© 2017 Macmillan Publishers Limited, part of Springer Nature. All rights reserved.
NATURE PHYSICS | www.nature.com/naturephysics 8
SUPPLEMENTARY INFORMATIONDOI: 10.1038/NPHYS4245
Supplementary Discussions
Why a half-Skyrmion lattice is not observed in a chiral liquid crystal with
larger pitch.
Let us first review how Skyrmion-like structures can be stabilised in a chiral system in
general. We denote a vector order parameter by σ = λn, where n is a unit vector (the
director of a liquid crystal, or normalised magnetisation), and λ is the amplitude. The
free energy density is formally written as1,8
φ = κ2
(λ2
∑i,j=x,y,z
(∇inj)2 + η|∇λ|2
)+ φchiral(λ,n) + φlocal(λ), (15)
where κ2 is the stiffness. The chiral term φchiral(λ,n) becomes κ2λ2q0n · (∇ × n) for
a liquid crystal with q0 being the strength of chirality, and comprises, for a ferromag-
net, Lifshitz invariants of σ consistent with the symmetry. The local energy φlocal(λ) is
given by a Landau expansion in terms of λ, setting its optimum value. Note that the
free energy density in terms of a second-rank tensor used in our numerical calculations
(Supplementary Methods) can be converted to eq. (15) when the orientational order is
uniaxial.1 Roßler et al.8 showed that when η < 1 (softened elasticity of the amplitude of
magnetisation), Skyrmions can be stable over paramagnetic and helical phases in a finite
range of temperature, by reducing λ and thus the first term of eq. (15) away from the
Skyrmion centre. Similar argument holds for a liquid crystal because η = 1/3 (Ref. 1).
Smaller energetic penalty of reducing λ facilitates the formation of the singularities in
n, inherent in our half-Skyrmion lattice as well as that of a ferromagnet,8 and in bulk
cholesteric blue phases.1
However, when κ is smaller, the effect of φlocal disfavouring the singularities in n whose
λ deviates from its optimum value becomes more significant. In the case of a chiral
liquid crystal,1 in an appropriately rescaled free energy κ is inversely proportional to
9
© 2017 Macmillan Publishers Limited, part of Springer Nature. All rights reserved.
NATURE PHYSICS | www.nature.com/naturephysics 9
SUPPLEMENTARY INFORMATIONDOI: 10.1038/NPHYS4245

the natural pitch of twisted order p (Supplementary Methods). It is known9 that bulk
cholesteric blue phases are not observed when p is larger than some threshold value,
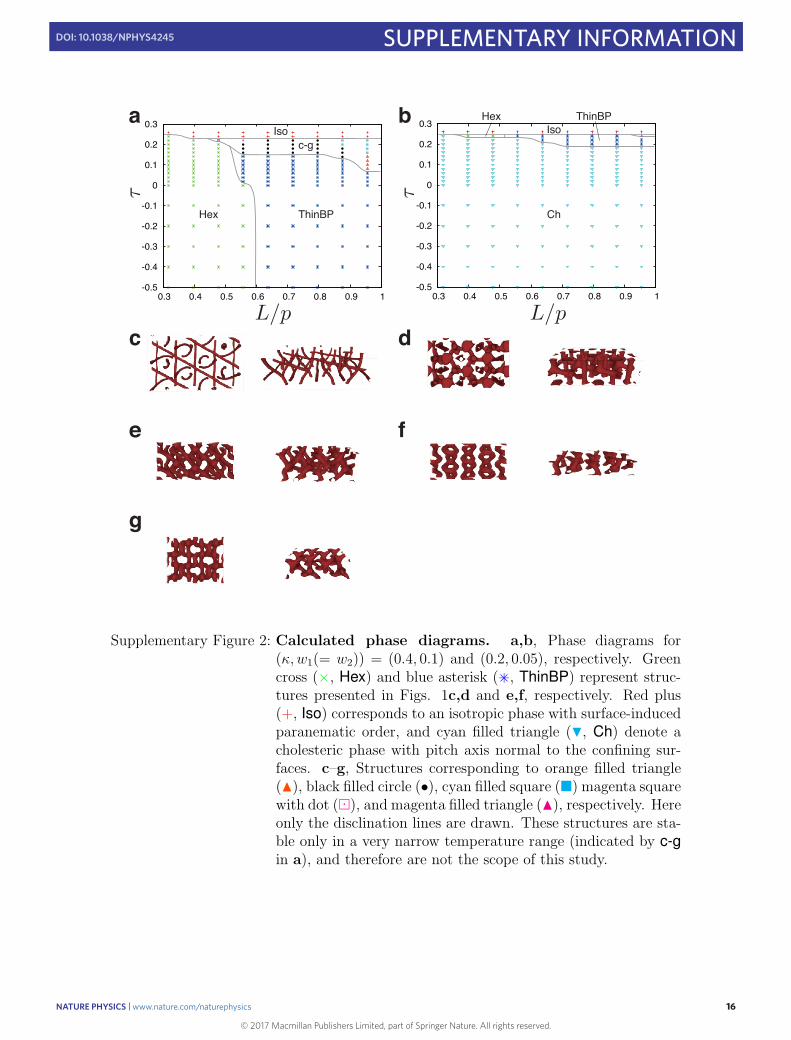
which is typically a few hundred nanometres. The phase diagrams in Supplementary
Fig. 2(a,b) (κ for Supplementary Fig. 2(a) is twice as large as that for Supplementary
Fig. 2(b); see Supplementary Methods) clearly indicate that for smaller κ and therefore
larger p our half-Skyrmion lattice becomes much less energetically favourable. For the
same reason as mentioned above, previous experimental studies10–13 using a chiral liquid
crystal with p on the order of 10 µm (more than one order of magnitude larger than
that in our experiments) did not observe a half-Skyrmion lattice, but different types of
topological excitations free from disclinations spanning the whole cell thickness. We note
that optical observation of our half-Skyrmion lattice, as well as that of bulk cholesteric
blue phases14 is a challenge, because p is on the order of or smaller than the wavelength
of visible light.
Estimate of the fluctuation amplitude of a vertical disclination line in a
hexagonal half-Skyrmion lattice
Here we treat the honeycomb lattice of vertical disclination lines as a continuum two-
dimensional (2D) elastic medium whose effective free energy is written as
F �∫
d2r1
2K(∂αuβ)
2, (16)
where K is the effective elastic constant, u(r) is the 2D displacement of the disclination
line, and α, β = x, y (summation over repeated indices are implied). In a 2D honeycomb
lattice with 6-fold symmetry, there should be two elastic constants corresponding to
shear and bulk moduli.15 However it turns out that the final results of the fluctuation
amplitude shown below are the same, with K being replaced by a function of the two
elastic constants. To make the discussion simpler, we proceed with the “one-constant”
10
© 2017 Macmillan Publishers Limited, part of Springer Nature. All rights reserved.
NATURE PHYSICS | www.nature.com/naturephysics 10
SUPPLEMENTARY INFORMATIONDOI: 10.1038/NPHYS4245

form of the free energy (16).
We introduce a Fourier transform of the displacement field as u(q) = (1/L2)∫d2re−iq·ru(r),
where L is the dimension of the 2D system along one direction, and the wavevector q sat-
isfies qL/2π = (m,n), with m and n being integers. The equipartition theorem16 yields
(1/2)KL2q2〈|u(q)|2〉 = kBT , where 〈· · · 〉 denotes the statistical average, and q = |q|.
Thus we have
〈|u(r)|2〉 =2kBT
KL2
∑q
1
q2
� 2kBT
KL2
(L2π
)2 ∫ 2π/l
2π/Ldq 2πq
1
q2
=kBT
πKln
Ll
(17)
where the discrete sum∑
q has been converted to an integral over q, i.e., (L/2π)2∫dq,
and l is the distance between neighbouring vertical disclinations that introduces the upper
cutoff in the integral over q.
Our next task is to estimate the effective elastic constant K. The excess free energy due
to the displacement arises from the deviation of the wavenumber of the twist distortions,
which we will denote by ∆q, from its optimum value q0. In terms of the pitch deviation
∆p, ∆q is given by −2π∆p/p20, where p0 = 2π/q0 is the optimum pitch. From eqs. (2)
and (7) in Supplementary Methods, the excess free energy per unit volume is
fel � 2χ20κ
2b4
a3(2π∆p/p20)
2,
� 103(∆p
p0
)2
[Jm−3](18)
where χ0 � 1 is the degree of order defined by χαβ = χ0(nαnβ − (1/3)δαβ) with n being
the director, and κ = 0.4 is used. Other material parameters, a and b, are given in
Supplementary Methods (“Calculation of the orientational order”). We simply assume
(∂αuβ)2 � (∆p/l)2, and we finally obtain
K � 2× 10³L
(l
p0
)2
[Jm−2], (19)
11
© 2017 Macmillan Publishers Limited, part of Springer Nature. All rights reserved.
NATURE PHYSICS | www.nature.com/naturephysics 11
SUPPLEMENTARY INFORMATIONDOI: 10.1038/NPHYS4245
where L is the cell thickness in metre.
Notice that l = D/√3, with D being the distance between two neighbouring half-
Skyrmion centres, and that D � 0.8p0 in both experiments and numerical calculations.
With kBT = 4.1 × 10⁻²¹ J, L/l � 103 (corresponding to setting L � 170 µm), and the
experimental value L � 250 nm = 2.5 × 10⁻⁷ m, we finally have√〈|u(r)|2〉 � 10 nm,
and√
〈|u(r)|2〉/l � 0.06, as noted in the main text.
We also note that the dynamic correlation function for u can be easily obtained16 when
we assume a relaxational equation of motion for u, i.e., (∂/∂t)u(r, t) = −ΓδF/δu(r, t)+
ξ(r, t), with Γ being the kinetic coefficient associated with the viscosity of the liquid
crystal (that can depend on the wavenumber q), and ξ(r, t) is a thermal noise satisfying
the fluctuation-dissipation relation. We have
〈u(q, ω) · u(q′, ω′)〉 = 4ΓkBT
ω2 + (ΓKq2)22π
L2δ(ω + ω′)δq+q′,0, (20)
where we have introduced the Fourier transform u(q, ω) = (1/L2)∫d2r
∫∞−∞ dt e−iq·re−iωtu(r).
Note that eq. (17) can be derived also from eq. (20). The divergence of the correlation
function for ω → 0 and q → 0 clearly indicates the presence of the Goldstone mode
responsible for long-wavelength fluctuations of the fringe-like structures (Supplementary
Movie 2).
12
© 2017 Macmillan Publishers Limited, part of Springer Nature. All rights reserved.
NATURE PHYSICS | www.nature.com/naturephysics 12
SUPPLEMENTARY INFORMATIONDOI: 10.1038/NPHYS4245
References
[1] Wright, D. C. & Mermin, N. D. Crystalline liquids: the blue phases. Rev. Mod.
Phys. 61, 385–432 (1989).
[2] Fukuda, J. & Zumer, S. Quasi-two-dimensional Skyrmion lattices in a chiral nematic
liquid crystal. Nature Communications 2, 246 (2011).
[3] Fukuda, J. & Zumer, S. Cholesteric blue phases: effect of strong confinement. Liq.
Cryst. 37, 875–882 (2010).
[4] Fournier, J.-B. & Galatola, P. Modeling planar degenerate wetting and anchoring
in nematic liquid crystals. EPL (Europhysics Letters) 72, 403 (2005).
[5] Fukuda, J. & Zumer, S. Field-induced dynamics and structures in a cholesteric-blue-
phase cell. Phys. Rev. E 87, 042506 (2013).
[6] Landau, L. D., EM, L. & Pitaevskii, L. Electrodynamics of continuous media, vol. 8
(elsevier, 1984), 2 edn.
[7] Fukuda, J. & Zumer, S. Exotic Defect Structures and Their Optical Properties in a
Strongly Confined Chiral Liquid Crystal. Mol. Cryst. Liq. Cryst. 594, 70–77 (2014).
[8] Roßler, U., Bogdanov, A. & Pfleiderer, C. Spontaneous skyrmion ground states in
magnetic metals. Nature 442, 797–801 (2006).
[9] Stegemeyer, H., Blmel, T., Hiltrop, K., Onusseit, H. & Porsch, F. Thermodynamic,
structural and morphological studies on liquid-crystalline blue phases. Liquid Crys-
tals 1, 3–28 (1986).
[10] Smalyukh, I. I., Lansac, Y., Clark, N. A. & Trivedi, R. P. Three-dimensional struc-
ture and multistable optical switching of triple-twisted particle-like excitations in
anisotropic fluids. Nature Mater. 9, 139–145 (2010).
13
© 2017 Macmillan Publishers Limited, part of Springer Nature. All rights reserved.
NATURE PHYSICS | www.nature.com/naturephysics 13
SUPPLEMENTARY INFORMATIONDOI: 10.1038/NPHYS4245
[11] Ackerman, P. J., Qi, Z. & Smalyukh, I. I. Optical generation of crystalline, qua-
sicrystalline, and arbitrary arrays of torons in confined cholesteric liquid crystals for
patterning of optical vortices in laser beams. Phys. Rev. E 86, 021703 (2012).
[12] Ackerman, P. J., Trivedi, R. P., Senyuk, B., van de Lagemaat, J. & Smalyukh, I. I.
Two-dimensional skyrmions and other solitonic structures in confinement-frustrated
chiral nematics. Phys. Rev. E 90, 012505 (2014).
[13] Ackerman, P. J., van de Lagemaat, J. & Smalyukh, I. I. Self-assembly and elec-
trostriction of arrays and chains of hopfion particles in chiral liquid crystals. Nature
Communications 6, 6012 (2015).
[14] Higashiguchi, K., Yasui, K. & Kikuchi, H. Direct observation of polymer-stabilized
blue phase I structure with confocal laser scanning microscope. J. Am. Chem. Soc.
130, 6326–6327 (2008).
[15] Landau, L., Lifshitz, E., Kosevich, A. & Pitaevskiı, L. Theory of Elasticity. Course
of theoretical physics (Butterworth-Heinemann, 1986).
[16] Chaikin, P. M. & Lubensky, T. C. Principles of Condensed Matter Physics (Cam-
bridge University Press, Cambridge, 1995).
14
© 2017 Macmillan Publishers Limited, part of Springer Nature. All rights reserved.
NATURE PHYSICS | www.nature.com/naturephysics 14
SUPPLEMENTARY INFORMATIONDOI: 10.1038/NPHYS4245
a
d
c
b
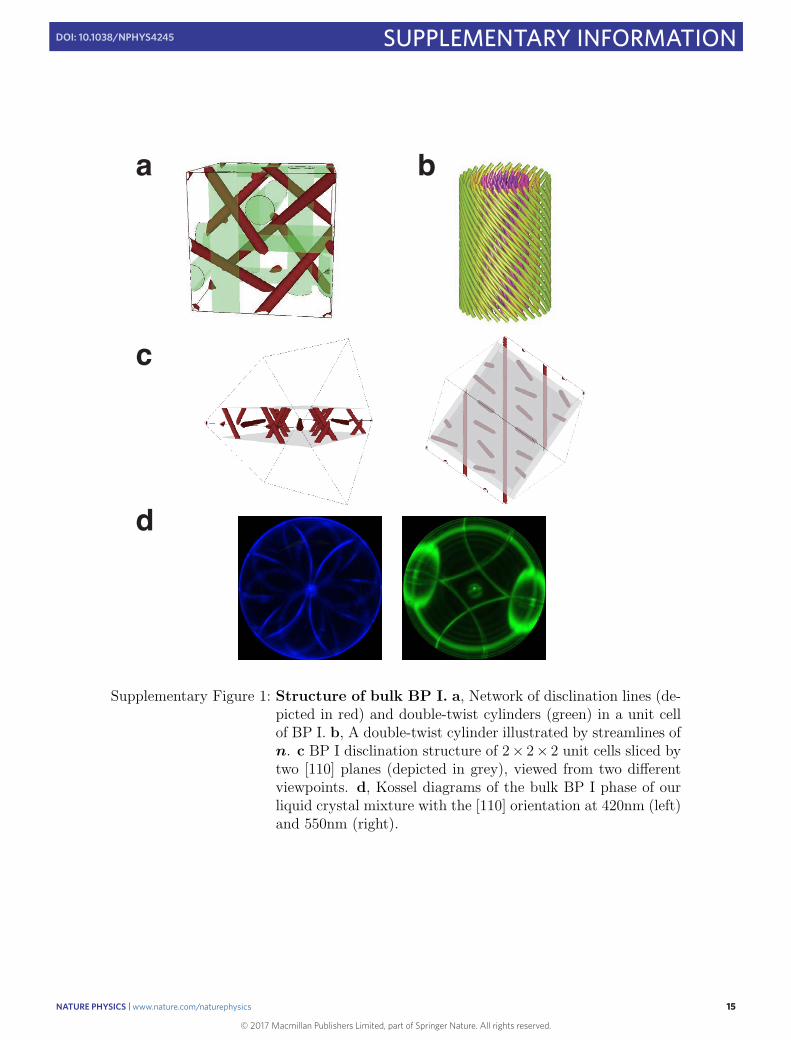
Supplementary Figure 1: Structure of bulk BP I. a, Network of disclination lines (de-picted in red) and double-twist cylinders (green) in a unit cellof BP I. b, A double-twist cylinder illustrated by streamlines ofn. c BP I disclination structure of 2× 2× 2 unit cells sliced bytwo [110] planes (depicted in grey), viewed from two differentviewpoints. d, Kossel diagrams of the bulk BP I phase of ourliquid crystal mixture with the [110] orientation at 420nm (left)and 550nm (right).
15
© 2017 Macmillan Publishers Limited, part of Springer Nature. All rights reserved.
NATURE PHYSICS | www.nature.com/naturephysics 15
SUPPLEMENTARY INFORMATIONDOI: 10.1038/NPHYS4245
-0.5
-0.4
-0.3
-0.2
-0.1
0
0.1
0.2
0.3
0.3 0.4 0.5 0.6 0.7 0.8 0.9 1-0.5
-0.4
-0.3
-0.2
-0.1
0
0.1
0.2
0.3
0.3 0.4 0.5 0.6 0.7 0.8 0.9 1
a b
c d
e f
g
Hex ThinBP
Isoc-g
Iso
Ch
Hex ThinBP
Supplementary Figure 2: Calculated phase diagrams. a,b, Phase diagrams for(κ, w1(= w2)) = (0.4, 0.1) and (0.2, 0.05), respectively. Greencross (×, Hex) and blue asterisk (+×, ThinBP) represent struc-tures presented in Figs. 1c,d and e,f, respectively. Red plus(+, Iso) corresponds to an isotropic phase with surface-inducedparanematic order, and cyan filled triangle (�, Ch) denote acholesteric phase with pitch axis normal to the confining sur-faces. c–g, Structures corresponding to orange filled triangle(�), black filled circle (•), cyan filled square (�) magenta squarewith dot (�), and magenta filled triangle (�), respectively. Hereonly the disclination lines are drawn. These structures are sta-ble only in a very narrow temperature range (indicated by c-gin a), and therefore are not the scope of this study.
16
© 2017 Macmillan Publishers Limited, part of Springer Nature. All rights reserved.
NATURE PHYSICS | www.nature.com/naturephysics 16
SUPPLEMENTARY INFORMATIONDOI: 10.1038/NPHYS4245

a b c
d e
Supplementary Figure 3: Time evolution of topological defects in a thinner cellobtained by numerical calculations. The cell thicknessis L = 0.637p, and the numbers indicate time t in units of1000tχ(� 1ms). In a–c, disappearance of disclination lines atthe midplane can be clearly seen. In d and e, motion of discli-nation lines towards the removal of imperfect honeycomb orderis highlighted by an ellipse.
17
© 2017 Macmillan Publishers Limited, part of Springer Nature. All rights reserved.
NATURE PHYSICS | www.nature.com/naturephysics 17
SUPPLEMENTARY INFORMATIONDOI: 10.1038/NPHYS4245
a b c
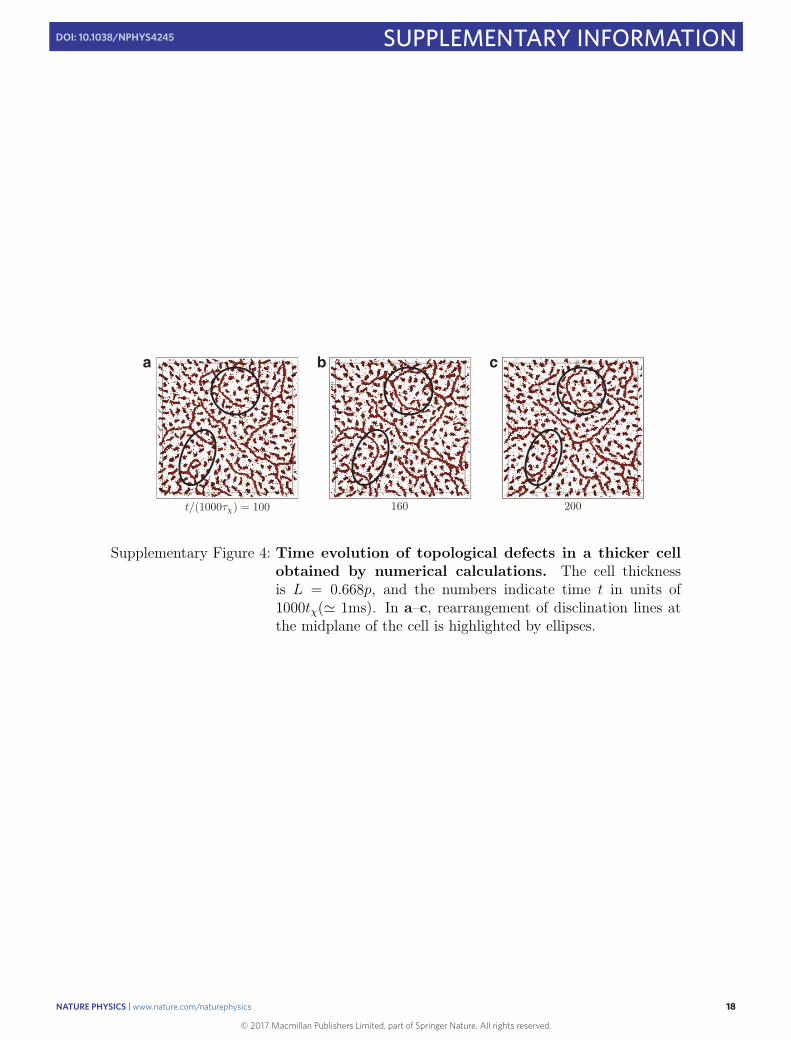
Supplementary Figure 4: Time evolution of topological defects in a thicker cellobtained by numerical calculations. The cell thicknessis L = 0.668p, and the numbers indicate time t in units of1000tχ(� 1ms). In a–c, rearrangement of disclination lines atthe midplane of the cell is highlighted by ellipses.
18
© 2017 Macmillan Publishers Limited, part of Springer Nature. All rights reserved.
NATURE PHYSICS | www.nature.com/naturephysics 18
SUPPLEMENTARY INFORMATIONDOI: 10.1038/NPHYS4245

a b
Supplementary Figure 5: Intensity profiles of reflected light for different locationsof the focal plane. a, The intensity profile of reflected lightfor the structure shown in Fig. 1c. b, The same as a for thestructure shown in Fig. 1e. The location of the focal plane,zf is 0, L/4, L/2, 3L/4 and L, respectively from top to bottom,where L is the cell thickness.
19
© 2017 Macmillan Publishers Limited, part of Springer Nature. All rights reserved.
NATURE PHYSICS | www.nature.com/naturephysics 19
SUPPLEMENTARY INFORMATIONDOI: 10.1038/NPHYS4245
a b
c
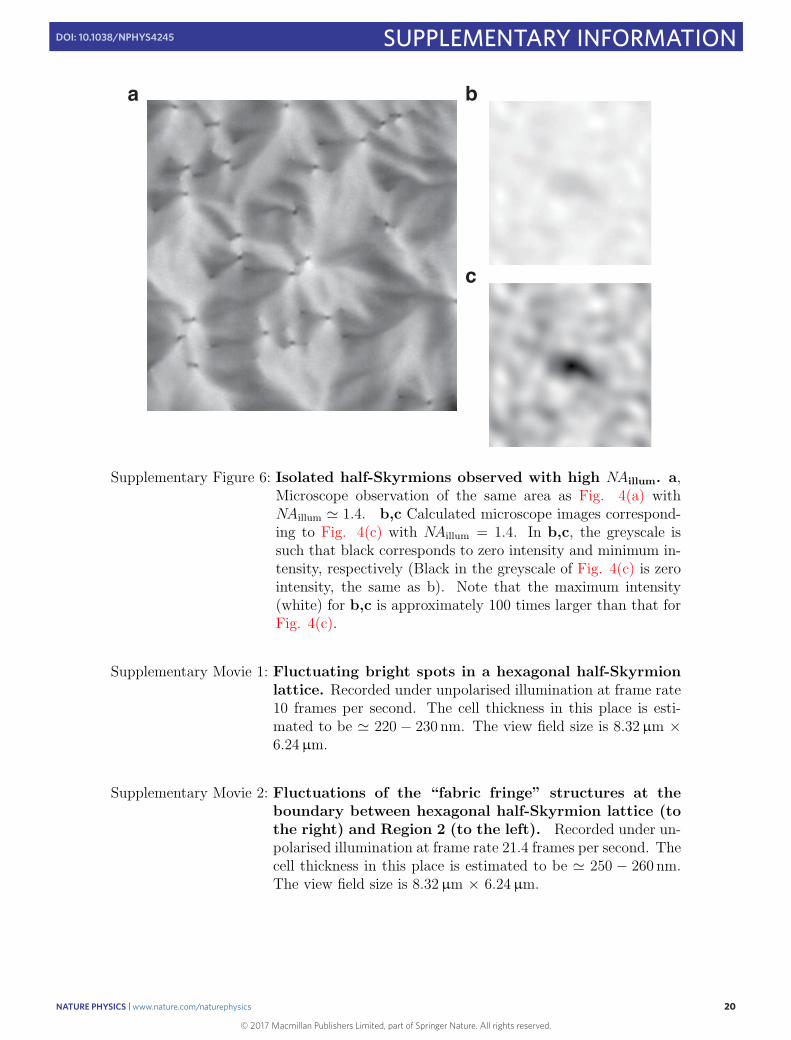
Supplementary Figure 6: Isolated half-Skyrmions observed with high NAillum. a,Microscope observation of the same area as Fig. 4(a) withNAillum � 1.4. b,c Calculated microscope images correspond-ing to Fig. 4(c) with NAillum = 1.4. In b,c, the greyscale issuch that black corresponds to zero intensity and minimum in-tensity, respectively (Black in the greyscale of Fig. 4(c) is zerointensity, the same as b). Note that the maximum intensity(white) for b,c is approximately 100 times larger than that forFig. 4(c).
Supplementary Movie 1: Fluctuating bright spots in a hexagonal half-Skyrmionlattice. Recorded under unpolarised illumination at frame rate10 frames per second. The cell thickness in this place is esti-mated to be � 220 − 230 nm. The view field size is 8.32µm ×6.24µm.
Supplementary Movie 2: Fluctuations of the “fabric fringe” structures at theboundary between hexagonal half-Skyrmion lattice (tothe right) and Region 2 (to the left). Recorded under un-polarised illumination at frame rate 21.4 frames per second. Thecell thickness in this place is estimated to be � 250 − 260 nm.The view field size is 8.32µm × 6.24µm.
20
© 2017 Macmillan Publishers Limited, part of Springer Nature. All rights reserved.
NATURE PHYSICS | www.nature.com/naturephysics 20
SUPPLEMENTARY INFORMATIONDOI: 10.1038/NPHYS4245

Supplementary Movie 3: Time evolution of topological defects in a thinner cellobtained by numerical calculations. The cell thickness isL = 0.637p, where p is the cholesteric pitch. A honeycomblattice of disclination lines connecting two cell surfaces is formed.
Supplementary Movie 4: Time evolution of topological defects in a thicker cellobtained by numerical calculations. The cell thickness isL = 0.668p. Disclination lines at the midplane as well as thoseconnecting two cell surfaces are formed.
Supplementary Movie 5: Fluctuating dynamics of isolated Skyrmions and topo-logical defects. Recorded under unpolarised illumination atframe rate 26.7 frames per second. The scale bar is 2 µm. Thecell thickness is � 140 nm.
21
© 2017 Macmillan Publishers Limited, part of Springer Nature. All rights reserved.
NATURE PHYSICS | www.nature.com/naturephysics 21
SUPPLEMENTARY INFORMATIONDOI: 10.1038/NPHYS4245


