Spontaneous confocal Raman microscopy--a tool to study the uptake of nanoparticles and carbon...
4
NANO EXPRESS Open Access Spontaneous confocal Raman microscopy–a tool to study the uptake of nanoparticles and carbon nanotubes into cells Gabriela Romero 1 , Elena Rojas 1 , Irina Estrela-Lopis 2 , Edwin Donath 2 and Sergio Enrique Moya 1* Abstract Confocal Raman microscopy as a label-free technique was applied to study the uptake and internalization of poly (lactide-co-glycolide) (PLGA) nanoparticles (NPs) and carbon nanotubes (CNTs) into hepatocarcinoma human HepG2 cells. Spontaneous confocal Raman spectra was recorded from the cells exposed to oxidized CNTs and to PLGA NPs. The Raman spectra showed bands arising from the cellular environment: lipids, proteins, nucleic acids, as well as bands characteristic for either PLGA NPs or CNTs. The simultaneous generation of Raman bands from the cell and nanomaterials from the same spot proves internalization, and also indicates the cellular region, where the nanomaterial is located. For PLGA NPs, it was found that they preferentially co-localized with lipid bodies, while the oxidized CNTs are located in the cytoplasm. Introduction The use of nanomaterials and nanoparticles (NPs) in medicine as drug delivery vectors, sensors or contrast agents is among the most promising areas in nanotech- nology research. For the application of nanotechnology in medicine, ‘in vitro’ work is of paramount importance, especially regarding the assessment of possible toxicolo- gical consequences of the nanomaterials/NPs. It is a key issue to study the effects of ‘ nano ’ in the cellular machinery and to understand how the nanomaterials are processed in the cell, and their distribution and fate, after being taken up by the cells. Confocal laser scan- ning microscopy (CLSM) is often applied for uptake stu- dies, but its application for NPs is not always easy, since the size of the NPs falls well below optical resolution. Also, a main drawback of CLSM is that, for most of the cases, both the NPs and cellular compartements must be fluorescently labelled, and this is not always an easy task. Besides that, labelling of NPs may in some cases require complex chemical routes including, for example, silanization, assembly of polymers, etc. As a result, the labelling can induce significant changes in the structure and properties of NPs, which may affect uptake and toxicity. Transmission electron microscopy (TEM) can be used to study the uptake and localization of NPs and nanomaterials, avoiding their labelling. The drawback of TEM for this application is that it requires complex and time-demanding preparations that also may affect the localization of the nanomaterials within the cell. Other label-free techniques for the study of the localization of nanostructures within cells are spontaneous Raman microscopy and coherent anti-stokes Raman (CARS) microscopy. In CARS, a single Raman band coming from the nanomaterial is scanned throughout the cell. A mapping of the cell is obtained showing the intensity distribution of the chosen Raman band [1]. Drawbacks of CARS are that only selected bands can be mapped, and furthermore, spectral overlapping may cause problems. Confocal Raman microscopy (CRM) combines sponta- neous Raman emission with confocal detection. We will show here that CRM can be used to study the localiza- tion of nanomaterials in the cells, taking advantage of the fact that in every spot the whole Raman spectrum is recorded. The latter thus contains bands coming from the nanomaterials and from representative cell molecules: proteins, DNA and lipids, which allow to identify the region of the cell [2,3], where the nanostructures are located. This article is among the first [4] to explore the use of the spontaneous Raman emission for the detection * Correspondence: [email protected] 1 CIC biomaGUNE, Paseo Miramón 182 C, 20009 San Sebastian, Spain Full list of author information is available at the end of the article Romero et al. Nanoscale Research Letters 2011, 6:429 http://www.nanoscalereslett.com/content/6/1/429 © 2011 Romero et al; licensee Springer. This is an Open Access article distributed under the terms of the Creative Commons Attribution License (http://creativecommons.org/licenses/by/2.0), which permits unrestricted use, distribution, and reproduction in any medium, provided the original work is properly cited.
-
Upload
gabriela-romero -
Category
Documents
-
view
213 -
download
1
Transcript of Spontaneous confocal Raman microscopy--a tool to study the uptake of nanoparticles and carbon...
NANO EXPRESS Open Access
Spontaneous confocal Raman microscopy–a toolto study the uptake of nanoparticles and carbonnanotubes into cellsGabriela Romero1, Elena Rojas1, Irina Estrela-Lopis2, Edwin Donath2 and Sergio Enrique Moya1*
Abstract
Confocal Raman microscopy as a label-free technique was applied to study the uptake and internalization of poly(lactide-co-glycolide) (PLGA) nanoparticles (NPs) and carbon nanotubes (CNTs) into hepatocarcinoma humanHepG2 cells. Spontaneous confocal Raman spectra was recorded from the cells exposed to oxidized CNTs and toPLGA NPs. The Raman spectra showed bands arising from the cellular environment: lipids, proteins, nucleic acids,as well as bands characteristic for either PLGA NPs or CNTs. The simultaneous generation of Raman bands from thecell and nanomaterials from the same spot proves internalization, and also indicates the cellular region, where thenanomaterial is located. For PLGA NPs, it was found that they preferentially co-localized with lipid bodies, while theoxidized CNTs are located in the cytoplasm.
IntroductionThe use of nanomaterials and nanoparticles (NPs) inmedicine as drug delivery vectors, sensors or contrastagents is among the most promising areas in nanotech-nology research. For the application of nanotechnologyin medicine, ‘in vitro’ work is of paramount importance,especially regarding the assessment of possible toxicolo-gical consequences of the nanomaterials/NPs. It is a keyissue to study the effects of ‘nano’ in the cellularmachinery and to understand how the nanomaterials areprocessed in the cell, and their distribution and fate,after being taken up by the cells. Confocal laser scan-ning microscopy (CLSM) is often applied for uptake stu-dies, but its application for NPs is not always easy, sincethe size of the NPs falls well below optical resolution.Also, a main drawback of CLSM is that, for most of thecases, both the NPs and cellular compartements mustbe fluorescently labelled, and this is not always an easytask. Besides that, labelling of NPs may in some casesrequire complex chemical routes including, for example,silanization, assembly of polymers, etc. As a result, thelabelling can induce significant changes in the structureand properties of NPs, which may affect uptake and
toxicity. Transmission electron microscopy (TEM) canbe used to study the uptake and localization of NPs andnanomaterials, avoiding their labelling. The drawback ofTEM for this application is that it requires complex andtime-demanding preparations that also may affect thelocalization of the nanomaterials within the cell. Otherlabel-free techniques for the study of the localization ofnanostructures within cells are spontaneous Ramanmicroscopy and coherent anti-stokes Raman (CARS)microscopy. In CARS, a single Raman band comingfrom the nanomaterial is scanned throughout the cell. Amapping of the cell is obtained showing the intensitydistribution of the chosen Raman band [1]. Drawbacksof CARS are that only selected bands can be mapped,and furthermore, spectral overlapping may causeproblems.Confocal Raman microscopy (CRM) combines sponta-
neous Raman emission with confocal detection. We willshow here that CRM can be used to study the localiza-tion of nanomaterials in the cells, taking advantage of thefact that in every spot the whole Raman spectrum isrecorded. The latter thus contains bands coming fromthe nanomaterials and from representative cell molecules:proteins, DNA and lipids, which allow to identify theregion of the cell [2,3], where the nanostructures arelocated. This article is among the first [4] to explore theuse of the spontaneous Raman emission for the detection
* Correspondence: [email protected] biomaGUNE, Paseo Miramón 182 C, 20009 San Sebastian, SpainFull list of author information is available at the end of the article
Romero et al. Nanoscale Research Letters 2011, 6:429http://www.nanoscalereslett.com/content/6/1/429
© 2011 Romero et al; licensee Springer. This is an Open Access article distributed under the terms of the Creative CommonsAttribution License (http://creativecommons.org/licenses/by/2.0), which permits unrestricted use, distribution, and reproduction inany medium, provided the original work is properly cited.
of nanomaterials inside cells and to assess the intracellu-lar region from the spectra, where the nanomaterial islocated. Previous study with CRM and cells has focusedin the recognition of different cellular environmentthrough their chemical fingerprints and the evaluation ofchanges in metabolism [5,6]. Poly(lactide-co-glycolide)(PLGA) NPs and carbon nanotubes (CNTs) have beenchosen as two representative and remarkably differentsystems that can be studied with CRM. To our knowl-edge, this is the first article where CRM is used for CNTdetection at cellular level.
Materials and methodsPLGA (d,l-lactide 85,: glycolide 15, inherent viscositywithin 0.55-0.,75 dL/g) was purchased from LACTEL®.Branched PEI, Mw 25 kDa, BSA, PIERCE BCATM Pro-tein Assay Kit, Dulbecco’s Modified Eagle’s Medium(DMEM), fetal bovine serum and penicillin-streptomycinwere purchased from Sigma-Aldrich. All chemicals wereused as received. Hepatocarcinoma human cell line(HepG2) was obtained from American Type CultureCollection (ATCC-HB-8065).PLGA NPs were prepared by the O/W emulsion-sol-
vent evaporation method [4]. Size and shape of thePLGA NPs were characterized by TEM (JEOL JEM2100F, Japan) [7]. Multiwalled CNTs were purchasedfrom Proforma (USA). Oxidation of CNTs was achievedas described in the literature by Zhang et al. [8].
Raman microscopyMicro-Raman analyses were performed using aRenishaw inVia Raman Microscope. Measurements wereperformed using a 532-nm laser excitation wavelengthwith a grating of 1800 mm-1. Most measurements were
conducted using a ×40 water immersion objective witha focal spot of approximately 1 μm in diameter. Spectrawere recorded in the region 300-3600 cm-1 , with aresolution of approximately 7 cm-1. The system was cali-brated to the spectral line of crystalline silicon at 520.7cm-1. At least 8-15 accumulation scans, at differentspots in the various cell compartments, lipid bodies(LB), cytoplasm and nucleus, were used to reduce thespectral noise. All spectra had a correction for the PBSsolution and glass cover slip baseline. After CNTs orNPs exposure and repeated washings with PBS, theRaman spectra were taken only from cells, where novisible CNT aggregates could be observed.
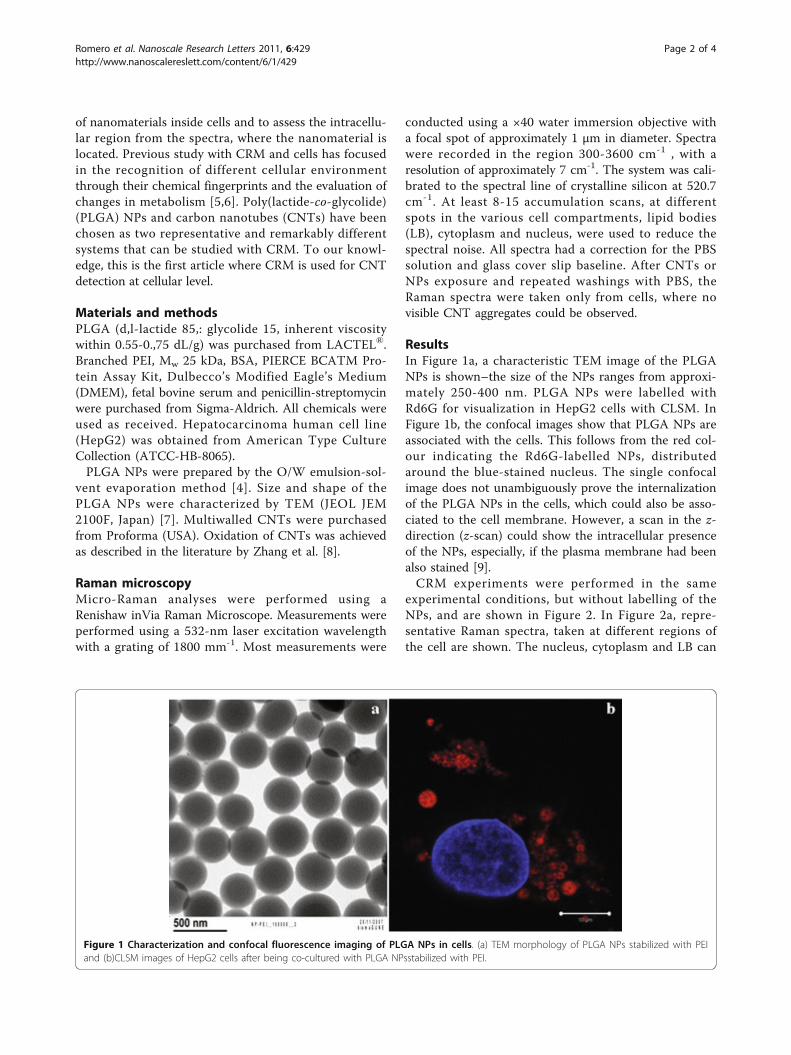
ResultsIn Figure 1a, a characteristic TEM image of the PLGANPs is shown–the size of the NPs ranges from approxi-mately 250-400 nm. PLGA NPs were labelled withRd6G for visualization in HepG2 cells with CLSM. InFigure 1b, the confocal images show that PLGA NPs areassociated with the cells. This follows from the red col-our indicating the Rd6G-labelled NPs, distributedaround the blue-stained nucleus. The single confocalimage does not unambiguously prove the internalizationof the PLGA NPs in the cells, which could also be asso-ciated to the cell membrane. However, a scan in the z-direction (z-scan) could show the intracellular presenceof the NPs, especially, if the plasma membrane had beenalso stained [9].CRM experiments were performed in the same
experimental conditions, but without labelling of theNPs, and are shown in Figure 2. In Figure 2a, repre-sentative Raman spectra, taken at different regions ofthe cell are shown. The nucleus, cytoplasm and LB can
Figure 1 Characterization and confocal fluorescence imaging of PLGA NPs in cells. (a) TEM morphology of PLGA NPs stabilized with PEIand (b)CLSM images of HepG2 cells after being co-cultured with PLGA NPsstabilized with PEI.
Romero et al. Nanoscale Research Letters 2011, 6:429http://www.nanoscalereslett.com/content/6/1/429
Page 2 of 4
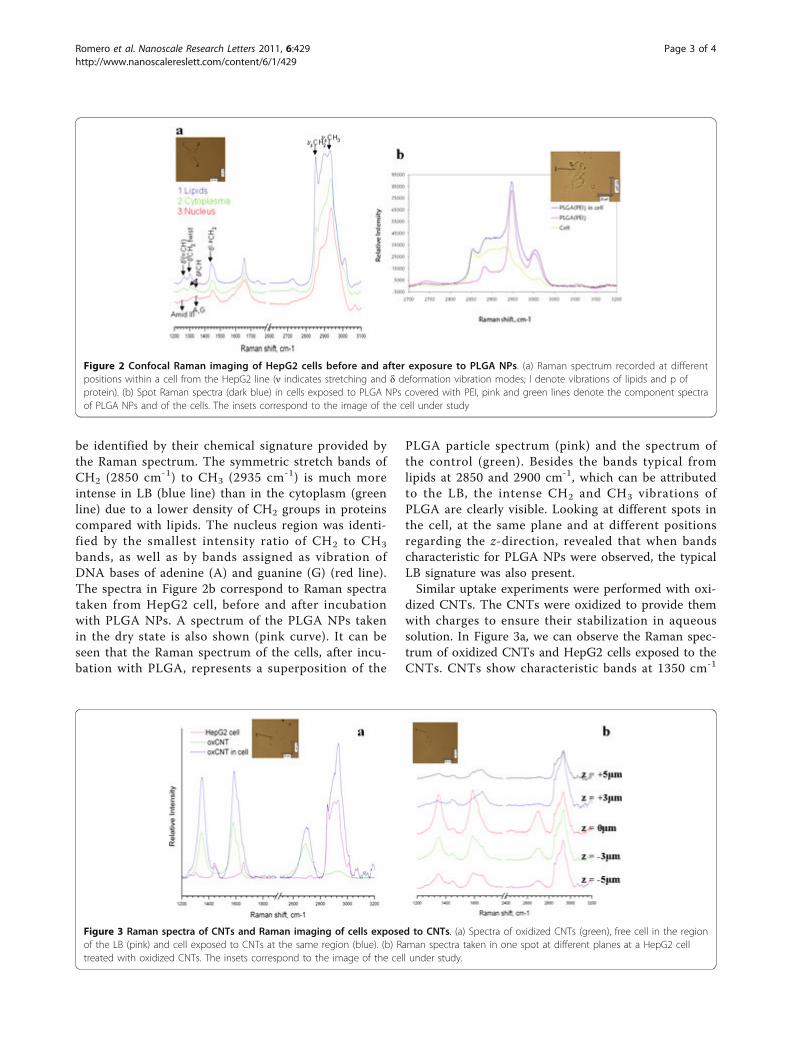
be identified by their chemical signature provided bythe Raman spectrum. The symmetric stretch bands ofCH2 (2850 cm-1) to CH3 (2935 cm-1) is much moreintense in LB (blue line) than in the cytoplasm (greenline) due to a lower density of CH2 groups in proteinscompared with lipids. The nucleus region was identi-fied by the smallest intensity ratio of CH2 to CH3
bands, as well as by bands assigned as vibration ofDNA bases of adenine (A) and guanine (G) (red line).The spectra in Figure 2b correspond to Raman spectrataken from HepG2 cell, before and after incubationwith PLGA NPs. A spectrum of the PLGA NPs takenin the dry state is also shown (pink curve). It can beseen that the Raman spectrum of the cells, after incu-bation with PLGA, represents a superposition of the
PLGA particle spectrum (pink) and the spectrum ofthe control (green). Besides the bands typical fromlipids at 2850 and 2900 cm-1, which can be attributedto the LB, the intense CH2 and CH3 vibrations ofPLGA are clearly visible. Looking at different spots inthe cell, at the same plane and at different positionsregarding the z-direction, revealed that when bandscharacteristic for PLGA NPs were observed, the typicalLB signature was also present.Similar uptake experiments were performed with oxi-
dized CNTs. The CNTs were oxidized to provide themwith charges to ensure their stabilization in aqueoussolution. In Figure 3a, we can observe the Raman spec-trum of oxidized CNTs and HepG2 cells exposed to theCNTs. CNTs show characteristic bands at 1350 cm-1
Figure 2 Confocal Raman imaging of HepG2 cells before and after exposure to PLGA NPs. (a) Raman spectrum recorded at differentpositions within a cell from the HepG2 line (ν indicates stretching and δ deformation vibration modes; l denote vibrations of lipids and p ofprotein). (b) Spot Raman spectra (dark blue) in cells exposed to PLGA NPs covered with PEI, pink and green lines denote the component spectraof PLGA NPs and of the cells. The insets correspond to the image of the cell under study
Figure 3 Raman spectra of CNTs and Raman imaging of cells exposed to CNTs. (a) Spectra of oxidized CNTs (green), free cell in the regionof the LB (pink) and cell exposed to CNTs at the same region (blue). (b) Raman spectra taken in one spot at different planes at a HepG2 celltreated with oxidized CNTs. The insets correspond to the image of the cell under study.
Romero et al. Nanoscale Research Letters 2011, 6:429http://www.nanoscalereslett.com/content/6/1/429
Page 3 of 4
(D-band) and 1585 cm-1 (G-band) [10,11]. The D-bandis an indicator for disorder in the graphene sheet and iscalled ‘’disorder-induced” band. The G-band is a tangen-tial mode originating from tangential oscillations of thecarbon atoms in the CNTs. These bands can be clearlyobserved in the cellular spectra. Scans were performedat different planes within the cells as shown in Figure3b. The plane denoted by 0 μm corresponds to thesituation, where the signals of the D and G bands fromthe CNTs were the strongest. Then, spectra wererecorded at higher and lower planes, respectively. Inall cases, the CNTs spectral signature was parallelledby CH3-stretching modes, typical for proteins. TheCH2 stretching, which is indicative for LB, can bebarely seen. The intensity of the CNTs bands variedconsiderably over the different scan planes. From thesefindings, we draw the conclusion that the CNTs arenot homogeneously distributed in the cytoplasm, northey are closely associated with LB. Furthermore, thez-scanning provides an unambiguous proof of interna-lization of the NPs, since we move in distances ofmicrometers inside the cell, where the detection ofCNTs attached to the cell membrane from the outsideis very unlikely.
ConclusionsSpontaneous CRM has been successfully applied toidentify PLGA NPs and oxidized CNTs in single hepato-carcinoma cells, which had been co-cultivated with theNPs and CNTs. The data prove that CRM, being alabel-free technique, is a valuable tool to study theuptake of nanomaterials into cells. For PLGA NPs, CRMconfirms the observations from CLSM and proves inter-nalization. The z-scanning of the cells with CNTsreveals that these are incorporated in the cytoplasm andare not co-associated with the LB.
AbbreviationsCARS: coherent anti-stokes Raman; CLSM: confocal laser scanningmicroscopy; CNTs: carbon nanotubes; CRM: confocal Raman microscopy; LB:lipid bodies; NPs: nanoparticles; PLGA: poly(lactide-co-glycolide); TEM:transmission electron microscopy.
AcknowledgementsThis study was supported by the European Commission in the framework ofFP7 Theme 4-NMP, Proposal No: CP-FP 228825-2 HINAMOX, as well as bythe grant MAT2010-18995 from the Spanish Ministry of Science andInnovation. S.E. Moya is a Ramon y Cajal Fellow.
Author details1CIC biomaGUNE, Paseo Miramón 182 C, 20009 San Sebastian, Spain2Institute of Biophysics and Medical Physics, University of LeipzigHärtelstraße 16-18, D-04107 Leipzig, Germany
Authors’ contributionsGR performed the synthesis of the PLGA nanoparticles and the surfacemodification of the CNTs. She also conducted the Confocal Ramanexperiments. ER conducted the Confocal Fluorescence Microscopy
experiments and did the cell culture work. IE supported GR with the Ramanexperiments and helped with the interpretation of the data. ED providedsupport in the design of the experiments and the interpretation of theRaman spectra. SEM conceived, designed and coordinated the study. Allauthors read and approved the final manuscript.
Competing interestsThe authors declare that they have no competing interests.
Received: 13 October 2010 Accepted: 16 June 2011Published: 16 June 2011
References1. Xu PS, Gullotti E, Tong L, Highley CB, Errabelli DR, Hasan T, Cheng JX,
Kohane DS, Yeo Y: Intracellular drug delivery by poly(lactide-co-glycolicacid) nanoparticles. Mol Pharm 2009, 6:190.
2. Romero G, Estrela-Lopis I, Zhou J, Rojas E, Franco A, Espinel CS,Fernández AG, Gao C, Donath E, Moya S: Surface engineered poly(lactide-co-glycolide) nanoparticles for intracellular delivery: uptake andcytotoxicity-a confocal raman microscopic study. Biomacromolecules 2010,11:2993.
3. Chernenko T, Matthaus C, MIlane L, Quintero L, Amiji M, Diem M: Label-free raman spectral imaging of intracellular delivery and degradation ofpolymeric nanoparticle systems. ACS Nano 2009, 3:3552.
4. Zhou J, Romero G, Rojas E, Moya S, Ma L, Gao C: Folic acid modified poly(lactide-co-glycolide) nanoparticles, layer-by-layer surface engineered fortargeted delivery. Macromol Chem Phys 2010, 211:404.
5. Puppels GJ, Demul FFM, Otto C, Greve J, Robertnicoud M, Arndtjovin DJ,Jovin TM: Studying single living cells and chromosomes by confocalRaman microspectroscopy. Nature 1990, 347:6290.
6. Uzunbajakava N, Lenferink A, Kraan Y, Willekens B, Vrensen G, Greve J,Otto C: Nonresonant Raman imaging of protein distribution in singlehuman cells. Biopolymers 2003, 72:1-9.
7. Scholes PD, Coombes AGA, Illum L, Daviz SS, Vert M, Davies MC: Thepreparation of sub-200 nm poly(lactide-co-glycolide) microspheres forsite-specific drug delivery. J Control Release 1993, 25:145.
8. Zhang N, Xie J, Guers M, Varadan VK: Chemical bonding of multiwalledcarbon nanotubes to SU-8 via ultrasonic irradiation. Smart Mater Struct2003, 12:260.
9. Reibetanz U, Claus C, Typlt E, Hofmann J, Donath E: Defoliation andplasmid delivery with layer-by-layer coated colloids. Macromol Biosci2006, 6:153.
10. Kuzmany H, Burger B, Hulman M, Kurti J, Rinzler AG, Smalley RE:Spectroscopic analysis of different types of single-wall carbonnanotubes. Europhys Lett 1998, 44:518.
11. Dresselhaus MS, Jorio A, Hofmann M, Dresselhaus G, Saito R: Perspectiveson carbon nanotubes and graphene Raman spectroscopy. Nano Lett2010, 10:751.
doi:10.1186/1556-276X-6-429Cite this article as: Romero et al.: Spontaneous confocal Ramanmicroscopy–a tool to study the uptake of nanoparticles and carbonnanotubes into cells. Nanoscale Research Letters 2011 6:429.
Submit your manuscript to a journal and benefi t from:
7 Convenient online submission
7 Rigorous peer review
7 Immediate publication on acceptance
7 Open access: articles freely available online
7 High visibility within the fi eld
7 Retaining the copyright to your article
Submit your next manuscript at 7 springeropen.com
Romero et al. Nanoscale Research Letters 2011, 6:429http://www.nanoscalereslett.com/content/6/1/429
Page 4 of 4