Spokane River / Lake Spokane Dissolved Oxygen Water ...
399
Spokane River and Lake Spokane Dissolved Oxygen Total Maximum Daily Load Water Quality Improvement Report Revised February 2010 Publication No. 07-10-073
Transcript of Spokane River / Lake Spokane Dissolved Oxygen Water ...
Spokane River and Lake Spokane Dissolved Oxygen Total Maximum Daily Load
Water Quality Improvement Report Revised February 2010 Publication No. 07-10-073
Publication and Contact Information This report is available on the Department of Ecology’s website at www.ecy.wa.gov/biblio/0710073.html Revised For more information contact: Washington State Department of Ecology Eastern Regional Office Water Quality Program 4601 North Monroe Street Spokane, WA 99205-1295 Phone: (509) 329-3400 Washington State Department of Ecology - www.ecy.wa.gov/ o Headquarters, Olympia 360-407-6000 o Northwest Regional Office, Bellevue 425-649-7000 o Southwest Regional Office, Olympia 360-407-6300 o Central Regional Office, Yakima 509-575-2490 o Eastern Regional Office, Spokane 509-329-3400 Cover photo: Spokane River at Riverside State Park, Spokane (David Moore) Project Codes and 1996 303(d) Waterbody ID Numbers Data for this project are available at Ecology’s Environmental Information Management (EIM) website at www.ecy.wa.gov/eim/index.htm. Search User Study ID, BCUS0005 Project Tracker Code (Environmental Assessment Program) is 01-025. TMDL Study Code (Water Quality Program) is SRWS99DO. Waterbody Numbers: WA-54-1010 (QZ45UE), WA-54-1020 (QZ45UE), WA-54-9040 (QZ45UE), WA-55-1010 (TD36NP), WA-56-1010 (JZ70CP), WA-57-1010 (QZ45UE) Any use of product or firm names in this publication is for descriptive purposes only and does not imply endorsement by the author or the Department of Ecology. To ask about the availability of this document in a format for the visually impaired, call the Water Quality Program at 360-407-6404. Persons with hearing loss can call 711 for Washington Relay Service. Persons with a speech disability can call 877-833-6341.
Spokane River and Lake Spokane Dissolved Oxygen
Total Maximum Daily Load
Water Quality Improvement Report
by
David J. Moore Water Quality Program
and
James Ross
Environmental Assessment Program
Washington State Department of Ecology Eastern Regional Office Spokane, Washington

This page is purposely left blank
Spokane River / Lake Spokane Dissolved Oxygen Water Quality Improvement Report Page iii
Table of Contents Page
Table of Contents ........................................................................................................................... iii
List of Figures and Tables............................................................................................................... v
Abstract ......................................................................................................................................... vii
Acknowledgements ........................................................................................................................ ix
Executive Summary ........................................................................................................................ v
What is a Total Maximum Daily Load (TMDL)? .......................................................................... 1
Federal Clean Water Act requirements ............................................................................... 1 TMDL process overview .................................................................................................... 2 Who should participate in this TMDL? .............................................................................. 2 Elements required by the Clean Water Act in a TMDL ..................................................... 2
Why Ecology Conducted a TMDL Study in this Watershed .......................................................... 5
Background ......................................................................................................................... 5 Impairments addressed by this TMDL ............................................................................... 6
Water Quality Standards and Numeric Targets .............................................................................. 9
Dissolved Oxygen ............................................................................................................... 9
Watershed Description .................................................................................................................. 13
Geographic setting ............................................................................................................ 13
TMDL Analysis ............................................................................................................................ 17
Project goals ...................................................................................................................... 17 Study quality assurance evaluation ................................................................................... 17 Technical analysis ............................................................................................................. 17
Modeling Selection, Results and Discussion ................................................................................ 27
Selection of TMDL scenario ............................................................................................. 27 Loading capacity ............................................................................................................... 30
Load and Wasteload Allocations .................................................................................................. 33
Wasteload allocations ....................................................................................................... 33 Load allocations ................................................................................................................ 36 Seasonal variation in Lake Spokane ................................................................................. 40
Avista’s Dissolved Oxygen Responsibility .................................................................................. 44
Margin of Safety ........................................................................................................................... 51
Spokane River / Lake Spokane Dissolved Oxygen Water Quality Improvement Report Page iv
Reasonable Assurance .................................................................................................................. 53
Managed Implementation Plan ..................................................................................................... 59
Introduction ....................................................................................................................... 59 What needs to be done? .................................................................................................... 60 Who needs to participate? ................................................................................................. 60 What is the schedule for achieving water quality standards? ........................................... 72 Monitoring progress .......................................................................................................... 76 Adaptive management ...................................................................................................... 78 Potential funding sources .................................................................................................. 80 Summary of public involvement methods ........................................................................ 82 Next steps .......................................................................................................................... 84
References ..................................................................................................................................... 85
Appendices .................................................................................................................................... 91
Appendix A. Glossary, acronyms, and abbreviations .................................................... A-1 Appendix B. Record of public participation .................................................................. B-1 Appendix C. Response to public comments .................................................................. C-1 Appendix D: 2007 Memorandum of Agreement and Foundational Concepts .............. D-1 Appendix E: Overview of Modeling Assessment for 2009 TMDL ................................ E-1 Appendix F: Spokane River TMDL Oversight Committee Organization ...................... F-1 Appendix G: November 2004 Modelers Agreement ..................................................... G-1 Appendix H: September 26, 2008 EPA Statement Announcing TMDL Reversal ........ H-1 Appendix I: October 24, 2008 Ecology Interpretation of Water Quality Standards
to EPA .......................................................................................................... I-1 Appendix J: March 24, 2009 Memo from EPA to Ecology ........................................... J-1 Appendix K: Spokane River Basin Stormwater Loading Analysis for 2009 TMDL .... K-1 Appendix L: September 28, 2005 Spokane River TMDL Collaboration Technology
Workgroup Memo on Wastewater Treatment Facilities Achieving Low Total Phosphorus Effluent ......................................................................... L-1
Appendix M: Tributary and groundwater nutrient load summary ................................ M-1
Spokane River / Lake Spokane Dissolved Oxygen Water Quality Improvement Report Page v
List of Figures and Tables
Figures Page
Figure 1. Spokane River watershed map. ............................................................................15
Figure 2. Selected model-predicted dissolved oxygen profiles for Lake Spokane ..............28
Figure 3. Model predicted total phosphorus concentrations at Lake Spokane ....................31
Figure 4. Relative pie chart comparison of current (2001) and TMDL Scenario # 1 ..........32
Figure 5. Seasonal trends in Spokane River ambient data ...................................................42
Figure 6. Seasonal trends in dissolved oxygen near Long Lake Dam .................................43
Figure 7. Representation of Lake Spokane modeling segments ..........................................48
Figure 8. Decision diagram for adaptive management (from Foundational Concepts). ......79
Tables Table 1. Study area waterbody segments on the 2008 303(d) list. ........................................7
Table 2. Water quality standards protected by this TMDL .................................................10
Table 3. Modeling scenario inputs for 2009 TMDL technical analysi ................................23
Table 4. Lake Spokane total loading capacity (monthly average) .......................................31
Table 5. Wasteload allocations for Washington Dischargers, including stormwater ..........34
Table 6. Tributary and groundwater TMDL load allocations. .............................................39
Table 7. TMDL Scenario #1 and No Source scenario dissolved oxygen concentrations. ...49
Table 8. Washington State NPDES Permit Holders in the Spokane River Watershed. ......61
Table 9. Organizational commitments to meet TMDL. .......................................................71
Table 10. TMDL schedule and NPDES permit schedule ....................................................74
Table 11. Possible Funding Sources to Support TMDL Implementation. ...........................80

Spokane River / Lake Spokane Dissolved Oxygen Water Quality Improvement Report Page vi
This page is purposely left blank
Spokane River / Lake Spokane Dissolved Oxygen Water Quality Improvement Report Page vii
Abstract Lake Spokane (also known as Long Lake; herein referred to as Lake Spokane) has a long history of water quality problems and nutrient enrichment. Recurring impairments of the beneficial uses and violations of water quality standards resulted in some segments of the Spokane River and Lake Spokane being included in the Department of Ecology’s (Ecology) 303(d) list of impaired water bodies. Dissolved oxygen in this system is affected by natural variability and human activities that alter the physical, chemical, and biological characteristics of the river and lake system. This TMDL establishes limits for the three pollutants affecting dissolved oxygen: ammonia (NH3-N), total phosphorus (TP), and carbonaceous biochemical oxygen demand (CBOD). This TMDL also identifies a dissolved oxygen responsibility for hydroelectric dam operations in Lake Spokane. Ecology used the CE-QUAL-W2 model to determine in-lake dissolved oxygen requirements necessary to meet the dissolved oxygen water quality standard in Lake Spokane once nutrient reduction goals are met from point and nonpoint sources. The water quality standards require that human activities not cause a measurable (0.2 mg/L) decrease from natural conditions for dissolved oxygen in Lake Spokane when dissolved oxygen is lower than aquatic use criteria (9.5 mg/L). Phosphorus is the nutrient that has the greatest effect on dissolved oxygen levels in this system. The wasteload allocations in this TMDL require reducing total phosphorus loading in treated wastewater effluent to a seasonal average concentration of 42 µg/L or lower during the critical period (March 1 – October 31). In addition to installing advanced wastewater treatment technologies, some wastewater treatment plants may need to reduce nutrients through actions such as obtaining offsets from nonpoint source reductions, water conservation, and wastewater reuse. The concentrations necessary to implement water quality standards were translated into wasteload allocations, expressed as pounds of phosphorus per day loads, for the five (currently four existing and permitted) Washington point sources that discharge, or are expected to discharge, to the Spokane River (the Dischargers). Attainment of the wasteload allocations represents a roughly 90 percent reduction in total phosphorus from the dischargers during the critical period. Wasteload allocations are also set for ammonia and carbonaceous biochemical oxygen demand. A wasteload allocation is also established for stormwater discharges from municipalities with stormwater discharge permits. Load allocations for total phosphorus, ammonia, and carbonaceous biochemical oxygen demand are assigned to the mouths of the main three tributaries to the Spokane River, and phosphorus allocations are assigned to groundwater discharges to the river (carbonaceous biochemical oxygen demand and ammonia are believed to be negligible in groundwater) and for groundwater and surface water to the Lake Spokane watershed. The TMDL focuses on strategies to reduce phosphorus because these strategies will often result in reductions to ammonia and carbonaceous biochemical oxygen demand. In addition, the TMDL assigns a dissolved oxygen responsibility to Long Lake Dam. Ecology used the CE-QUAL-W2 model to account for the dissolved oxygen impacts caused by Long Lake Dam during the most critical times of the year. This responsibility is based on a comparison of dissolved oxygen concentrations between the natural condition (No Source) and
Spokane River / Lake Spokane Dissolved Oxygen Water Quality Improvement Report Page viii
chosen TMDL scenario (TMDL Scenario #1) modeling scenarios across 32 model segments of Lake Spokane. In 2007, the Spokane River TMDL Collaboration developed the Foundational Concepts for the Spokane River TMDL Managed Implementation Plan (Foundational Concepts). While parts of this document are now dated due to a new modeling approach following the Environmental Protection Agency’s (EPA) request to Ecology to postpone submittal of the draft TMDL in 2008, major elements of the Foundational Concepts will guide the implementation of this TMDL. The wasteload allocations will be achieved by the installation of the most effective feasible wastewater removal treatment technology and implementation of target pursuit actions, such as reusing wastewater, eliminating septic tanks, and strategies to control nonpoint sources of pollution.
Spokane River / Lake Spokane Dissolved Oxygen Water Quality Improvement Report Page ix
Acknowledgements
The authors thank the following people for their contribution to this report:
Ben Cope, EPA
Laurie Mann, EPA
Brian Nickel, EPA
Don Martin, EPA
David Croxton, EPA
Brian Crossley, Spokane Tribe of Indians
Scott Wells, Portland State University
Chris Berger, Portland State University
David Knight, Ecology
Susan Braley, Ecology
Melissa Gildersleeve, Ecology
Helen Bresler, Ecology
Karin Baldwin, Ecology
Todd Bolster, Ecology
Spokane River / Lake Spokane Dissolved Oxygen Water Quality Improvement Report Page iv
This page is purposely left blank
Spokane River / Lake Spokane Dissolved Oxygen Water Quality Improvement Report Page v
Executive Summary What is a water quality plan or total maximum daily load (TMDL)? The 303(d) list is a list of water bodies, which the Clean Water Act (CWA) requires states to prepare, that do not meet state water quality standards. The CWA requires that a Total Maximum Daily Load (TMDL) be developed for each of the water bodies on the 303(d) list. The TMDL study identifies pollution problems in the watershed, and then specifies how much pollution needs to be reduced or eliminated to achieve clean water. Ecology then develops a plan that describes actions to control the pollution and a monitoring plan to assess the effectiveness of the water quality improvement activities. This Water Quality Improvement Report (WQIR) consists of the TMDL study and a Managed Implementation Plan.
Why is a TMDL project being done in this watershed? Lake Spokane has a long history of water quality problems. Eutrophication of the lake has been one of the major water quality concerns for the area over the past 40 years (Cunningham 1969, Soltero et al. 1973 – 86, Singleton 1981, Wagstafff and Soltero 1982).
Eutrophication is a process where excess aquatic plant growth occurs in a water body in response to high levels of nutrients (i.e. nutrient enrichment), and this plant growth can reduce the oxygen in the water to levels that are harmful for fish and other aquatic species. Aquatic plants reduce dissolved oxygen levels in a water body in two ways: during the night when they respire and consume oxygen and when they decompose and natural biological processes consume oxygen. Algae blooms also impair aesthetics and recreational uses and have been a recurring problem in Lake Spokane. Outbreaks of toxic blue-green algae were common in the 1970s and still occur. Recurring impairments of the beneficial uses and violations of water quality standards resulted in some segments of the Spokane River and Lake Spokane being included on one or more of Ecology’s 1996, 1998, 2004, 2006 and 2008 303(d) lists of impaired water bodies. The Spokane River downstream of Long Lake Dam also fails to meet the Spokane Tribe of Indians’ water quality standards for dissolved oxygen. Goals and objectives This TMDL establishes a Managed Implementation Plan to reduce nutrients in the Spokane River and Lake Spokane to prevent low dissolved oxygen, excessive algae blooms, and degradation of downstream water quality. The dissolved oxygen levels in this system are affected by natural variability and human activities that alter the physical, chemical, and biological characteristics of the lake. This TMDL establishes limits for the three pollutants affecting dissolved oxygen in the lake: ammonia (NH3-N), total phosphorus (herein referred to as “phosphorus” or TP), and carbonaceous biochemical oxygen demand (CBOD). This TMDL also identifies a dissolved oxygen responsibility for hydroelectric dam operations in Lake Spokane.
Spokane River / Lake Spokane Dissolved Oxygen Water Quality Improvement Report Page vi
Watershed description The Spokane River’s source is Lake Coeur d’Alene in Idaho. The river drains an area of approximately 6,640 square miles and empties into the Franklin D. Roosevelt Lake impoundment of the Columbia River. Approximately 2,295 square miles are within Washington and the remainder of the watershed is in Idaho. Most residents in the watershed live in the Spokane metropolitan area, which includes the city of Spokane Valley; however, the incorporated area of Liberty Lake, east of Spokane, and the cities of Coeur d’Alene and Post Falls in Idaho are experiencing rapid growth. Lake Spokane is formed by Long Lake Dam, operated by Avista Utilities. The 24-mile long reservoir on the Spokane River is located downstream of the city of Spokane. The Spokane Tribe of Indians’ reservation is located downstream of the Long Lake Dam and includes both banks of the Spokane Arm of Lake Roosevelt. The study area for this TMDL stretches from Long Lake Dam to the outlet of Lake Coeur d’Alene and covers Water Resource Inventory Areas (WRIA) 54 and 57. There are four wastewater discharges to the main stem of the Spokane River between the Idaho / Washington state line and Lake Spokane, including: the city of Spokane Riverside Park Water Reclamation Facility and Combined Sewer Overflows, Inland Empire Paper Company, Kaiser Aluminum Fabricated Products, LLC, and the Liberty Lake Sewer and Water District (Figure 1). Following the approval of this TMDL and issuance of an NPDES permit, Spokane County intends to build a fifth wastewater treatment plant in Spokane Valley. Collectively, these Washington point sources are referred to as the “Dischargers” in this report. Allocations summary The CE-QUAL-W2 model was used to assess the capacity of the Spokane River and Lake Spokane to assimilate oxygen-demanding pollutants (i.e., phosphorus, CBOD and ammonia) under varying conditions. The water quality standard for Lake Spokane allows for a decrease in dissolved oxygen of 0.2 mg/L below natural background conditions when dissolved oxygen is below aquatic use criteria (9.5 mg/L). Based on estimates of achievable improvements in nutrient control upstream of the lake, water quality standards cannot be achieved in Lake Spokane unless both the capacity of Lake Spokane is improved (through reductions in nutrients and improvements in in-lake dissolved oxygen) and upstream anthropogenic sources (point and nonpoint sources) are substantially decreased. Wasteload allocations are assigned to the five Dischargers (Table 5) and also assigned for stormwater discharges. The seasonal average wasteload allocation (based on mass equivalents) for total phosphorus is 42 µg/L or lower. Wasteload allocations for total phosphorus, CBOD and ammonia were developed in response to the need to minimize pollutant loading to the Spokane River. The translation from concentration to pounds of phosphorus forms the basis for measuring success in meeting the wasteload allocations (Table 5, Equation 1). Load allocations are assigned to the mouths of the tributaries: Hangman Creek, Coulee Creek, the Little Spokane River, river mainstem groundwater, and Lake Spokane watershed groundwater and surface water (Table 6). Wasteload allocations will be achieved by the installation of the most effective feasible nutrient removal treatment technologies and implementation actions (target pursuit actions) such as nonpoint source reductions, water conservation and wastewater reuse. Together, these actions
Spokane River / Lake Spokane Dissolved Oxygen Water Quality Improvement Report Page vii
will result in the net pounds of phosphorus discharged being equal to, or less than, the wasteload allocations. In addition to wasteload and load allocations assigned to the Washington dischargers and nonpoint sources, respectively, a dissolved oxygen responsibility is assigned to Avista Utilities to identify measures to improve dissolved oxygen due to impacts from Long Lake Dam. Avista’s dissolved oxygen responsibility is to improve dissolved oxygen in modeling segments 157 through 188 that will fail to meet water quality standards even when wasteload and load allocations of point and nonpoint sources are met (see Table 7). The water quality improvements required in Table 7 must occur in order to achieve water quality standards for dissolved oxygen in Lake Spokane, and will serve as the basis for evaluation of the adequacy of Avista’s Water Quality Attainment Plan (WQAP) in meeting its responsibilities. To achieve these water quality improvements, Avista can consider all necessary methods, such as technology or engineering improvements to the dam and reservoir, as well as methods to reduce nonpoint sources of nutrients to the system. Project history Since the late 1990s, Ecology has worked with the Spokane community to develop a strategy to address the algae blooms in Lake Spokane. The first draft dissolved oxygen TMDL was developed in 2004. This draft TMDL focused mainly on the point source dischargers of nutrients and did not account for the dissolved oxygen impacts caused by Long Lake Dam or other point sources, such as stormwater discharges. Because the draft TMDL focused mainly on the municipal wastewater point source dischargers, the wasteload allocations were extremely low, and may have been unachievable using treatment technologies alone.
These low wasteload allocations prompted the point source dischargers in Washington and Idaho to develop a Use Attainability Analysis (UAA) and to petition the state to change the dissolved oxygen water quality standard. In 2005, the Dischargers agreed to withdraw the UAA petition and to begin a dialogue about how to move forward with a TMDL that would meet state water quality standards and would consider more sources of pollution than just point sources. This dialogue became known as the Spokane River TMDL Collaboration (Collaboration), and included Ecology, the dischargers, local governments, the Idaho Department of Environmental Quality (IDEQ), the U.S. Environmental Protection Agency (EPA), the Spokane Tribe of Indians, environmental groups, and Avista Utilities. The Collaboration developed the Foundational Concepts for the Spokane River TMDL Managed Implementation Plan, which has partially informed the development of this TMDL (Foundational Concepts, Appendix D). Ecology revised the draft 2004 TMDL and released it for public comment in 2007 and 2008. These 2007 and 2008 TMDL drafts still contained very stringent wasteload allocations, but also accounted for nonpoint pollution sources and anticipated that pollutant trading might be used to help the point source dischargers meet their load allocations. Despite this improvement, these draft TMDLs:
1. Did not consider Avista’s responsibility for the impacts caused by Long Lake Dam.
Spokane River / Lake Spokane Dissolved Oxygen Water Quality Improvement Report Page viii
2. Assumed that the impacts of the Idaho Dischargers were set by the NPDES permits EPA had proposed, even though those permits did not contain discharge limits stringent enough to meet Washington’s water quality standards when considered cumulatively with Washington sources (see Appendix H).
To develop a TMDL that will achieve compliance with Washington State water quality standards, Ecology developed this revised TMDL based on modeling that now assesses the cumulative impact of all dischargers and accounts for the impacts of Long Lake Dam on dissolved oxygen in Lake Spokane. Because all the impacts causing the water quality impairment are considered, the proportional share that each discharger bears is less than in earlier draft TMDLs. The new wasteload allocations for the point source Dischargers, assumed reductions in the Idaho discharges, load allocations for nonpoint sources, and the improvements that Avista will make to mitigate the effect of the dam, give assurance that compliance with water quality standards will be achieved. Implementation summary The TMDL and NPDES water quality permits will require the Dischargers to implement technologies and take other actions to reduce point and nonpoint sources of phosphorus, CBOD, and ammonia in order to meet the wasteload allocations by 2020. Assessments will be conducted every two years, capped by a thorough assessment near the end of the first ten years to determine whether the TMDL and permit actions are working to improve dissolved oxygen in Lake Spokane. If all required actions have been implemented but a discharger has not met its wasteload allocations by 2020, permit adjustments will be considered based on all information collected for a ten-year assessment. This TMDL contemplates that final wasteload allocations will be met no later than 2020. Following approval of this TMDL, and as provided in the state’s Clean Water Act 401 certification conditions incorporated into Avista’s FERC license, Avista will develop a WQAP describing all measures that will be taken to meet its dissolved oxygen responsibility. This can include tools such as target pursuit actions (described in the Managed Implementation Plan section) available to the Dischargers to reduce sources of phosphorus in the Spokane River watershed.
Spokane River / Lake Spokane Dissolved Oxygen Water Quality Improvement Report Page 1
What is a Total Maximum Daily Load (TMDL)?
Federal Clean Water Act requirements The Clean Water Act (CWA) established a process to identify and clean up polluted waters. The CWA requires each state to have its own water quality standards designed to protect, restore, and preserve water quality. Water quality standards include 1) designated uses for protection, such as cold water biota and drinking water supply, and 2) criteria, usually numeric criteria, to achieve those uses. The Water Quality Assessment and the 303(d) List Every two years, states are required to prepare a list of water bodies that do not meet water quality standards. This list is called the CWA 303(d) list. In Washington State, this list is part of the Water Quality Assessment (WQA) process. To develop the WQA, the Washington State Department of Ecology (Ecology) compiles its own water quality data along with data from local, state, and federal governments, tribes, industries, and citizen monitoring groups. All data in this WQA are reviewed to ensure that they were collected using appropriate scientific methods before they are used to develop the assessment. The list of waters that do not meet standards [the 303(d) list] is the Category 5 part of the larger assessment. Category 1 – Meets standards for parameter(s) for which it has been tested.
Category 2 – Waters of concern.
Category 3 – Waters with no data or insufficient data available.
Category 4 – Polluted waters that do not require a TMDL because: 4a. – An approved TMDL is being implemented. 4b. – A pollution control program is in place that should solve the problem. 4c. – Are impaired by a non-pollutant such as low water flow, dams, and culverts.
Category 5 – Polluted waters that require a TMDL – the 303(d) list. Further information is available at Ecology’s Water Quality Assessment website: http://www.ecy.wa.gov/programs/wq/303d/ The CWA requires that a Total Maximum Daily Load (TMDL) be developed for each of the water bodies on the 303(d) list. A TMDL is a numerical value representing the highest pollutant load a surface water body can receive and still meet water quality standards. Any amount of pollution over the TMDL level needs to be reduced or eliminated to achieve the water quality standard.
Spokane River / Lake Spokane Dissolved Oxygen Water Quality Improvement Report Page 2
TMDL process overview Ecology uses the 303(d) list to prioritize and initiate TMDL studies across the state. The TMDL study identifies pollution problems in the watershed, and specifies how much pollution needs to be reduced or eliminated to achieve clean water. Ecology, with the assistance of local governments, tribes, agencies, and the community then develops a strategy to control and reduce pollution sources and a monitoring plan to assess effectiveness of the water quality improvement activities. Together, the study and implementation strategy comprise the Water Quality Improvement Report (WQIR). Once the U.S. Environmental Protection Agency (EPA) approves the WQIR (TMDL), a Water Quality Implementation Plan (WQIP) is developed within one year. The WQIP identifies specific tasks, responsible parties, and timelines for reducing or eliminating pollution sources and achieving clean water. For this TMDL, the WQIP may not be a single, stand-alone plan but may be comprised of delta management plans and similar plans required by the NPDES permits described in the Managed Implementation Plan section of this report.
Who should participate in this TMDL? Nonpoint source pollutant load targets have been set in this TMDL and described in Table 6. Because nonpoint pollution comes from diffuse sources, all upstream watershed areas have the potential to affect downstream water quality. Therefore, all potential nonpoint sources in the watershed must use the appropriate best management practices to reduce impacts to water quality. The area subject to the TMDL is shown in Figure 1. Similarly, all point source dischargers and Avista are expected to reduce their pollutant loadings or take other actions consistent with the TMDL. Numerous other stakeholders, such as environmental organizations, the Spokane Tribe of Indians, conservation districts, homeowner groups, and individuals have been and will continue to participate in the TMDL and its implementation.
Elements required by the Clean Water Act in a TMDL Loading capacity, allocations, seasonal variation, margin of safety, and reserve capacity A water body’s loading capacity is the amount of a given pollutant that a water body can receive and still meet water quality standards. The loading capacity provides a target for calculating the amount of pollution reduction needed to bring a water body into compliance with the standards. The portion of the receiving water’s loading capacity assigned to a particular source is a wasteload or load allocation. If the pollutant comes from a discrete (point) source subject to a National Pollutant Discharge Elimination System (NPDES) permit, such as a municipal or
Spokane River / Lake Spokane Dissolved Oxygen Water Quality Improvement Report Page 3
industrial facility’s discharge pipe, that facility’s share of the loading capacity is called a wasteload allocation. If the pollutant comes from diffuse (non-point) sources not subject to an NPDES permit, such as general urban, residential, or farm runoff, the cumulative share is called a load allocation. The TMDL must also consider seasonal variations, and include a margin of safety that takes into account any lack of knowledge about the causes of the water quality problem or its loading capacity. A reserve capacity for future pollutant sources is sometimes included as well. Therefore, a TMDL is the sum of the wasteload and load allocations, any margin of safety, and any reserve capacity. The TMDL must be equal to or less than the loading capacity as shown in the following equation: Nutrient Loading Capacity = Wasteload Allocations + Load Allocations + Margin of Safety + Reserve Capacity Additionally, this TMDL assigns a dissolved oxygen responsibility to Long Lake Dam, and the hydroelectric dams operator (Avista) is expected to take actions to increase the Lake’s loading capacity.

Spokane River / Lake Spokane Dissolved Oxygen Water Quality Improvement Report Page 4
This page is purposely left blank
Spokane River / Lake Spokane Dissolved Oxygen Water Quality Improvement Report Page 5
Why Ecology Conducted a TMDL Study in this Watershed
Background Despite significant advances in controlling pollution from wastewater discharges over several decades, Lake Spokane experiences water quality problems from nutrient enrichment. Eutrophication of the lake has been one of the major water quality concerns for the past 40 years (Cunningham 1969, Soltero et al. 1973 – 86, Singleton 1981, Wagstafff and Soltero 1982). Eutrophication is a process where excess aquatic plant growth occurs in a water body due to high levels of nutrients. This plant growth can reduce the oxygen in the water to levels that are harmful for fish. Aquatic plants reduce oxygen levels in a water body in two ways: during the night when they respire and consume oxygen, and during their decomposition when biological processes consume oxygen to decay the plants’ organic material. Toxic algae blooms, occurring in Lake Spokane in the 1970s, resulted in the court-ordered establishment of a phosphorus TMDL because phosphorus was identified as the limiting nutrient causing eutrophication. This resulted in the development of the 1992 total phosphorus TMDL, which was originally adopted as a Phosphorus Management Plan in 1989. This total phosphorus TMDL focused on preventing toxic blue-green algae blooms by requiring the city of Spokane, and other local entities that discharge to the river, to reduce the levels of phosphorus in their effluent at the time by 85 percent to meet a total phosphorus concentration in Lake Spokane of 25 µg/L. Subsequent years of excessive algae blooms in Lake Spokane and violations of water quality standards for dissolved oxygen (DO) and phosphorus demonstrated that the total phosphorus TMDL does not adequately protect water quality (Cusimano 2004). As a result, several water body segments of the Spokane River were included on the Department of Ecology’s 1996, 1998 and 2004 303(d) lists of impaired water bodies, which required that this TMDL be developed. Since the late 1990s, Ecology has worked with the Spokane community to develop a strategy to address the algae blooms and low dissolved oxygen conditions in the Spokane River and Lake Spokane. The first draft dissolved oxygen TMDL was developed in 2004. This draft focused mainly on the point source dischargers of nutrients and did not account for the dissolved oxygen impacts caused by Long Lake Dam. Because of this, the 2004 draft TMDL wasteload allocations were extremely low. These low wasteload allocations prompted the point source dischargers in Washington and Idaho to develop a Use Attainability Analysis (UAA) and to petition the state to change the dissolved oxygen water quality standard. In 2005, the point source dischargers agreed to withdraw the UAA petition and to begin a dialogue about how to move forward with a TMDL that would meet state water quality standards and would consider more sources of pollution than just point sources. This dialogue became known as the Spokane River TMDL Collaboration (Collaboration), and included Ecology, the Washington point source dischargers, local
Spokane River / Lake Spokane Dissolved Oxygen Water Quality Improvement Report Page 6
governments, the Idaho Department of Environmental Quality (IDEQ), the U.S. Environmental Protection Agency (EPA), the Spokane Tribe of Indians, environmental groups, and Avista Utilities. The Collaboration developed the Foundational Concepts for the Spokane River TMDL Managed Implementation Plan, which has partially informed the development of this TMDL (Foundational Concepts, Appendix D). Ecology revised the draft 2004 TMDL and released it for public comment in 2007 and 2008. These 2007 and 2008 TMDL drafts still contained very stringent wasteload allocations, but also accounted for nonpoint pollution sources, and anticipated that pollutant trading might be used to help the point source dischargers meet their load allocations. Despite this improvement, these draft TMDLs: 1. Did not consider Avista’s responsibility for the impacts caused by Long Lake Dam.
2. Assumed that the impacts of the Idaho dischargers were set by the draft NPDES permits EPA
had proposed, even though those permits did not contain discharge limits stringent enough to meet Washington’s water quality standards when considered cumulatively with Washington sources (see Appendix H).
Working through an interagency workgroup consisting of IDEQ, EPA and the Spokane Tribe of Indians and following numerous stakeholder meetings, Ecology developed this revised TMDL based on modeling that now assesses the cumulative impact of all dischargers and accounts for the impacts of Long Lake Dam on dissolved oxygen in Lake Spokane. While wasteload and load allocations have changed, this TMDL still contemplates Dischargers meeting final wasteload allocations over ten years, or by 2020. This TMDL envisions a TMDL advisory committee will guide the implementation of this TMDL. As part of the new modeling approach, and pursuant to a condition in the state’s Clean Water Act 401 Certification incorporated into the dam’s FERC license, Avista will develop a Water Quality Attainment Plan (WQAP) that describes the measures that will be taken to meet its dissolved oxygen responsibility determined through this TMDL. Because all the impacts causing the water quality impairment are considered, the proportional share that each discharger bears is less than in earlier draft TMDLs. The new wasteload allocations for the point source dischargers, the load allocations for the nonpoint sources, the presumed reductions by the Idaho dischargers, and the improvements that Avista will make to mitigate the effect of the dam, give assurance that the TMDL is established at a level necessary to achieve the applicable water quality standards.
Impairments addressed by this TMDL The Spokane River and Lake Spokane have a long history of excess nutrients and low dissolved oxygen levels. Algae blooms, including toxic blue-green algae blooms in the 1970s, have been a recurring problem in Lake Spokane. These blooms impair the recreational use and aesthetics of Lake Spokane. Recurring impairments of the beneficial uses and violations of water quality standards resulted in some waterbody segments of the Spokane River and Lake Spokane being
Spokane River / Lake Spokane Dissolved Oxygen Water Quality Improvement Report Page 7
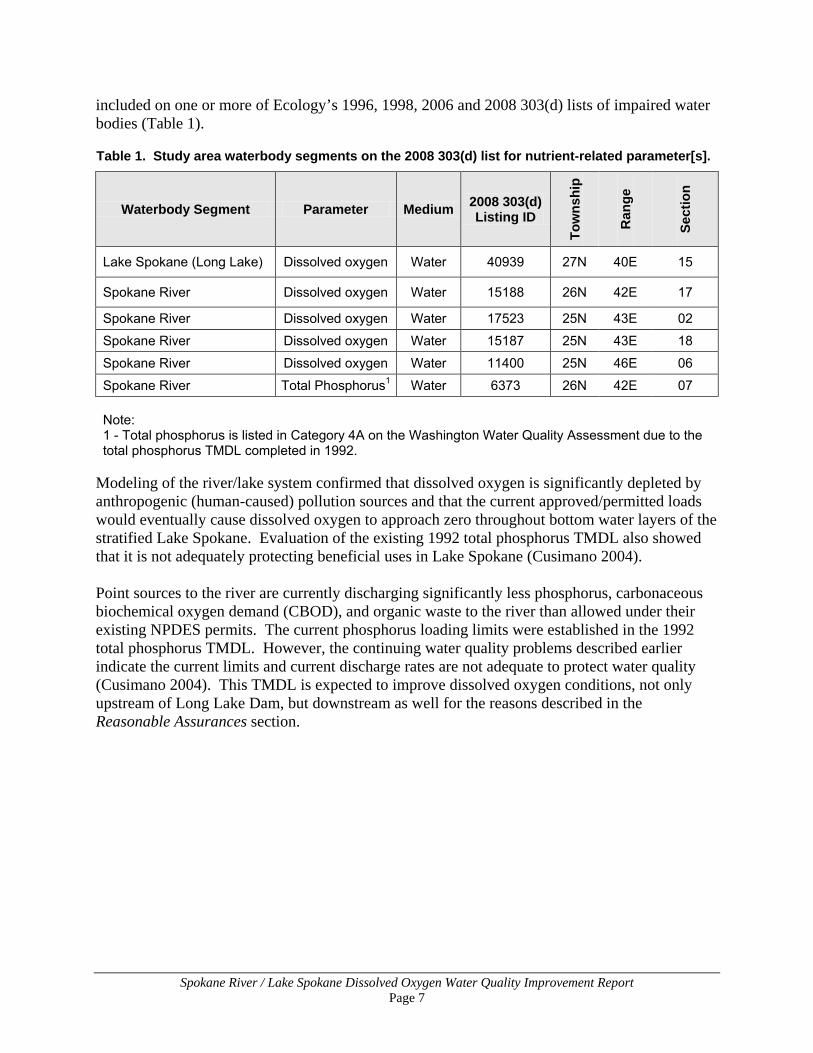
included on one or more of Ecology’s 1996, 1998, 2006 and 2008 303(d) lists of impaired water bodies (Table 1).
Table 1. Study area waterbody segments on the 2008 303(d) list for nutrient-related parameter[s].
Waterbody Segment Parameter Medium 2008 303(d) Listing ID
Tow
nshi
p
Ran
ge
Sect
ion
Lake Spokane (Long Lake) Dissolved oxygen Water 40939 27N 40E 15
Spokane River Dissolved oxygen Water 15188 26N 42E 17
Spokane River Dissolved oxygen Water 17523 25N 43E 02
Spokane River Dissolved oxygen Water 15187 25N 43E 18
Spokane River Dissolved oxygen Water 11400 25N 46E 06
Spokane River Total Phosphorus1 Water 6373 26N 42E 07
Note: 1 - Total phosphorus is listed in Category 4A on the Washington Water Quality Assessment due to the total phosphorus TMDL completed in 1992.
Modeling of the river/lake system confirmed that dissolved oxygen is significantly depleted by anthropogenic (human-caused) pollution sources and that the current approved/permitted loads would eventually cause dissolved oxygen to approach zero throughout bottom water layers of the stratified Lake Spokane. Evaluation of the existing 1992 total phosphorus TMDL also showed that it is not adequately protecting beneficial uses in Lake Spokane (Cusimano 2004). Point sources to the river are currently discharging significantly less phosphorus, carbonaceous biochemical oxygen demand (CBOD), and organic waste to the river than allowed under their existing NPDES permits. The current phosphorus loading limits were established in the 1992 total phosphorus TMDL. However, the continuing water quality problems described earlier indicate the current limits and current discharge rates are not adequate to protect water quality (Cusimano 2004). This TMDL is expected to improve dissolved oxygen conditions, not only upstream of Long Lake Dam, but downstream as well for the reasons described in the Reasonable Assurances section.

Spokane River / Lake Spokane Dissolved Oxygen Water Quality Improvement Report Page 8
This page is purposely left blank
Spokane River / Lake Spokane Dissolved Oxygen Water Quality Improvement Report Page 9
Water Quality Standards and Numeric Targets
Dissolved oxygen Dissolved oxygen levels can fluctuate over the day and night in response to changes in climatic conditions as well as the respiratory requirements of aquatic plants and algae. Aquatic organisms (including invertebrates) are very sensitive to fluctuations and overall reductions in the level of dissolved oxygen in the water. The health of fish and other aquatic species depends upon maintaining an adequate supply of oxygen dissolved in the water. Oxygen levels affect growth rates, swimming ability, susceptibility to disease, and the relative ability to endure other environmental stressors, including pollutants. Inadequate oxygen can cause mortality in fish and other aquatic organisms. State and tribal water quality standards are designed to maintain conditions that support healthy populations of fish and other aquatic life. Fresh waters In the state water quality standards, fresh water aquatic life use categories are described using key species (salmonid versus warm-water species) and life-stage conditions (spawning versus rearing). Minimum concentrations of dissolved oxygen are used as criteria to protect different categories of aquatic communities (WAC 173-201A-200). There are two dissolved oxygen standards for this TMDL that apply to the mainstem of the Spokane River from the state line to Nine Mile Dam, and for Lake Spokane from Nine Mile Dam to Long Lake Dam (Table 2) Lake Spokane standard For all lakes, and for reservoirs with a mean annual retention time of greater than 15 days, human actions considered cumulatively may not decrease the one-day minimum dissolved oxygen concentration more than 0.2 mg/L below natural conditions. Following lake turnover, when dissolved oxygen levels increase throughout the lake, the aquatic life dissolved oxygen criteria of core summer salmonid habitat applies to Lake Spokane: 9.5 mg/L dissolved oxygen (lowest one-day minimum). The retention time is essentially the time it takes for a reservoir to exchange its volume of water. For Lake Spokane, the mean retention time can be as low as five days during the peak spring snowmelt to greater than 50 days during the critical summer period, and can be as much as 150 days in the bottom of the lake (hypolimnion). During this critical summer period, water that is low in dissolved oxygen sits in the hypolimnion due to stratification, and is not released until turnover or mixing in the fall (see Seasonal Variation in Lake Spokane section). For the 2001 modeling year, the CE-QUAL-W2 model predicted the mean retention time to range from approximately 20 days to greater than 100 days during the critical summer period, with times increasing with depth (Cusimano 2004). The designated aquatic life uses and criteria from the water quality standards to be protected by this TMDL are presented in Table 2.
Spokane River / Lake Spokane Dissolved Oxygen Water Quality Improvement Report Page 10
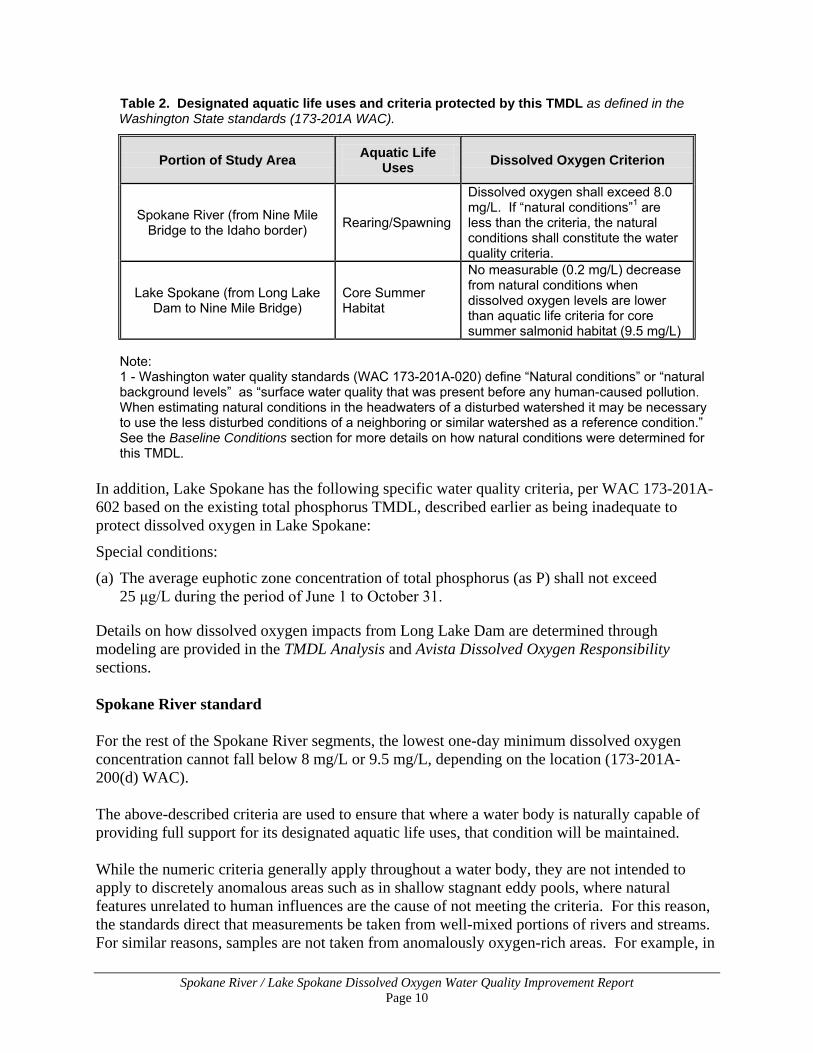
Table 2. Designated aquatic life uses and criteria protected by this TMDL as defined in the Washington State standards (173-201A WAC).
Portion of Study Area Aquatic Life Uses Dissolved Oxygen Criterion
Spokane River (from Nine Mile Bridge to the Idaho border) Rearing/Spawning
Dissolved oxygen shall exceed 8.0 mg/L. If “natural conditions”1 are less than the criteria, the natural conditions shall constitute the water quality criteria.
Lake Spokane (from Long Lake Dam to Nine Mile Bridge)
Core Summer Habitat
No measurable (0.2 mg/L) decrease from natural conditions when dissolved oxygen levels are lower than aquatic life criteria for core summer salmonid habitat (9.5 mg/L)
Note: 1 - Washington water quality standards (WAC 173-201A-020) define “Natural conditions” or “natural background levels” as “surface water quality that was present before any human-caused pollution. When estimating natural conditions in the headwaters of a disturbed watershed it may be necessary to use the less disturbed conditions of a neighboring or similar watershed as a reference condition.” See the Baseline Conditions section for more details on how natural conditions were determined for this TMDL.
In addition, Lake Spokane has the following specific water quality criteria, per WAC 173-201A-602 based on the existing total phosphorus TMDL, described earlier as being inadequate to protect dissolved oxygen in Lake Spokane:
Special conditions:
(a) The average euphotic zone concentration of total phosphorus (as P) shall not exceed 25 μg/L during the period of June 1 to October 31.
Details on how dissolved oxygen impacts from Long Lake Dam are determined through modeling are provided in the TMDL Analysis and Avista Dissolved Oxygen Responsibility sections. Spokane River standard For the rest of the Spokane River segments, the lowest one-day minimum dissolved oxygen concentration cannot fall below 8 mg/L or 9.5 mg/L, depending on the location (173-201A-200(d) WAC). The above-described criteria are used to ensure that where a water body is naturally capable of providing full support for its designated aquatic life uses, that condition will be maintained. While the numeric criteria generally apply throughout a water body, they are not intended to apply to discretely anomalous areas such as in shallow stagnant eddy pools, where natural features unrelated to human influences are the cause of not meeting the criteria. For this reason, the standards direct that measurements be taken from well-mixed portions of rivers and streams. For similar reasons, samples are not taken from anomalously oxygen-rich areas. For example, in
Spokane River / Lake Spokane Dissolved Oxygen Water Quality Improvement Report Page 11
a slow moving stream, focusing sampling on surface areas within a uniquely turbulent area would provide data that is erroneous for comparing to the criteria. This TMDL applies to the conditions and activities in Washington from the state line bridge at RM 96.0 to Long Lake Dam at RM 33.9. As described in the TMDL Analysis section, the CE-QUAL-W2 model was used to determine the concentration of phosphorus, ammonia, and CBOD in discharger effluent that together with Avista’s dissolved oxygen responsibility will meet the dissolved oxygen standards described in Table 2. The dissolved oxygen compliance points for this TMDL will consist of all of the segments of Lake Spokane. Discharger compliance points are at the point of discharge. Tributary targets apply at the mouths. Compliance with the water quality standards over the course of TMDL implementation will be determined by at least the following:
1. Reviewing measured discharger and tributary water quality data to determine if wasteload and load allocations are being met;
2. Reviewing Avista’s implementation activities and data as part of the 401 Certification WQAP; and
3. Comparing model scenarios for the natural (the No Source modeling scenario described in the TMDL Analysis section) and current water quality to determine the difference once actions described in this TMDL are implemented.
More information on TMDL implementation activities and responsibilities is provided in the Managed Implementation Plan section.
Spokane River / Lake Spokane Dissolved Oxygen Water Quality Improvement Report Page 12
This page is purposely left blank
Spokane River / Lake Spokane Dissolved Oxygen Water Quality Improvement Report Page 13
Watershed Description
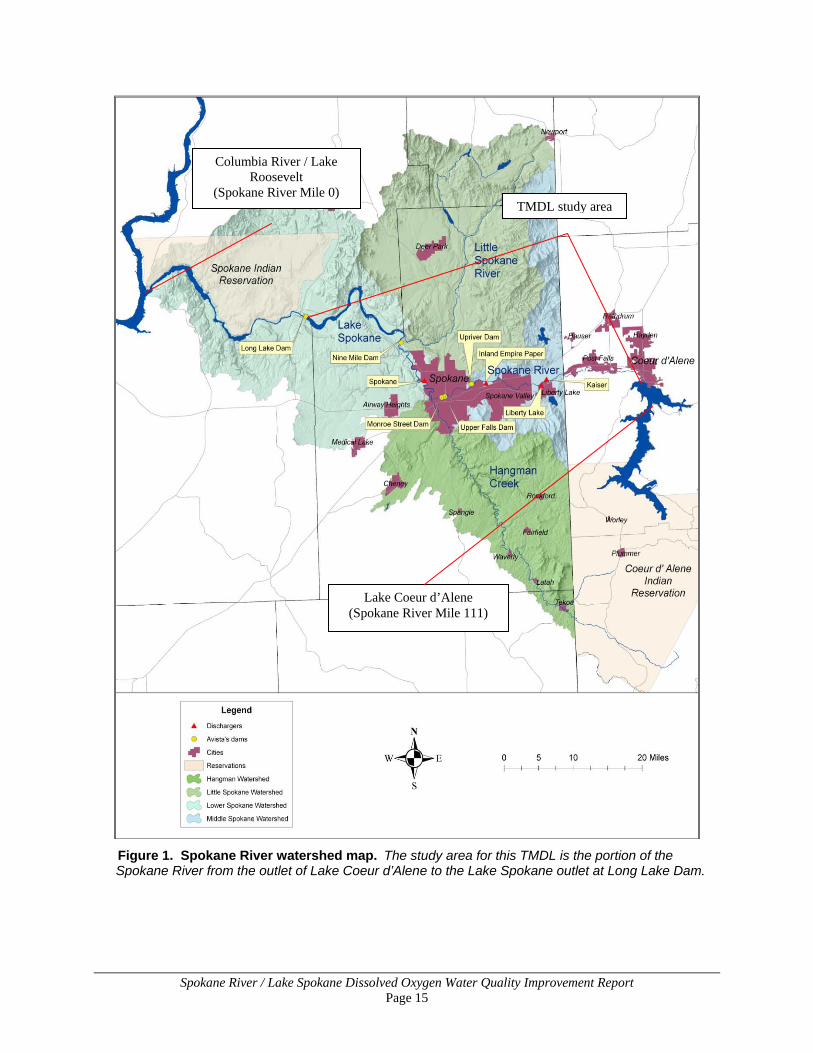
Geographic setting From its source at Lake Coeur d’Alene, the Spokane River flows west across the Idaho / Washington state line to the cities of Spokane and Spokane Valley. From Spokane, the river flows northwesterly through Lake Spokane and the Spokane Tribe of Indian’s reservation (where it is known as the “Spokane Arm”) to its confluence with the Franklin D. Roosevelt Lake impoundment of the Columbia River (Figure 1). The river drains an area of about 6,640 square miles in two states. Approximately 2,295 square miles are within Washington, with the remainder of the watershed in Idaho. Most residents in the watershed live in the Spokane metropolitan area; however, the incorporated area of Liberty Lake, east of Spokane, and the cities of Coeur d’Alene and Post Falls in Idaho are experiencing rapid growth. The study or modeling area for this TMDL stretches from Long Lake Dam to the outlet of Lake Coeur d’Alene and covers Water Resource Inventory Areas (WRIA) 54 and 57 in Washington. This TMDL applies to the conditions and activities in Washington from the state line bridge at river mile (RM) 96.0 to Long Lake Dam at RM 33.9. There are seven hydroelectric dams downstream from the outlet of Lake Coeur d’Alene that significantly influence the hydrodynamics of the river. The Post Falls Dam in Idaho at RM 100.8 regulates the water levels of Lake Coeur d’Alene. The other six dams include Upriver Dam (RM 79.9, operated by the city of Spokane); Upper Falls Dam (RM 74.2); Monroe Street Dam (RM 73.4); Nine-Mile Dam (RM 57.6); Long Lake Dam (RM 33.9); and Little Falls Dam (RM 29.3). The Washington dams are run-of-the river (flow-through) types except Long Lake Dam, which creates Lake Spokane, a 24-mile long reservoir. Four of the Washington dams operated by Avista Utilities (Long Lake, Upper Falls, Monroe Street, and Nine Mile), were relicensed by the Federal Energy Regulatory Commission (FERC) on June 18, 2009. Relicensing required the issuance of an Ecology certification under Section 401 of the Clean Water Act (“401 Certification”). First issued on June 10, 2008, the 401 Certification was amended and re-issued on May 11, 2009. The 401 Certification requires that Avista meet its responsibility to achieve water quality criteria for dissolved oxygen in conformance with the dissolved oxygen improvements identified in this TMDL. This TMDL gives an in-reservoir dissolved oxygen responsibility to Avista, which will be attained through a WQAP requirement in the 401 Certification. Upon EPA’s approval of this TMDL, Ecology will amend the 401 Certification by Administrative Order to require Avista to develop, within two years of the effective date of the amendment, the WQAP for review and approval by Ecology. More information on the Avista’s dissolved oxygen responsibility is provided in the Avista’s Dissolved Oxygen Responsibility and Managed Implementation Plan sections.
Spokane River / Lake Spokane Dissolved Oxygen Water Quality Improvement Report Page 14
There are seven wastewater discharges to the main stem of the Spokane River between Lake Coeur d’Alene and Lake Spokane (Figure 1), discharging a summer average of approximately 75 million gallons of treated wastewater per day. In Washington, beginning at Spokane and moving upstream, they include the city of Spokane Riverside Wastewater Treatment Plant, Inland Empire Paper, Kaiser Aluminum, and Liberty Lake Sewer and Water District. Dischargers in Idaho include the Post Falls Wastewater Treatment Plant, Hayden Area Regional Sewer Board, and the city of Coeur d’Alene Advanced Wastewater Treatment Plant. Each discharger has a National Pollutant Discharge Elimination System (NPDES) permit, which sets limits on the amount of pollutants that can be discharged to the river. In Washington State, NPDES permits are issued by Ecology and in Idaho, they are issued by EPA. The Washington permits are currently scheduled to be issued by early 2010.
Spokane River / Lake Spokane Dissolved Oxygen Water Quality Improvement Report Page 15
Figure 1. Spokane River watershed map. The study area for this TMDL is the portion of the Spokane River from the outlet of Lake Coeur d’Alene to the Lake Spokane outlet at Long Lake Dam.
Columbia River / Lake Roosevelt
(Spokane River Mile 0)
Lake Coeur d’Alene (Spokane River Mile 111)
TMDL study area

Spokane River / Lake Spokane Dissolved Oxygen Water Quality Improvement Report Page 16
This page is purposely left blank
Spokane River / Lake Spokane Dissolved Oxygen Water Quality Improvement Report Page 17
TMDL Analysis
Project goals This TMDL establishes Washington State’s plan for future management of organic and nutrient pollutants in the Spokane River and Lake Spokane that affect dissolved oxygen, cause excessive algae blooms, and contribute to degradation of downstream water quality on the Spokane Tribe of Indian’s Reservation. The goals of this TMDL analysis are to cumulatively assess all point sources of nutrient pollution in the Spokane River and Lake Spokane in Washington and Idaho, from the outlet of Lake Coeur d’Alene to Long Lake Dam; develop an equitable distribution of wasteload allocations; and provide a dissolved oxygen responsibility for the operator of Long Lake Dam (Avista Utilities). This TMDL will also supersede the existing Spokane River total phosphorus TMDL. The 1992 total phosphorus TMDL has since been demonstrated to be inadequately protective of water quality (Cusimano 2004). Management of these pollutants, according to this dissolved oxygen TMDL, will result in restoration and protection of existing and designated uses provided in Washington’s water quality standards, and will also improve dissolved oxygen conditions downstream of Lake Spokane.
Study quality assurance evaluation Ecology originally developed a quality assurance project plan (Cusimano 1999) to conduct sampling and modeling of the river and lake system. After doing preliminary modeling and fieldwork, Ecology chose to use the capabilities of the CE-QUAL-W2 model developed by the U.S. Army Corps of Engineers. The CE-QUAL-W2 model was chosen because it is considered state-of-the-science, and it has been used to simulate many other reservoirs. In addition, the model is well documented, nonproprietary, and has technical support readily available. An updated quality assurance project plan was developed by Wells and Berger (2009) for the 2009 technical analysis described below.
Technical analysis The TMDL effort has gone through several drafts and subsequent rounds of analysis using the CE-QUAL-W2 model over the past 10 years. The significant findings or developments from these past analyses include: 2000 – 2001
• 2001 established as the critical TMDL design year (see Determination of Critical River Flow Year (2001) section).
2004 • The CE-QUAL-W2 model was used to analyze five loading scenarios for this analysis. The
modeling results are described in Cusimano (2004).
Spokane River / Lake Spokane Dissolved Oxygen Water Quality Improvement Report Page 18
• Dissolved oxygen criteria in Lake Spokane and portions of the Spokane River are not met during the critical conditions (June to October), based on the low flow year of 2001.
• Lake Spokane suffers from algae blooms during the critical periods of warm weather and low flow. Along with contributing to oxygen demand, algae blooms also adversely affect aesthetics, boating, and other recreational uses of the lake.
• Low dissolved oxygen conditions in the lake contribute to violations of the Spokane Tribe of Indians’ water quality standards downstream of Lake Spokane.
• Algal production significantly contributes to dissolved oxygen depletions beyond criteria during critical conditions in the river and lake.
• Phosphorus has the most significant impact on algal production in the lake and river, but dissolved oxygen is also impacted by CBOD and ammonia.
• Both point and nonpoint sources of pollutant loading contribute to violations of water quality criteria.
• Dissolved oxygen in the hypolimnion (bottom strata of the lake) is most impacted by nonpoint pollution with some additional impact from point sources.
• Point sources of nutrients cause the majority of the dissolved oxygen depletion in the Lake Spokane interflow zone (metalimnion) during the summer.
• Current nonpoint pollutant loading causes more than a measureable (0.2 mg/L) decrease in dissolved oxygen from “natural conditions.”
• Managing pollutant loads as proposed to protect the lake’s dissolved oxygen will also protect the river’s dissolved oxygen.
• Reducing CBOD and phosphorus loads will likely reduce sediment oxygen demand over time, allowing for improved dissolved oxygen in the hypolimnion of the lake.
2007
• The conclusions from Cusimano (2004) are also applicable for this modeling effort.
• Natural background conditions at the Idaho/Washington upstream boundary were originally estimated using the uncalibrated 2001 CE-QUAL-W2 model of the Idaho portion of the river from the outlet of Lake Coeur d’Alene to the state line, developed by Portland State University under a contract from EPA. The upstream boundary conditions were represented by the output of EPA’s calibrated CE-QUAL-W2 model for the Idaho section of the Spokane River, and included point source loads corresponding to the proposed Idaho permit limits at that time.
• Dissolved phosphorus at 2.5 times the baseline tributary level was found to cause a measurable (0.2 mg/L) dissolved oxygen depletion in Lake Spokane; therefore, this scenario was used to establish the 2007 and 2008 draft TMDLs (all other constituents were kept at 2001 levels).
• The 2.5 times background phosphorus in the tributary scenarios corresponded to an average 16 percent phosphorus loading reduction from the 2001 levels during the April through October period.
Spokane River / Lake Spokane Dissolved Oxygen Water Quality Improvement Report Page 19
2008 - 2009 Following the request from EPA for Ecology to postpone submittal of the 2008 draft TMDL (see Appendix H), an interagency workgroup comprised of IDEQ, Ecology, and EPA, collaborated through the latter part of 2008 into 2009 to develop a revised TMDL assessment. The Spokane Tribe of Indians was kept informed and consulted with throughout the process, but has since stated it did not have decision-making power within the development of the TMDL. The goals of this assessment were as follows:
• Determine an objective basis to distinguish between the dissolved oxygen impacts caused by Long Lake Dam versus impacts caused by excess nutrients from upstream sources (point source dischargers, tributaries, etc).
• Determine the cumulative impact on dissolved oxygen in Lake Spokane by all the dischargers in both states based on an equitable distribution of nutrient wasteload allocations.
Key to meeting the project goals was developing a modeling approach that incorporates the effects of point and nonpoint discharges on dissolved oxygen in the lake, while also assigning a quantitative value for dissolved oxygen impacts caused by Long Lake Dam. The scenarios in Table 3 provide the outline of the assessments and were developed by the interagency group in early 2009 and refined in response to comments in the draft TMDL issued in September 2009. Scenarios are broken into three categories: “baseline,” “TMDL”, and “source assessment” scenarios. Baseline scenarios include the Calibration (2001 conditions) and No Source scenarios. The TMDL scenarios include all point and nonpoint sources (in both states) set to the proposed wasteload and load allocation levels. After choosing one TMDL scenario, source assessment scenarios were developed to answer specific questions about the TMDL. These source assessment scenarios included simulations to assess: 1) the impact from increased FERC flows on dissolved oxygen under the TMDL conditions, 2) the impact of Idaho sources alone, and 3) the impact of discharges early in the year (specifically in the month of March). The FERC flow scenario indicated that the FERC license requirements related to minimum instream flow would have a negligible effect (less than 0.05 mg/l) on dissolved oxygen depletion in Lake Spokane. The Idaho-only scenario indicated that Idaho sources have a significant impact on dissolved oxygen in Lake Spokane in the context of this TMDL. Finally, after public comments questioning whether March discharges affect water quality in Lake Spokane during the critical summer/fall period, the March scenario indicated that March discharges do affect the lake in the critical period (PSU 2010). Following an initial modeling and draft report in June 2009, several adjustments were made to model inputs in subsequent model runs concurrent with the source assessment scenarios in August 2009. Additional adjustments were made following the public comment period in December of 2009. These changes were incorporated into the final modeling report (PSU 2010), as described in Appendix E. Note that there was no need to run TMDL #2 and Flow Impact scenarios after the public comment period, so results of those scenarios are only found in the August 2009 model report (PSU 2009).
Spokane River / Lake Spokane Dissolved Oxygen Water Quality Improvement Report Page 20
Determination of critical river flow year (2001) The low river flow period is expected to be the most critical period for pollutant loading effects in the river and Lake Spokane due to less dilution of nutrient concentrations and a longer retention time, both of which can exacerbate dissolved oxygen shortages. By using a representative critical low flow year, the water quality in Lake Spokane and the Spokane River should be adequately protected as further described below and in the Margin of Safety section. The 2001 water year was chosen as the critical flow year in the CE-QUAL-W2 modeling simulations, based on comparisons of daily average flows described in Cusimano (2004). The water year daily average and seven-day low flows for flow years 1968-2001 were ranked from lowest to highest, and the seven years with the lowest flows were selected for further assessment. The years selected were 1973, 1977, 1987, 1988, 1992, 1994, and 2001. The years 1986 and 2000 had lower seven -day low flows than 1977; however, they had water year daily average flows close to median conditions. The water year 1977 had the lowest water year daily average flow and the ninth lowest seven -day low flow. The exceedance probabilities for the algal growing season (June-October), individual summer months, and the spring snowmelt period were also determined. These periods were considered “critical” for assessing the impact of pollutants that affect dissolved oxygen concentrations. Exceedance probabilities were determined by fitting a theoretical “best fit” distribution to the 34-year data record and for the different periods as described in Cusimano (2004). The mean exceedance probabilities for all of the critical periods during 1992 and 2001 were close to 90 percent (92.4 and 92.2, respectively), and had low variability. During late August 1992, average flows increased at Spokane for one week to about 1400 cfs, which interrupted late summer low flows such that 1992 does not represent late August low-flow conditions. Of all the years assessed, 2001 best represents current low river flow conditions because there appeared to be a downward trend in seven -day low flows that represented baseflows in the river. In general, spring and early summer river flows influence late-summer water quality of Lake Spokane because the magnitude of the spring snowmelt and summer baseflows determine pollutant residence time in Lake Spokane (i.e., high spring and summer flows provide more flushing than low flows). In addition, flows in August determine the magnitude of the annual low-flow period for the river. The low river flow period is expected to be the most critical period for pollutant loading effects in the river and Lake Spokane (i.e., less dilution and longer residence time). These actual flow conditions would be expected to be lower only about 10 times every 100 years. Water quality data collected during 2001 were input into the model, and the CE-QUAL-W2 model was set up to simulate 2001 conditions, which reduces the uncertainty associated with projecting water quality conditions to low-flow conditions. In addition, as noted earlier, Ecology has used the model to estimate the effect of higher minimum flows required by Avista’s FERC relicensing on water quality under TMDL Scenario #1. The model results indicate that the effect on reservoir dissolved oxygen is negligible. This is an example of how the model can be
Spokane River / Lake Spokane Dissolved Oxygen Water Quality Improvement Report Page 21
used to estimate the amount of water quality improvement from specific implementation activities. Baseline conditions Establishing baseline water quality is essential in order to apply the water quality standards for the Spokane River and Lake Spokane. This is particularly important, and more complicated, for water bodies that originate in a different state. The conditions set forth in this TMDL are based on a cumulative modeling analysis of all sources of nutrient loading to the Spokane River and Lake Spokane, from the outlet of Lake Coeur d’Alene in Idaho to Long Lake Dam in Washington. This TMDL establishes the upstream boundary condition as the current water quality conditions at the outlet of Lake Coeur d’Alene. The current concentrations of nutrients in the lake, while not natural, are very low at the lake outlet forming the Spokane River. For the tributary mouths, the boundary condition is calculated using measured water quality at California Creek for Hangman and Coulee Creeks and at the Scotia monitoring station on the Little Spokane River. These locations are upstream of most human activities in the watershed, so they provide the best available estimate of the natural condition at the tributary mouths. Once the upstream boundary conditions are established, the baseline condition within the TMDL study area in Washington is calculated using the No Source (natural condition) model scenario. For the tributary mouths, the baseline natural condition is estimated using measured water quality at California Creek for Hangman and Coulee Creeks and at the Scotia monitoring station on the Little Spokane River. These locations are upstream of most human activities in the watershed, so they provide the best available estimate of the natural condition at the tributary mouths. The baseline natural condition for groundwater inflows is estimated using well data from the watershed. The well information was analyzed to determine the characteristics of the highest quality, least impacted groundwater. The baseline total phosphorus condition for groundwater is set to 4 µg/L The baseline condition consists of the estimated water quality in the Spokane River without any anthropogenic sources. Therefore, the No Source model scenario does not include point sources, urban stormwater, or combined sewer overflows (CSOs). Once the baseline water quality condition was calculated by the No Source model simulation, the TMDL technical analysis proceeded with the running of model scenarios to determine the impact of several combinations of wasteload allocations and load allocations on dissolved oxygen in the river and lake compared to the baseline condition and water quality standard. Quantifying Avista’s contribution to the water quality impairment in Long Lake required an understanding and balancing of impairments caused by both the upstream anthropogenic pollutant loads, and by the hydrologic changes caused by the dam. The approach used by Ecology and EPA to quantify the dam’s contribution to the Lake Spokane’s low dissolved oxygen levels was to reduce the upstream anthropogenic loading of oxygen demanding pollution to levels that are typical of other nearby
Spokane River / Lake Spokane Dissolved Oxygen Water Quality Improvement Report Page 22
rivers, and that represent minimal human impact. This “riverine assessment” approach is discussed further in the Avista’s Dissolved Oxygen Responsibility section.
Spokane River / Lake Spokane Dissolved Oxygen Water Quality Improvement Report Page 23
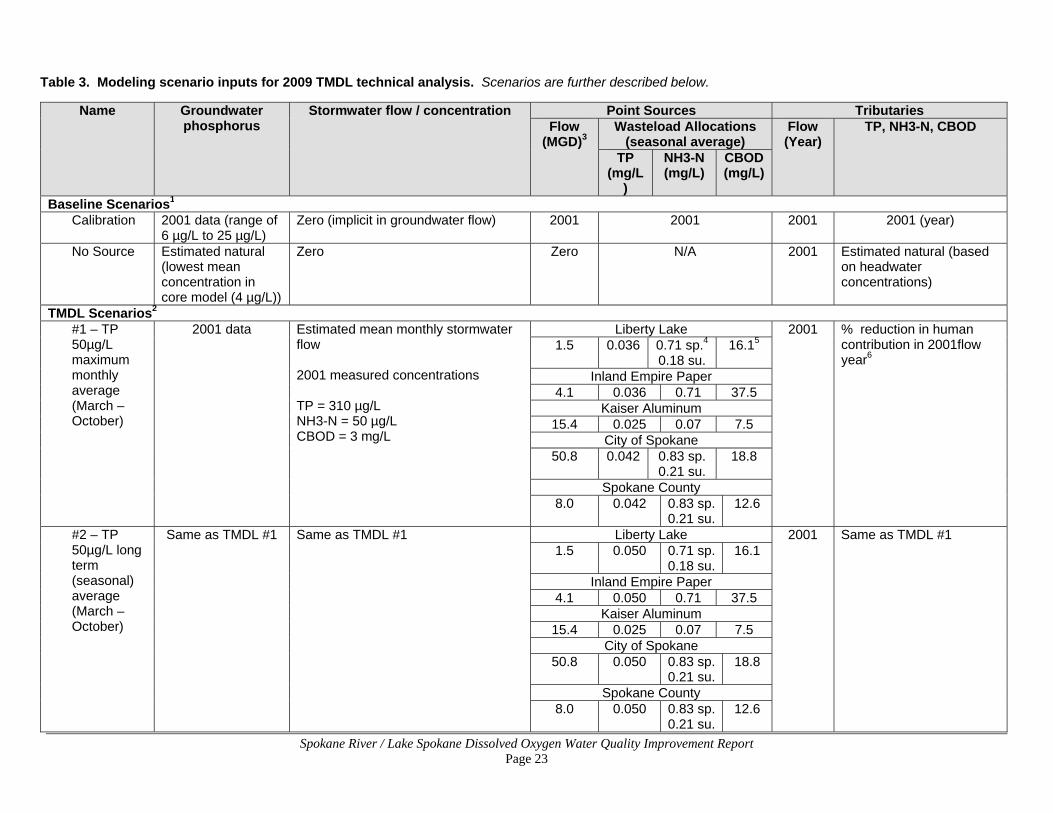
Table 3. Modeling scenario inputs for 2009 TMDL technical analysis. Scenarios are further described below.
Name Groundwater phosphorus
Stormwater flow / concentration Point Sources Tributaries Flow
(MGD)3 Wasteload Allocations
(seasonal average) Flow (Year)
TP, NH3-N, CBOD
TP (mg/L
)
NH3-N (mg/L)
CBOD (mg/L)
Baseline Scenarios1 Calibration 2001 data (range of
6 µg/L to 25 µg/L) Zero (implicit in groundwater flow) 2001 2001 2001 2001 (year)
No Source Estimated natural (lowest mean concentration in core model (4 µg/L))
Zero Zero N/A 2001 Estimated natural (based on headwater concentrations)
TMDL Scenarios2 #1 – TP 50µg/L maximum monthly average (March – October)
2001 data
Estimated mean monthly stormwater flow
2001 measured concentrations
TP = 310 µg/L NH3-N = 50 µg/L CBOD = 3 mg/L
Liberty Lake 2001 % reduction in human contribution in 2001flow year6
1.5 0.036 0.71 sp.4 0.18 su.
16.15
Inland Empire Paper 4.1 0.036 0.71 37.5
Kaiser Aluminum 15.4 0.025 0.07 7.5
City of Spokane 50.8 0.042 0.83 sp.
0.21 su. 18.8
Spokane County 8.0 0.042 0.83 sp.
0.21 su.12.6
#2 – TP 50µg/L long term (seasonal) average (March – October)
Same as TMDL #1 Same as TMDL #1 Liberty Lake 2001 Same as TMDL #1 1.5 0.050 0.71 sp.
0.18 su.16.1
Inland Empire Paper 4.1 0.050 0.71 37.5
Kaiser Aluminum 15.4 0.025 0.07 7.5
City of Spokane 50.8 0.050 0.83 sp.
0.21 su.18.8
Spokane County 8.0 0.050 0.83 sp.
0.21 su.12.6
Spokane River / Lake Spokane Dissolved Oxygen Water Quality Improvement Report Page 24
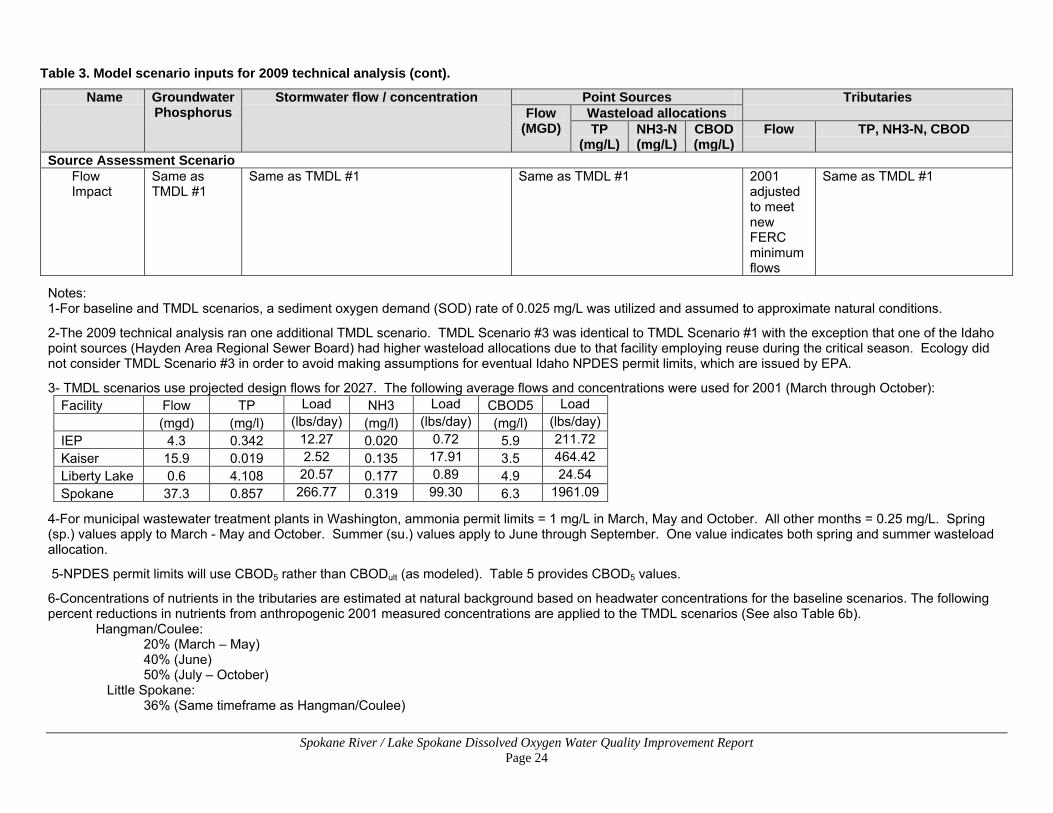
Table 3. Model scenario inputs for 2009 technical analysis (cont).
Name Groundwater Phosphorus
Stormwater flow / concentration Point Sources Tributaries Flow
(MGD) Wasteload allocations TP
(mg/L) NH3-N (mg/L)
CBOD (mg/L)
Flow TP, NH3-N, CBOD
Source Assessment Scenario Flow Impact
Same as TMDL #1
Same as TMDL #1 Same as TMDL #1 2001 adjusted to meet new FERC minimum flows
Same as TMDL #1
Notes: 1-For baseline and TMDL scenarios, a sediment oxygen demand (SOD) rate of 0.025 mg/L was utilized and assumed to approximate natural conditions.
2-The 2009 technical analysis ran one additional TMDL scenario. TMDL Scenario #3 was identical to TMDL Scenario #1 with the exception that one of the Idaho point sources (Hayden Area Regional Sewer Board) had higher wasteload allocations due to that facility employing reuse during the critical season. Ecology did not consider TMDL Scenario #3 in order to avoid making assumptions for eventual Idaho NPDES permit limits, which are issued by EPA.
3- TMDL scenarios use projected design flows for 2027. The following average flows and concentrations were used for 2001 (March through October): Facility Flow TP Load NH3 Load CBOD5 Load (mgd) (mg/l) (lbs/day) (mg/l) (lbs/day) (mg/l) (lbs/day) IEP 4.3 0.342 12.27 0.020 0.72 5.9 211.72 Kaiser 15.9 0.019 2.52 0.135 17.91 3.5 464.42 Liberty Lake 0.6 4.108 20.57 0.177 0.89 4.9 24.54 Spokane 37.3 0.857 266.77 0.319 99.30 6.3 1961.09
4-For municipal wastewater treatment plants in Washington, ammonia permit limits = 1 mg/L in March, May and October. All other months = 0.25 mg/L. Spring (sp.) values apply to March - May and October. Summer (su.) values apply to June through September. One value indicates both spring and summer wasteload allocation.
5-NPDES permit limits will use CBOD5 rather than CBODult (as modeled). Table 5 provides CBOD5 values.
6-Concentrations of nutrients in the tributaries are estimated at natural background based on headwater concentrations for the baseline scenarios. The following percent reductions in nutrients from anthropogenic 2001 measured concentrations are applied to the TMDL scenarios (See also Table 6b).
Hangman/Coulee: 20% (March – May) 40% (June) 50% (July – October)
Little Spokane: 36% (Same timeframe as Hangman/Coulee)
Spokane River / Lake Spokane Dissolved Oxygen Water Quality Improvement Report Page 25
Calibration: Core model using updated version of CE-QUAL-W2 (3.6). This scenario combines the Idaho and Washington models and incorporates new information for groundwater. No Source: Baseline model run for TMDL. All other scenarios are compared to this baseline dissolved oxygen in Lake Spokane. River main stem flow conditions for this scenario are 2001 conditions without adjustments for recently changed FERC minimum flows (see Flow Impact scenario). TMDL Scenario #1 – TP 50 µg/L maximum monthly average: This is a TMDL alternative scenario for comparison to the No Source baseline. The estimated monthly average permit limit is 50 µg/L (other than Kaiser). Assuming that point sources will achieve relatively consistent performance from March to October, the model input for each point source is fixed at a long-term average, which is calculated from the estimated monthly average; the long-term averages are 36 µg/L (Liberty Lake, Inland Empire), 25 µg/L (Kaiser) and 42 µg/L (city of Spokane, Spokane County). Kaiser has a lower total phosphorus wasteload allocation because their use of non-contact groundwater lowers their total phosphorus in their effluent. Tributary nonpoint sources are set to estimated achievable reductions and stormwater loading estimate is set to estimated average loadings (see stormwater analysis, Appendix K). The dissolved oxygen responsibility for Avista in the reservoir is determined by comparing volume-weighted dissolved oxygen levels in this scenario to volume-weighted dissolved oxygen levels in the No Source scenario (see Table 7). Results are found in PSU (2010). TMDL Scenario#2 – TP 50 µg/L long term average: This is a TMDL alternative scenario identical to TMDL alternative #1 except point source phosphorus is set to 50 µg/L as a long term (March to October) average rather than a maximum monthly average for all facilities other than Kaiser. The estimated monthly average permit limit associated with this allocation would range from 60 – 70 µg/L for all facilities except Kaiser. Results are found in PSU (2009). Flow Impact: This scenario estimates the effect of the new FERC flow requirements from Avista’s 401 certification on water quality with the proposed TMDL allocations. This scenario was run after the TMDL scenario was selected. This particular scenario is the only model run with a different flow regime. The results indicated that the FERC license requirements related to minimum instream flow would have a negligible effect on dissolved oxygen in Lake Spokane. Results for this scenario are provided in PSU (2009). Since it is unlikely that the results would change significantly, this scenario was not updated in the final scenario runs. Idaho Only: This scenario estimates the impact of Idaho sources on dissolved oxygen in Lake Spokane in isolation. It included Idaho discharges at the assumed conditions for the TMDL, and Washington conditions set to the No Source scenario inputs. The Idaho-only scenario indicated that Idaho sources have a significant impact on dissolved oxygen in Lake Spokane in the context of this TMDL. This information provides information about the linkage between the Washington TMDL and the pending permitting process for Idaho sources. Results for this scenario are provided in PSU (2010). March Test: This scenario estimates the impact of discharges early in the year (specifically in the month of March). This scenario was run in response to public comments questioning
Spokane River / Lake Spokane Dissolved Oxygen Water Quality Improvement Report Page 26
whether March discharges affect water quality in Lake Spokane during the critical summer/fall period. The results indicated that March discharges do affect the lake in the critical period (PSU 2010). Based on modeling results (Appendix E, PSU 2009), TMDL Scenario #1 was chosen to establish the wasteload and load allocations and Avista’s dissolved oxygen responsibility in this TMDL for the reasons described in the Modeling Selection, Results and Discussion section. Avista’s dissolved oxygen responsibility was determined by taking the difference in reservoir dissolved oxygen between TMDL Scenario #1 and the No Source scenario minus 0.2 mg/L across all modeling segments on the lake (when aquatic use criteria are not met). This responsibility is expressed as a bi-weekly average dissolved oxygen improvement and is further described in the Avista’s Dissolved Oxygen Responsibility section.
Spokane River / Lake Spokane Dissolved Oxygen Water Quality Improvement Report Page 27
Modeling Selection, Results and Discussion
Selection of TMDL scenario In selecting a TMDL scenario, Ecology must choose a scenario that implements the applicable water quality standards. Based on all of the available information and considerations for this TMDL, Ecology believes TMDL Scenario #1 is the scenario most likely to result in the attainment of water quality standards and adopts the load and wasteload allocations based on this scenario for the following findings from the modeling report that supported the draft TMDL (PSU 2009):
• The point source reductions resulted in an average total phosphorus concentration in the riverine portion of Lake Spokane (model segment 154) of 10 µg/L from June through September.
• TMDL Scenario #1 reduced the average total phosphorus concentration entering Lake Spokane from the mainstem (model segment 154) by approximately 66 percent from March to October under TMDL Scenario #1 (equivalent to 85% reduction of the human caused load).
• TMDL Scenario #1 represented an average of approximately 6 lbs/day less total phosphorus entering Lake Spokane (model segment 154) compared to TMDL Scenario #2 from June through September considering sources in both Washington and Idaho. Lower phosphorus levels benefit dissolved oxygen in Lake Spokane and Tribal waters downstream.
• TMDL Scenario #1 results in an average of approximately 0.04 mg/L more dissolved oxygen in Lake Spokane than TMDL Scenario #2 from June through September.
Modeling results for TMDL Scenario #1 showed that the greatest dissolved oxygen difference from background conditions in Lake Spokane was 1.2 mg/L, and occurred during the August 16-31 time period in the deep model segments closest to Long Lake Dam (see Table 7, Figure 2).
Based on public comments on the draft TMDL, minor changes were made in some components of the water quality model (e.g., corrections in point source characteristics, changes to natural groundwater conditions). The selected TMDL scenario (#1) was run again, along with the No Source scenario, to complete the final TMDL. The model changes resulted in minor changes to the concentration and loading values associated with the TMDL.
Since the model changes were minor and Scenario #2 was not selected, it was re-run in the final round of modeling scenario work. For the remainder of this document, TMDL Scenario #1 is simply referred to as the TMDL scenario.
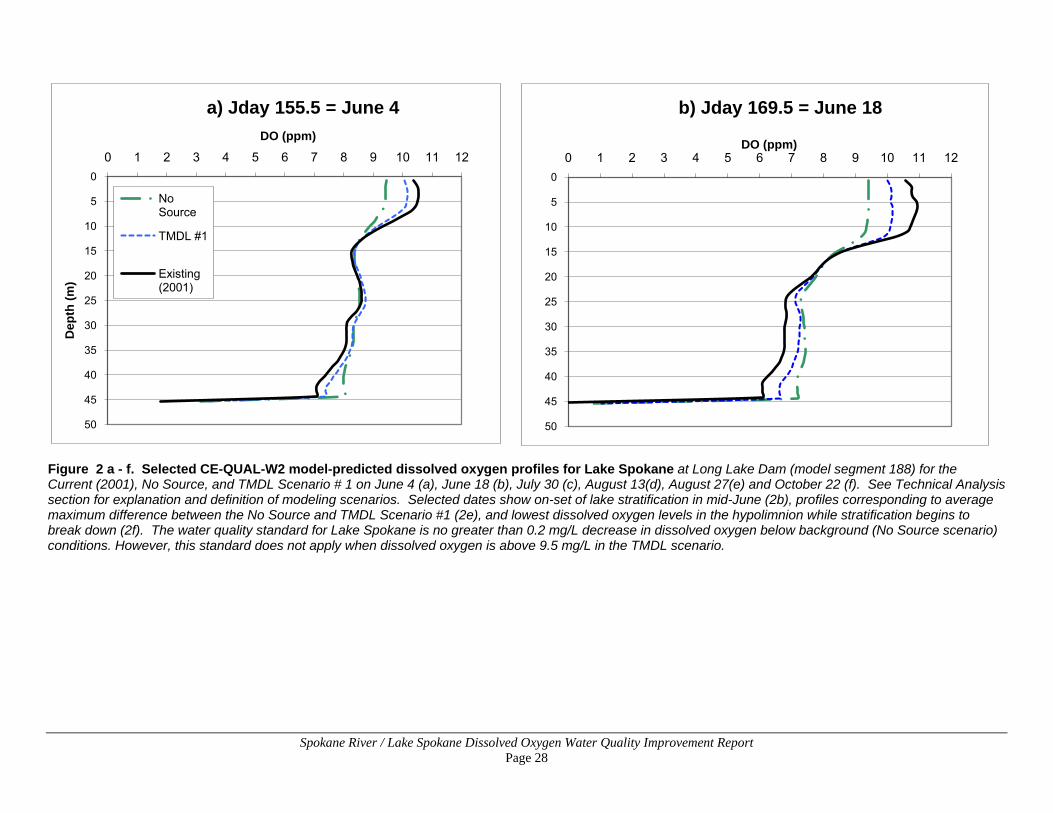
Spokane River / Lake Spokane Dissolved Oxygen Water Quality Improvement Report Page 28
Figure 2 a - f. Selected CE-QUAL-W2 model-predicted dissolved oxygen profiles for Lake Spokane at Long Lake Dam (model segment 188) for the Current (2001), No Source, and TMDL Scenario # 1 on June 4 (a), June 18 (b), July 30 (c), August 13(d), August 27(e) and October 22 (f). See Technical Analysis section for explanation and definition of modeling scenarios. Selected dates show on-set of lake stratification in mid-June (2b), profiles corresponding to average maximum difference between the No Source and TMDL Scenario #1 (2e), and lowest dissolved oxygen levels in the hypolimnion while stratification begins to break down (2f). The water quality standard for Lake Spokane is no greater than 0.2 mg/L decrease in dissolved oxygen below background (No Source scenario) conditions. However, this standard does not apply when dissolved oxygen is above 9.5 mg/L in the TMDL scenario.
0
5
10
15
20
25
30
35
40
45
50
0 1 2 3 4 5 6 7 8 9 10 11 12
Dep
th (m
)
DO (ppm)
a) Jday 155.5 = June 4
No Source
TMDL #1
Existing (2001)
0
5
10
15
20
25
30
35
40
45
50
0 1 2 3 4 5 6 7 8 9 10 11 12DO (ppm)
b) Jday 169.5 = June 18
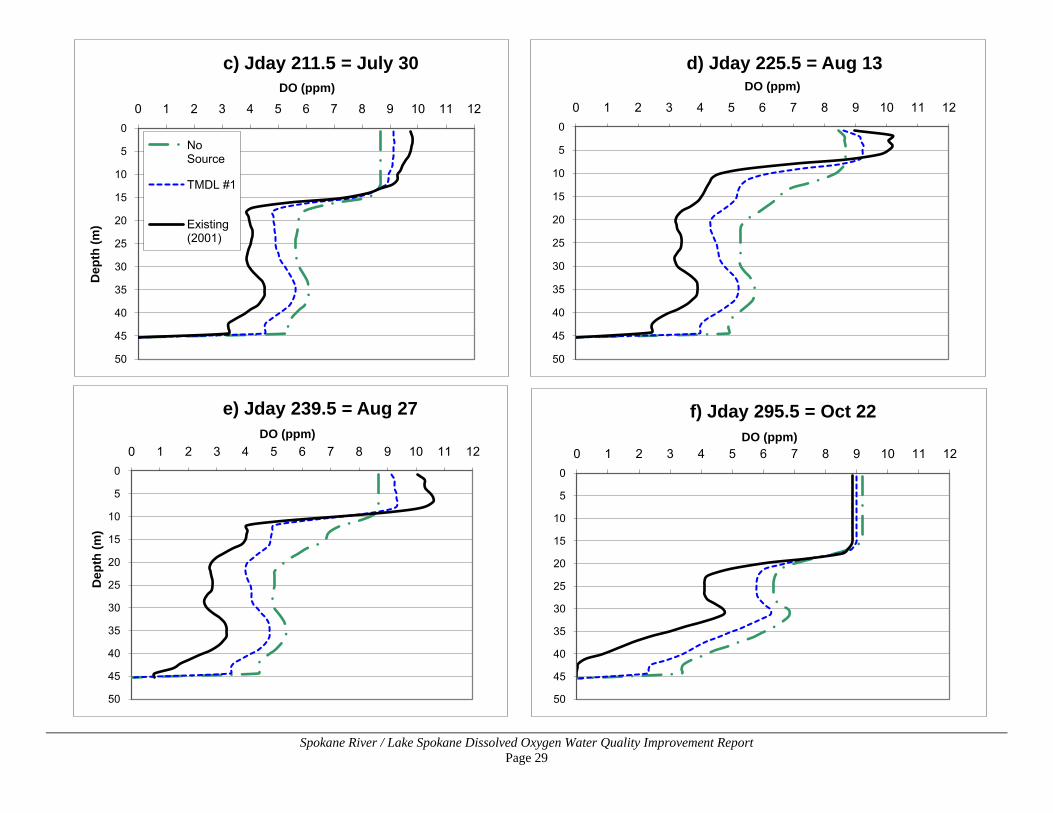
Spokane River / Lake Spokane Dissolved Oxygen Water Quality Improvement Report Page 29
0
5
10
15
20
25
30
35
40
45
50
0 1 2 3 4 5 6 7 8 9 10 11 12D
epth
(m)
DO (ppm)
c) Jday 211.5 = July 30
No Source
TMDL #1
Existing (2001)
0
5
10
15
20
25
30
35
40
45
50
0 1 2 3 4 5 6 7 8 9 10 11 12
DO (ppm)d) Jday 225.5 = Aug 13
0
5
10
15
20
25
30
35
40
45
50
0 1 2 3 4 5 6 7 8 9 10 11 12
Dep
th (m
)
DO (ppm)
e) Jday 239.5 = Aug 27
0
5
10
15
20
25
30
35
40
45
50
0 1 2 3 4 5 6 7 8 9 10 11 12DO (ppm)
f) Jday 295.5 = Oct 22
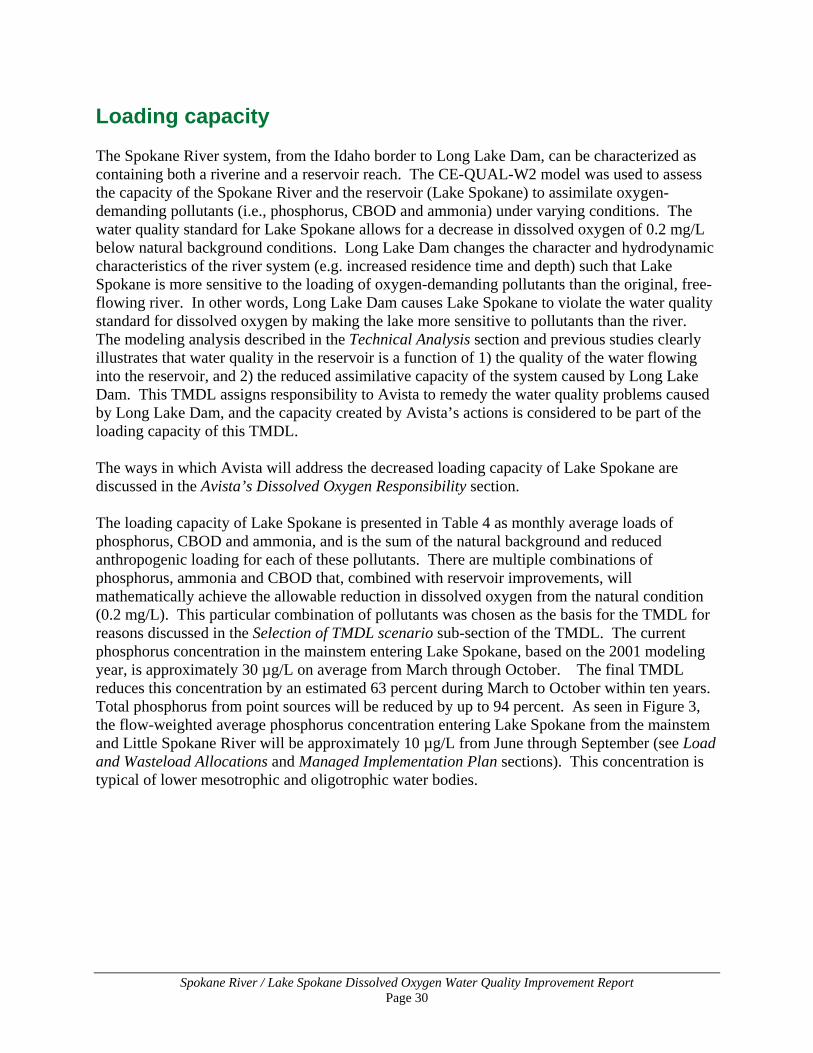
Spokane River / Lake Spokane Dissolved Oxygen Water Quality Improvement Report Page 30
Loading capacity The Spokane River system, from the Idaho border to Long Lake Dam, can be characterized as containing both a riverine and a reservoir reach. The CE-QUAL-W2 model was used to assess the capacity of the Spokane River and the reservoir (Lake Spokane) to assimilate oxygen-demanding pollutants (i.e., phosphorus, CBOD and ammonia) under varying conditions. The water quality standard for Lake Spokane allows for a decrease in dissolved oxygen of 0.2 mg/L below natural background conditions. Long Lake Dam changes the character and hydrodynamic characteristics of the river system (e.g. increased residence time and depth) such that Lake Spokane is more sensitive to the loading of oxygen-demanding pollutants than the original, free-flowing river. In other words, Long Lake Dam causes Lake Spokane to violate the water quality standard for dissolved oxygen by making the lake more sensitive to pollutants than the river. The modeling analysis described in the Technical Analysis section and previous studies clearly illustrates that water quality in the reservoir is a function of 1) the quality of the water flowing into the reservoir, and 2) the reduced assimilative capacity of the system caused by Long Lake Dam. This TMDL assigns responsibility to Avista to remedy the water quality problems caused by Long Lake Dam, and the capacity created by Avista’s actions is considered to be part of the loading capacity of this TMDL. The ways in which Avista will address the decreased loading capacity of Lake Spokane are discussed in the Avista’s Dissolved Oxygen Responsibility section. The loading capacity of Lake Spokane is presented in Table 4 as monthly average loads of phosphorus, CBOD and ammonia, and is the sum of the natural background and reduced anthropogenic loading for each of these pollutants. There are multiple combinations of phosphorus, ammonia and CBOD that, combined with reservoir improvements, will mathematically achieve the allowable reduction in dissolved oxygen from the natural condition (0.2 mg/L). This particular combination of pollutants was chosen as the basis for the TMDL for reasons discussed in the Selection of TMDL scenario sub-section of the TMDL. The current phosphorus concentration in the mainstem entering Lake Spokane, based on the 2001 modeling year, is approximately 30 µg/L on average from March through October. The final TMDL reduces this concentration by an estimated 63 percent during March to October within ten years. Total phosphorus from point sources will be reduced by up to 94 percent. As seen in Figure 3, the flow-weighted average phosphorus concentration entering Lake Spokane from the mainstem and Little Spokane River will be approximately 10 µg/L from June through September (see Load and Wasteload Allocations and Managed Implementation Plan sections). This concentration is typical of lower mesotrophic and oligotrophic water bodies.
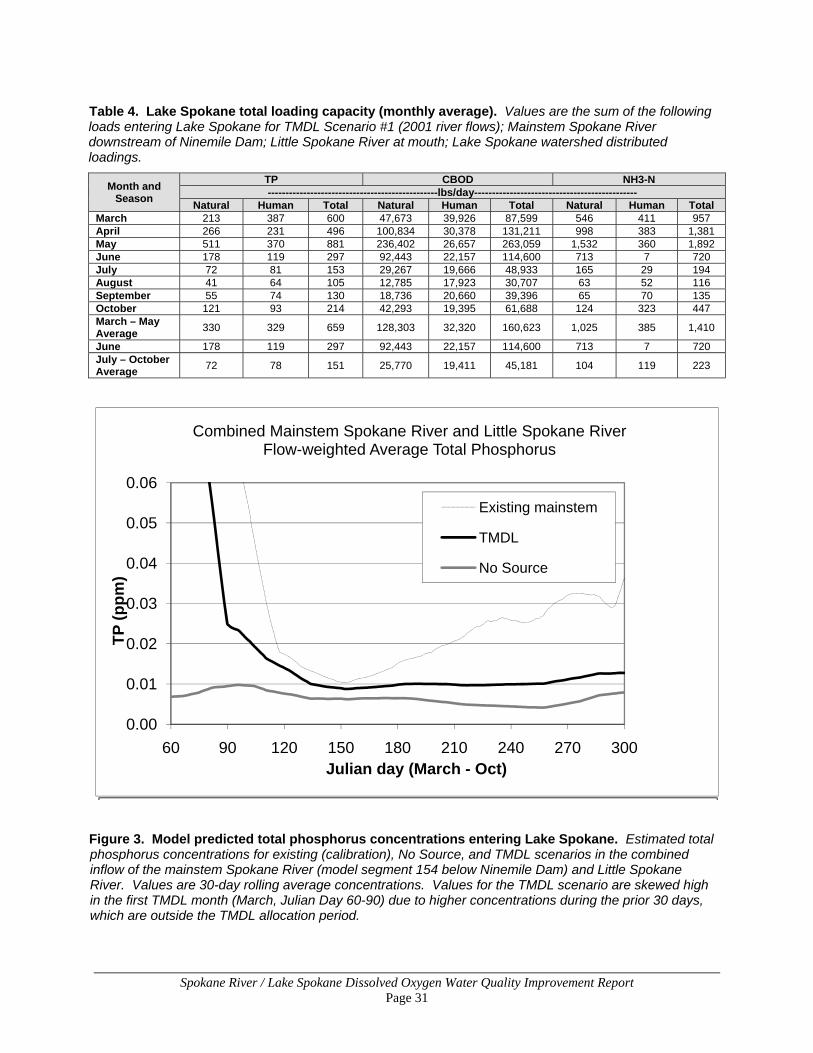
Spokane River / Lake Spokane Dissolved Oxygen Water Quality Improvement Report Page 31
Table 4. Lake Spokane total loading capacity (monthly average). Values are the sum of the following loads entering Lake Spokane for TMDL Scenario #1 (2001 river flows); Mainstem Spokane River downstream of Ninemile Dam; Little Spokane River at mouth; Lake Spokane watershed distributed loadings.
Month and Season
TP CBOD NH3-N ------------------------------------------------lbs/day----------------------------------------------
Natural Human Total Natural Human Total Natural Human Total March 213 387 600 47,673 39,926 87,599 546 411 957 April 266 231 496 100,834 30,378 131,211 998 383 1,381 May 511 370 881 236,402 26,657 263,059 1,532 360 1,892 June 178 119 297 92,443 22,157 114,600 713 7 720 July 72 81 153 29,267 19,666 48,933 165 29 194 August 41 64 105 12,785 17,923 30,707 63 52 116 September 55 74 130 18,736 20,660 39,396 65 70 135 October 121 93 214 42,293 19,395 61,688 124 323 447 March – May Average
330 329 659 128,303 32,320 160,623 1,025 385 1,410
June 178 119 297 92,443 22,157 114,600 713 7 720 July – October Average
72 78 151 25,770 19,411 45,181 104 119 223
Figure 3. Model predicted total phosphorus concentrations entering Lake Spokane. Estimated total phosphorus concentrations for existing (calibration), No Source, and TMDL scenarios in the combined inflow of the mainstem Spokane River (model segment 154 below Ninemile Dam) and Little Spokane River. Values are 30-day rolling average concentrations. Values for the TMDL scenario are skewed high in the first TMDL month (March, Julian Day 60-90) due to higher concentrations during the prior 30 days, which are outside the TMDL allocation period.
0.00
0.01
0.02
0.03
0.04
0.05
0.06
60 90 120 150 180 210 240 270 300
TP
(p
pm
)
Julian day (March - Oct)
Combined Mainstem Spokane River and Little Spokane RiverFlow-weighted Average Total Phosphorus
Existing mainstem
TMDL
No Source
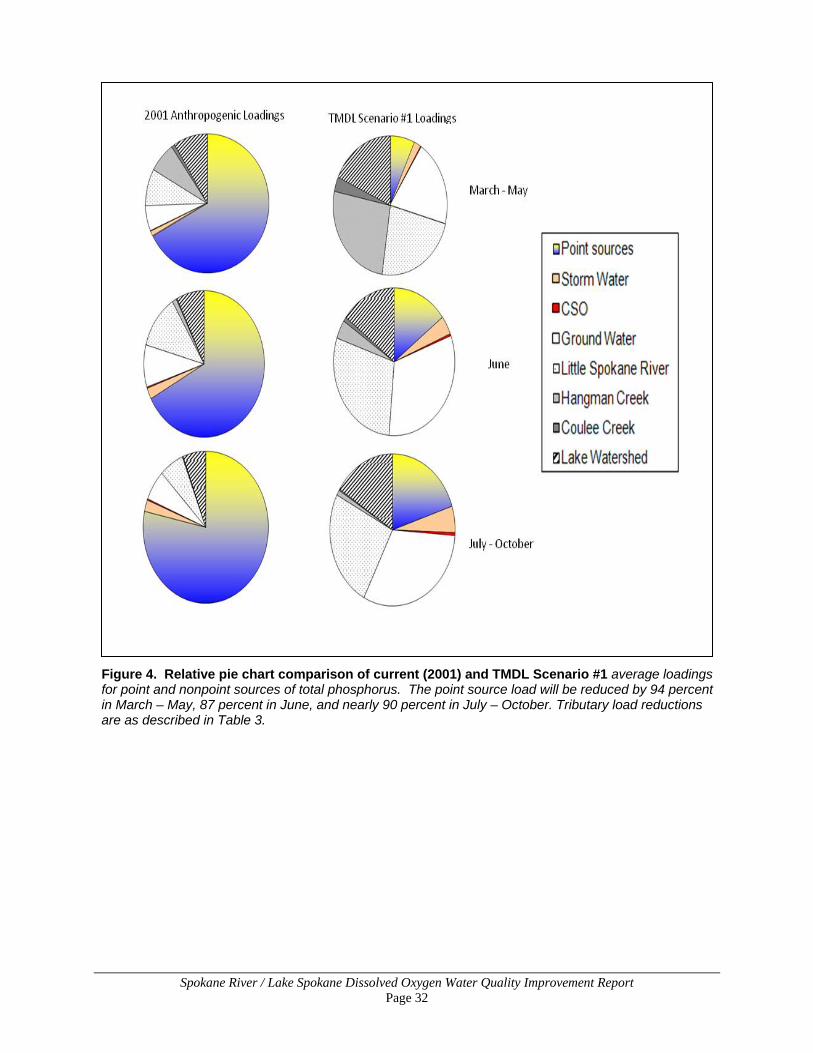
Spokane River / Lake Spokane Dissolved Oxygen Water Quality Improvement Report Page 32
Figure 4. Relative pie chart comparison of current (2001) and TMDL Scenario #1 average loadings for point and nonpoint sources of total phosphorus. The point source load will be reduced by 94 percent in March – May, 87 percent in June, and nearly 90 percent in July – October. Tributary load reductions are as described in Table 3.
Spokane River / Lake Spokane Dissolved Oxygen Water Quality Improvement Report Page 33
Load and Wasteload Allocations
Wasteload allocations The seasonal (March to October) wasteload allocations for municipal wastewater treatment plants and industrial dischargers are all based on meeting a maximum monthly average concentration of 50 µg/L total phosphorus (see Table 3) and are shown in Table 5. These wasteload allocations, when combined with load allocations and Avista’s dissolved oxygen responsibility and the reductions assumed for the Idaho NPDES permits, will result in water quality standards being met in the Spokane River and Lake Spokane. The following factors and goals were considered in setting the wasteload allocations:
• The limited loading capacity of the river requires that point sources, nonpoint sources, and
Avista significantly reduce their impact on water quality impairments;
• Point source reductions should be equitably distributed among point sources, with a goal of establishing achievable reductions.
Wasteload allocations are based on modeling of seasonal average effluent pollutant concentrations for the critical period (March to October) and projected effluent flow rates for 2027. The seasonal average concentrations are less than 50 µg/L because effluent concentrations are not constant over time. Therefore, a discharger’s seasonal average concentration will be somewhat less than its maximum monthly average concentration. Modeling assumptions about future municipal effluent quality are consistent for all facilities, and variation in monitoring frequency is factored into the analysis. Statistics may be used in the NPDES permitting process to calculate maximum monthly and daily or weekly effluent limits that consider facility-specific effluent variability, are consistent with these seasonal average wasteload allocations, and comply with NPDES regulations. Effluent limits that implement wasteload allocations in NPDES permits need not be identical to the wasteload allocations in order to be consistent with the wasteload allocations (EPA Environmental Appeals Board, 10 E.A.D. 135, 2001). The long term average loads included in Table 5 were calculated using the following equation:
Equation 1. Wasteload allocations for point sources. 2027 Effluent Flow (MGD) × Seasonal Avg. Conc. in Table 5 (ppm) × 8.3454 lbs/gal
During the Spokane TMDL Collaboration, phosphorus concentrations were translated into pounds per day wasteload allocations based on discharge volume estimates. Ecology used the discharger-supplied flow estimates to calculate pounds per day wasteload allocations for ammonia and CBOD. Equation 1 is used to convert phosphorus, ammonia, and CBOD concentrations for each of the Dischargers into pounds per day wasteload allocations based on projected flows. The NPDES permits will require reporting of actual flows, not projected flows, to determine compliance with the wasteload allocations.
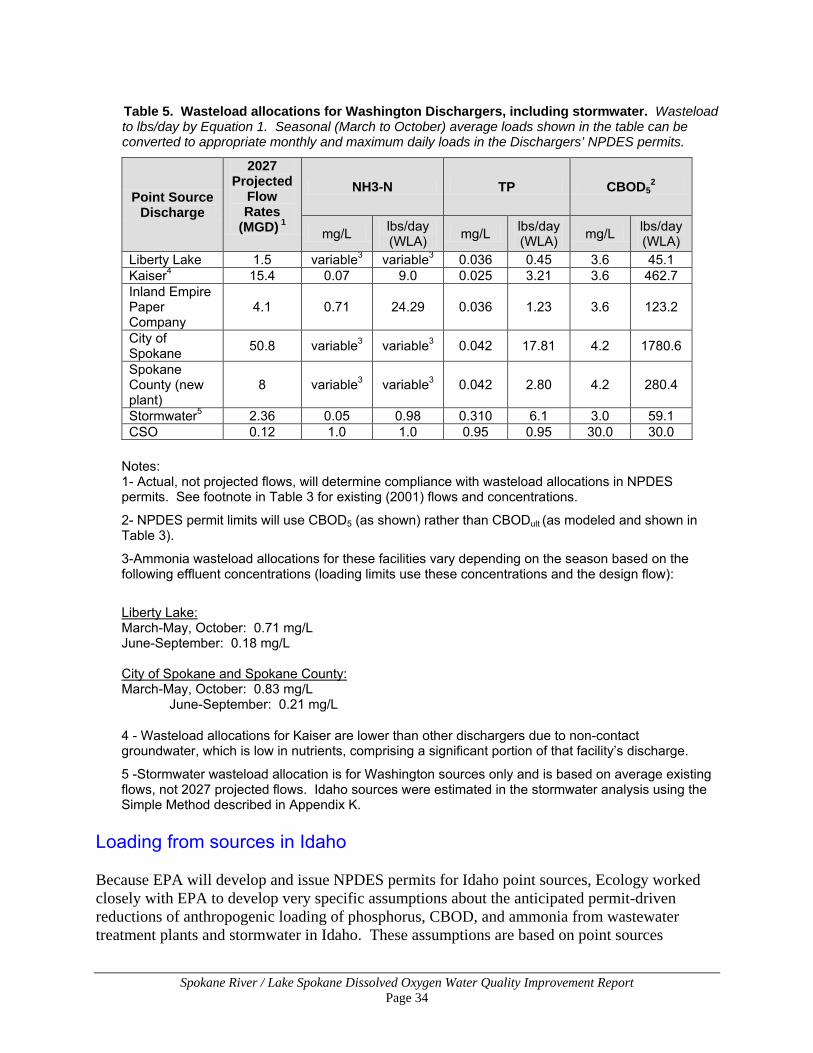
Spokane River / Lake Spokane Dissolved Oxygen Water Quality Improvement Report Page 34
Table 5. Wasteload allocations for Washington Dischargers, including stormwater. Wasteload to lbs/day by Equation 1. Seasonal (March to October) average loads shown in the table can be converted to appropriate monthly and maximum daily loads in the Dischargers’ NPDES permits.
Point Source Discharge
2027 Projected
Flow Rates
(MGD) 1
NH3-N TP CBOD52
mg/L lbs/day (WLA) mg/L lbs/day
(WLA) mg/L lbs/day (WLA)
Liberty Lake 1.5 variable3 variable3 0.036 0.45 3.6 45.1 Kaiser4 15.4 0.07 9.0 0.025 3.21 3.6 462.7 Inland Empire Paper Company
4.1 0.71 24.29 0.036 1.23 3.6 123.2
City of Spokane 50.8 variable3 variable3 0.042 17.81 4.2 1780.6
Spokane County (new plant)
8 variable3 variable3 0.042 2.80 4.2 280.4
Stormwater5 2.36 0.05 0.98 0.310 6.1 3.0 59.1 CSO 0.12 1.0 1.0 0.95 0.95 30.0 30.0
Notes: 1- Actual, not projected flows, will determine compliance with wasteload allocations in NPDES permits. See footnote in Table 3 for existing (2001) flows and concentrations.
2- NPDES permit limits will use CBOD5 (as shown) rather than CBODult (as modeled and shown in Table 3).
3-Ammonia wasteload allocations for these facilities vary depending on the season based on the following effluent concentrations (loading limits use these concentrations and the design flow):
Liberty Lake: March-May, October: 0.71 mg/L June-September: 0.18 mg/L City of Spokane and Spokane County: March-May, October: 0.83 mg/L
June-September: 0.21 mg/L
4 - Wasteload allocations for Kaiser are lower than other dischargers due to non-contact groundwater, which is low in nutrients, comprising a significant portion of that facility’s discharge.
5 -Stormwater wasteload allocation is for Washington sources only and is based on average existing flows, not 2027 projected flows. Idaho sources were estimated in the stormwater analysis using the Simple Method described in Appendix K.
Loading from sources in Idaho Because EPA will develop and issue NPDES permits for Idaho point sources, Ecology worked closely with EPA to develop very specific assumptions about the anticipated permit-driven reductions of anthropogenic loading of phosphorus, CBOD, and ammonia from wastewater treatment plants and stormwater in Idaho. These assumptions are based on point sources
Spokane River / Lake Spokane Dissolved Oxygen Water Quality Improvement Report Page 35
discharging equivalent pollutant concentrations at wastewater treatment plants in both states, and have been incorporated into the model scenarios supporting this TMDL (see the estimated permit limits in Table 2 of PSU 2009). All of the assumed anthropogenic loading of these pollutants in Idaho comes from point sources (wastewater treatment plants and stormwater). The total assumed anthropogenic loading of phosphorus, CBOD5 and ammonia from Idaho point sources are 7.2 lb/day, 497 lb/day, and 94.4 lb/day, respectively. These figures include 2.4 lb/day, 23 lb/day, and 0.4 lb/day of phosphorus, CBOD5, and ammonia, respectively, from stormwater. The assumptions for individual sources can be found in Table 2 of PSU 2009. The assumed Idaho point source loads (including stormwater) account for 18 percent of the phosphorus, 15 percent of the CBOD5, and 24 percent of the ammonia discharged by all of the point sources in both States (including stormwater and CSOs), under the wasteload allocations (see Table 5) and assumptions in this TMDL. The goal of this TMDL is to achieve water quality standards for dissolved oxygen. The dissolved oxygen depletion predicted to result from these assumed Idaho pollutant loads is shown in Tables 14 and 15 of PSU (2010) (the Idaho only source assessment scenario results). EPA will incorporate permit limits into the NPDES permits for Idaho point source dischargers that ensure that the total dissolved oxygen depletion resulting from those dischargers is no greater than that shown in Tables 14 and 15. Stormwater discharges Because stormwater can contain high levels of pollutants, communities discharging stormwater to the Spokane River that are regulated by the NPDES permits for Municipal Separate Stormwater Sewer Systems (MS4s) are receiving wasteload allocations for total phosphorus, CBOD and ammonia. The allocation is set to estimated current loadings. Reductions from current stormwater loadings are difficult to estimate due to a lack of data but will be better understood through implementation of Discharger Delta Elimination Plans (described in the Managed Implementation Plan section). The majority of the stormwater entering the Spokane River is discharged by the city of Spokane; significantly smaller volumes of stormwater are discharged by the city of Spokane Valley and Spokane County. Stormwater discharges from the cities of Spokane, Spokane Valley and Spokane County are regulated by the Eastern Washington Phase II Stormwater General Permit. A relatively small volume of stormwater is also discharged by Washington state highways, and is regulated by the Washington State Department of Transportation (WSDOT) Municipal Stormwater NPDES General Permit. For this TMDL, stormwater loads were determined through a combination of measured water quality data from city combined storm/sewer overflow (CSO) conveyances and an analytical process known as the Simple Method for separate stormwater conveyances. The Simple Method allows for estimating nutrient loads where there is a lack of measured data for variables such as flow and pollutant concentration. The stormwater analysis is provided in Appendix K. All point source stormwater dischargers are covered by a single numeric wasteload allocation. The areas covered by the four stormwater permits within the TMDL area: Spokane, Spokane County, Spokane Valley, and WSDOT, are contiguous. The municipal permits were issued recently (2007, revised 2009) and data specific to the individual permits has not been collected; it
Spokane River / Lake Spokane Dissolved Oxygen Water Quality Improvement Report Page 36
is not possible at this time to separate out the specific contribution for each. Although the wasteload allocation established is numeric, the effluent limits in the stormwater permits are anticipated to be expressed as best management practices (BMPs), consistent with EPA policy. Stormwater permit conditions consistent with this TMDL are described in the Managed Implementation Plan section.
Load allocations Load allocations are assigned to the mouths of the main Spokane River tributaries (Hangman Creek, Coulee Creek, and the Little Spokane River), and for groundwater inflow to the main stem of the Spokane River and groundwater and runoff in the watershed immediately adjacent to Lake Spokane (“Lake Watershed,” Table 6). Tributary load allocations The tributary load allocations are calculated by taking the nutrient loading above the natural load (human caused nonpoint source load) and applying the following percent reductions identified in Table 3 (see footnote number 6) to the human-caused (anthropogenic) nonpoint source load. Reduction percentages in the overall load are in parenthesis (see also Table 6). Hangman/Coulee:
• 20% (March – May; 11%) • 40% (June; 24%) • 50% (July – October; 29%) Little Spokane:
• 36% (March – May; 25%) • 36% (June; 28%) • 36% (July – October; 27%)
For the Hangman watershed, these percentage reductions are the outcome of applying the WARMF model to scenarios before and after full implementation of best management practices (BMPs) specified in the total suspended solids (TSS) section of the Hangman Creek water quality improvement report (TMDL) (Joy et al. 2009, see also Appendix M). The Little Spokane River reductions are based on considering existing land uses and extent of implementation of BMPs compared to similar watersheds. The Hangman Creek dissolved oxygen and pH TMDL remains under development and is expected to be complete in 2011. This TMDL may further differentiate the amount of nutrient loading in these tributaries that is naturally-occurring from that which is human-caused. Further refinement of expected seasonal load reductions is also expected. The detailed implementation plans expected from this TMDL will also outline BMPs needed to meet load reductions specified for Coulee Creek. These should be very similar to the BMPs specified in the Hangman Creek TMDL TSS section.
Spokane River / Lake Spokane Dissolved Oxygen Water Quality Improvement Report Page 37
Groundwater load allocation The Spokane River has areas of both inflows (ground water flowing in to the river) and outflows (river water loss to the ground water) that complicate the river flow hydrology (Cusimano 2004). In the 2009 draft TMDL, the basis for groundwater estimates for natural conditions was the lowest average value (6 µg/l) measured in area wells and reported by PSU in its original modeling report.
Recent improvements in phosphorus measurement techniques have lowered routine detection limits from previously reported 5-10 µg/L down to 1-2 µg/L. Reviewing recent Spokane County groundwater data has revealed several instances where results have been below the 6 µg/L value selected from historic data for the 2009 draft TMDL. This new data allows Ecology to fine tune the concentration of phosphorus in groundwater that is considered “background.” Ecology selected 13 wells from Spokane County’s network, far from the river channel, to minimize surface water impacts that returned phosphorus concentrations below the former value of 6 µg/L phosphorus. Using data from the second, third and fourth quarter of 2008, the frequency of reported concentrations of phosphorus were plotted. For the model input, Ecology used the median values. Median values are a more robust statistic than the arithmetic mean (average), meaning there is less sensitivity to censored (due to detection limits close to the actual value) or otherwise "questionable" values. In other words, using the median instead of the mean is a simple way to reduce the bias inherent in data sets that hover near the detection/quantification limit. From this review, the median total phosphorus concentration is changed from 6 to 4 µg/L (see Table 3). This revised value was used as an input in subsequent TMDL modeling in December 2009. Lake watershed load allocation Based on the specific concerns about the loadings from the lake watershed, Ecology has separated the allocated loads for the lake watershed from the other distributed inflows (i.e., groundwater upstream of the lake) in the final TMDL. Figure 4 (loading comparisons) and Table 6 (tributary and groundwater load allocations) have therefore been modified to include the Lake Spokane loading information (“Lake Watershed”). Delta management As mentioned in the Loading Capacity section, the loading capacity of Lake Spokane must be improved and upstream anthropogenic sources of nutrient pollution must be reduced for the dissolved oxygen water quality standard to be met in Lake Spokane. The total phosphorus nonpoint source load accounts for a large portion of the overall load, especially during the spring months. Load allocations will be met through the target pursuit actions taken by all responsible parties as described in the Managed Implementation Plan section. The dischargers and Avista can and will likely need to pursue actions to reduce nonpoint sources of pollution to the mainstem of the river and the tributaries, in order to reduce their “delta” and meet the wasteload allocation (Dischargers) and dissolved oxygen responsibility (Avista).
Spokane River / Lake Spokane Dissolved Oxygen Water Quality Improvement Report Page 38
The term “delta” refers to the difference between what technology can achieve, such as advanced wastewater treatment for phosphorus removal, and the final wasteload allocation, which must achieve compliance with water quality standards. For example, if wastewater effluent from the Liberty Lake Sewer and Water District averages 50 µg/L total phosphorus over the critical season, that discharger will need to reduce an average of 14 µg/L of phosphorus (or more correctly its mass equivalent) through target pursuit actions, described in the Managed Implementation Plan section, in order to meet the final wasteload allocation of 36 µg/L (see Wasteload Allocations section and Table 5).
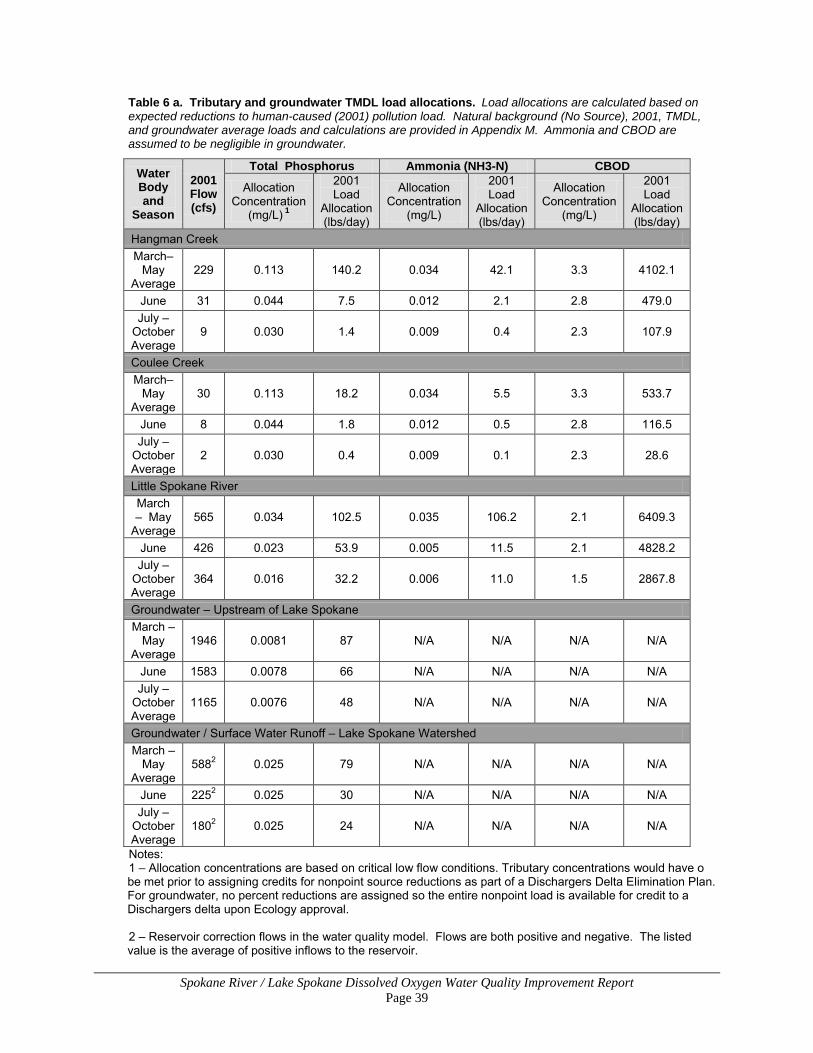
Spokane River / Lake Spokane Dissolved Oxygen Water Quality Improvement Report Page 39
Table 6 a. Tributary and groundwater TMDL load allocations. Load allocations are calculated based on expected reductions to human-caused (2001) pollution load. Natural background (No Source), 2001, TMDL, and groundwater average loads and calculations are provided in Appendix M. Ammonia and CBOD are assumed to be negligible in groundwater.
Water Body and
Season
2001 Flow (cfs)
Total Phosphorus Ammonia (NH3-N) CBOD
Allocation Concentration
(mg/L) 1
2001 Load
Allocation (lbs/day)
Allocation Concentration
(mg/L)
2001 Load
Allocation (lbs/day)
Allocation Concentration
(mg/L)
2001 Load
Allocation (lbs/day)
Hangman Creek March–
May Average
229 0.113 140.2 0.034 42.1 3.3 4102.1
June 31 0.044 7.5 0.012 2.1 2.8 479.0 July –
October Average
9 0.030 1.4 0.009 0.4 2.3 107.9
Coulee Creek March–
May Average
30 0.113 18.2 0.034 5.5 3.3 533.7
June 8 0.044 1.8 0.012 0.5 2.8 116.5 July –
October Average
2 0.030 0.4 0.009 0.1 2.3 28.6
Little Spokane River March – May
Average 565 0.034 102.5 0.035 106.2 2.1 6409.3
June 426 0.023 53.9 0.005 11.5 2.1 4828.2 July –
October Average
364 0.016 32.2 0.006 11.0 1.5 2867.8
Groundwater – Upstream of Lake Spokane March –
May Average
1946 0.0081 87 N/A N/A N/A N/A
June 1583 0.0078 66 N/A N/A N/A N/A July –
October Average
1165 0.0076 48 N/A N/A N/A N/A
Groundwater / Surface Water Runoff – Lake Spokane Watershed March –
May Average
5882 0.025 79 N/A N/A N/A N/A
June 2252 0.025 30 N/A N/A N/A N/A July –
October Average
1802 0.025 24 N/A N/A N/A N/A
Notes: 1 – Allocation concentrations are based on critical low flow conditions. Tributary concentrations would have o be met prior to assigning credits for nonpoint source reductions as part of a Dischargers Delta Elimination Plan. For groundwater, no percent reductions are assigned so the entire nonpoint load is available for credit to a Dischargers delta upon Ecology approval. 2 – Reservoir correction flows in the water quality model. Flows are both positive and negative. The listed value is the average of positive inflows to the reservoir.
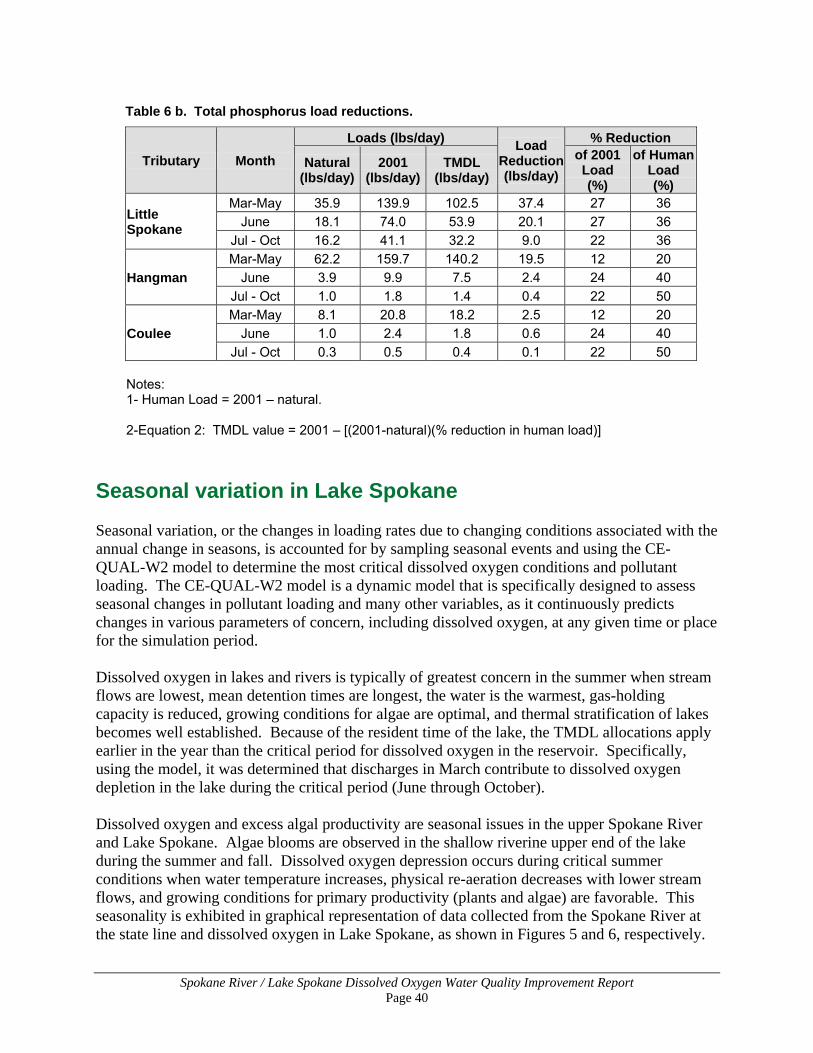
Spokane River / Lake Spokane Dissolved Oxygen Water Quality Improvement Report Page 40
Table 6 b. Total phosphorus load reductions.
Tributary Month
Loads (lbs/day) Load Reduction (lbs/day)
% Reduction
Natural (lbs/day)
2001 (lbs/day)
TMDL (lbs/day)
of 2001 Load (%)
of Human Load (%)
Little Spokane
Mar-May 35.9 139.9 102.5 37.4 27 36 June 18.1 74.0 53.9 20.1 27 36
Jul - Oct 16.2 41.1 32.2 9.0 22 36
Hangman Mar-May 62.2 159.7 140.2 19.5 12 20
June 3.9 9.9 7.5 2.4 24 40 Jul - Oct 1.0 1.8 1.4 0.4 22 50
Coulee Mar-May 8.1 20.8 18.2 2.5 12 20
June 1.0 2.4 1.8 0.6 24 40 Jul - Oct 0.3 0.5 0.4 0.1 22 50
Notes: 1- Human Load = 2001 – natural. 2-Equation 2: TMDL value = 2001 – [(2001-natural)(% reduction in human load)]
Seasonal variation in Lake Spokane Seasonal variation, or the changes in loading rates due to changing conditions associated with the annual change in seasons, is accounted for by sampling seasonal events and using the CE-QUAL-W2 model to determine the most critical dissolved oxygen conditions and pollutant loading. The CE-QUAL-W2 model is a dynamic model that is specifically designed to assess seasonal changes in pollutant loading and many other variables, as it continuously predicts changes in various parameters of concern, including dissolved oxygen, at any given time or place for the simulation period. Dissolved oxygen in lakes and rivers is typically of greatest concern in the summer when stream flows are lowest, mean detention times are longest, the water is the warmest, gas-holding capacity is reduced, growing conditions for algae are optimal, and thermal stratification of lakes becomes well established. Because of the resident time of the lake, the TMDL allocations apply earlier in the year than the critical period for dissolved oxygen in the reservoir. Specifically, using the model, it was determined that discharges in March contribute to dissolved oxygen depletion in the lake during the critical period (June through October). Dissolved oxygen and excess algal productivity are seasonal issues in the upper Spokane River and Lake Spokane. Algae blooms are observed in the shallow riverine upper end of the lake during the summer and fall. Dissolved oxygen depression occurs during critical summer conditions when water temperature increases, physical re-aeration decreases with lower stream flows, and growing conditions for primary productivity (plants and algae) are favorable. This seasonality is exhibited in graphical representation of data collected from the Spokane River at the state line and dissolved oxygen in Lake Spokane, as shown in Figures 5 and 6, respectively.
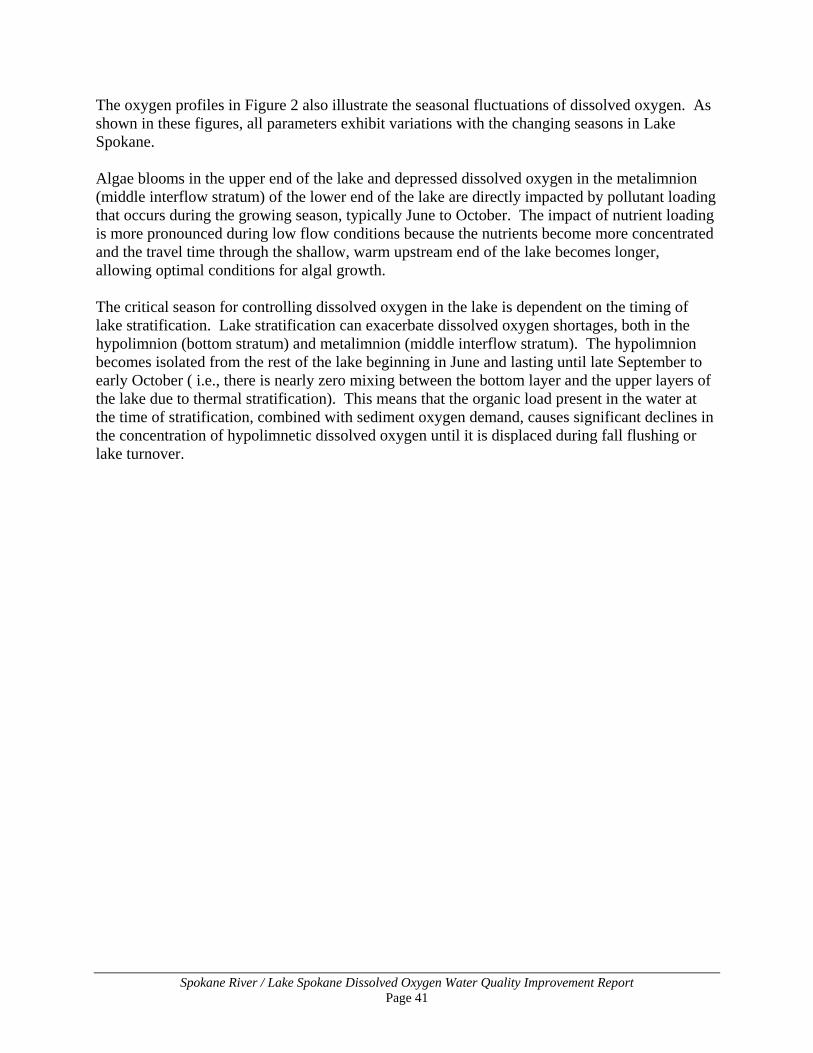
Spokane River / Lake Spokane Dissolved Oxygen Water Quality Improvement Report Page 41
The oxygen profiles in Figure 2 also illustrate the seasonal fluctuations of dissolved oxygen. As shown in these figures, all parameters exhibit variations with the changing seasons in Lake Spokane. Algae blooms in the upper end of the lake and depressed dissolved oxygen in the metalimnion (middle interflow stratum) of the lower end of the lake are directly impacted by pollutant loading that occurs during the growing season, typically June to October. The impact of nutrient loading is more pronounced during low flow conditions because the nutrients become more concentrated and the travel time through the shallow, warm upstream end of the lake becomes longer, allowing optimal conditions for algal growth. The critical season for controlling dissolved oxygen in the lake is dependent on the timing of lake stratification. Lake stratification can exacerbate dissolved oxygen shortages, both in the hypolimnion (bottom stratum) and metalimnion (middle interflow stratum). The hypolimnion becomes isolated from the rest of the lake beginning in June and lasting until late September to early October ( i.e., there is nearly zero mixing between the bottom layer and the upper layers of the lake due to thermal stratification). This means that the organic load present in the water at the time of stratification, combined with sediment oxygen demand, causes significant declines in the concentration of hypolimnetic dissolved oxygen until it is displaced during fall flushing or lake turnover.
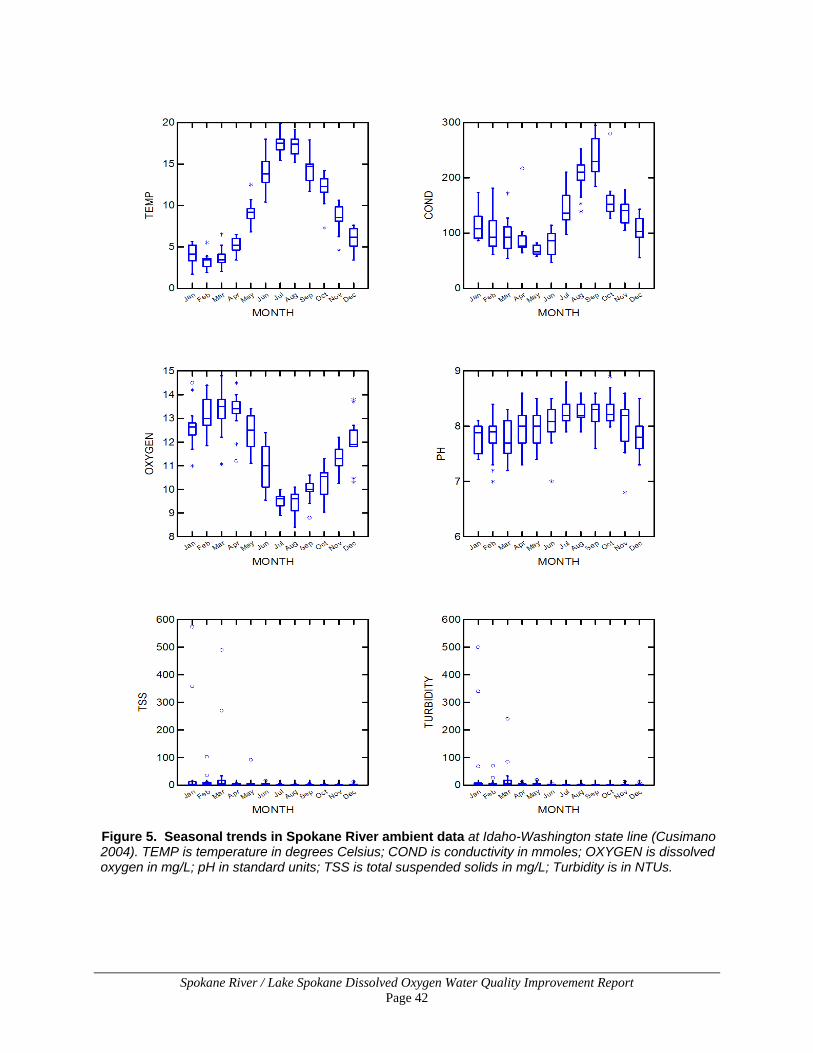
Spokane River / Lake Spokane Dissolved Oxygen Water Quality Improvement Report Page 42
Figure 5. Seasonal trends in Spokane River ambient data at Idaho-Washington state line (Cusimano 2004). TEMP is temperature in degrees Celsius; COND is conductivity in mmoles; OXYGEN is dissolved oxygen in mg/L; pH in standard units; TSS is total suspended solids in mg/L; Turbidity is in NTUs.
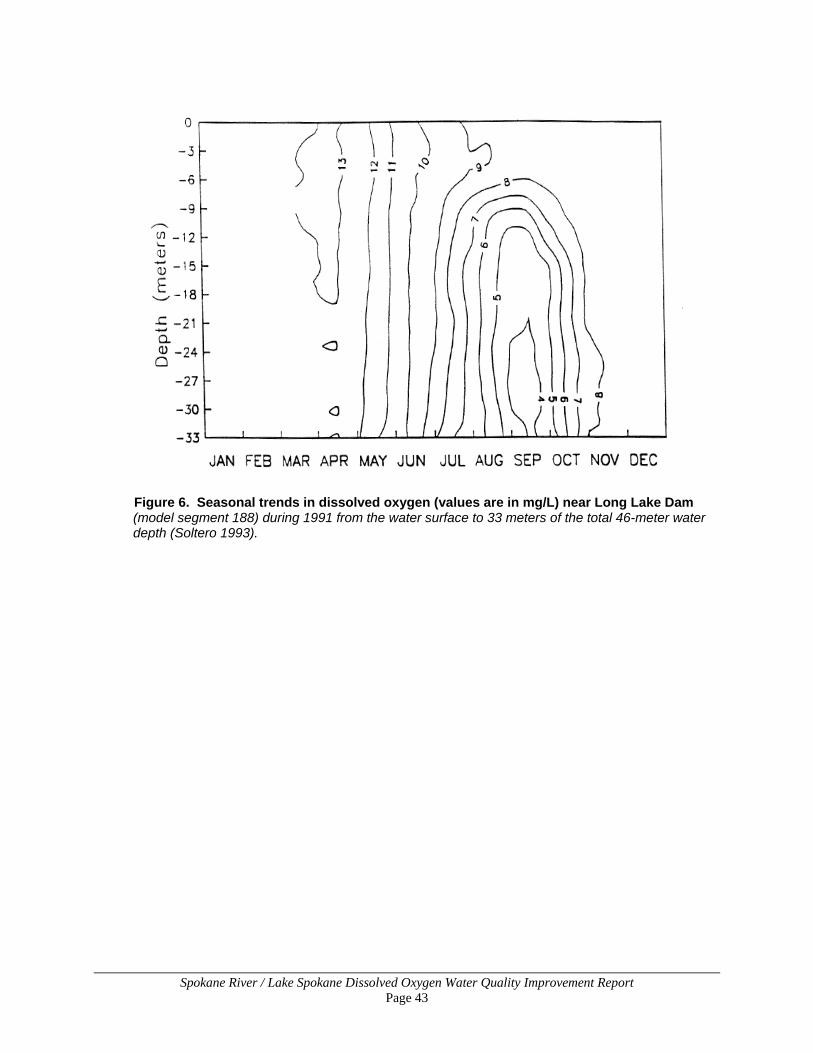
Spokane River / Lake Spokane Dissolved Oxygen Water Quality Improvement Report Page 43
Figure 6. Seasonal trends in dissolved oxygen (values are in mg/L) near Long Lake Dam (model segment 188) during 1991 from the water surface to 33 meters of the total 46-meter water depth (Soltero 1993).
Spokane River / Lake Spokane Dissolved Oxygen Water Quality Improvement Report Page 44
Avista’s Dissolved Oxygen Responsibility Under Washington Administrative Code 173-201A-510(5), operators of dams that cause or contribute to a violation of water quality standards are required to provide a detailed strategy for achieving compliance with state water quality standards. Ecology’s 401 Certification for Long Lake Dam, which has been incorporated into the 2009 FERC license for the dam, requires Avista to develop a detailed strategy for water quality improvement that includes identification and implementation of all reasonable improvements. However, the 401 Certification relies upon the TMDL to quantify the water quality improvements necessary for Avista to achieve in Lake Spokane. The Spokane River system, from the Idaho border to Long Lake Dam, can be characterized as containing both a riverine and a reservoir reach. The riverine reach is impaired by pollutants discharged into it and its tributaries from point and nonpoint sources. The reservoir reach is also impaired by pollutants from all upstream point and nonpoint sources. The dam (which does not discharge pollutants) contributes to the reservoir’s impairment by altering the hydrology of the river. One of the goals of this TMDL is to apportion responsibility for the impaired condition of Lake Spokane, and its remediation, between the dam and point and nonpoint sources of pollutants. The approach used to quantify the dam’s contribution to Lake Spokane’s low dissolved oxygen levels was to reduce the upstream anthropogenic loading of oxygen demanding pollution to levels that are typical of other nearby rivers and that represent minimal human impact. The EPA has assessed in-stream nutrient data throughout the United States, and has developed “ecoregional criteria,” which represent lake and riverine conditions minimally impacted by human activities. Using this approach to reduce upstream anthropogenic sources does not eliminate upstream anthropogenic sources of pollution (or lake-side nonpoint sources); rather, it reduces pollutants to a level that is typical of higher quality rivers in the same ecoregion. The water quality model was then used to determine the impairments that would occur in the lake if low ecoregional levels of phosphorus entered the lake. It is logical and reasonable to assume that impairments in Lake Spokane that result from these modeled loads are caused by the dam and are the responsibility of the dam operator, since the levels of pollutants entering the impoundment are unimpaired, and represent minimal human impact. This approach is referred to as the “riverine assessment” approach in the TMDL. Model segments 157 and 154 were considered as potential riverine assessment locations. Segment 157 is just downstream of the confluence of the Spokane River and the Little Spokane Tributary (LL5 monitoring location), while Segment 154 is located directly below Nine Mile Dam. Model simulations indicate that segment 157 is affected by elevated algal activity in the lake. Algal activity elevates phosphorus concentrations, and means that the water quality at this location is not representative of upstream water quality. Therefore, Segment 154 was chosen as the riverine assessment point. Located directly below Nine Mile Dam, segment 154 is not affected by Long Lake algal productivity; it is, however, located upstream of the Little Spokane River tributary. In order to evaluate the overall quality of the river inputs to the reservoir under
Spokane River / Lake Spokane Dissolved Oxygen Water Quality Improvement Report Page 45
proposed TMDL conditions, model predictions for segment 154 were averaged (flow-weighted) with the estimated inflow from the Little Spokane River. Based on assessment of water bodies in the same geographical area, 10 µg/L total phosphorus was selected as the riverine assessment point concentration. This benchmark does not establish new nutrient criteria in Lake Spokane, which would need to be adopted through formal rule-making procedures. This is a typical phosphorus value for any high quality river in this ecoregion, and it is EPA’s Clean Water Act Section 304(a) recommended criterion for total phosphorus in Ecoregion II (EPA 822-B-00-015, Table 2). The hydrologic model used to develop this TMDL indicates that the TMDL, when implemented, will reduce the upstream anthropogenic sources such that the average concentration of phosphorus entering Long Lake is approximately 10 µg/L during the critical season. The riverine assessment points is located in the upstream, riverine section of Lake Spokane; and while the dissolved oxygen standards are currently being met at this location (model segment 154), phosphorus levels are above natural background levels and the benchmark (See Figure 3). The elevated phosphorus levels at this location, and the dissolved oxygen-depleting impact of this phosphorus on the dissolved oxygen in the downstream reservoir, compels a reduction of phosphorus to approximately 10 µg/L entering the lake in the growing season in order to reasonably allocate responsibility for the dissolved oxygen depletion, and to meet the dissolved oxygen criterion in the reservoir by the end of the ten year compliance schedule. Description of model analysis The CE-QUAL-W2 model is used to provide estimates of the natural condition of dissolved oxygen in the reservoir (No Source scenario). The model is also used to quantify the dissolved oxygen improvements (i.e. reservoir loading capacity enhancements) necessary in order to achieve water quality standards (No Source minus 0.2 mg/L dissolved oxygen) when upstream sources are reduced. The model estimates the necessary assimilative capacity improvement for dissolved oxygen in the reservoir by dividing the 24-mile long reservoir into 31 segments (157-188). Each segment consists of a “stack” of vertical model cells that are 1 meter in depth (see Figure 7). The daily minimum dissolved oxygen level for each segment is estimated by calculating the volume-weighted average of dissolved oxygen for the vertical cells. The difference between the natural condition (No Source) and the TMDL condition (TMDL Scenario #1) is calculated for each segment in the reservoir (model segments 157-188) and is presented in Table 7. The top eight meters of the reservoir are not included in the vertical averaging because of amplified algal activity which increases daytime dissolved oxygen levels; these increases are not representative of the impairments that occur deeper in the reservoir when the excess algae have decomposed. Calculated dissolved oxygen values for the reservoir show dissolved oxygen impairments from June 17 through October 31. Dissolved oxygen concentrations under the TMDL scenario are above 9.5 mg/L from November 1 through December 31 when lake stratification breaks down. . Water quality standards exceedences increase with depth, and affect the largest part of the
Spokane River / Lake Spokane Dissolved Oxygen Water Quality Improvement Report Page 46
reservoir during August, when dissolved oxygen impacts beyond the water quality standard (i.e. greater than 0.2 mg/L difference) occur at all locations below model segment 164. The greatest dissolved oxygen difference is 1.2 mg/L, and occurs during the August 16-31 time period in the deep model segments closest to Long Lake Dam (see Table 7). When upstream point and nonpoint sources were reduced to the levels that have been assigned as wasteload and load allocations (or have been assumed in the modeling scenario for Idaho), the model indicates significant improvement in dissolved oxygen concentrations in the reservoir segments (see Figure 2). The phosphorus concentrations for the combined mainstem and Little Spokane inflows achieve the phosphorus benchmark (10 µg/L) in the critical summer season. There is a short period of time in the spring when phosphorus levels exceed the benchmark due to the influence of elevated tributary flows and phosphorus concentrations. Two other water quality parameters that can often signal impairment due to nutrients, pH and dissolved oxygen, comply with the water quality criteria throughout the spring and summer. These model results indicate that when the Spokane River enters the reservoir, pollutant concentrations meet water quality standards for pH and dissolved oxygen, and achieve the phosphorus benchmark during the critical season. It is therefore Avista’s responsibility to improve dissolved oxygen impairments that occur in the reservoir downstream of this location. Direct calculation of the dissolved oxygen improvements necessary to meet the water quality standards in Lake Spokane are provided in Table 7 and are calculated for each segment (vertical averaged dissolved oxygen) location within the reservoir (Figure 7). The water quality improvements required in Table 7 must occur in order to achieve water quality standards for dissolved oxygen in Lake Spokane, and will serve as the basis for evaluation of the adequacy of fReasonaAvista’s WQAP in meeting its responsibilities. Ecology expects the numbers in Table 7 may be further refined in the development of the WQAP if the identification and assessment of methods to improve dissolved oxygen indicate that the improvements required in Table 7 are not necessary to achieve water quality standards for dissolved oxygen in Lake Spokane. To achieve these water quality improvements, Avista can consider all necessary methods, such as technology or engineering improvements to the dam and reservoir, as well as methods to reduce nonpoint sources of nutrients to the system. The process for Avista to plan and achieve the water quality improvements determined necessary by this TMDL is outlined in the 401 Certification for the Spokane River Hydroelectric Project (May 11, 2009), and excerpted in the bullets that follow. Following approval of this TMDL by EPA, Ecology will amend Avista’s 401 Certification to require Avista to develop a WQAP that complies with the determinations of this TMDL. Avista is required to develop a WQAP within two years of the certification amendment. The dissolved oxygen WQAP will provide a detailed strategy to address Avista’s proportional level of responsibility, based on its contribution to the dissolved oxygen problem in Lake Spokane as determined in the DO TMDL.
The WQAP shall include, at a minimum, the following elements:
• Implementation plan – A plan to analyze, evaluate and implement reasonable and feasible measures to improve dissolved oxygen conditions in Lake Spokane, based on the DO TMDL.
Spokane River / Lake Spokane Dissolved Oxygen Water Quality Improvement Report Page 47
The Licensee’s [Avista’s] commitments shall be sufficient to address its proportional level of responsibility, based on its contribution to the dissolved oxygen problem in Lake Spokane. Any operational or structural change that conflicts with the other conditions of the certification requires prior approval by Ecology.
• Schedule – A compliance schedule for implementation that to the degree reasonable and feasible, is synchronized with the milestones and assessments of this TMDL and that does not exceed ten years (WAC 173-201A-510(5)).
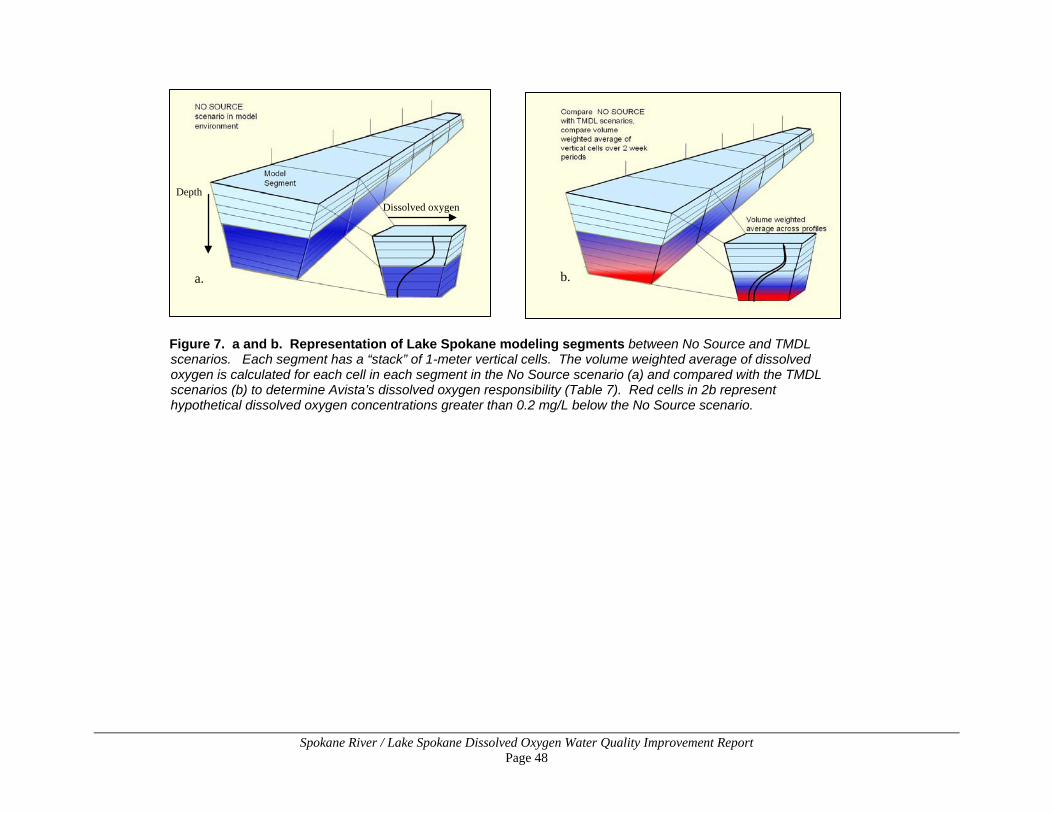
Spokane River / Lake Spokane Dissolved Oxygen Water Quality Improvement Report Page 48
Figure 7. a and b. Representation of Lake Spokane modeling segments between No Source and TMDL scenarios. Each segment has a “stack” of 1-meter vertical cells. The volume weighted average of dissolved oxygen is calculated for each cell in each segment in the No Source scenario (a) and compared with the TMDL scenarios (b) to determine Avista’s dissolved oxygen responsibility (Table 7). Red cells in 2b represent hypothetical dissolved oxygen concentrations greater than 0.2 mg/L below the No Source scenario.
Depth Dissolved oxygen
a. b.
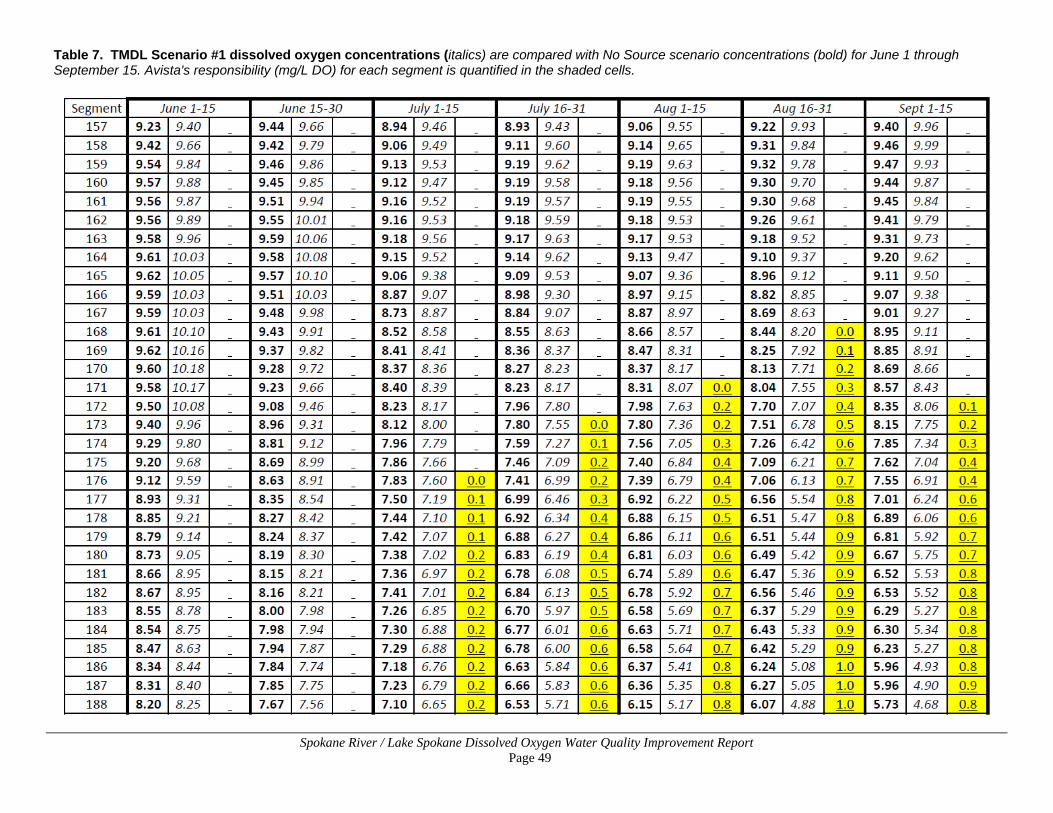
Spokane River / Lake Spokane Dissolved Oxygen Water Quality Improvement Report Page 49
Table 7. TMDL Scenario #1 dissolved oxygen concentrations (italics) are compared with No Source scenario concentrations (bold) for June 1 through September 15. Avista's responsibility (mg/L DO) for each segment is quantified in the shaded cells.
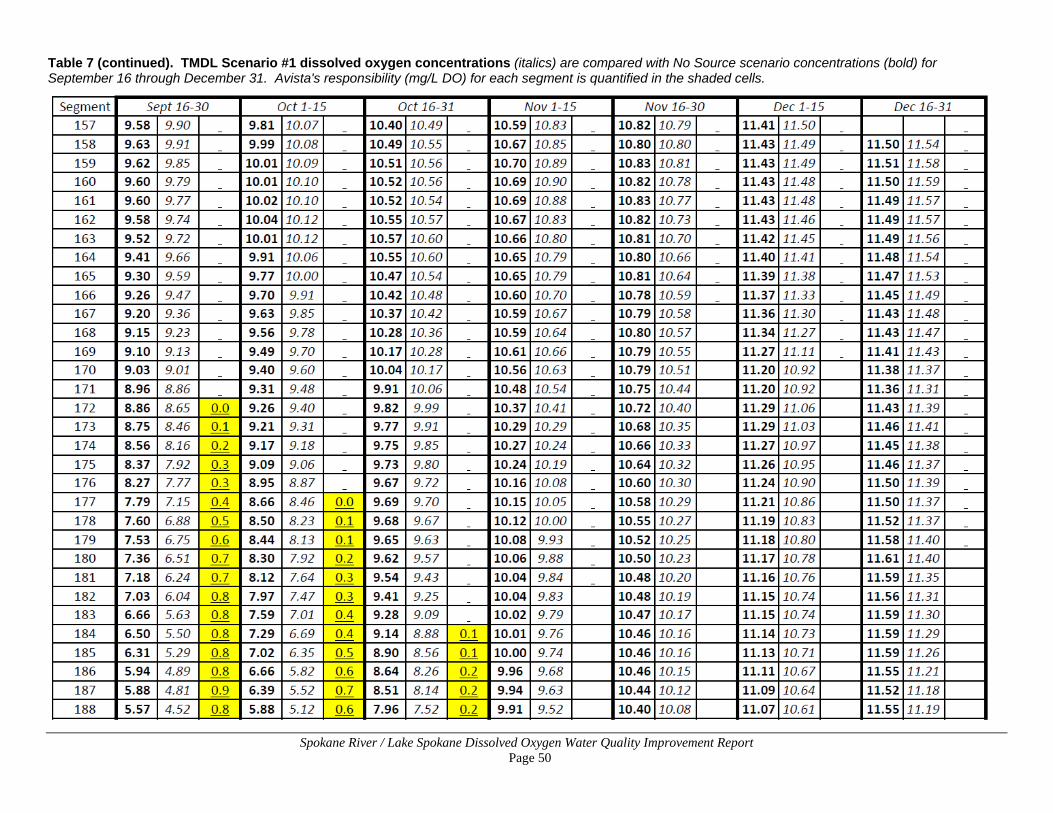
Spokane River / Lake Spokane Dissolved Oxygen Water Quality Improvement Report Page 50
Table 7 (continued). TMDL Scenario #1 dissolved oxygen concentrations (italics) are compared with No Source scenario concentrations (bold) for September 16 through December 31. Avista's responsibility (mg/L DO) for each segment is quantified in the shaded cells.
Spokane River / Lake Spokane Dissolved Oxygen Water Quality Improvement Report Page 51
Margin of Safety Federal regulations require that a TMDL include a margin of safety to account for any lack of knowledge concerning the relationship between loads and water quality. The following conservative assumptions comprise the implicit margin of safety for this TMDL: • Low flows (2001) were used as the baseline hydrologic condition.
• For each tributary, the headwater phosphorus concentration has been used as the “natural background” concentration at the mouth of the tributary, even though natural phosphorus concentrations may increase between the headwaters and the mouth.
• Stormwater flows from an “average” rainfall year have been assumed to occur during the 2001 low-flow year; similarly, groundwater flows have been assumed which are greater than those that would be expected to occur during a critical low flow year.
• All phosphorus is assumed to be bioavailable.
• The top eight meters of the reservoir are not included in the vertical averaging because of amplified algal activity which increases daytime dissolved oxygen levels.
• Conservative assumptions were used in assignment of a load allocation for groundwater and runoff directly entering Lake Spokane (“Lake Watershed”).
Spokane River / Lake Spokane Dissolved Oxygen Water Quality Improvement Report Page 52
This page is purposely left blank
Spokane River / Lake Spokane Dissolved Oxygen Water Quality Improvement Report Page 53
Reasonable Assurance When establishing a TMDL, reductions of a particular pollutant are allocated among the pollutant sources (both point and nonpoint sources) in the water body. For the Spokane River and Lake Spokane Dissolved Oxygen TMDL, both point and nonpoint sources exist. Somewhat unique to this TMDL, the effects on dissolved oxygen resulting from operation of Long Lake Dam have been accounted for in the modeling analysis through which a dissolved oxygen responsibility has been determined for Avista Utilities. Wasteload allocations assigned to point sources in the TMDL must be supported by “reasonable assurance” that anticipated reductions from nonpoint sources (and in this case, dissolved oxygen improvements assigned to Avista) will occur. A variety of considerations and commitments, including education, outreach, technical and financial assistance, permit administration, and enforcement all provide reasonable assurance that the allocations and reductions identified by this TMDL are met. Ecology believes that the following activities support this TMDL and provide reasonable assurance that dissolved oxygen in the Spokane River and Lake Spokane will meet conditions established by Washington State water quality standards. This assumes that the activities described below are continued and maintained. • The Memorandum of Agreement Regarding Foundational Concepts, Managed
Implementation Plan, and Dissolved Oxygen TMDL for the Spokane River (Foundational Concepts) was signed by officials of Spokane County; Liberty Lake Sewer and Water District; the city of Spokane; Kaiser Aluminum Fabricated Products, LLC; Inland Empire Paper Company; and Ecology. While parts of this agreement have been outdated by the new modeling approach, the fundamental target pursuit actions listed in the Foundational Concepts will largely remained unchanged and are commitments the organizations continually agree to complete.
• There is considerable interest and local involvement toward resolving the water quality problems in the greater Spokane River watershed. Numerous organizations, such as regional conservation districts and environmental groups and local agencies (county, city, etc) are engaged in stream restoration and source correction actions that will help resolve the dissolved oxygen problem. Reasonable assurance is provided by the dedication and commitment to address the diverse sources by these organizations.
• Pursuant to clean water act requirements, Ecology will reissue NPDES permits with new water quality based effluent limitations and compliance schedules to meet the waste load allocations of the TMDL. Point source dischargers have a variety of options, as legally allowed and appropriate, to meet NPDES effluent limitations by reducing phosphorus loadings: advanced treatment technologies, influent phosphorus reduction, or water quality offsets.
• As agreed to in the Foundational Concepts (see first bullet above), Washington point source dischargers will develop a Delta Elimination Plan detailing the process by which the updated effluent limitations will be met. The plan may include treatment technology selection, engineering reports, construction timetables, a list of actions to reduce influent phosphorus levels, and a list of off-site phosphorus reduction practices (including water conservation
Spokane River / Lake Spokane Dissolved Oxygen Water Quality Improvement Report Page 54
reuse projects) which may be used as a water quality offset pending Ecology approval. The dischargers agreed that delta-eliminating actions will begin as quickly as possible and will not be deferred until technology improvements are selected and installed.
• Dischargers that want to reduce phosphorus levels by implementing off-site actions that
increase the assimilative capacity of the river, but do not directly reduce influent, must pursue a water quality offset. Offsets must be developed in accordance with the water quality standards offset rule, WAC 173-201A-450. The offset rule requires that:
o A discharger’s proposed actions do not cause or contribute to a violation of the
requirements of the water quality standards.
o Actions result in a net environmental benefit.
o Actions target specific water quality parameters.
o The water quality improvements associated with creating the offset for any proposed actions must be demonstrated to have occurred in advance of the proposed action.
o Technical basis and methodology for the water quality offsets is documented through a
technical analysis of pollutant loading, and that analysis is reviewed by Ecology.
o Pollution controls must be secured using binding legal instruments between any involved parties for the life of the project that is being offset.
o The proponent remains solely responsible for ensuring the success of offsetting activities
for both compliance and enforcement purposes.
o Only the proportion of the pollution controls which occurs beyond existing requirements for those sources can be included in the offset allowance.
o Offsets must meet anti-degradation requirements.
• The publicly-owned NPDES permit holders, in cooperation with water purveyors, will develop individual household and regional water conservation programs. The programs’ goal will be to reduce indoor and outdoor water consumption by 10 to 20 percent. Spokane County already developed a conservation program.
• Spokane County developed a comprehensive program for reclaimed water production, re-use and aquifer recharge of effluent that will be produced from their new wastewater treatment facility (when it is constructed and permitted).
• As called for in the Foundational Concepts, a nonpoint source advisory committee was formed (in advance of an approved TMDL). This committee oversees a bi-state nonpoint source study. Funding ($246,000) for the study was initially provided by the United States Congress and was administered by EPA. Funding ($650,000) for later stages of this project has recently been provided by Ecology as appropriated by the Washington State Legislature. The study’s purposes are to:
Spokane River / Lake Spokane Dissolved Oxygen Water Quality Improvement Report Page 55
o Identify and quantify nonpoint sources into the mainstem Spokane River and Lake Spokane and major tributaries, including Hangman, Little Spokane River, and Coulee Creek.
o Identify best management practices (BMPs) to address nonpoint sources. o Evaluate the cost-effectiveness and longevity of the BMPs. o Prepare a BMP plan for reduction of phosphorus from nonpoint sources based on selected
BMPs, approved by Ecology.
Findings from this study will support the work of TMDL advisory committee members (dischargers, Avista and conservation groups) in the development of TMDL implementation plans, delta management plans and Avista’s WQAP.
• Spokane County has a septic tank elimination program that will help reduce the amount of phosphorus leached into the aquifer and surface water from septic tanks or drain fields. Spokane County estimates that over 3,400 active septic tanks are located above the Spokane Valley / Rathdrum Prairie aquifer with the potential to “breakthrough” with increased phosphorus loading to the aquifer and Spokane River (HDR 2007). The County estimates that total phosphorus loading may be reduced by up to 20 lbs/day when these septic tanks are removed upon construction of the new wastewater treatment plant.
• Ecology’s Environmental Assessment Program is conducting ambient monitoring at ten sites, from Lake Coeur d’Alene to the Long Lake Dam. Monitoring began in May 2007 and, pending available resources, will continue into the future. Samples are collected monthly for temperature, nutrients (nitrogen and phosphorus), total suspended solids, pH, conductivity, dissolved oxygen, total organic carbon and dissolved organic carbon. Samples for alkalinity, chloride, and other parameters may be added as resources allow. Data from this monitoring effort will be used to refine the model used in this TMDL.
• The city of Spokane conducted monitoring of Lake Spokane in 2007 and will continue with monitoring efforts (Hendron 2010). Their efforts align with Ecology’s ambient monitoring program.
• Ecology is working on TMDLs for two Spokane River tributaries: Hangman Creek and the Little Spokane River. These TMDLs focus on temperature, fecal coliform, and turbidity (close relationship between sediment and phosphorus). Nonpoint sources are primarily addressed in these TMDLs, one of which (Hangman) has recently been completed in 2009. The Little Spokane River TMDL is scheduled to be complete by 2010. According to Ecology’s technical lead on these projects, the schedule for achieving 75 to 100 percent of the implementation activities necessary to meet water quality standards for total suspended solids (11 to 26 percent reduction in total load) is estimated to take from 10 to 15 years, or by 2025 (Joy 2010). Therefore, the schedule for meeting the load allocations in Table 6 should be on roughly the same time frame as the wasteload allocations. Dissolved oxygen and pH problems in the Little Spokane River and Hangman Creek are currently being studied. Many of the nonpoint source implementation activities to address the existing TMDL efforts are also expected to address these water quality problems. These studies may further differentiate the amount of nutrient loading in these tributaries that is naturally-occurring from that which is human-caused. Further refinement of expected seasonal load reductions is also expected. The detailed implementation plans expected from this TMDL will outline BMPs to reduce nonpoint source pollution. Similar BMPs applied in Coulee Creek could
Spokane River / Lake Spokane Dissolved Oxygen Water Quality Improvement Report Page 56
help meet load reductions specified for that creek. These should be very similar to the BMPs specified in the Hangman Creek TMDL TSS section. See the Load Allocation section for more information on how estimated load reductions are derived. Some of the same entities involved with the Spokane River and Lake Spokane TMDL, namely the city of Spokane and Spokane County, will work to improve water quality in Hangman Creek and the Little Spokane River.
• The Idaho Department of Environmental Quality and the Coeur d’Alene Tribe have developed a revised Coeur d’Alene Lake Management Plan. Nutrient levels will be assessed, and source controls identified and implemented throughout the lake watershed under this plan.
• Continued monitoring and assessment (biennial and the ten-year assessment) helps support “reasonable assurance” in that it will determine whether the assumptions on sediment oxygen demand should be refined, and whether efforts to eliminate point and nonpoint sources of phosphorus are adequate to improve dissolved oxygen in Lake Spokane.
• A ban on dishwashing detergents containing more than 0.5% phosphorus by weight went into effect in July 2008 in Spokane County, eliminating a source of phosphorus to wastewater treatment plants. Preliminary results show less phosphorus entering treatment plants since the ban went in to effect.
• Shoreline Management Plans (SMPs) have recently been developed by the city of Spokane and Spokane County. These SMPs define BMPs within their jurisdictions for water quality improvements, which include most of Hangman Creek and the Little Spokane River. Upon approval by Ecology, these plans provide a potential means of city and county enforcement of water quality BMPs for nonpoint source pollution to meet the tributary load allocations. To integrate SMPs with the TMDL effort will require greater cooperation amongst the wastewater treatment and planning departments within the city and county. The design, construction and maintenance of on-site sewage systems is regulated by the Spokane County Regional Health District.
• Based upon this TMDL, Ecology will amend Avista’s 401 Certification to account for Avista’s dissolved oxygen responsibility. As a condition of its FERC license, Avista is required to identify and implement feasible measures necessary to meet its TMDL-identified responsibility to increase DO in the lake. Avista may employ several methods of pollutant reduction to meet the terms and conditions of the 401 Certification and satisfy the dissolved oxygen responsibility assigned in this TMDL. The preferred method of pollutant reduction is to reduce nonpoint source contributions to the reservoir by implementing BMPs and pollutant controls on lands that would otherwise directly contribute pollutants to the reservoir (see Managed Implementation Plan section). To satisfy the 401 Certification requirements, Avista must demonstrate that proposed nonpoint source reductions are:
o Implementing Ecology approved BMPs.
o Quantified using a technical and methodological basis that is reviewed and approved by Ecology.
o Solely the responsibility of Avista to ensure continued success of nonpoint source reductions.
Spokane River / Lake Spokane Dissolved Oxygen Water Quality Improvement Report Page 57
o Pollution controls must be secured using binding legal instruments between involved parties for the life of the impoundment.
o Providing actual reductions that comply with Avista’s dissolved oxygen responsibility.
While Ecology is authorized under Chapter 90.48 RCW to impose strict requirements or issue enforcement actions to achieve compliance with state water quality standards, it is the goal of all participants in the Spokane River and Lake Spokane TMDL process to achieve clean water through voluntary control actions.

Spokane River / Lake Spokane Dissolved Oxygen Water Quality Improvement Report Page 58
This page is purposely left blank
Spokane River / Lake Spokane Dissolved Oxygen Water Quality Improvement Report Page 59
Managed Implementation Plan
Introduction An implementation strategy is needed to meet the TMDL requirements as outlined in the 1997 Memorandum of Agreement between EPA and Ecology. This Managed Implementation Plan describes what will be done to improve water quality for the Washington State portion of the Spokane River from the Idaho state line to Long Lake Dam. It describes the roles and authorities of cleanup partners (that is, those organizations with jurisdiction, authority, or direct responsibility for cleanup) and the programs or other means through which they will address these water quality issues. This Managed Implementation Plan includes a:
• List of recommended actions to improve water quality, • Description of implementation activities already underway, • Strategy for monitoring progress and changes in water quality, • Summary of public involvement methods, and a • Description of potential funding sources to help implement the activities. After the EPA approves this TMDL, interested and responsible parties will work together to develop a detailed water quality implementation plan (WQIP). The plan will describe and prioritize specific actions planned to improve water quality and achieve water quality standards. Alternatively, the plans required by NPDES permits described under the “target pursuit actions” below and Avista’s WQAP may serve as the equivalent of a WQIP. This Managed Implementation Plan started from the work of the Spokane River TMDL Collaboration (Collaboration), which consisted of local governments; the state of Idaho; the Spokane Tribe of Indians; environmental groups; Avista Utilities; and organizations that discharge wastewater treatment plant effluent to the Spokane River (the dischargers). A list of Collaboration members is included in Appendix D. The Collaboration had several technical working groups that assessed wastewater flows, wastewater treatment technologies, water reuse and conservation, monitoring, and nonpoint source pollution. Each work group reported their findings to the full group to develop the Foundational Concepts for the Spokane River TMDL Managed Implementation Plan (Foundational Concepts). In past drafts of the TMDL, the Dischargers and Ecology agreed that the TMDL Managed Implementation Plan would be consistent with the principles described in the Foundational Concepts. The agreement was formalized through a Memorandum of Agreement Regarding Foundational Concepts, Managed Implementation Plan, and Dissolved Oxygen TMDL for the Spokane River (Foundational Concepts). The Foundational Concepts and Memorandum of Agreement are included in Appendix D. Documentation of the two-year collaborative effort is available at: http://www.ecy.wa.gov/programs/wq/tmdl/spokaneriver/dissolved_oxygen/historicalinfo-ross/historical_info-home.html.
Spokane River / Lake Spokane Dissolved Oxygen Water Quality Improvement Report Page 60
While the Foundational Concepts are now outdated due to the time elapsed since the 2007 and 2008 drafts and due to the new modeling approach used in this draft, Ecology intends to retain the most significant components of the Foundational Concepts, particularly the “target pursuit actions,” described in the What Needs to Be Done section that follows. Wasteload and load allocations are replaced with the values (adjusted for mass equivalents) in Table 5 based on the 2009 technical analysis described in the Technical Analysis section. Similarly, dates identified in the Foundational Concepts should be adjusted from the date of the TMDL’s approval. The strategies described in this section, originally described in the Foundational Concepts, are focused solely on reducing phosphorus; however, they can also apply to ammonia and CBOD reductions. For example, reductions in ammonia may be used to offset equivalent loads of phosphorus as a target pursuit action. Other items missing from the Foundational Concepts, such as Avista’s dissolved oxygen responsibility, groundwater and stormwater loading are included in the TMDL and this Managed Implementation Plan. As stated in the previous draft TMDL, to the extent that language in the Foundational Concepts document suggests, the ten-year compliance schedule in the dischargers NPDES permits would not include enforceable limits but instead would identify only targets or goals. Ecology is clarifying in this TMDL that the compliance schedules in NPDES permits will include enforceable effluent limits derived from the wasteload allocations in this TMDL. As described below, final wasteload allocations will be re-evaluated and possibly changed in subsequent permits based on new monitoring and modeling information collected for the biennial and ten-year assessments. Any changed wasteload allocations will be protective of water quality. Legislation was recently passed that directs Ecology to amend the water quality standards to allow more than ten years to comply with TMDL requirements under certain circumstances. The required amendment to the water quality standards is subject to EPA’s review and approval, and it is unclear whether or how amended water quality standards may apply to the dischargers’ NPDES permits, but this can be reassessed at the ten-year assessment.
What needs to be done? The goals of this Managed Implementation Plan are to reduce significant amounts of phosphorus in the Spokane River and improve the loading capacity in Lake Spokane during the March through October season to meet water quality standards. This Managed Implementation Plan focuses on strategies to reduce phosphorus because the strategies will usually result in reductions of CBOD and ammonia, which also are addressed by this TMDL.
Who needs to participate? The dischargers (made up of both privately- and publicly-owned wastewater treatment plants), Spokane County, and Ecology made commitments through the Foundational Concepts (Appendix D) to pursue activities to reduce phosphorus. Those commitments are listed in Table 9. Some aggressive programs to meet phosphorus targets may be conducted jointly by several Dischargers and Avista.
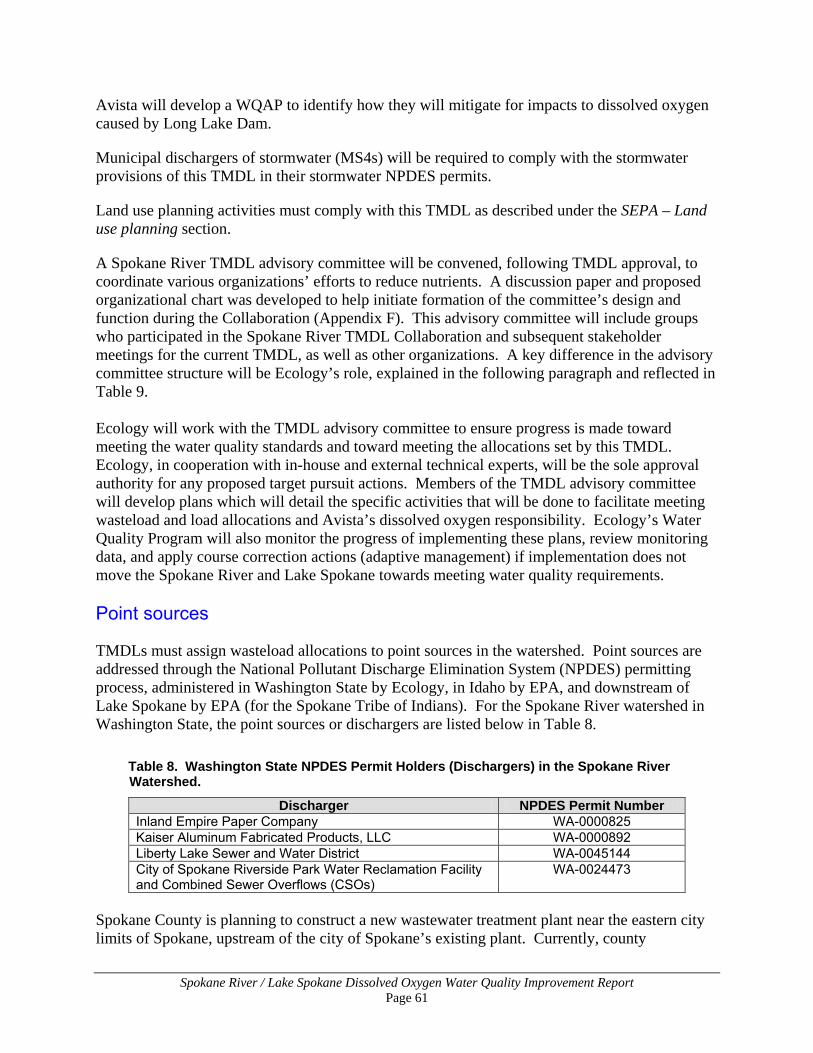
Spokane River / Lake Spokane Dissolved Oxygen Water Quality Improvement Report Page 61
Avista will develop a WQAP to identify how they will mitigate for impacts to dissolved oxygen caused by Long Lake Dam.
Municipal dischargers of stormwater (MS4s) will be required to comply with the stormwater provisions of this TMDL in their stormwater NPDES permits.
Land use planning activities must comply with this TMDL as described under the SEPA – Land use planning section.
A Spokane River TMDL advisory committee will be convened, following TMDL approval, to coordinate various organizations’ efforts to reduce nutrients. A discussion paper and proposed organizational chart was developed to help initiate formation of the committee’s design and function during the Collaboration (Appendix F). This advisory committee will include groups who participated in the Spokane River TMDL Collaboration and subsequent stakeholder meetings for the current TMDL, as well as other organizations. A key difference in the advisory committee structure will be Ecology’s role, explained in the following paragraph and reflected in Table 9. Ecology will work with the TMDL advisory committee to ensure progress is made toward meeting the water quality standards and toward meeting the allocations set by this TMDL. Ecology, in cooperation with in-house and external technical experts, will be the sole approval authority for any proposed target pursuit actions. Members of the TMDL advisory committee will develop plans which will detail the specific activities that will be done to facilitate meeting wasteload and load allocations and Avista’s dissolved oxygen responsibility. Ecology’s Water Quality Program will also monitor the progress of implementing these plans, review monitoring data, and apply course correction actions (adaptive management) if implementation does not move the Spokane River and Lake Spokane towards meeting water quality requirements. Point sources TMDLs must assign wasteload allocations to point sources in the watershed. Point sources are addressed through the National Pollutant Discharge Elimination System (NPDES) permitting process, administered in Washington State by Ecology, in Idaho by EPA, and downstream of Lake Spokane by EPA (for the Spokane Tribe of Indians). For the Spokane River watershed in Washington State, the point sources or dischargers are listed below in Table 8.
Table 8. Washington State NPDES Permit Holders (Dischargers) in the Spokane River Watershed.
Discharger NPDES Permit Number Inland Empire Paper Company WA-0000825 Kaiser Aluminum Fabricated Products, LLC WA-0000892 Liberty Lake Sewer and Water District WA-0045144 City of Spokane Riverside Park Water Reclamation Facility and Combined Sewer Overflows (CSOs)
WA-0024473
Spokane County is planning to construct a new wastewater treatment plant near the eastern city limits of Spokane, upstream of the city of Spokane’s existing plant. Currently, county
Spokane River / Lake Spokane Dissolved Oxygen Water Quality Improvement Report Page 62
wastewater is treated and discharged at the city’s plant. Compliance with the wasteload allocations for this new facility will be met through a combination of advanced treatment and target pursuit actions. At the time the plant begins normal, routine operations, it is expected to meet the final TMDL wasteload allocations.
Significant nutrient reductions are needed to improve dissolved oxygen levels in the Spokane River and Lake Spokane. One objective of this TMDL is to advance research and implementation of new treatment technologies to get wastewater effluent as clean as possible over the next ten years. Promising technologies capable of achieving phosphorus removals down to a seasonal average of 50 µg/L or lower are currently being piloted by the Dischargers as part of the Technology Selection Protocols. In addition, opportunities for other reductions in phosphorus are available through the target pursuit actions to meet the final wasteload allocations and, by extension, the final water quality based effluent limits. Phosphorus reductions will occur from a combination of installing the most effective phosphorus removal treatment to reduce point sources and from reducing nonpoint sources through target pursuit actions. Target pursuit actions are required or available steps dischargers can take to upgrade their technology and eliminate their delta. They are described below. Dischargers without a delta do not need to perform target pursuit actions; in other words, treatment technologies alone can meet the wasteload allocation. Target pursuit actions – Delta management Target pursuit actions are actions that dischargers with a delta will use to meet the TMDL wasteload allocations and eliminate their delta. As described earlier, the term “delta” refers to the difference between what technology improvements can currently achieve and the remaining phosphorus that needs to be reduced through conservation, reduction of nonpoint pollution, and other target pursuit actions to meet the final wasteload allocation. Delta reduction strategies methods include:
• Technology selection protocol: Dischargers will prepare, and submit to Ecology for
approval, a comprehensive technology selection protocol for choosing the most effective technology for removing phosphorus from their effluent, with an objective of achieving a discharge with monthly average mass equivalent of 50 µg/L phosphorus or lower. If pilot testing is a part of the protocol, there will be appropriate provisions for quality assurance and control. The protocol will include a preliminary schedule for construction of the treatment technology.
• Delta elimination plan: In addition to the technology selection protocol, Dischargers will also prepare and submit for Ecology’s approval a Delta Elimination Plan and schedule for other phosphorus removal actions such as conservation, effluent re-use, source control through support of regional phosphorus reduction efforts (such as limiting use of fertilizers and dishwasher detergents), and supporting regional nonpoint source control efforts to be established. The plan, in combination with the phosphorus reduction from technology, will provide reasonable assurance of meeting the permit holder’s wasteload allocation.
Spokane River / Lake Spokane Dissolved Oxygen Water Quality Improvement Report Page 63
• Expeditious decision: Ecology will expeditiously review and decide on the proposed technology selection protocol, preliminary construction schedule and delta elimination actions.
• Engineering report: Before a permit holder implements the technology selection protocol, the permit holder will prepare, and submit to Ecology for approval, an Engineering Report concerning the chosen technology, including any updates to the construction schedule. The Engineering Report will (if necessary) be accompanied by amendments to the schedule and substance of the target pursuit actions, so that in combination with the Engineering Report on expected technology performance there is reasonable assurance of meeting the wasteload allocation within ten years. Ecology will expeditiously review and decide on these submittals.
• Interim performance-based limits: When new treatment technology is installed, Ecology will set interim phosphorus permit limits based on the engineering reports. It is recognized that, because optimum operation of modern phosphorus removal technology is challenging, achieving normal and routine operation may require two years or more, assuming average seasonal conditions (temperature and flow) during both years. During this period, Ecology will recognize these conditions and their effects on compliance with interim discharge limits.
• Final technology-based limits: Limits will be set based on the actual performance of the technology installed and operated at optimum reliable efficiency.
• Final water quality-based effluent limits: Compliance with these limits will be determined by the effluent data combined with any approved offsets from the Delta Elimination Plan.
• Investment stability: Ecology recognizes that the investment in phosphorus removal technology has a 20-year life. Following the installation of the most effective technology for removing phosphorus, Ecology will not require significant modifications or replacements of phosphorus removal facilities for 20 years, except in cases where the best available data indicate that modifications to installed technology would enhance phosphorus removal performance and are efficient and cost-effective (Chapter 90.48.010 RCW).
• Conservation: Municipal NPDES permit holders, in cooperation with water purveyors, will as soon as possible develop individual and regional programs that reduce flows by funding indoor conservation efforts that target 20 percent water conservation per household in older urban areas, and ten percent water conservation per household in newer (post 1992) urban areas. These programs will have local ordinances, avoided cost investment principles and per connection expenditures.
• Class A effluent: Each publicly-owned treatment plant covered by this TMDL will, through their technology updates, produce effluent meeting the state of Washington Class A reclaimed water quality standards in place when this TMDL is approved by EPA. Class A effluent is highly treated and is the highest quality standard for reclaimed water that can be applied to land and not pose a risk to public health, surface water and groundwater quality.
Spokane River / Lake Spokane Dissolved Oxygen Water Quality Improvement Report Page 64
The dischargers may choose to take one or several of the following additional target pursuit actions to help meet the TMDL wasteload allocations. To the extent these actions are demonstrated as reducing phosphorus loading to the tributaries and river and follow the water quality offset language in the 2006 water quality standards, they will be recognized as contributing toward achieving phosphorus wasteload allocations as determined by Ecology. The additional pursuit actions are: • Reclaimed water: Publicly-owned dischargers may seek to re-use the Class A (highly
treated) reclaimed water they produce as a result of technology improvements. All reasonable efforts to re-use and/or recharge the aquifer, rather than directly discharging it to the river, particularly in the April-October timeframe, are strongly encouraged consistent with circumstances and opportunities.
• Regional phosphorus reduction programs: Privately-owned treatment plants may participate with other publicly-owned NPDES permit holders in regional phosphorus reduction programs, such as conservation and nonpoint source control.
• Bio-available phosphorus: NPDES permit holders may seek to prove to Ecology that a certain stable fraction of their phosphorus discharge is not bio-available in the river environment for a time sufficient to consider it not bio-available and not a nutrient source. If Ecology agrees, the pounds of phosphorus that are not bio-available will be recognized as contributing toward achieving the total phosphorus wasteload allocation. Ecology is currently funding half of this research effort with the remaining costs provided by most of the dischargers.
• Source control programs: Source control actions to limit phosphorus inputs through regulation of phosphorus-containing products and through enforced phosphorus-limiting pre-treatment ordinances and associated monitoring programs in the sewer and at the publicly operated wastewater treatment plants may be used to reduce phosphorus loading to the river.
• Stormwater phosphorus control: Source control actions to limit phosphorus inputs through elimination of phosphorus in stormwater for regulated stormwater permittees (MS4s). This TMDL requires conditions on MS4s that discharge to the Spokane River described in the proceeding section. Actions that should be considered for a Delta Elimination Plan may include CSO elimination, BMP installation, and changes in management practices (maintenance, de-icing, etc.). With the exception of CSOs, stormwater requirements of this TMDL will be implemented through the NPDES Phase II permits for regulated MS4s and not the NPDES permits for wastewater discharge.
Stormwater discharges – cities of Spokane and Spokane Valley, Spokane County and the Washington State Department of Transportation (WSDOT) There are many small direct and indirect discharges to the Spokane River that may result from rainfall and snowmelt events. Wasteload allocations have been established as shown in Table 5 and described in the Load and Wasteload Allocations section. The technical analysis for the stormwater wasteload allocation is provided in Appendix K. Ecology will regulate the point
Spokane River / Lake Spokane Dissolved Oxygen Water Quality Improvement Report Page 65
source stormwater discharges through the Construction, Municipal, Industrial, and the WSDOT Stormwater Permits. These permits establish the primary activities and best management practices (BMPs) needed to control pollution from stormwater. The Eastern Washington Phase II Municipal Stormwater General Permit covering the cities and the county will expire in 2012. The other permits are on separate five-year cycles. Municipalities covered by the Eastern Washington Phase II Municipal Stormwater General Permit (MS4s) that discharge to the Spokane River include the cities of Spokane and Spokane Valley and Spokane County. The Washington State Department of Transportation (WSDOT) will operate under a similar but separate stormwater discharge permit. Typically, significant discharges from the stormwater management systems these permit holders own or operate will not occur during the critical period, and none did during TMDL monitoring in 2001. This TMDL calls for a range of actions designed to control nutrients from stormwater entering the Spokane River and Lake Spokane. The Phase II and WSDOT municipal permits already require the implementation of the following stormwater management elements, including:
• Public education and outreach.
• Public involvement and participation.
• Illicit discharge detection and elimination.
• Construction site stormwater runoff control.
• Post-construction stormwater management.
• Pollution prevention and good housekeeping for municipal operations.
• Requirements based on approved TMDLs (described below).
• Evaluations of program compliance. Many pollutants in stormwater can be controlled through BMPs. The Eastern Washington Stormwater Manual recommends various BMPs to address specific pollutants. As a result of this TMDL, the MS4s must implement the following additional actions to address nutrient pollution:
• Inventory stormwater outfalls to determine which outfalls have the greatest impacts directly to the Spokane River and Lake Spokane. Specific inventory criteria will be developed based on the current understanding of nutrient loading to the Spokane River and Lake Spokane.
• Monitor phosphorus, ammonia, and CBOD in stormwater to better characterize pollutant loads coming from stormwater outfalls. The CSO annual report should be modified to include tracking of total phosphorus discharged during events and compared to a baseline to evaluate success of reductions. Ecology recommends that the Cochrane CSO basin, responsible for a significant portion of the city’s stormwater load, have a flow gauge installed to gather more accurate data to refine the loading calculation in Appendix K.
• Prepare a Quality Assurance Project Plan (QAPP) that describes all stormwater monitoring for Ecology approval.
Spokane River / Lake Spokane Dissolved Oxygen Water Quality Improvement Report Page 66
• Capture storm events in the monitoring effort.
• Monitoring results will be compared to the stormwater wasteload allocation established in this TMDL (Table 5), and if the results exceed the allocations, appropriate BMPs will be put into place to protect water quality.
• Monitoring results will also be compared to any target phosphorus reductions established in phosphorus management plans developed for the tributary watersheds. If the results exceed the necessary reductions, appropriate BMPs will be put into place to protect water quality.
• Target education programs to reach developers, businesses, and residents to limit pollution to stormwater systems.
• Stormwater activities must also occur in the tributary watersheds of Hangman Creek and Little Spokane Watersheds. These requirements address related but separate parameters (turbidity, temperature, etc) and are defined in the approved TMDL for Hangman Creek and will be identified in the TMDL under development for the Little Spokane River.
To implement the stormwater regulations, Ecology uses a narrative BMP approach in stormwater permits rather than numeric effluent limitations. The permit and the stormwater manual define the level of effort required for each of the requirements as part of the permit development and issuance process. It bases requirements on recognized practices from existing programs, uses compliance schedules where appropriate, focuses efforts on development of local programs that protect existing water quality rather than restoring degraded areas (except where mandated by TMDLs), and requires each permit holder to evaluate the effectiveness of the entity’s Stormwater Management Program (SWMP). Future stormwater permits for the cities of Spokane and Spokane Valley will include the conditions listed above. As dischargers of both municipal wastewater and stormwater, the city of Spokane and Spokane County may benefit from the actions previously described in reducing their delta. Once the NPDES municipal permit activities are fully implemented and their effectiveness has been evaluated, Ecology may need to consider additional activities to address pollutants from stormwater sources to meet wasteload allocations and the terms and conditions of the municipal stormwater permits. This consideration will be part of the biennial and ten-year assessments. The Washington State Department of Transportation will implement its stormwater management program and Highway Runoff Manual throughout Washington State, but focus implementation in the Phase II areas of Eastern Washington. WSDOT actions will include water quality monitoring and field investigations of illicit discharges into its conveyances. WSDOT shall report the findings of its investigations and the actions taken to implement its SWMP in an annual NPDES stormwater report. Nonpoint sources TMDLs must also assign load allocations for nonpoint source pollutant loads in the watershed. For this TMDL, load allocations are assigned to the major tributaries (Hangman and Coulee Creeks and Little Spokane River) and to groundwater discharging to the Spokane River (Table 6). Dischargers may participate in actions to reduce phosphorus from any nonpoint sources to
Spokane River / Lake Spokane Dissolved Oxygen Water Quality Improvement Report Page 67
the tributaries or mainstem, provided that those actions meet the requirements of the water quality standards offset rule and are approved by Ecology, or directly reduce the pollutant load of the permittees’ influent. Water quality offsets for nonpoint source reductions may be awarded when the following conditions are satisfied:
1. An offset may only be awarded for actions above and beyond landowners existing requirements to manage land in a manner that does not violate RCW 90.48.
2. Offsets for tributary load reductions will not be granted until the load allocations in Table 6 have been met as determined through data collected for the biennial and ten-year assessments.
The Foundational Concepts provide some examples of potential actions that may reduce nonpoint sources of phosphorus, and may provide a phosphorus influent reduction or serve as a water quality offset: • Regional Nonpoint Source Reduction Program: The program was initiated by Spokane
County with an initial funding by EPA and more recent funding ($650,000) by the State Legislature. The regional nonpoint source program will identify opportunities to achieve the nonpoint source phosphorus reductions identified in the TMDL and to contribute to the delta reduction efforts of the Dischargers, Avista, and other participants as necessary. The program will be closely managed by Ecology and the Spokane River TMDL advisory committee (when formed) and will be routinely monitored to identify cost-effective strategies and verify actual phosphorus reductions. Resources could be shifted to other more effective actions for phosphorus reduction by mutual agreement with Ecology. Successful phosphorus-reducing actions funded by the NPDES permit holders through this nonpoint source reduction program may be recognized as contributing toward achieving Dischargers’ phosphorus wasteload allocations, provided that actions either reduce pollutants in the influent or meet the criteria of the offset rule and are approved by Ecology.
The study to determine opportunities for nonpoint phosphorus reductions is a cornerstone of the Nonpoint Source Reduction Program. This study is being conducted in three phases to identify and quantify nonpoint sources of phosphorus in the Spokane River and Lake Spokane, identify effective, efficient, and economically viable best management practices (BMPs), and develop an implementation plan for nonpoint source reductions. Currently, Phase I, funded by EPA, is complete. Subsequent phases have recently received funding from Ecology and are scheduled to be completed by early 2011.
Phosphorus reduction opportunities include controlling sediment and nutrients from agricultural fields, lawns, livestock, stormwater, roads, and septic systems. Reducing or eliminating phosphorus content in lawn care products and dishwashing detergents will also help to lower phosphorus levels. Nonpoint source reductions need to take place in the Spokane River, tributary watersheds (corresponding to the Load Allocations in Table 6), and along Lake Spokane.
• Septic Tank Elimination Program: An estimated 14,000 active septic tanks are located over
the Spokane Valley / Rathdrum Prairie Aquifer (Spokane County Water Resources Dept. -
Spokane River / Lake Spokane Dissolved Oxygen Water Quality Improvement Report Page 68
GIS 2005). In 2005, 7,914 were located in the County’s sewer service area over the aquifer. Of those 7,914, 18.5 percent were calculated to have lost phosphorus to the aquifer or achieved “breakthrough” by exceeding the soil loading capacity. Spokane County has a septic tank elimination program that will help reduce the amount of phosphorus leached into the aquifer and surface water from septic tanks or drain fields. According to the county’s six-year capital improvement, sewer service should be available to all remaining portions of the county’s sewer service area by the end of 2011. County ordinance allows one year to connect to the sewer system. In 2005, Spokane County estimated that about 3,400 active septic tanks located above the Spokane Valley / Rathdrum Prairie aquifer had the potential for “breakthrough” with increased phosphorus loading to the aquifer (HDR 2007). The county estimates that total phosphorus loading may be reduced by between 12.2 lbs/day and 20 lbs/day when these septic tanks are removed upon completion of the Septic Tank Elimination Program. Spokane County submitted information and calculations demonstrating the phosphorus removal impact on the Spokane River and Lake Spokane of its Septic Tank Elimination Program to Ecology. Ecology conditionally approved this program. Pending approval of the TMDL by EPA and final approval of the proponents offset actions by Ecology, the County may use the pounds of phosphorus prevented from reaching the river and Lake Spokane through septic tank elimination as part of an offset for the county’s new treatment plant. Similarly, any of the dischargers can pursue opportunities to demonstrate positive phosphorus removal impacts from eliminating septic tanks or other sources of nonpoint source pollution to groundwater as a water quality offset provided the actions are approved by Ecology, and meet the criteria of the offset rule.
Stakeholders in the Spokane River watershed expressed interest in exploring the suitability of water quality trading to meet the needed phosphorus reduction required to restore dissolved oxygen levels. A trading program of the dischargers’ demonstrated surplus of removed phosphorus may be implemented, consistent with EPA guidelines and Washington’s water quality standards, pending Ecology’s approval. If Ecology determines that trading is possible, Ecology would develop a trading program with input from the TMDL advisory committee following TMDL approval.
Spokane River / Lake Spokane Dissolved Oxygen Water Quality Improvement Report Page 69
Avista / Long Lake Dam Based upon this TMDL, Ecology will amend Avista’s 401 Certification to require Avista to address its dissolved oxygen responsibility. Avista’s responsibility is to counteract the impacts of the impoundment on dissolved oxygen levels. Therefore, Avista may either increase the loading capacity of the reservoir by altering dam operations or implementing nonpoint source phosphorus reductions. These efforts must occur in addition to, and are independent of, the responsibilities assigned through the TMDL’s wasteload allocations and load allocations. Calculated dissolved oxygen values for the reservoir show dissolved oxygen impairments from June 17 through October 31. Water quality violations increase with depth and affect the largest part of the reservoir during August, when dissolved oxygen impacts beyond the water quality standard (i.e. greater than 0.2 mg/L difference) occur at all locations below model segment 164. The greatest dissolved oxygen difference is 1.2 mg/L, and occurs during the August 16-31 time period in the deep model segments closest to Long Lake Dam (see Table 7). The process for Avista to plan and achieve the water quality improvements required by this TMDL is outlined in the 401 Certification for the Spokane River Hydroelectric Project (May 11, 2009), and summarized here. Following approval of this TMDL by EPA, the 401 Certification will be amended to include the requirements of this TMDL. Avista is required to develop a Water Quality Attainment Plan (WQAP) within two years of the certification amendment. The dissolved oxygen section of the WQAP will provide a detailed strategy to address Avista’s proportional level of responsibility for dissolved oxygen, based on its contribution as described earlier in this section. The WQAP shall include, at a minimum, the following elements: • Detailed strategy to address Avista’s proportional level of responsibility, based on the
dissolved oxygen problems caused by Long Lake Dam in Lake Spokane, as determined in the TMDL.
• Implementation plan – A plan to analyze, evaluate and implement reasonable and feasible
measures to improve dissolved oxygen conditions in Lake Spokane, based on this TMDL. Avista’s commitments shall be sufficient to address its proportional level of responsibility, based on the dissolved oxygen problems caused by Long Lake Dam in Lake Spokane. Any operational or structural change that conflicts with the other conditions of the certification requires prior approval by Ecology.
• Schedule – A compliance schedule for implementation that to the degree reasonable and feasible, is synchronized with the milestones and assessments of this TMDL and does not exceed ten years (WAC 173-201A-510(5)).
Ecology expects the numbers in Table 7 will be further refined in the development of the WQAP when methods to improve dissolved oxygen are identified and further assessed. Avista may employ several methods of pollutant reduction to meet the terms and conditions of the 401 Certification and satisfy the dissolved oxygen responsibility assigned in this TMDL. The preferred method of pollutant reduction is to reduce nonpoint source contributions to the
Spokane River / Lake Spokane Dissolved Oxygen Water Quality Improvement Report Page 70
reservoir by implementing BMPs and pollutant controls on lands that would otherwise directly contribute pollutants to the reservoir. To satisfy the 401 Certification requirements, Avista must demonstrate that proposed nonpoint source reductions are:
• Implementing Ecology approved BMPs.
• Quantified using a technical and methodological basis that is reviewed and approved by Ecology.
• Solely the responsibility of Avista to ensure continued success of nonpoint source reductions.
• Pollution controls must be secured using binding legal instruments between involved parties for the life of the impoundment.
• Providing actual reductions that comply with Avista’s dissolved oxygen responsibility. SEPA – Land use planning Land use planning activities must consider TMDLs during State Environmental Policy Act (SEPA) and other local land use planning reviews. If the land use action under review is known to potentially impact dissolved oxygen as addressed by this TMDL, then the project may have a significant adverse environmental impact. SEPA lead agencies and reviewers are required to look at potentially significant environmental impacts and alternatives and to document that the necessary environmental analyses have been made. Land use planners and project managers should consider findings and actions in this TMDL to help prevent new land uses from violating water quality standards. Ecology recently published a focus sheet on how TMDLs play a role in SEPA impact analysis, threshold determinations, and mitigation (http://www.ecy.wa.gov/biblio/0806008.html). Additionally, the TMDL should be considered in the issuance of land use permits by local authorities. Shoreline Master Plans have recently been developed for the city of Spokane and Spokane County. These plans provide a potential means of city and county enforcement in the tributary watersheds to implement best management practices towards meeting the load allocations in Table 6. This will require closer cooperation and participation by the planning units in the city and county in to the TMDL process.
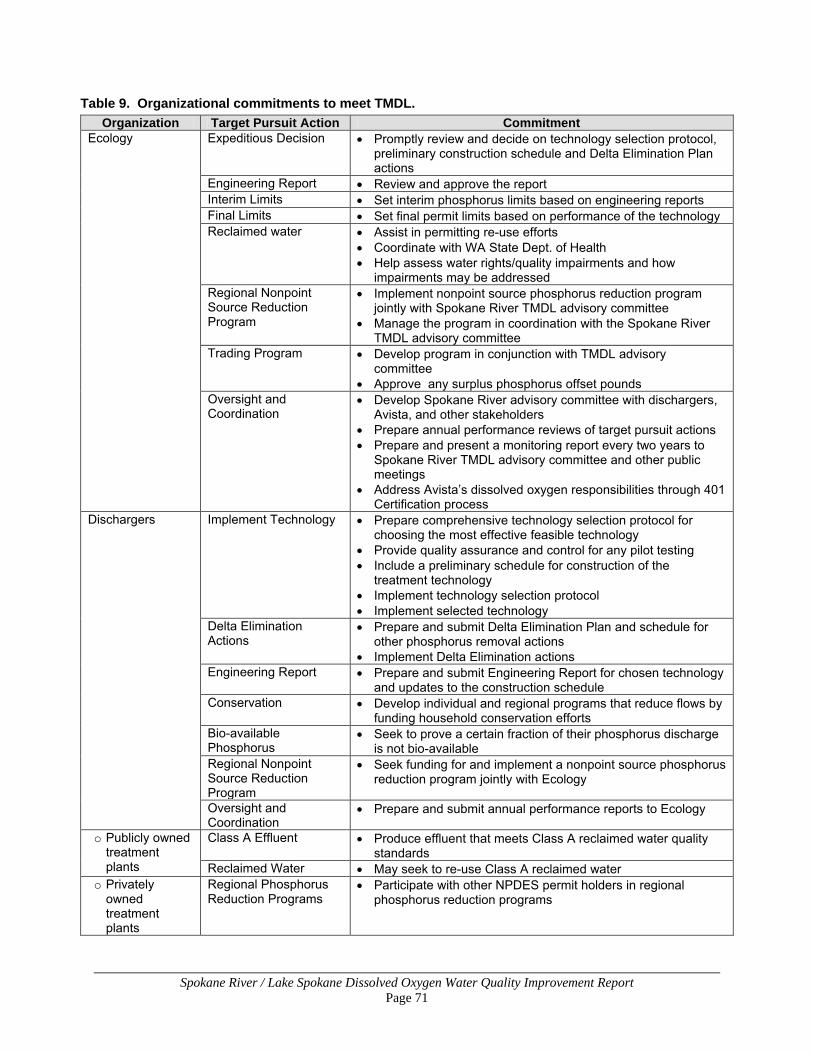
Spokane River / Lake Spokane Dissolved Oxygen Water Quality Improvement Report Page 71
Table 9. Organizational commitments to meet TMDL. Organization Target Pursuit Action Commitment
Ecology Expeditious Decision • Promptly review and decide on technology selection protocol, preliminary construction schedule and Delta Elimination Plan actions
Engineering Report • Review and approve the report Interim Limits • Set interim phosphorus limits based on engineering reports Final Limits • Set final permit limits based on performance of the technology Reclaimed water • Assist in permitting re-use efforts
• Coordinate with WA State Dept. of Health • Help assess water rights/quality impairments and how
impairments may be addressed Regional Nonpoint Source Reduction Program
• Implement nonpoint source phosphorus reduction program jointly with Spokane River TMDL advisory committee
• Manage the program in coordination with the Spokane River TMDL advisory committee
Trading Program • Develop program in conjunction with TMDL advisory committee
• Approve any surplus phosphorus offset pounds Oversight and Coordination
• Develop Spokane River advisory committee with dischargers, Avista, and other stakeholders
• Prepare annual performance reviews of target pursuit actions • Prepare and present a monitoring report every two years to
Spokane River TMDL advisory committee and other public meetings
• Address Avista’s dissolved oxygen responsibilities through 401 Certification process
Dischargers Implement Technology • Prepare comprehensive technology selection protocol for choosing the most effective feasible technology
• Provide quality assurance and control for any pilot testing • Include a preliminary schedule for construction of the
treatment technology • Implement technology selection protocol • Implement selected technology
Delta Elimination Actions
• Prepare and submit Delta Elimination Plan and schedule for other phosphorus removal actions
• Implement Delta Elimination actions Engineering Report • Prepare and submit Engineering Report for chosen technology
and updates to the construction schedule Conservation • Develop individual and regional programs that reduce flows by
funding household conservation efforts Bio-available Phosphorus
• Seek to prove a certain fraction of their phosphorus discharge is not bio-available
Regional Nonpoint Source Reduction Program
• Seek funding for and implement a nonpoint source phosphorus reduction program jointly with Ecology
Oversight and Coordination
• Prepare and submit annual performance reports to Ecology
o Publicly owned treatment plants
Class A Effluent • Produce effluent that meets Class A reclaimed water quality standards
Reclaimed Water • May seek to re-use Class A reclaimed water o Privately
owned treatment plants
Regional Phosphorus Reduction Programs
• Participate with other NPDES permit holders in regional phosphorus reduction programs
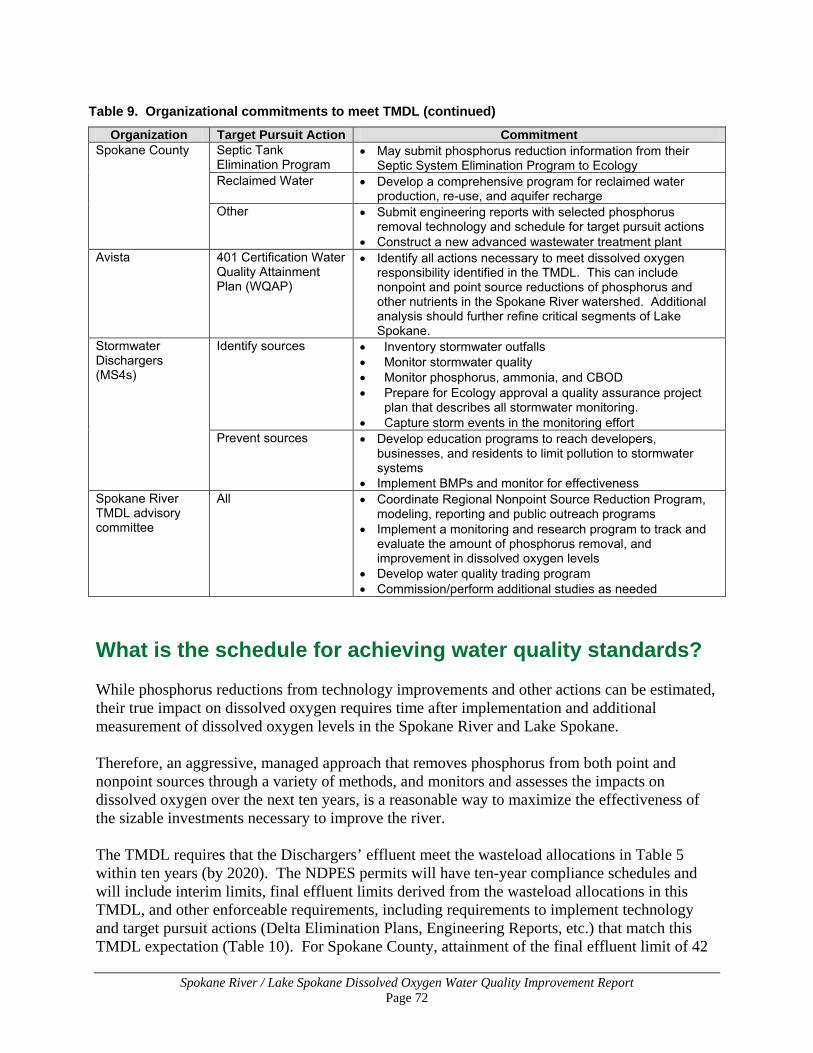
Spokane River / Lake Spokane Dissolved Oxygen Water Quality Improvement Report Page 72
Table 9. Organizational commitments to meet TMDL (continued)
Organization Target Pursuit Action Commitment Spokane County Septic Tank
Elimination Program • May submit phosphorus reduction information from their
Septic System Elimination Program to Ecology Reclaimed Water • Develop a comprehensive program for reclaimed water
production, re-use, and aquifer recharge Other • Submit engineering reports with selected phosphorus
removal technology and schedule for target pursuit actions • Construct a new advanced wastewater treatment plant
Avista 401 Certification Water Quality Attainment Plan (WQAP)
• Identify all actions necessary to meet dissolved oxygen responsibility identified in the TMDL. This can include nonpoint and point source reductions of phosphorus and other nutrients in the Spokane River watershed. Additional analysis should further refine critical segments of Lake Spokane.
Stormwater Dischargers (MS4s)
Identify sources
• Inventory stormwater outfalls • Monitor stormwater quality • Monitor phosphorus, ammonia, and CBOD • Prepare for Ecology approval a quality assurance project
plan that describes all stormwater monitoring. • Capture storm events in the monitoring effort
Prevent sources
• Develop education programs to reach developers, businesses, and residents to limit pollution to stormwater systems
• Implement BMPs and monitor for effectiveness Spokane River TMDL advisory committee
All • Coordinate Regional Nonpoint Source Reduction Program, modeling, reporting and public outreach programs
• Implement a monitoring and research program to track and evaluate the amount of phosphorus removal, and improvement in dissolved oxygen levels
• Develop water quality trading program • Commission/perform additional studies as needed
What is the schedule for achieving water quality standards? While phosphorus reductions from technology improvements and other actions can be estimated, their true impact on dissolved oxygen requires time after implementation and additional measurement of dissolved oxygen levels in the Spokane River and Lake Spokane. Therefore, an aggressive, managed approach that removes phosphorus from both point and nonpoint sources through a variety of methods, and monitors and assesses the impacts on dissolved oxygen over the next ten years, is a reasonable way to maximize the effectiveness of the sizable investments necessary to improve the river. The TMDL requires that the Dischargers’ effluent meet the wasteload allocations in Table 5 within ten years (by 2020). The NDPES permits will have ten-year compliance schedules and will include interim limits, final effluent limits derived from the wasteload allocations in this TMDL, and other enforceable requirements, including requirements to implement technology and target pursuit actions (Delta Elimination Plans, Engineering Reports, etc.) that match this TMDL expectation (Table 10). For Spokane County, attainment of the final effluent limit of 42
Spokane River / Lake Spokane Dissolved Oxygen Water Quality Improvement Report Page 73
µg/L total phosphorus must be met, when the plant is first operational, through appropriate technology limits and target pursuit actions to meet the final limit. Nonpoint sources of pollution are primarily addressed in the tributary TMDLs, one of which for Hangman (Joy et al., 2009) has recently been completed in 2009. The Little Spokane River TMDL is scheduled to be complete by 2010. According to Ecology’s technical lead on these projects, the schedule for achieving 75 to 100 percent of the implementation activities necessary to meet water quality standards for total suspended solids (11 to 26 percent reduction in total load) is estimated to take from ten to 15 years, or by 2025 (Joy 2010). Therefore, the schedule for meeting the load allocations in Table 6 should be on roughly the same time frame as the wasteload allocations. Dissolved oxygen and pH problems in the Little Spokane River and Hangman Creek are currently being studied. Many of the nonpoint source implementation activities to address the existing TMDL efforts are also expected to address these water quality problems. These studies may further differentiate the amount of nutrient loading in these tributaries that is naturally-occurring from that which is human-caused. Further refinement of expected seasonal load reductions is also expected. The detailed implementation plans expected from this TMDL will outline BMPs to reduce nonpoint source pollution. Similar BMPs applied in Coulee Creek could help meet load reductions specified for that creek. These should be very similar to the BMPs specified in the Hangman Creek TMDL TSS section. See the Load Allocation section for more information on how estimated load reductions are derived. Some of the same entities involved with the Spokane River and Lake Spokane TMDL, namely the city of Spokane and Spokane County, will work to improve water quality in Hangman Creek and the Little Spokane River. As mentioned earlier, the nonpoint source advisory committee is currently studying nonpoint source nutrient loading in the Spokane River watershed. This study is scheduled to be complete by early 2011 and will provide a Best Management Practices plan to inform dischargers, Avista, and conservation districts on where the highest nonpoint source nutrient loads originate so that resources can be focused for development of TMDL implementation plans, delta elimination plans, and Avista’s WQAP.
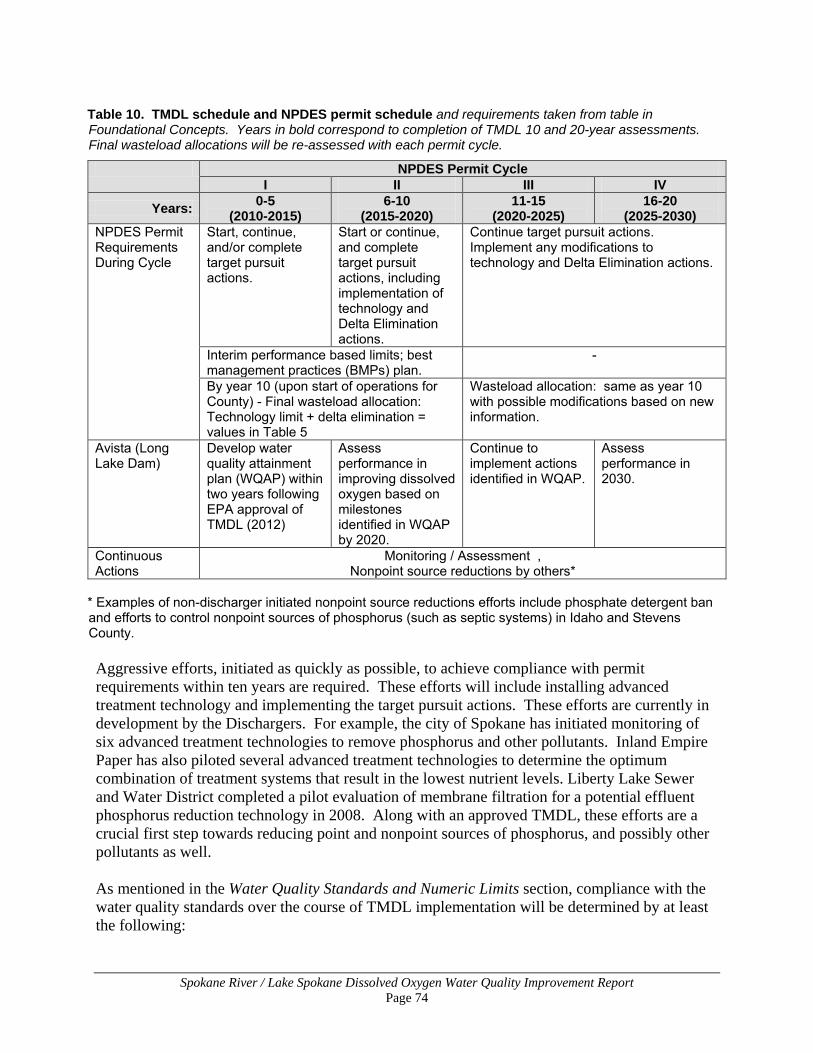
Spokane River / Lake Spokane Dissolved Oxygen Water Quality Improvement Report Page 74
Table 10. TMDL schedule and NPDES permit schedule and requirements taken from table in Foundational Concepts. Years in bold correspond to completion of TMDL 10 and 20-year assessments. Final wasteload allocations will be re-assessed with each permit cycle.
NPDES Permit Cycle I II III IV
Years: 0-5 (2010-2015)
6-10 (2015-2020)
11-15 (2020-2025)
16-20 (2025-2030)
NPDES Permit Requirements During Cycle
Start, continue, and/or complete target pursuit actions.
Start or continue, and complete target pursuit actions, including implementation of technology and Delta Elimination actions.
Continue target pursuit actions. Implement any modifications to technology and Delta Elimination actions.
Interim performance based limits; best management practices (BMPs) plan.
-
By year 10 (upon start of operations for County) - Final wasteload allocation: Technology limit + delta elimination = values in Table 5
Wasteload allocation: same as year 10 with possible modifications based on new information.
Avista (Long Lake Dam)
Develop water quality attainment plan (WQAP) within two years following EPA approval of TMDL (2012)
Assess performance in improving dissolved oxygen based on milestones identified in WQAP by 2020.
Continue to implement actions identified in WQAP.
Assess performance in 2030.
Continuous Actions
Monitoring / Assessment , Nonpoint source reductions by others*
* Examples of non-discharger initiated nonpoint source reductions efforts include phosphate detergent ban and efforts to control nonpoint sources of phosphorus (such as septic systems) in Idaho and Stevens County. Aggressive efforts, initiated as quickly as possible, to achieve compliance with permit requirements within ten years are required. These efforts will include installing advanced treatment technology and implementing the target pursuit actions. These efforts are currently in development by the Dischargers. For example, the city of Spokane has initiated monitoring of six advanced treatment technologies to remove phosphorus and other pollutants. Inland Empire Paper has also piloted several advanced treatment technologies to determine the optimum combination of treatment systems that result in the lowest nutrient levels. Liberty Lake Sewer and Water District completed a pilot evaluation of membrane filtration for a potential effluent phosphorus reduction technology in 2008. Along with an approved TMDL, these efforts are a crucial first step towards reducing point and nonpoint sources of phosphorus, and possibly other pollutants as well. As mentioned in the Water Quality Standards and Numeric Limits section, compliance with the water quality standards over the course of TMDL implementation will be determined by at least the following:
Spokane River / Lake Spokane Dissolved Oxygen Water Quality Improvement Report Page 75
1. Reviewing measured discharger and tributary water quality data to determine if wasteload and load allocations are being met,
2. Reviewing Avista’s implementation activities and data as part of the 401 Certification WQAP, and
3. Comparing model scenarios for the natural (the No Source modeling scenario described in the TMDL Analysis section) and current water quality to determine the difference once actions described in this TMDL are implemented.
Pending available resources, water quality monitoring and analysis will be conducted on a continuous basis every year by Ecology or others with prior approval by Ecology. Thorough assessments will be conducted and reported to the public every two years upon implementation of the TMDL (“biennial assessments”). The assessments will consist of compiling and qualifying data collected to date and as necessary, and may utilize the CE-QUAL-W2 model or its successor to assess the data and determine the effectiveness of the TMDL target pursuit actions in meeting the water quality standards for Lake Spokane and the Spokane River. A ten-year assessment (would be initiated prior to year ten) will utilize the CE-QUAL-W2 model or its successor to evaluate the effect of compliance with TMDL requirements and determine what, if any, additional nutrient reduction / dissolved oxygen improvement actions are necessary; what actions should be continued, discontinued, or modified; and whether any changes to the wasteload allocations in the TMDL or the water quality standards for dissolved oxygen in the Spokane River and Lake Spokane are warranted. More information on the biennial and ten-year assessments is provided in the Monitoring Progress section. As shown in Table 10 during the second ten year period, successful actions initiated in the first ten years will be continued, such as nonpoint source control actions, operation of the treatment technology and other permanent phosphorus reduction efforts. New actions could include modification of NPDES permits and reconsideration of the water quality standards applied to the Spokane River and Lake Spokane. As described earlier, the Dischargers are required to be in compliance with the then-current TMDL wasteload allocations by the end of ten years, unless Ecology makes adjustments to the TMDL and applicable permits based on new information.
The final wasteload allocations will be re-assessed and possibly changed based on information gathered as part of the target pursuit actions, including data collected for the biennial and ten-year assessments. Any changes in the wasteload allocations will be protective of water quality.
As discussed in the Load and Wasteload Allocations section, the total phosphorus wasteload allocations are expressed as pounds of phosphorus discharged to the Spokane River. The translation from concentration to pounds of phosphorus forms the basis for measuring success in meeting each phosphorus wasteload allocation. The pounds of phosphorus allocations will be achieved by the installation of the most effective phosphorus removal treatment technology and implementation of target pursuit actions to reduce nonpoint sources of pollution. Together these actions will result in the net pounds of phosphorus discharged being equal to, or less than, the final wasteload allocations.
Table 5 shows the phosphorus wasteload allocations for each Washington State NPDES permit holder in pounds per day, based on the total phosphorus concentration and design flow. The
Spokane River / Lake Spokane Dissolved Oxygen Water Quality Improvement Report Page 76
allocations are based on projected flows for 2027 using estimates produced through the Spokane River TMDL Collaboration. The allocations will be used to determine each NPDES permit holder’s delta. The NPDES permit limits will be based on a seasonal average and may include appropriate daily, weekly, and monthly limits that recognize the uncertainties and start-up complexities of new treatment technology. Compliance with final NPDES permit effluent limits will be based on actual, not projected flows and the wasteload allocations in Table 5.
Monitoring progress A monitoring program for evaluating progress is an important component of any implementation strategy. Monitoring is needed to keep track of what activities have or have not been done, measure the success or failure of target pursuit actions, and evaluate improvements in water quality. Monitoring should also be done after water quality standards are achieved (called compliance monitoring) to ensure that standards continue to be met. Monitoring of Spokane River and Lake Spokane water quality has been and, pending available resources, will continue to be conducted on a monthly basis by Ecology or others with prior approval by Ecology. The Dischargers will prepare and submit annual reports to Ecology, describing their progress in implementing the target pursuit actions and any measurable successes. Ecology will then conduct annual performance reviews of the status of agreed-upon, committed target pursuit actions described in Table 9. Every two years (or more frequently as appropriate) Ecology will prepare and present a report (biennial monitoring report) to the public to track the performance in meeting the primary goals of this TMDL, reducing excess nutrients in the river and lake, and improving dissolved oxygen to meet state standards. The CE-QUAL-W2 model or its successor will be utilized as necessary based on the level of information available for any individual biennial assessment. Prior to the end of the second permit cycle in 2020, a thorough assessment will be conducted on the data summaries collected to date, with particular attention given to Lake Spokane’s hypolimnion (lowest) layer. This assessment has been termed the “ten-year assessment” in the Foundational Concepts. The data necessary to make determinations for the third NPDES permit cycle will actually be needed prior to the end of year ten (2019). Adjustments to the permits will be considered during year ten, i.e., prior to the beginning of the third NPDES permit cycle (Table 10), based on all monitoring information collected at that time. The ten-year assessment will be a data-based, objective review using monitoring information and the CE-QUAL-W2 model or its successor to determine: • The amount of phosphorus removed from the river compared to the phosphorus reduction
requirements.
• The Spokane River and Lake Spokane’s response to the reductions and associated changes in dissolved oxygen.
• The likelihood of further phosphorus reductions occurring in the second ten years if the actions already taken are continued.
Spokane River / Lake Spokane Dissolved Oxygen Water Quality Improvement Report Page 77
• A set of actions that could be initiated in the second ten years that would likely result in further phosphorus reductions.
• The reasonableness of pursuing other strategies if the dissolved oxygen standard has not been met and continuing existing or implementing additional phosphorus removal strategies will likely achieve the dissolved oxygen standard.
• The progress on implementation of Avista’s dissolved oxygen responsibility.
• Whether the hypolimnion has met the dissolved oxygen standard with technology improvements and target pursuit actions or Avista’s dissolved oxygen responsibility, or if modified water quality standards for this layer are appropriate.
• Whether the wasteload allocations, load allocations and dissolved oxygen responsibility are being met and whether they should be lowered or raised (or redistributed) while still being protective of water quality.
The ten-year assessment will consider factors such as how long the treatment technology has been in operation and whether sufficient data is available to determine river conditions and dissolved oxygen response. Upon implementation of the TMDL, it is anticipated that the Spokane River TMDL advisory committee will coordinate a monitoring and research program to track and evaluate the amount of phosphorus removal and the impact of phosphorus reductions in dissolved oxygen levels. There will also be additional studies, such as those concerning sediment oxygen demand, studies in support of Avista’s WQAP, bio-availability of phosphorus in wastewater effluent, and other studies that advance the understanding of the science concerning the river’s and lake’s health. Modeling capabilities for the river will also be enhanced by gathering sediment oxygen demand data, noting and examining episodic events that contribute to increased phosphorus loading and other relevant data. Quality Assurance Project Plans (QAPP) are prepared for all monitoring studies and must follow Ecology guidelines (Lombard and Kirchmer 2004), paying particular attention to consistency in sampling and analytical methods. Additional monitoring efforts are scheduled or are occurring to identify phosphorus sources or collect further water quality information: • A bi-state nonpoint source project is currently working to identify and quantify nonpoint
phosphorus sources. The study will also determine the most cost-effective best management practices (BMPs) to reduce phosphorus in the most polluting sub-watersheds.
• Ecology is conducting ambient monitoring throughout the watershed. Data from this monitoring effort will be used to refine the model used in this TMDL.
• The city of Spokane will continue monitoring Lake Spokane to gather additional information on phosphorus levels in the lake.
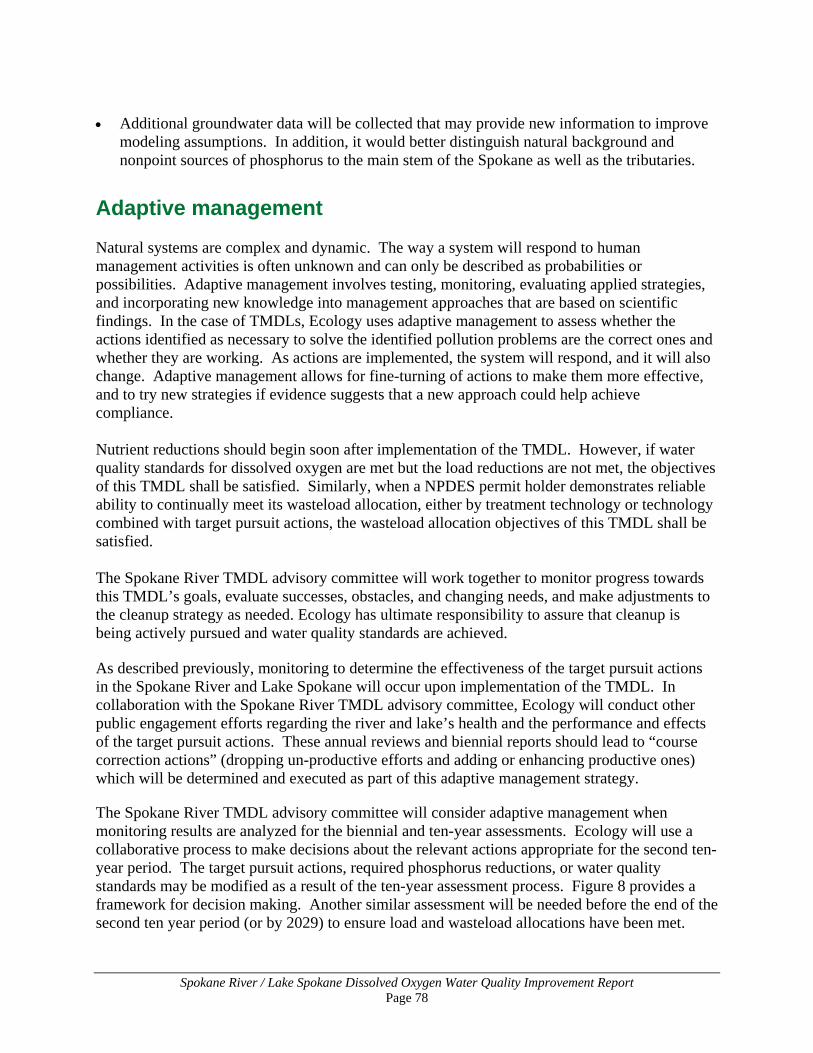
Spokane River / Lake Spokane Dissolved Oxygen Water Quality Improvement Report Page 78
• Additional groundwater data will be collected that may provide new information to improve
modeling assumptions. In addition, it would better distinguish natural background and nonpoint sources of phosphorus to the main stem of the Spokane as well as the tributaries.
Adaptive management Natural systems are complex and dynamic. The way a system will respond to human management activities is often unknown and can only be described as probabilities or possibilities. Adaptive management involves testing, monitoring, evaluating applied strategies, and incorporating new knowledge into management approaches that are based on scientific findings. In the case of TMDLs, Ecology uses adaptive management to assess whether the actions identified as necessary to solve the identified pollution problems are the correct ones and whether they are working. As actions are implemented, the system will respond, and it will also change. Adaptive management allows for fine-turning of actions to make them more effective, and to try new strategies if evidence suggests that a new approach could help achieve compliance. Nutrient reductions should begin soon after implementation of the TMDL. However, if water quality standards for dissolved oxygen are met but the load reductions are not met, the objectives of this TMDL shall be satisfied. Similarly, when a NPDES permit holder demonstrates reliable ability to continually meet its wasteload allocation, either by treatment technology or technology combined with target pursuit actions, the wasteload allocation objectives of this TMDL shall be satisfied. The Spokane River TMDL advisory committee will work together to monitor progress towards this TMDL’s goals, evaluate successes, obstacles, and changing needs, and make adjustments to the cleanup strategy as needed. Ecology has ultimate responsibility to assure that cleanup is being actively pursued and water quality standards are achieved. As described previously, monitoring to determine the effectiveness of the target pursuit actions in the Spokane River and Lake Spokane will occur upon implementation of the TMDL. In collaboration with the Spokane River TMDL advisory committee, Ecology will conduct other public engagement efforts regarding the river and lake’s health and the performance and effects of the target pursuit actions. These annual reviews and biennial reports should lead to “course correction actions” (dropping un-productive efforts and adding or enhancing productive ones) which will be determined and executed as part of this adaptive management strategy.
The Spokane River TMDL advisory committee will consider adaptive management when monitoring results are analyzed for the biennial and ten-year assessments. Ecology will use a collaborative process to make decisions about the relevant actions appropriate for the second ten-year period. The target pursuit actions, required phosphorus reductions, or water quality standards may be modified as a result of the ten-year assessment process. Figure 8 provides a framework for decision making. Another similar assessment will be needed before the end of the second ten year period (or by 2029) to ensure load and wasteload allocations have been met.
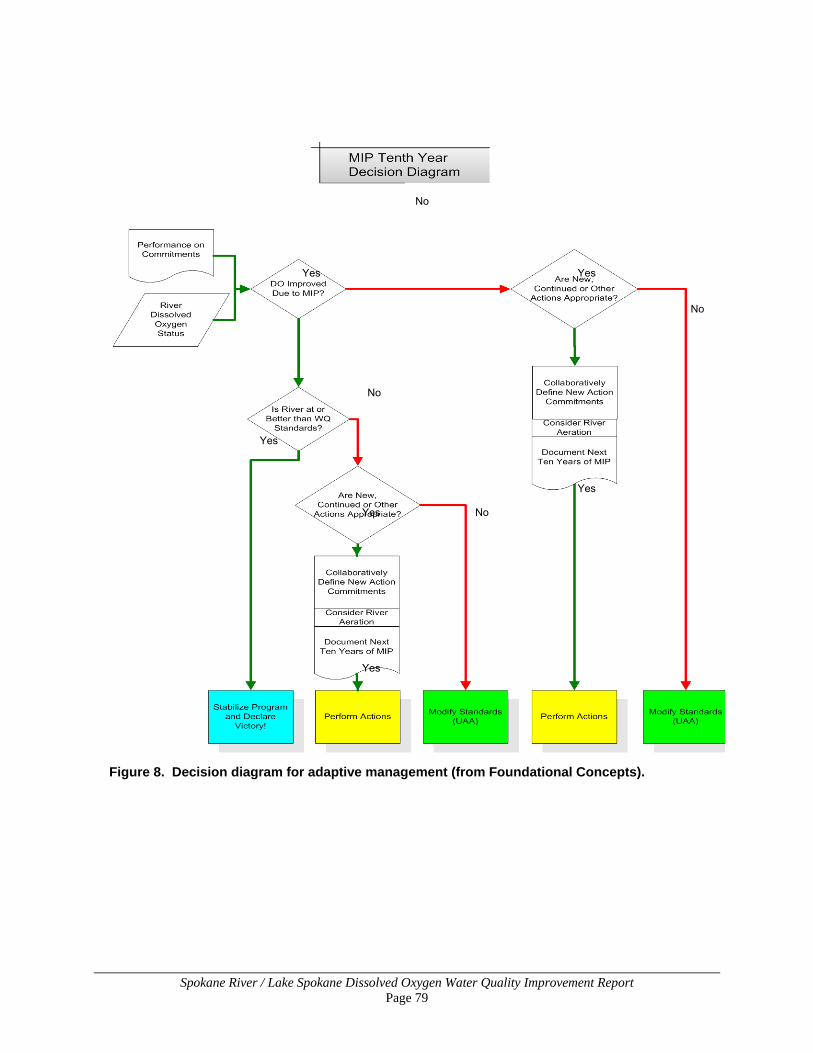
Spokane River / Lake Spokane Dissolved Oxygen Water Quality Improvement Report Page 79
Figure 8. Decision diagram for adaptive management (from Foundational Concepts).
No
Yes
No
No
No
Yes
Yes
Yes
Yes
Yes
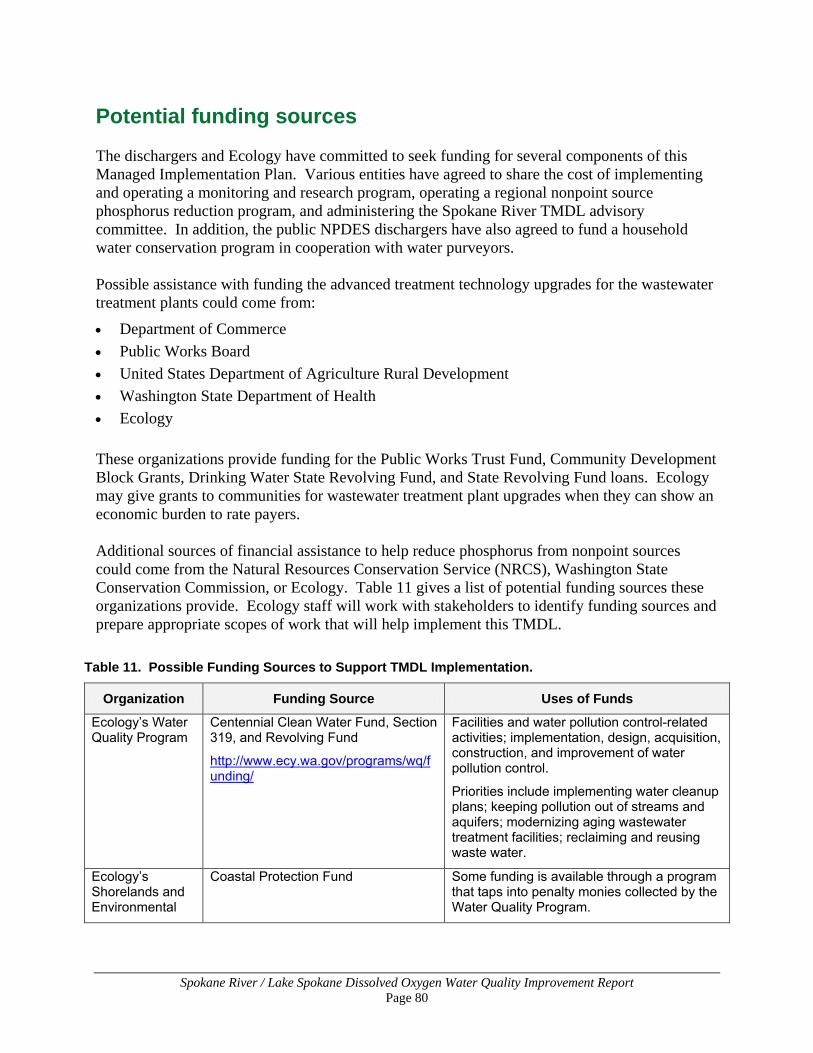
Spokane River / Lake Spokane Dissolved Oxygen Water Quality Improvement Report Page 80
Potential funding sources The dischargers and Ecology have committed to seek funding for several components of this Managed Implementation Plan. Various entities have agreed to share the cost of implementing and operating a monitoring and research program, operating a regional nonpoint source phosphorus reduction program, and administering the Spokane River TMDL advisory committee. In addition, the public NPDES dischargers have also agreed to fund a household water conservation program in cooperation with water purveyors. Possible assistance with funding the advanced treatment technology upgrades for the wastewater treatment plants could come from:
• Department of Commerce • Public Works Board • United States Department of Agriculture Rural Development • Washington State Department of Health • Ecology These organizations provide funding for the Public Works Trust Fund, Community Development Block Grants, Drinking Water State Revolving Fund, and State Revolving Fund loans. Ecology may give grants to communities for wastewater treatment plant upgrades when they can show an economic burden to rate payers. Additional sources of financial assistance to help reduce phosphorus from nonpoint sources could come from the Natural Resources Conservation Service (NRCS), Washington State Conservation Commission, or Ecology. Table 11 gives a list of potential funding sources these organizations provide. Ecology staff will work with stakeholders to identify funding sources and prepare appropriate scopes of work that will help implement this TMDL.
Table 11. Possible Funding Sources to Support TMDL Implementation.
Organization Funding Source Uses of Funds
Ecology’s Water Quality Program
Centennial Clean Water Fund, Section 319, and Revolving Fund
http://www.ecy.wa.gov/programs/wq/funding/
Facilities and water pollution control-related activities; implementation, design, acquisition, construction, and improvement of water pollution control.
Priorities include implementing water cleanup plans; keeping pollution out of streams and aquifers; modernizing aging wastewater treatment facilities; reclaiming and reusing waste water.
Ecology’s Shorelands and Environmental
Coastal Protection Fund Some funding is available through a program that taps into penalty monies collected by the Water Quality Program.
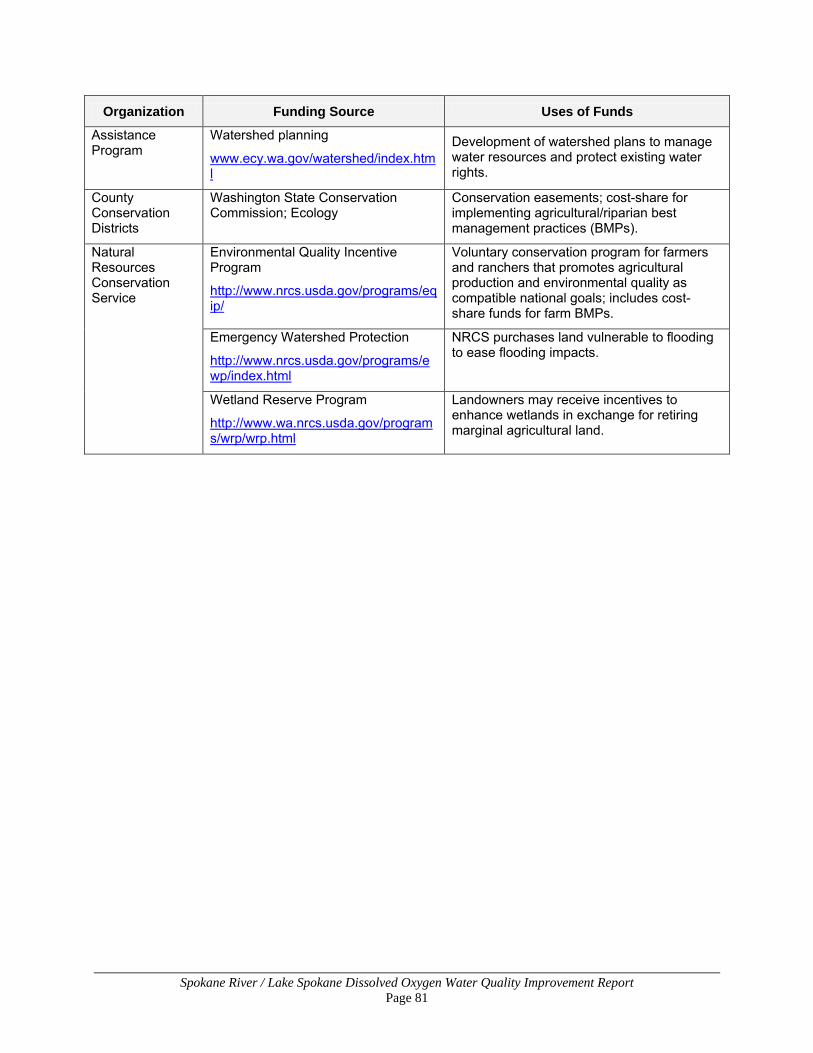
Spokane River / Lake Spokane Dissolved Oxygen Water Quality Improvement Report Page 81
Organization Funding Source Uses of Funds
Assistance Program
Watershed planning
www.ecy.wa.gov/watershed/index.html
Development of watershed plans to manage water resources and protect existing water rights.
County Conservation Districts
Washington State Conservation Commission; Ecology
Conservation easements; cost-share for implementing agricultural/riparian best management practices (BMPs).
Natural Resources Conservation Service
Environmental Quality Incentive Program
http://www.nrcs.usda.gov/programs/eqip/
Voluntary conservation program for farmers and ranchers that promotes agricultural production and environmental quality as compatible national goals; includes cost-share funds for farm BMPs.
Emergency Watershed Protection
http://www.nrcs.usda.gov/programs/ewp/index.html
NRCS purchases land vulnerable to flooding to ease flooding impacts.
Wetland Reserve Program
http://www.wa.nrcs.usda.gov/programs/wrp/wrp.html
Landowners may receive incentives to enhance wetlands in exchange for retiring marginal agricultural land.
Spokane River / Lake Spokane Dissolved Oxygen Water Quality Improvement Report Page 82
Summary of public involvement methods Development of this TMDL began in 1998 with the draft study plan presented to the Spokane River Phosphorus Technical Advisory committee. Ecology used an extensive public participation process to develop this current TMDL. Appendix B lists the public involvement opportunities Ecology provided for interested and affected parties to participate in development of this TMDL. In addition, Ecology hosted numerous informal meetings and discussions with interested parties to discuss various topics related to this TMDL.
2007 and 2008 Draft TMDLs In February 2005, Ecology agreed to begin working with the NPDES Dischargers and other groups on an implementation strategy. The Spokane River TMDL Collaboration (Collaboration) was created as a result of this agreement. The Collaboration consisted of the full group and six workgroups. The full group involved representatives of the dischargers, EPA, the Spokane Tribe of Indians, the Idaho Department of Environmental Quality, Ecology, environmental groups and others. All full group meetings were publicized and open to the public with opportunities for public comment. A list of the entire Collaboration full group meeting dates is included in Appendix B. The six workgroups of the Spokane River TMDL Collaboration were the Steering Group; Wastewater Flows and Loadings; Technology; Re-Use and Conservation; Nonpoint Source; and Monitoring. The workgroups met in concert with the full group and discussed the meaning and significance of data, answered specific questions, and prepared recommendations for the full group. Meeting notes for the full group and all the workgroups are available at http://www.ecy.wa.gov/programs/wq/tmdl/spokaneriver/dissolved_oxygen/historicalinfo-ross/historical_info-home.html. As stated earlier, the Spokane River TMDL Collaboration created the Foundational Concepts, which formed the blue-print for earlier TMDL drafts and for a significant portion of this TMDL’s managed implementation plan. Ecology previously held a public meeting on September 12, 2007 in the Student Union Building Auditorium of Spokane Falls Community College to review the TMDL process and give an overview of that previous draft report. Ecology sent an announcement about that previous comment period and public meeting to over 200 people during the last week in August. Ecology also announced the comment period to the local media by issuing a news release and placing display advertisements one week prior to the start of the comment period in the following publications: • Spokesman Review • Pacific Northwest Inlander • Spokane Valley Herald • Liberty Lake Splash • CDA Press
Spokane River / Lake Spokane Dissolved Oxygen Water Quality Improvement Report Page 83
A 45-day public comment period for the 2007 draft TMDL was held from September 12 through October 26, 2007. A 30-day public comment period was held from May 20 through June 24, 2008 following revisions to the 2007 draft TMDL. Responses to those comments received are provided in Appendix G of the 2008 draft TMDL. 2009 Draft TMDL Following EPA’s request for Ecology to postpone submittal of the draft TMDL in the summer of 2008, the interagency workgroup developed new modeling scenarios in late 2008 and early 2009. This TMDL was then completed in the summer and fall of 2009. Throughout this process, numerous stakeholder meetings, consisting of dischargers, their attorneys and consultants, environmental groups, tribes and congressional aides were held hosted by EPA (for modeling) and Ecology (during modeling and development of the TMDL). Dates for these meetings are provided below. EPA Stakeholder Meetings: • December 11, 2008 • February 13, 2009 (modeler’s workshop) • February 27, 2009 • March 25, 2009 • April 16, 2009 • June 25, 2009 Ecology Stakeholder Meetings: • January 14, 2009 • February 23, 2009 • March 20, 2009 • April 17, 2009 • May 15, 2009 Ecology announced a public comment period for this TMDL to the local media by issuing a news release and placing display advertisements one week prior to the start of the comment period in the following publications: • Spokesman Review • Pacific Northwest Inlander • Spokane Valley Herald • Coeur d‘Alene Press • Spokane Journal of Business A 45-day formal public comment period was held from September 15 to October 30, 2009. A public meeting and formal hearing were held during the public comment period on September
Spokane River / Lake Spokane Dissolved Oxygen Water Quality Improvement Report Page 84
24, 2009 and October 20, 2009, respectively. Responses to these comments are provided in Appendix C.
Next steps Once EPA approves the TMDL, Ecology will issue the NPDES permits for the Dischargers and develop a water quality implementation plan within one year. Alternatively, the combination of discharger delta elimination plans and Avista’s WQAP may serve as the Water Quality Implementation Plan. Ecology will develop and work with the Spokane River TMDL advisory committee, local groups and individuals to create this plan or plans, choosing the combination of possible solutions they think will be most effective in their watershed. Elements of this plan or plans will follow the organizational commitments described in Table 9 but will also include: • How to determine if the implementation plan works. • What to do if the implementation plan doesn’t work. • Potential funding sources.
Spokane River / Lake Spokane Dissolved Oxygen Water Quality Improvement Report Page 85
References Annear, R.L, C.J. Berger, S.A. Wells, and T. Cole. 2001. Upper Spokane River Model: Boundary Conditions and Model Setup. (1991 and 2000) Technical Report EWR-04-01. Department of Civil Engineering, Portland State University, Portland, OR. Bartolino, J.R. 2007. Assessment of areal recharge to the Spokane Valley-Rathdrum Prairie aquifer, Spokane County, Washington, and Bonner and Kootenai Counties, Idaho: U.S. Geological Survey Scientific Investigations Report 2007-5038, 38 p. Berger, C.J., R.L. Annear, S.A. Wells, and T. Cole. 2003. Upper Spokane River Model: Model Calibration 2001. Technical Report EWR-01-03. Department of Civil Engineering, Portland State University, Portland, OR. Butler, Chris. 2004. Personal communication. Spokane Tribe of Indians Cadmus Group and Scott Wells and Associates. 2009. Lake Roosevelt/Spokane River Arm Modeling Project: Data Review, Model Development, Calibration and Scenarios. Version 1. December 24, 2009.
Cope, Ben. 2006. Draft Assessment of the Water Quality Impact of Idaho Wastewater Treatment Plants on the Spokane River and Lake Spokane. US EPA Region 10. Office of Environmental Assessment. July.
Cunningham, R.K. and R.E. Pine. 1969. Preliminary Investigation of the Low Dissolved Oxygen Concentrations that Exist in Long Lake, Located near Spokane, Washington. Washington State Water Pollution Control Commission, Technical Report No. 69-1. Cusimano R. F. 2004. Spokane River and Lake Spokane (Long Lake) Pollutant Loading Assessment Report for Protecting Dissolved Oxygen. Publication Number 04-03-006. Washington State Department of Ecology, Environmental Assessment Program, Olympia, WA http://www.ecy.wa.gov/pubs/0403006.pdf Cusimano, R.F. 1999. Spokane River and Lake Spokane TMDL Study for Biochemical Oxygen Demand and Update of the Phosphorus Attenuation Model. Final Quality Assurance Project Plan. Washington State Department of Ecology, Environmental Assessment Program, Olympia, WA EPA. 1985. Rates, Constants, and Kinetics Formulations in Surface Water Quality Modeling. (Second Edition). Environmental Protection Agency Report 600/3-85/040. EPA. 1998. Report of the Federal Advisory committee on the Total Maximum Daily Load (TMDL) Program. Publication EPA 100-R-98-06, U.S. Environmental Protection Agency, Office of the Administrator, Washington, DC. www.epa.gov/owow/tmdl/faca/facaall.pdf
Spokane River / Lake Spokane Dissolved Oxygen Water Quality Improvement Report Page 86
EPA. 2000. Ambient Water Quality Criteria Recommendations – Rivers and Streams in Nutrient Ecoregion II. Publication EPA 822-B-00-015, U.S. Environmental Protection Agency, Office of the Administrator, Washington DC. http://www.epa.gov/waterscience/criteria/nutrient/ecoregions/rivers/rivers_2.pdf EPA. 2001. Overview of Current Total Maximum Daily Load - TMDL - Program and Regulations. U.S. Environmental Protection Agency. www.epa.gov/owow/tmdl/overviewfs.html EPA. 2008. Municipal Nutrient Removal Technologies Reference Document. US Environmental Protection Agency. Office of Wastewater Management. EPA 832-R-08-06. September 2008.
Fu, G., M. Barber, and S. Chen. 2007. Impacts of Climate Change on Regional Hydrological Regimes in the Spokane River Watershed. Journal of Hydrological Engineering. Vol 12, N. 5. Hendron, Lars. 2009. Personal communication (phone). City of Spokane. HDR. 2007. Onsite Sewage Disposal Systems Phosphorus Loading Estimate Technical Memorandum (Prepared for Spokane County). HDR, Boise, ID. July 24, 2007. Joy, Joe. 2009. Personal communication (phone). Washington State Department of Ecology. Joy, J., R. Noll, and E. Snouwaert. 2009. Hangman (Latah) Creek Watershed Fecal Coliform, Temperature, and Turbidity Total Maximum Daily Load, Water Quality Improvement Report. Publication No. 09-10-030. Washington State Department of Ecology, Olympia, WA. http://www.ecy.wa.gov/biblio/0910030.html Knight, D.T. 1998. Watershed Approach to Water Quality Management Needs Assessment for the Spokane Water Quality Management Area (WRIA 54-57). Washington State Department of Ecology, Water Quality Program, Spokane, WA. Lee, C., B. Scofield, D. Pavlik, and K. Fields. 2003. Lake Roosevelt Fisheries Evaluation Program - 2000 Annual Report. Dept. of Natural Resources, Spokane Tribe of Indians. Wellpinit, WA, 99040. Lombard, S. and C. Kirchmer. 2004. Guidelines for Preparing Quality Assurance Project Plans for Environmental Studies. Washington State Department of Ecology, Olympia, WA. Publication No. 04-03-030. www.ecy.wa.gov/biblio/0403030.html. Patmont, C.R., G.J. Pelletier, and M.E. Harper. 1985. Phosphorus Attenuation in the Spokane River. Project Completion Report. Contract No. C84-076. Harper-Owes, Seattle, WA Prepared for Washington State Department of Ecology, Olympia, WA. Publication No. 85-e28. http://www.ecy.wa.gov/biblio/85e28.html
Spokane River / Lake Spokane Dissolved Oxygen Water Quality Improvement Report Page 87
Portland State University. 2009. Spokane River Modeling Scenarios Report 2009. Water Quality Research Group. Department of Civil and Environmental Engineering. Maseeh College of Engineering and Computer Science. Technical report EWR-04-09.
Singleton, L.R., 1981. Spokane River Wasteload Allocation Study. Supplemental report for phosphorus allocation. Publication No. 81-15. Washington State Department of Ecology, Olympia, WA. Soltero, R.A., A.F. Gasperino, and W.G. Graham. 1973. An Investigation of the Cause and Effect of Eutrophication in Long Lake, WA. 0.W.R.R. Project 143-34-IOE-3996-5501. Completion Report. Eastern Washington State College, Cheney, WA. Soltero, R.A., A.F. Gasperino, and W.G. Graham. 1974. Further Investigation as to the Cause and Effect of Eutrophication in Long Lake, WA. Project 74-025A. Completion Report. Eastern Washington State College, Cheney, WA. Soltero, R.A., A.F. Gasperino, P.H. Williams, and S.R. Thomas. 1975. Response of the Spokane River Periphyton Community to Primary Sewage Effluent and Continued Investigation of Long Lake. Project 74-144. Completion Report. Eastern Washington State College, Cheney, WA. Soltero, R.A., O.M. Kruger, A.F. Gasperino, J.P. Griffin, S.R. Thomas, and P.H. Williams. 1976. Continued Investigation of Eutrophication in Long Lake, WA: Verification Data for the Long Lake Model. WDOE Project WF-6-75- 081. Completion Report. Eastern Washington State College, Cheney, WA. Soltero, R.A., D.G. Nichols, G.A. Pebles, and L.R. Singleton. 1978. Limnological Investigation of Eutrophic Long Lake and its Tributaries Just Prior to Advanced Wastewater Treatment with Phosphorus Removal by Spokane, WA. Project 77-108. Completion Report. Eastern Washington University, Cheney, WA. Soltero, R.A., D.G. Nichols, G.P. Burr, and L.R. Singleton. 1979. The Effect of Continuous Advanced Wastewater Treatment by the City of Spokane on the Trophic Status of Long Lake, WA. WDOE Project 77-108. Completion Report. Eastern Washington University, Cheney, WA. Soltero, R.A., D.G. Nichols, and J.M. Mires. 1980. The Effect of Continuous Advanced Wastewater Treatment by the City of Spokane on the Trophic Status of Long Lake, WA, During 1979. Project 80-019. Completion Report. Eastern Washington University, Cheney, WA. Soltero, R.A. and D.G. Nichols. 1981. The Recent Blue-Green Algal Blooms of Long Lake, Washington. In: The Water Environment: Algal Toxins and Health. Plenum Pub. Soltero, R.A., D.G. Nichols, and J.M. Mires. 1981. The Effect of Continuous Advanced Wastewater Treatment by the City of Spokane on the Trophic Status of Long Lake, WA. Contract No. WF81-001. Completion Report. Eastern Washington University, Cheney, WA.
Spokane River / Lake Spokane Dissolved Oxygen Water Quality Improvement Report Page 88
Soltero, R.A., D.G. Nichols, and M.R. Cather. 1982. The Effect of Continuous Advanced Wastewater Treatment by the City of Spokane on the Trophic Status of Long Lake, WA. Contract No. WF81-001. Completion Report. Eastern Washington University, Cheney, WA. Soltero, R.A., D.G. Nichols, and M.R. Cather. 1983. The Effect of Seasonal Alum Addition (chemical phosphorus removal) by the City of Spokane's Advanced Wastewater Treatment Plant on the Water Quality of Long Lake, Washington, 1982. City of Spokane Contract No. 414-430-000-534.40-3105. Completion Report. Eastern Washington University, Cheney, WA. Soltero, R.A., D.G. Nichols, M.R. Cather, and K.O. McKee. 1984. The Effect of Seasonal Alum Addition (chemical phosphorus removal) by the City of Spokane's Advanced Wastewater Treatment Plant on the Water Quality of Long Lake, Washington, 1983. City of Spokane Contact No. 414-430-000-534.40-3105. Completion Report. Eastern Washington University, Cheney, WA. Soltero, R.A., M.R. Cather, K.O. McKee, and D.G. Nichols. 1985. Variable Initiation and Termination of Alum Addition at Spokane's Advanced Wastewater Treatment Facility and the Effect on the Water Quality of Long Lake, Washington, 1984. City of Spokane Contract No. 414-430-000-501.34-3105. Completion Report. Eastern Washington University, Cheney, WA. Soltero, R.A., M.R. Cather, K.O. McKee, K.R. Merrill, and D.G. Nichols. 1986. Variable Initiation and Termination of Alum Addition at Spokane's Advanced Wastewater Treatment Facility and the Effect on the Water Quality of Long Lake, Washington, 1985. City of Spokane Contract No. 414-430-000- 501.34-3105. Completion Report. Eastern Washington University, Cheney, WA. Soltero, R.A., L.A. Campbell, K.R. Merrill, R.W. Plotnikoff, and L.M. Sexton, 1988. Water Quality Assessment and Restoration Feasibility for Eloika Lake, WA. Department of Biology, Eastern Washington University, Cheney, WA. Spokane County Water Resources Dept. - GIS, 2005. GIS Map of Active Septic Tanks and the Spokane Aquifer as of March 2005. http://client-ross.com/spokane%2Driver/docs/Resource-Spokane-County-Septic.pdf. Spokane River TMDL Collaboration, 2006. Foundational Concepts for the Spokane River TMDL Managed Implementation Plan. client-ross.com/spokane-river and www.ecy.wa.gov/programs/wq/tmdl/spokaneriver/index.html. See also Appendix D. Wagstaff, W.H. and R.A. Soltero, 1982. The Cause(s) of Continued Hypolimnetic Anoxia in Lake Spokane, Washington Following Advanced Wastewater Treatment by the City of Spokane. Final Progress Report, Contract No. 82-031. Report submitted by Eastern Washington University, Department of Biology, Cheney, WA. to Washington State.
Spokane River / Lake Spokane Dissolved Oxygen Water Quality Improvement Report Page 89
Wells, S. and C. Berger. March, 2009. Spokane River in Idaho and Washington TMDL Water Quality and Hydrodynamic Modeling Quality Assurance Project Plan. Portland State University, Portland, OR. Report prepared for EPA Region 10, Seattle, WA. Wells, S., Berger, C., and Wells, V., 2009. Spokane River Modeling Report 2009: Model Update and Calibration Check. Portland State University, Portland, OR. June, 2009. Portland State University (PSU), 2009. Spokane River Modeling Scenarios 2009. Portland, OR. December, 2009. Portland State University (PSU), 2010. Spokane River Modeling Scenarios 2009. Portland, OR. January, 2010.

Spokane River / Lake Spokane Dissolved Oxygen Water Quality Improvement Report Page 90
This page is purposely left blank

Spokane River / Lake Spokane Dissolved Oxygen Water Quality Improvement Report Page 91
Appendices

Spokane River / Lake Spokane Dissolved Oxygen Water Quality Improvement Report Page 92
This page is purposely left blank
Spokane River / Lake Spokane Dissolved Oxygen Water Quality Improvement Report Page A-1
Appendix A. Glossary, acronyms, and abbreviations

Spokane River / Lake Spokane Dissolved Oxygen Water Quality Improvement Report Page A-2
This page is purposely left blank
Spokane River / Lake Spokane Dissolved Oxygen Water Quality Improvement Report Page A-3
303(d) list: Section 303(d) of the federal Clean Water Act requires Washington State to periodically prepare a list of all surface waters in the state for which designated uses of the water – such as for drinking, recreation, aquatic habitat, and industrial use – are impaired by pollutants. These are water quality limited estuaries, lakes, and streams that fall short of state surface water quality standards, and are not expected to improve within the next two years.
7Q10 flow: A critical low-flow condition. The 7Q10 is a statistical estimate of the lowest 7-day average flow that can be expected to occur once every 10 years on average. The 7Q10 flow is commonly used to represent the critical flow condition in a water body and is typically calculated from long-term flow data collected in each basin. For temperature TMDL work, the 7Q10 is usually calculated for the months of July and August as these typically represent the critical months for temperature in our state.
Best management practices (BMPs): Physical, structural, and/or operational practices that, when used singularly or in combination, prevent or reduce pollutant discharges.
Biological oxygen demand (BOD): Water quality parameter that measures the dissolved oxygen used by microorganisms in the biological oxidation of organic matter. Sample incubation periods are typically 5 days (BOD5) or 20 days (BODult).
Clean Water Act: A federal act passed in 1972 that contains provisions to restore and maintain the quality of the nation’s waters. Section 303(d) of the Clean Water Act establishes the TMDL program.
Carbonaceous biological oxygen demand (CBOD): The BOD water quality test that excludes nitrifying bacteria, which can cause erroneous interpretations of BOD, particularly in wastewater treatment plants that have high levels of nitrifying bacteria.
Critical condition: When the physical, chemical, and biological characteristics of the receiving water environment interact with the effluent to produce the greatest potential adverse impact on aquatic biota and existing or designated water uses. For steady-state discharges to riverine systems, the critical condition may be assumed to be equal to the 7Q10 (see definition) flow event unless determined otherwise by the department.
Delta: The phosphorus concentration difference between what improvements wastewater treatment plant technology can achieve and the final wasteload allocations.
Designated uses: Those uses specified in Chapter 173-201A WAC (Water Quality Standards for Surface Waters of the State of Washington) for each water body or segment, regardless of whether or not the uses are currently attained.
Existing uses: Those uses actually attained in fresh and marine waters on or after November 28, 1975, whether or not they are designated uses. Introduced species that are not native to Washington, and put-and-take fisheries comprised of non-self-replicating introduced native species, do not need to receive full support as an existing use.
Extraordinary primary contact: Waters providing extraordinary protection against waterborne disease or that serve as tributaries to extraordinary quality shellfish harvesting areas.
Spokane River / Lake Spokane Dissolved Oxygen Water Quality Improvement Report Page A-4
Load allocation: The portion of a receiving waters’ loading capacity attributed to one or more of its existing or future sources of nonpoint pollution or to natural background sources.
Loading capacity: The greatest amount of a substance that a water body can receive and still meet water quality standards.
Margin of safety: Required component of TMDLs that accounts for uncertainty about the relationship between pollutant loads and quality of the receiving water body.
Municipal separate storm sewer systems (MS4): A conveyance or system of conveyances (including roads with drainage systems, municipal streets, catch basins, curbs, gutters, ditches, manmade channels, or storm drains): (i) owned or operated by a state, city, town, borough, county, parish, district, association, or other public body having jurisdiction over disposal of wastes, storm water, or other wastes and (ii) designed or used for collecting or conveying stormwater; (iii) which is not a combined sewer; and (iv) which is not part of a Publicly Owned Treatment Works (POTW) as defined in the Code of Federal Regulations at 40 CFR 122.2.
National Pollutant Discharge Elimination System (NPDES): National program for issuing, modifying, revoking and reissuing, terminating, monitoring and enforcing permits, and imposing and enforcing pretreatment requirements under the Clean Water Act. The NPDES program regulates discharges from wastewater treatment plants, large factories, and other facilities that use, process, and discharge water back into lakes, streams, rivers, bays, and oceans.
Nonpoint source: Pollution that enters any waters of the state from any dispersed land-based or water-based activities, including but not limited to atmospheric deposition, surface water runoff from agricultural lands, urban areas, or forest lands, subsurface or underground sources, or discharges from boats or marine vessels not otherwise regulated under the National Pollutant Discharge Elimination System Program. Generally, any unconfined and diffuse source of contamination. Legally, any source of water pollution that does not meet the legal definition of “point source” in section 502(14) of the Clean Water Act.
Phase I stormwater permit: The first phase of stormwater regulation required under the federal Clean Water Act. The permit is issued to medium and large municipal separate storm sewer systems (MS4s) and construction sites of five or more acres.
Phase II stormwater permit: The second phase of stormwater regulation required under the federal Clean Water Act. The permit is issued to smaller municipal separate storm sewer systems (MS4s) and construction sites over one acre.
Point source: Sources of pollution that discharge at a specific location from pipes, outfalls, and conveyance channels to a surface water. Examples of point source discharges include municipal wastewater treatment plants, municipal stormwater systems, industrial waste treatment facilities, and construction sites that clear more than five acres of land.
Pollution: Such contamination, or other alteration of the physical, chemical, or biological properties, of any waters of the state, including change in temperature, taste, color, turbidity, or odor of the waters, or such discharge of any liquid, gaseous, solid, radioactive, or other substance into any waters of the state as will or is likely to create a nuisance or render such waters harmful,
Spokane River / Lake Spokane Dissolved Oxygen Water Quality Improvement Report Page A-5
detrimental, or injurious to the public health, safety, or welfare, or to domestic, commercial, industrial, agricultural, recreational, or other legitimate uses, or to livestock, wild animals, birds, fish, or other aquatic life.
Primary contact recreation: Activities where a person would have direct contact with water to the point of complete submergence including, but not limited to, skin diving, swimming, and water skiing.
Stormwater: The portion of precipitation that does not naturally percolate into the ground or evaporate but instead runs off roads, pavement, and roofs during rainfall or snow melt. Stormwater can also come from hard or saturated grass surfaces such as lawns, pastures, playfields, and from gravel roads and parking lots.
Surface waters of the state: Lakes, rivers, ponds, streams, inland waters, salt waters, wetlands and all other surface waters and watercourses within the jurisdiction of Washington State.
Total Maximum Daily Load (TMDL): A distribution of a substance in a water body designed to protect it from exceeding water quality standards. A TMDL is equal to the sum of all of the following: (1) individual wasteload allocations for point sources, (2) the load allocations for nonpoint sources, (3) the contribution of natural sources, and (4) a Margin of Safety to allow for uncertainty in the wasteload determination. A reserve for future growth is also generally provided.
Wasteload allocation: The portion of a receiving water’s loading capacity allocated to existing or future point sources of pollution. Wasteload allocations constitute one type of water quality-based effluent limitation.
Water Quality Attainment Plan: Plan that describes measures Avista Utilities will make, as required by the 401 Certification, for improving dissolved oxygen in Lake Spokane once wasteload and load allocations are met by the Dischargers.
Water quality offset: A water quality offset occurs where a project proponent implements or finances the implementation of controls for point or nonpoint sources to reduce the levels of pollution for the purpose of creating sufficient assimilative capacity to allow new or expanded discharges. The purpose of water quality offsets is to sufficiently reduce the pollution levels of a water body so that a proponent's actions do not cause or contribute to a violation of the requirements water quality standards and so that they result in a net environmental benefit. Water quality offsets may be used to assist an entity in meeting load allocations targeted under a pollution reduction analysis (such as a total maximum daily load) as established by the department. Water quality offsets may be used to reduce the water quality effect of a discharge to levels that are unmeasurable and in compliance with the water quality antidegradation Tier II analysis. See WAC 173-201A-450.
Watershed: A drainage area or basin in which all land and water areas drain or flow toward a central collector such as a stream, river, or lake at a lower elevation.
Spokane River / Lake Spokane Dissolved Oxygen Water Quality Improvement Report Page A-6
Acronyms and Abbreviations Following are acronyms and abbreviations used frequently in this report. BMPs Best management practices CBOD Carbonaceous biological oxygen demand cfs Cubic feet per second City City of Spokane County Spokane County DO Dissolved oxygen Ecology Washington State Department of Ecology EPA U.S. Environmental Protection Agency IEP Inland Empire Paper Company LL Liberty Lake Sewer and Water District MS4 Municipal separate storm sewer system NH3-N Ammonia NPDES National Pollutant Discharge Elimination System RM River mile TMDL Total Maximum Daily Load (water cleanup plan) TP Total phosphorus USACE United States Army Corps of Engineers USGS United States Geological Survey WDFW Washington Department of Fish and Wildlife WQAP Avista Water Quality Attainment Plan WRIA Water Resources Inventory Area WWTP Wastewater treatment plant
Spokane River / Lake Spokane Dissolved Oxygen Water Quality Improvement Report Page B-1
Appendix B. Record of public participation

Spokane River / Lake Spokane Dissolved Oxygen Water Quality Improvement Report Page B-2
This page is purposely left blank
Spokane River / Lake Spokane Dissolved Oxygen Water Quality Improvement Report Page B-3
Introduction Prior to issuing the draft TMDL report in 2009, the Washington State Department of Ecology (Ecology) published the draft Spokane River and Lake Spokane Dissolved Oxygen Total Maximum Daily Load Water Quality Improvement Report (TMDL) in September 2007. A public comment period was held September 12 – November 13, 2007. Ecology received 56 written comments and 17 people presented oral comments at a public hearing on October 3, 2007. An additional 30-day public comment period was held from March 20 through June 24, 2008 following revisions to the TMDL based on the 2007 public comment period. Ecology received eight written comments during this comment period.
A second draft of Spokane River and Lake Spokane Dissolved Oxygen Total Maximum Daily Load Water Quality Improvement Report was released in May 2008 with the summary of comments and Ecology’s responses to those comments for the 2007 and 2008 public comment periods.
Following EPA’s request to Ecology to postpone submittal of the 2008 draft TMDL, stakeholder meetings listed below were held following a September 2008 meeting announcing EPA’s reversal. EPA stakeholders included all Dischargers from both Idaho and Washington State, environmental groups, congressional aides, the Spokane Tribe, Avista Utilities, and associated attorneys and consultants. Ecology stakeholder meetings were limited to Washington Dischargers, environmental groups, the Spokane Tribe, and Avista Utilities with occasional participation by Idaho Dischargers and their attorneys. List of public meetings In addition to the meetings described below, Ecology hosted numerous informal meetings and discussions with interested parties to discuss various topics related to this and previous drafts of the TMDL through 2009 and earlier through the Collaboration timeframe.
• May 1999: Draft study plan discussed with Spokane River Phosphorus Technical Advisory committee (TAC).
• April - September 2000: Public workshops for presentation of preliminary QUAL2E model.
• November 2000: Public Workshop to provide an updated TMDL timeline and present overview of the new CE-Qual-W2 model.
• March – April 1, 2002: Formal comment period for Spokane River Study/Data Summary Report.
• June 2002: Public Workshop and formal review of draft interim technical memo.
• December 2002: Public Workshop to review 2001 data and model WQ predictions.
• February 2003: Public workshop for organization of advisory group.
• June 2003: Conduct Public Workshop and formal public comment on draft Dissolved Oxygen Pollutant Loading Assessment Technical Report.
Spokane River / Lake Spokane Dissolved Oxygen Water Quality Improvement Report Page B-4
• February 2004: Final Load Assessment Technical Report published. (The response to comments for this report can be found on the internet at: www.ecy.wa.gov/programs/wq/tmdl/spokaneriver/dissolved_oxygen/respcomm_spokr_tmdl0104.pdf.)
• October 19, 2004: Public meeting to kick off 30-day comment period on the initial (2004) TMDL. The public comment period was extended through Dec. 31, 2004.
• December 14, 2004: Public hearing at the Spokane Community College Lair.
• September 12, 2007: Public meeting in the Student Union Building Auditorium of Spokane Falls Community College to review the TMDL process and give an overview of this report. Ecology sent an announcement about the comment period and public meeting to over 200 people during the last week in August.
2007 TMDL Draft Advisory Group Meetings: • May 2003: First official Advisory Group meeting • May 18, 2004 • June 22, 2004 • July 27, 2004 • August 31, 2004 • October 5, 2004 • May 24, 2007 2007 Draft TMDL Collaboration Full Workgroup meetings: • May 11, 2005 • June 23, 2005 • July 22, 2005 • August 24, 2005 • September 28, 2005 • November 22, 2005 • December 16, 2005 • January 25, 2006 • July 12, 2006 • March 7, 2007 2009 Draft TMDL EPA Stakeholder Meetings: • September 26, 2008 • December 11, 2008 • February 13, 2009 (modeler’s workshop) • February 27, 2009 • March 25, 2009 • April 16, 2009 • June 25, 2009
Spokane River / Lake Spokane Dissolved Oxygen Water Quality Improvement Report Page B-5
2009 Draft TMDL Ecology Stakeholder Meetings: • January 14, 2009 • February 23, 2009 • March 20, 2009 • April 17, 2009
Spokane River / Lake Spokane Dissolved Oxygen Water Quality Improvement Report Page B-6
Outreach and announcements A 45-day formal public comment period was being held for this draft TMDL from September 15 to October 30, 2009. Responses to the comments received are provided in Appendix C. Ecology announced the public comment period for this TMDL to the local media by issuing a news release and placing display advertisements one week prior to the start of the comment period in the following publications: • Spokesman Review • Pacific Northwest Inlander • Spokane Valley Herald • CDA Press
Spokane River / Lake Spokane Dissolved Oxygen Water Quality Improvement Report Page C-1
Appendix C. Response to public comments

Spokane River / Lake Spokane Dissolved Oxygen Water Quality Improvement Report Page C-2
This page is purposely left blank
Spokane River / Lake Spokane Dissolved Oxygen Water Quality Improvement Report Page C-3
Contents
A. Avista’s Dissolved Oxygen Responsibility.......................................................................4
B. Climate Change Impacts ...................................................................................................14
C. County Shoreline Master Plan...........................................................................................15
D. 2006 Foundational Concepts Document ...........................................................................17
E. General Concern / Lack of Support for Plan .....................................................................18
F. General Statements of Support ..........................................................................................21
G. Idaho Sources / NPDES Permits .......................................................................................24
H. Loading Capacity / Total Maximum Daily Load ..............................................................45
I. Margin of Safety / Reasonable Assurances ........................................................................47
J. Modeling ..........................................................................................................................52
K. Selection of TMDL Scenario ............................................................................................76
L. Spokane County New Discharge .......................................................................................80
M. Spokane Tribe of Indians / Spokane Arm Water Quality ................................................84
N. Target Pursuit / Delta Elimination Actions [water quality trading] ..................................89
O. Timeframe / Permit Compliance Schedule .......................................................................104
P. Toxics – PCBs, Metals, etc. ...............................................................................................108
Q.Tributary Load Allocations / Nonpoint Source Reductions ...............................................109
R. Wasteload Allocations – Washington NPDES Permit Limits ..........................................118
S. Water Quality Monitoring .................................................................................................141
T. Water Quality Standards ....................................................................................................143
Spokane River / Lake Spokane Dissolved Oxygen Water Quality Improvement Report Page C-4
A. Avista’s Dissolved Oxygen Responsibility Summary: These comments focus on the perceived inequity of Avista’s dissolved oxygen responsibility. While many commenters are supportive of the inclusion of Avista in this draft of the TMDL, the same commenters feel too much responsibility has been assigned to Avista. Avista also has concerns with how compliance will be determined through the Water Quality Attainment Plan as part of the 401 Certification. Summary Response: Ecology’s 401 Certification for Long Lake Dam, which has been incorporated into the 2009 FERC license for the dam, requires Avista to develop a detailed strategy for achieving water quality improvement in the lake that includes identification and implementation of all reasonable improvements. The 401 Certification relies upon the TMDL to quantify the water quality improvements in Lake Spokane that are the responsibility of Avista to achieve, which is why Ecology incorporated Avista into the TMDL. The dissolved oxygen improvements necessary for Avista to achieve are specified in the TMDL and were determined by modeling a reduction in upstream point and nonpoint sources so that the water quality entering into Lake Spokane is minimally impacted by human activities (i.e. typical ecoregional nutrient conditions). The TMDL refers to this modeling estimation as the “riverine assessment point.” Based on this modeling approach, it is then reasonable to assume that impairments occurring downstream of this point are attributable to Long Lake Dam (as explained in more detail in the response to comment number 1, Part A). The rationale for this approach is described in more detail in the Avista’s Dissolved Oxygen Responsibility section of the TMDL. Starting with the information in the TMDL, Avista will develop a Water Quality Attainment Plan (WQAP) as required by the 401 Certification for their FERC license to describe all reasonable and feasible measures to improve dissolved oxygen in Lake Spokane. Ecology expects that Avista will employ both additional nonpoint source reductions in the Lake Spokane watershed and technology measures as part of the WQAP strategy for dissolved oxygen. Comments have been consolidated into the categories in bold and responses follow below. 1. Approach used to quantify dissolved oxygen impacts of Long Lake Dam. Numerous
commenters support the inclusion of Avista in the TMDL, but also question the equity of the approach used to quantify the dissolved oxygen impacts in Long Lake caused by the dam. Some commenters believe that Avista’s responsibility is disproportionally large because it makes Avista responsible for the effects of nutrients that it did not cause to enter the Lake, from sources over which it has no control; other commenters believe that Avista’s responsibility should be larger, since the hydrologic changes caused by the dam have reduced the loading capacity of the Spokane River.
Response: The purpose of a TMDL is to identify all sources of pollution, and to allocate loads to sources such that water quality standards will be met. TMDL regulations do not require the state to develop TMDL allocations based on any specific formula or approach, including a formula based solely on proportional responsibility. EPA recommends, however, that allocations be made in consideration of feasibility, equitability, types of sources, management options, public involvement, limits of technology, load variability and BMP effectiveness (EPA Protocol for Developing Nutrient TMDLs, November 1999). Ecology worked with EPA and the Spokane River stakeholders to develop a reasonable and equitable strategy for improving water quality
Spokane River / Lake Spokane Dissolved Oxygen Water Quality Improvement Report Page C-5
based on each of these considerations, including proportional responsibility, as explained below. The resulting TMDL provides a reasonable distribution that allows all parties to address point and nonpoint sources in their area of influence. Long Lake dam changes the character and hydrodynamic characteristics of the river system. The dam slows down water movement resulting in a significant increase in the travel time of pollutants in the downstream direction. This creates conditions that decrease dissolved oxygen concentrations, and that increase algae blooms. Sediments, containing organic materials and nutrients, accumulate on the bottom and are not easily flushed in an impoundment as large and deep as Long Lake, resulting in a significant depletion of oxygen in deeper areas within the water column. Also, the deepness of the impoundment promotes unfavorable mixing conditions vertically, which contributes to the low levels of oxygen in deep areas of the lake, and a greater probability of algae blooms in the top layers of the lake. These hydrologic changes cause dissolved oxygen impairments in the lake, even without the addition of anthropogenic nutrients from upstream sources. Ecology’s 401 Certification for Long Lake Dam, which has been incorporated into the 2009 FERC license for the dam, requires Avista to develop a detailed strategy for water quality improvement that includes identification and implementation of all reasonable and feasible measures to improve dissolved oxygen in Lake Spokane. The 401 Certification relies upon the TMDL to quantify the water quality improvements that are the responsibility of Avista to achieve in Lake Spokane. Quantifying Avista’s contribution to the water quality impairment in Long Lake requires an understanding and balancing of existing impairments caused by both the upstream anthropogenic pollutant loads, and by the hydrologic changes caused by the dam, including the accumulation of nutrient-enriched sediment at the bottom of the lake. The sediment is nutrient enriched because of upstream sources, but has been entrained in Long Lake because of hydrologic changes to the riverine system caused by the dam. Both Avista and upstream dischargers share responsibility for the presence of nutrient-enriched sediment. The approach used by Ecology, with support from EPA, to quantify the dam’s contribution to the Lake’s low dissolved oxygen levels was to model reductions of upstream anthropogenic loading of oxygen demanding pollution to levels that are typical of other nearby rivers, and that represent minimal human impact. The EPA has assessed in-stream nutrient data throughout the United States, and has developed “ecoregional criteria,” which represent lake and riverine conditions minimally impacted by human activities (EPA 2002). Using this approach to reduce upstream anthropogenic sources does not eliminate upstream anthropogenic sources of pollution (or lake-side non-point sources); rather, it reduces pollutants to a level that is typical of other rivers in the same ecoregion. The hydrologic model was then used to determine the impairments that would occur in the lake if typical ecoregional levels of phosphorus entered the lake. Impairments in Long Lake that result from these modeled loads are caused by the dam and are the responsibility of the dam operator, since the levels of pollutants entering the impoundment are unimpaired, and represent minimal human impact. This approach is referred to as the “riverine assessment” approach in the TMDL.
Spokane River / Lake Spokane Dissolved Oxygen Water Quality Improvement Report Page C-6
Based on assessment of water bodies in the same geographical area, 10 µg/L phosphorus was selected as the riverine assessment point. As noted in the summary response for Part T, this benchmark does not establish new nutrient criteria in Lake Spokane. This is a typical phosphorus value for any river entering a lake in this ecoregion, and is EPA’s Clean Water Act Section 304(a) recommended criterion for total phosphorus in Ecoregion II (EPA 822-B-00-015, Table 2). The hydrologic model used to develop this indicates that the TMDL, when implemented, will reduce the upstream anthropogenic sources such that the average concentration of phosphorus entering Long Lake is approximately 10 µg/L during the critical season (March to October). The riverine assessment point is located in the upstream, riverine end of Lake Spokane; and while the dissolved oxygen standards are currently being met at this location (model segment 154), phosphorus levels are far above natural background levels (See Figure 3). The elevated phosphorus levels at this location, and the dissolved oxygen depleting impact of this phosphorus on the dissolved oxygen in the downstream reservoir compels development of a reduction of phosphorus to 10 µg/L (at model segment 154) in order to reasonably allocate responsibility for the dissolved oxygen depletion, and to meet the dissolved oxygen criterion in the reservoir by the end of the ten year compliance schedule.
2. Dam location. Long Lake Dam does not cause nutrients from upstream sources to create
dissolved oxygen problems that would not otherwise exist; it merely determines where in the river system dissolved oxygen problems caused by others will manifest themselves. If the dam were not present, the same nutrient load would travel downstream to another location, where it would cause algal growth, leading to algae decomposition, and reduced dissolved oxygen levels.
Response: The impoundment creates conditions that otherwise would not exist in a free-flowing river, and that cause impairments in Lake Spokane. The suggestion that the elimination of Long Lake Dam might simply move the impairments downstream (for example, onto the Spokane Tribe Indian Reservation) does not absolve the dam operator of responsibility for impairments that occur in Lake Spokane as the result of Long Lake Dam.
3. Avista’s allocation. The “responsibility” assigned to Avista is in reality a load allocation or LA.
Response: Avista’s Long Lake Dam does not discharge pollution into Long Lake; rather, Long Lake dam changes the character and hydrodynamic characteristics of the river system such that the loading capacity of Lake Spokane is reduced.
Avista’s responsibility is therefore not an “allocation” of a pollutant; instead, in conjunction with the state’s Clean Water Act 401 Certification, the TMDL reasonably assigns responsibility to Avista to address the decreased loading capacity of Lake Spokane caused by the Long Lake Dam.
4. The draft TMDL should not make Avista the sole guarantor of dissolved oxygen levels in the Lake.
Spokane River / Lake Spokane Dissolved Oxygen Water Quality Improvement Report Page C-7
Response: Achieving water quality standards in Long Lake is not just the responsibility of Avista, but is also the responsibility of all of the upstream point and nonpoint sources. The way in which this “responsibility” is calculated is discussed in the TMDL and response to comment number 1, Part A. The specific way in which Avista will determine whether or not their responsibility is being met will be outlined in the WQAP.
5. Can Avista’s obligations be achieved? The 2009 Draft TMDL does not provide any information to indicate how or if Avista can achieve the dissolved oxygen reductions specified in Table 6 of the draft TMDL [Table 7 of final TMDL]; moreover Avista’s obligations must be “reasonable and feasible.” Numerous commenters believe that Avista’s obligations are unrealistically large and are not attainable; there are no examples of nonpoint source reduction or lake oxygenation at the levels that this draft would require of Avista. The TMDL, and particularly the WLAs, should not be based on unrealistic assumptions about Avista’s ability to reduce P or oxygenate, absent data and analysis that demonstrates that Avista’s “responsibility” can in fact be accomplished. Finally, how will Avista achieve the required dissolved oxygen improvement?
Response: Water quality exceedances in Long Lake increase with depth, and affect the largest part of the reservoir during August (see final 2010 TMDL, Table 7). The largest dissolved oxygen water quality improvement required by Avista is 1.2 mg/L and occurs during the August 16-31 time period in the segments closest to Long Lake Dam. In order to achieve these water quality improvements, Avista can consider all necessary methods, such as technology or engineering improvements to the dam and reservoir, as well as methods to reduce nonpoint sources of nutrients to the system (TMDL, page xi). The process for Avista to plan for and achieve the water quality improvements quantified by the TMDL is outlined in the 401 Certification for the Spokane River Hydroelectric Project (May 11, 2009), and requires that Avista develop a Water Quality Attainment Plan (WQAP).
It is during the development of the WQAP that the most feasible methods for improving dissolved oxygen in the Long Lake will be identified. The dissolved oxygen improvements needed for Long Lake are wide-spread throughout the lake, but relatively small in magnitude (i.e. 1.2 mg/L) and Ecology believes that the dissolved oxygen improvements specified in the TMDL are both “reasonable and feasible,” and can be achieved either through oxygenation and/or non-point source reduction. There are numerous dissolved oxygen enhancement projects that have achieved dissolved oxygen improvement similar to that required by this TMDL. For example, dissolved oxygen improvement of 3-6 mg/L has been achieved in Gulf Island Pond, Maine; and Upper San Leandro, California; and Twin Lakes, Washington. If dissolved oxygen improvement will be achieved through nonpoint source reductions (instead of, or in addition to engineering improvements to the reservoir or dam), these activities will be outlined in the WQAP.
6. Avista and reasonable assurance. Based on the allocation of this “responsibility” to Avista, the TMDL has reduced the waste load allocations (WLAs) to the dischargers and created a WLA for Spokane County’s new treatment plant. If Avista is unable to achieve their responsibility (through oxygenation or reduction of non-point sources), then the WLAs assigned to the dischargers are too high. This plan gives the dischargers a green light to
Spokane River / Lake Spokane Dissolved Oxygen Water Quality Improvement Report Page C-8
make major investments in substandard technology based on unrealistic assignments to Avista.
Ecology should not adopt any new NPDES permits based on the 2009 draft TMDL until Avista develops a technically and economically feasible plan, which clearly identifies the pollutant load reduction the dam operator could/will achieve. The adopted TMDL should be appropriately conservative with regard to water quality protection and not presume that Avista can reduce pollutant loading into Lake Spokane. If Avista subsequently determines they can actually reduce pollutant loading, then the TMDL could be revised after this determination is evaluated.
Response: The FERC license requires Avista to improve dissolved oxygen in the reservoir in the amount assigned by the TMDL. As discussed in the responses to comment numbers 1 and 5, Part A, Ecology believes that those improvements are both reasonable and achievable. Moreover, the requirements of the 401 certification are enforceable by the Department of Ecology. It is therefore reasonable to assume that Avista will achieve the water quality improvements required by this TMDL; and it is therefore unlikely that the WLAs for upstream sources will need to be further reduced (at least in the first two permit cycles pending findings from the ten-year assessment). The phosphorus WLAs in the TMDL are low when compared to other TMDLs, both regionally and nationally, and will require state-of-the-art technology (not “substandard technology”). All assumptions in the TMDL, including WLAs, LAs and Avista’s dissolved oxygen responsibility, will be re-evaluated and possibly changed based on new information and research (adaptive management) as described in the Managed Implementation Plan section of the TMDL during biennial assessments, between NPDES permit cycles, and during the ten-year assessment.
7. WQAP. The draft TMDL asserts that reasonable assurance is achieved because the terms of implementation for Avista’s “responsibility” are set forth in the Managed Implementation Plan section of the document. But the MIP section does not identify or describe how Avista is expected to reduce phosphorus loading to Lake Spokane, and Avista is not required to produce a WQAP for two years. By deferring discussion of Avista’s plan for phosphorus reduction (or oxygenation), the TMDL effectively defers the day when it will become clear that Avista cannot achieve its assigned “responsibility.” In addition, this is little information as to how such reductions by non-point sources will be measured [for Avista’s dissolved oxygen responsibility] and attributed to the efforts of Avista and the dischargers.
Response: As required by the 401 Certification (May 8, 2009) the WQAP must contain an implementation plan to analyze, evaluate and implement reasonable and feasible measures to improve dissolved oxygen in Long Lake (401 Certification, May 8, 2009). As part of this implementation plan, Avista must demonstrate that the proposed nonpoint source reductions are quantified using a technical and methodological basis that is reviewed and approved by Ecology; and that they are providing actual reductions (see Managed Implementation Plan section of TMDL). See also response to comment number 6, Part A.
8. WQAP deadline. In addition, the TMDL should acknowledge that the deadline for developing a WQAP may be later than 2011 since there are so many actions that must take
Spokane River / Lake Spokane Dissolved Oxygen Water Quality Improvement Report Page C-9
place prior to completion of the WQAP (i.e. completion of the TMDL; EPA approval; amendment of the 401 Certification).
Response: The completion date for the WQAP has been changed to 2012 in Table 10 (formerly Table 9 in the draft report) of the TMDL. The reasonable assurance discussion in the TMDL has been expanded to include a discussion of the requirements and timeline for the WQAP. Avista will develop a Water Quality Attainment Plan (WQAP) as part of the 401 Certification within two years of the TMDL’s approval.
9. State law at RCW 98.48.422(3). The draft dissolved oxygen TMDL must be consistent with provisions of state law pertaining to dams at RCW 90.48.422(3).
Response: The water quality impairment in Lake Spokane is caused by both upstream sources of nutrients and the reduced loading capacity of Lake Spokane caused by the Long Lake Dam. The TMDL requires Avista to mitigate or remedy a water quality problem caused by the Long Lake Dam and is therefore consistent with RCW 90.48.422(3).
10. Oxygenation. The TMDL references offset options for Avista and wastewater agencies.
Please modify the TMDL to specifically state that reservoir aeration/oxygenation will be an available target pursuit action that can be considered by Avista or a wastewater agency. It is unclear why Ecology did not list reservoir aeration or oxygenation as one possible strategy for increasing the River's capacity to assimilate nutrients such as phosphorous and ammonia without adversely affecting dissolved oxygen. Eliminating that as an option seems to be premature.
Response: Oxygenation does not solve the nutrient loading problems that led to this TMDL. For this reason, reductions in nonpoint sources of nutrients are preferred over technological fixes. Controlling nonpoint sources of nutrients will ultimately be more effective to improve water quality from an environmental and cost standpoint. Ecology expects Avista will focus on control of nutrients, particularly to Lake Spokane but language in the TMDL does not preclude the possibility of “other methods” or “technologies,” which can include hypolimnetic oxygenation.
11. Water quality without Avista Dam. One commenter stated that the draft dissolved oxygen TMDL incorrectly assumes that a water quality problem would not exist but for the dam, and asks specifically whether or not water quality problems would exist if the dam were not in place.
Response: The draft TMDL does not assume that the dam is the sole source of water quality impairments; rather, the TMDL acknowledges that the hydrologic changes caused by the dam contribute to impairments in the reservoir. The TMDL does not answer the question “would water quality problems exist if the dam were not in place?” simply because the TMDL is required to consider the critical condition of the Spokane River - - and the critical condition is a low-flow year, with the dam in place. The TMDL recognizes that the water quality impairment in Lake Spokane is caused by both upstream sources of nutrients and the reduced loading capacity of Lake Spokane caused by the Long Lake Dam.
Spokane River / Lake Spokane Dissolved Oxygen Water Quality Improvement Report Page C-10
12. Other sources on Long Lake. The model assumes that Segment 154 (where compliance is measured for the Dischargers) is “downstream of all anthropogenic sources,” which is not true. This error makes Avista responsible for all discharges resulting from activities on or near the shores of Lake Spokane, notwithstanding the fact that it neither causes nor controls the sources of those discharges. In addition to farming activities along the shore of the lake, the approximate 400 septic tanks located within 300 feet of Lake Spokane most likely contribute additional nutrients to the lake. Under the model, Avista is held 100 percent responsible for the dissolved oxygen effects of such discharges.
Response: Segment 154 is not a “compliance point;” as discussed in the TMDL, and throughout the response to comments in Part T, the riverine assessment point at Segment 154 is being used as a way of assessing the proportional responsibility of Avista and upstream point and non-point sources.
Contributions from non-point sources adjacent to Long Lake are considered in the TMDL, but the proportional responsibility of those sources has not been calculated (see summary response for Part J). As discussed in the TMDL in the “Avista’s Dissolved Oxygen Responsibility” section, Avista’s proportional responsibility has been calculated by assuming that the water quality of the Spokane River is minimally impacted by human sources when it enters Lake Spokane. When the TMDL is fully implemented, the minimally-impacted quality of the river (10 µg/L typical ecoregional total phosphorus concentration) at the riverine assessment point will not be the natural condition, but will contain pollutants from upstream point and nonpoint sources; the upstream pollutants are reduced significantly by the TMDL, but are not eliminated.
Nonpoint sources adjacent to Long Lake include a relatively new housing development, minor agriculture and low traffic volume roadways. Non-point source contributions from the land area adjacent to Lake Spokane are variable, relatively minor compared to other sources identified in this TMDL, and difficult to quantify accurately. As described in the summary response to Part J, the impact of these sources has been included in the hydrologic model (through the input of groundwater with elevated phosphorus concentrations), but the quantitative impact of those pollutants on dissolved oxygen is combined with the impact of the dam. Avista is not required to, but does have the option of reducing these nonpoint source contributions to meet their dissolved oxygen responsibility, as will be further defined in their WQAP.
13. Temperature. Given that low flows affect temperature, and that temperature and dissolved oxygen are correlated, low flows should be given greater scrutiny. The effects of Avista's dams on temperature cannot be ignored. Inasmuch as the document is a dissolved oxygen TMDL, it should incorporate temperature to a greater extent.
Response: The TMDL was designed so that water quality standards will be met during critical low flow years, which is why the 2001 low flow year was chosen. The temperature effects of Avista’s dam are discussed at length in the 401 certification for the dam, which has been incorporated into the FERC license. This TMDL does not, however, address temperature impairments.
Spokane River / Lake Spokane Dissolved Oxygen Water Quality Improvement Report Page C-11
14. Lake Spokane and 303(d) list. The draft dissolved oxygen TMDL makes Avista responsible for improving water quality in segments of Lake Spokane not identified on Ecology’s 303(d) list. Ecology’s 303(d) list identifies only a small portion of Lake Spokane as a Category 5, or impaired, water. Listing ID 40939 in Ecology’s 2008 Water Quality Assessment. The portion identified as impaired includes only those areas represented in the model as around segments 181 and 182. Therefore, the draft dissolved oxygen TMDL can allocate responsibility for improving DO levels only in those listed segments.
Response: 303(d) listings are indicators of water quality impairment. Not all impaired waters are identified on the 303(d) list, however, because impairments on the Washington 303(d) list are based on samples, and water quality samples are not taken at all locations. During TMDL development, the extent of impairment is identified through either additional sample collection or hydrologic modeling. Ultimately, the TMDL must ensure that water quality standards are met throughout the lakes and rivers covered by the TMDL, not just in the locations where samples were taken. In the Spokane TMDL, hydrologic modeling indicates that the extent of impairment extends beyond the sample locations identified on the 303(d) list - - this requires that the TMDL address and actions be taken to improve water quality throughout the lake.
15. Critical period. Table 6 [Table 7 in the final TMDL] includes shaded cells for the period between October 31 and December 15. These cells should not be shaded, since the dissolved oxygen TMDL makes clear that the critical period for DO does not extend past October 31.
Response: Table 7 has been modified to verify Avista’s responsibility would not extend past October 31, 2001 when stratification breaks down and dissolved oxygen is over 9.5 mg/L under the TMDL scenario.
16. Draft TMDL Table 6. The draft dissolved oxygen TMDL must recognize the limitations inherent in the modeling results, and must not hold Avista responsible for eliminating all dissolved oxygen deficits as they are quantified in the shaded cells in Table 6 [Table 7 in final TMDL]. Avista’s obligations under the dissolved oxygen TMDL must be to implement measures that are “reasonable and feasible” the “reasonable and feasible” standard should be clearly incorporated into the expression of Avista’s compliance obligation. Avista’s compliance with the dissolved oxygen TMDL should be evaluated based on a combination of factors, including monitoring data, modeling results, implementation and quantification of Ecology-approved BMPs, and the effects these have on the dominant aquatic habitat. The model used to evaluate compliance must also be updated to reflect the actual conditions being evaluated. The key language that Avista believes requires modification is found on page 36 of the draft dissolved oxygen TMDL:
Direct calculation of the dissolved oxygen improvements necessary to meet the water quality standards in Lake Spokane are provided in Table 6 and are calculated for each segment (vertical averaged dissolved oxygen) location within the reservoir (Figure 7). The water quality improvements required in Table 6 must occur in order to achieve water quality standards for DO in Lake Spokane, and will serve as the basis for evaluation of the adequacy of Avista's WQAP in meeting its responsibilities. To achieve these water quality improvements, Avista can consider all necessary methods, such as technology or engineering improvements to the dam and reservoir, as well as methods to reduce nonpoint sources of nutrients to the system.
Spokane River / Lake Spokane Dissolved Oxygen Water Quality Improvement Report Page C-12
Avista proposes that Ecology replace this language with the following:
Table 6 shows the model's approximate, predicted dissolved oxygen levels in Lake Spokane under "natural" conditions, after implementation of controls on upstream sources. The shaded cells indicate those areas where it is predicted that DO levels will be more than 0.2 mg/L below natural conditions. Future versions of this table, with modeling results based on additional updated data (particularly that regarding the dominant aquatic habitat within the Lake), will serve as one indicator of whether Avista's DO WQAP is fulfilling Avista's responsibility to mitigate its proportionate level of responsibility for DO problems in Lake Spokane. To fulfill its responsibility, Avista shall consider and implement reasonable and feasible technological and operational measures.
Response: Text has been modified in the TMDL to state the following:
The numbers in Table 7 will serve as the basis for evaluation of the adequacy of Avista’s WQAP in meeting its responsibilities. Ecology expects the numbers in Table 7 may be further refined in the development of the WQAP if the identification and assessment of methods to improve dissolved oxygen indicate that the improvements required in table 6 are not necessary to achieve water quality standards for dissolved oxygen in Lake Spokane.
In the same way that NPDES permits are the enforcing mechanism for WLAs, the WQAP will articulate the way in which Avista’s “responsibility” in Table 7 will be implemented. For the purposes of this TMDL, the dissolved oxygen improvements in Table 6 are required in order to ensure that water quality standards will be met in Lake Spokane.
17. Title of draft Table 6. Ecology should change the heading of Table 6 [Table 7 in final TMDL] to read as follows:
Table 6. TMDL Scenario #1 dissolved oxygen concentrations (italics) are compared with No Source scenario concentrations (bold) for [start date] through [end date]. Those areas of the reservoir where the model predicts a decrease of more than 0.2 mg/L of DO over natural conditions are shaded.
Response: See response to comment number 16, Part A.
18. 401 Certification. Does Ecology agree that dam operators are accountable for meeting assigned water quality standards downstream from an impoundment? Does Ecology agree that a “different approach” is taken within an impoundment?
Response: These questions do not appear to be comments on the draft TMDL. Questions noted.
19. DO standard. Does Ecology agree that Lake Spokane is not a natural water body? Does Ecology agree that Ecology cannot treat the effects of dams on water quality within a reservoir impoundment as a natural condition?
Response: See Ecology’s interpretation of water quality standards as they apply to Lake Spokane in Appendix I of the TMDL.
Spokane River / Lake Spokane Dissolved Oxygen Water Quality Improvement Report Page C-13
20. Offsets. Avista and the Dischargers Must be Allowed to Meet Their Respective Obligations Under the dissolved oxygen TMDL by Using Offsets for Non-point Source Reductions Immediately.
Response: See “Managed Implementation Plan” and “Avista / Long Lake Dam” sub-section of TMDL for information on how Avista can achieve its dissolved oxygen responsibility. Prior to applying off-site nonpoint reductions, point source dischargers must first apply known technological fixes to attempt to achieve the water quality based WLA’s in this TMDL in order to comply with the CWA and Water Pollution Control Act. After application of those technologies, a point source may need additional phosphorus reductions to achieve the water quality based effluent limit. However, in the meantime point source dischargers may begin scoping potential offsets. Considerations should include: who has the ability to reduce what nonpoint sources, what existing responsibilities are in place, what reductions are quantifiable and provable, and which of those reductions are cost effective to the point source dischargers. Also, point source dischargers should be cognizant of the fact that for an offset to be successfully applied to a permit, the discharger must first provide a technical analysis of the load reductions expected from any proposed nonpoint work, obtain Ecology approval of that analysis, establish binding legal agreements between any parties involved in the nonpoint reduction activities, meet state antidegradation requirements, and meet federal Clean Water Act antibacksliding requirements.
Additionally, regulations require that offsets may only be obtained when they provide reductions beyond the requirements for existing sources, and must achieve a net environmental benefit. In the context of the TMDL, this means that reductions must be greater than load allocations established for tributaries. However, this does not preclude a discharger from beginning on the ground work – it simply means that the offset cannot be applied to the permit until the conditions established in the WQS have been met.
Spokane River / Lake Spokane Dissolved Oxygen Water Quality Improvement Report Page C-14
B. Climate Change Impacts Summary: Several comments question why climate change impacts are not considered or discussed in the draft TMDL.
Summary Response: The effects that climate change may have on the hydrology of the Spokane River are unknown. However, determining the effects of future climate change on water quantity, specifically for the Spokane River watershed, is the focus of current research by Washington State University as described in Fu et al. (2007). While general relationships between climate and flow regimes have been shown in this research, water quality modeling has not been applied to the different flow regimes. This additional climate change modeling may be included in subsequent analyses as part of the TMDL ten-year assessment and/or Avista’s 401 Certification.
Spokane River / Lake Spokane Dissolved Oxygen Water Quality Improvement Report Page C-15
C. Shoreline Master Plans Summary: These comments concern the city of Spokane and Spokane County’s Shoreline Master Plans (SMP) and connections with the TMDL. In general, they request that the TMDL incorporate specific SMP requirements, mainly septic system design and riparian buffer provisions. Summary Response: The development of the city and county SMP is overseen by Ecology’s Shoreline and Environmental Assistance (SEA) program, which has approval authority on those plans. Throughout the county and city SMP development process, SEA worked in close cooperation with Ecology’s Water Quality Program. The TMDL provides the numeric standards (load allocations) to meet water quality standards whereas the SMP can help implement the TMDL through the application of best management practices (BMPs) to improve water quality in certain watersheds. For example, both the city and county SMPs contain provisions to protect vegetative buffers which help prevent water pollution by limiting entry of sediments, nutrients and other pollutants into surface waters. Local enforcement of these buffers has been problematic. Integration between these two plans is described in the Managed Implementation Plan section of the TMDL, under the sub-heading “SEPA – Land Use Planning.”
Upon approval by Ecology, these plans provide a potential means of city and county enforcement of water quality BMPs for nonpoint source pollution to meet the tributary load allocations. To integrate SMPs with the TMDL effort will require greater cooperation amongst the wastewater treatment and planning departments within the city and county. The design, approval, construction and maintenance of on-site sewage systems is regulated by the Spokane County Regional Health District.
1. If Ecology is requiring the City of Spokane (and others) to meet strict phosphorus limits in discharges into the Spokane River (at a reported cost of $157M for the City of Spokane alone), I hope you will be consistent with this requirement and not allow Spokane and/or Stevens County to relax Shoreline Master Plan standards to allow septic installations near the river, particularly around Long Lake. It seems only reasonable not to undo the effort and expense to meet TMDL standards only to have that work undermined by permitting a new source of phosphorus on the river.
Response: See summary response for Part C. New SMP provisions governing on-site sewage systems in Spokane County are specifically intended to protect surface waters from nutrient loading, particularly nitrogen and phosphorus. The county health district has the authority to adopt stricter regulations to control potential phosphorus loading into surface waters and should perhaps adopt such provisions near shorelines of the state and their tributaries.
2. I would like to request that, should offset credits be allowed, this offset agreement also include
the provision that the County not allow any additional septic installations in the watershed. It seems only equitable that if the offset credits are to genuinely mitigate additional phosphorus loading from a waste treatment facility, that no additional phosphorus loading from septic installations be permitted.
Spokane River / Lake Spokane Dissolved Oxygen Water Quality Improvement Report Page C-16
Response: See summary response for Part C and response number 1, Part C.
3. The above statement indicates there is a belief that septic tanks are contributing pollutants to surface water via groundwater. This connection makes septic tanks subject to regulation under the NPDES program. It also begs asking the question about why a ban on the installation of additional septic tanks over the aquifer has not been imposed. Negotiating such a ban should have been part of the settlement for fabricating a WLA for the County’s proposed new discharge into the River and should be a part of the County’s Shoreline Master Plan.
Response: See summary response for Part C and response number 1, Part C.
4. Why is Spokane County not required to impose a ban on construction of new septic systems? Instead, the County has moved in the opposite direction, loosening standards for requiring septic systems to connect to sewer lines and proposing an amendment to the Spokane County Shoreline Master Program to allow septic systems to be built closer to groundwater tables.
Response: See summary response for Part C and response number 1, Part C.
5. Ecology should integrate the TMDL with the City of Spokane and Spokane County Shoreline Master Plans to ensure that all appropriate actions are taken to reduce and prevent further discharge of phosphorus into the Spokane River. Despite ample claims that phosphorus can be “offset” through non-point source control measures, the 2009 Draft TMDL fails to integrate with other regulatory processes that could actually implement phosphorus reduction or, at the very least, lessen any potential increases. Both Master Plans are currently under review with the Department of Ecology. These plans have shortcomings that could impact the ability to meet phosphorus reduction goals. For example, the City of Spokane’s Master Plan has inappropriate buffers along portions of property along Latah Creek and Spokane County’s Master Plan significantly reduces the septic offset requirements from 10 feet to 3 feet, despite ample evidence that this will increase break-thru time.
Response: See summary response for Part C.
6. While it's an independent activity, it's recommended that the Shoreline Master Plan would be a good mechanism through which to regulate nonpoint sources in this case. Some examples would be to create buffer zones at the shoreline specifically around farms with phosphorous containing fertilizers or grassy lawns. Considering the obstacles to monitoring phosphorous this could drastically help to achieve some of the goals of the TMDL.
Response: See summary response for Part C.
Spokane River / Lake Spokane Dissolved Oxygen Water Quality Improvement Report Page C-17
D. 2006 Foundational Concepts Document Summary: The 2006 Foundational Concepts document, provided in Appendix D of the TMDL, provided the primary foundational basis for the 2007 and 2008 drafts of the TMDL. Comments are concerned with the inconsistency between this document and the current TMDL. Summary Response: Ecology recognizes the confusion brought about by all the different versions of the TMDL and by the inclusion of the Foundational Concepts document in the current version. Ecology believes it is important to include the relevant portions of the Foundational Concepts, such as the “target pursuit actions” while discarding the portions that are inconsistent with current policy (such as an extended compliance schedule) or outdated (years for projected flows, for example). This goal to retain the relevant portions of the Foundational Concepts is described in the Reasonable Assurance and in the introduction to the Managed Implementation Plan sections of the TMDL. 1. The MIP [Managed Implementation Plan] appears to be redundant with appendix D for several
sections such as Target Pursuit Actions and likely includes updated language for some of these actions. However…is unclear how to interpret or apply the statements made in Appendix D that are not reconciled in the new MIP…The TMDL does not adequately explain how these changes occurred and creates confusion with the inclusion of these older documents.
Response: See summary response for Part D.
2. Ecology cannot claim the Foundational Concepts as being in place when it has eliminated key elements that are important to the dischargers and retaining only those elements that support an Ecology need.
Response: The relevant portions of the Foundational Concepts are retained, as explained in the summary response for Part D. These portions that are retained, namely the target pursuit actions, support the needs of the dischargers more so than Ecology.
3. The Memorandum of Agreement wherein the City, Ecology and others adopted the FC states that the purpose of the FC was to guide development of the TMDL. That purpose seems to have been accomplished by the incorporation of key aspects of the FC directly into the TMDL. Accordingly, the City of Spokane suggests that the discussion of the FC at p. 3 be retained but that other references either be deleted or clarified in order to avoid confusion where the FC and the TMDL are not identical.
Response: In light of the preceding comments, Ecology feels it is necessary to retain all references in order to be transparent with regards to the existence of the Foundational Concepts and to explain how the Foundational Concepts applies to this latest version.
Spokane River / Lake Spokane Dissolved Oxygen Water Quality Improvement Report Page C-18
E. General Concern / Lack of Support for Plan 1. Please remove the names of John Tindall and Robert Steed from the "Acknowledgements" on
page ix.
Response: Requested change has been made.
2. The Draft TMDL, as proposed, has the potential to eliminate Inland Empire Paper Company as a viable business in the Spokane community. IEP hopes that Ecology will consider the consequences of its decision in this matter as set forth in the following comments, questions and proposed actions.
Response: See summary response to Part R and response to comment number 19, Part N.
3. Ecology’s obligation to respond to public comments is heightened by the lack of transparency in the Draft TMDL as to the source and basis for WLAs… Nor does the Draft TMDL disclose whether Ecology has adopted the EPA conclusions [in Appendix J] simply as a means to force dischargers to fund non-point source reductions.
Response: The meetings with stakeholders listed in Appendix B, in addition to numerous individual meetings attest to Ecology’s effort to remain transparent throughout this entire project. As noted in the summary response to Part R, the Appendix J memo was not the sole source for decisions on wasteload allocations.
4. We had an extremely toxic algae bloom in Lake Spokane this summer…And yet, it seems to me that the major polluters are doing everything in their power to avoid spending the money needed to reduce the nutrients they discharge into the river that feed these toxic algae blooms, and Ecology thru the current TMDL, is aiding them.
Response: Millions of dollars have been spent by the dischargers in advance of this TMDL’s approval, including the multi-million dollar effort to install advanced treatment technologies by the city of Spokane and Inland Empire Paper Company. As noted by comments from the dischargers, many millions more will be spent to implement the TMDL.
5. Clearly this TMDL aids the shell game being played by the major polluters to avoid the costs of cleaning up the river...Algae blooms are a direct result of nutrient loading. The law demands that those who discharge those nutrients be held responsible. While it is important that fish get the oxygen they need to survive, it is nothing, compared to assuring the safety of our children. It's time to quit these shell games and get serious about cleaning up the river.
Response: See response to comment number 4, Part E. This TMDL has some of the most stringent wasteload allocations for wastewater treatment facilities in the country and provides incentives to reduce nonpoint sources of pollution. As many comments attest, the dischargers and other stakeholders are highly committed to doing everything possible to meet these challenges.
Spokane River / Lake Spokane Dissolved Oxygen Water Quality Improvement Report Page C-19
6. The presence of toxic algae is of utmost concern to KEA because its members use and enjoy the waters in the Coeur d'Alene watershed, including the Spokane River and Lake Spokane. As residents that live and recreate on Lake Spokane, Mr. Bollie, Mr. Buterbaugh, and Mr. Chaney each have a direct interest in ensuring that Ecology adopts a TMDL that will finally protect the water quality in Lake Spokane and protect beneficial uses.
Response: Ecology shares the concerns related to toxic algae blooms. It’s important to realize, however, that reducing these blooms will not only require significant investments by upstream sources, but will also require lakeshore owners to adopt better practices related to landscaping, septic system maintenance, and water conservation.
7. Accordingly, with minor fixes, the 2004 TMDL provided a much better water quality analyses and clearly presented loading capacity, LAs and WLAs.
Response: While it may arguably be a simpler document to understand in terms of loading capacities, the 2004 draft did not provide any incentives for wastewater reuse, nonpoint source reductions and failed to incorporate the effects of Avista’s Long Lake Dam into the process. Ecology feels these additional items, requested by all stakeholders, are significant improvements from prior drafts of the TMDL.
8. I'll let IEP speak for themselves in terms of what they mean to the community from a further statistical point but want to point out how the potential to lose an employer of the magnitude, of this magnitude due to an unattainable regulatory standard would be a very dark cloud over us all.
Response: See summary response to Part R and response to comment number 19, Part N.
9. But there's also cost to any further delays. There's costs financially. I think Mr. Savitz [Greater Spokane Incorporated] already commented that just Spokane County's cost alone in the last five years have doubled. Those are very real costs to the citizens of this region, a region that is known statewide for relatively low household income.
Response: Comment noted.
10. But there are also costs environmentally to these delays. And, and I think one of the items that was pointed out that in the time that we have delayed implementation of TMDL and not implemented some of these technologies, there were 40,000 pounds of additional phosphorous that's been discharged into the river on an annual basis. There's a very real environmental cost to further delays.
Response: Comment noted.
11. The DOE standard will result in the Spokane Valley residents spending about a billion dollars in construction costs and tens of millions of dollars a year in operational costs.
Response: The project cost of the Spokane County wastewater treatment plant is currently estimated at $143 million. Depending on the reuse option yet to be selected, additional costs will be incurred but will not come close to a billion dollars.
Spokane River / Lake Spokane Dissolved Oxygen Water Quality Improvement Report Page C-20
12. The dischargers now help to algae bloom. Computer models show that we're gonna still have algae bloom.
Response: While there still may be algae blooms, the amount of the limiting nutrient causing those blooms (phosphorus) will be substantially reduced. In addition, not all algae blooms are toxic, so those occurrences will be reduced as well. See response to comment number 6, Part E.
13. The report is not peer reviewed. It's interesting, it has -- I used to be a regulator with the IDEQ that I always had to justify what I did. But this TMDL has an engineering, not engineering report, it's a report that sets the standards that says we can achieve these numbers by non-peer reviewed person…
Response: The TMDL and associated modeling reports have gone through extensive peer and public review over the past 11 years. See Appendix B of draft TMDL.
14. The impact of this analysis says we can meet 36 [µg/L total phosphorus] subject to fines of $32,000 a day and jail sentence and opens yourself up to all kinds of lawsuits by not meeting this 36 standard.
Response: See summary response to Parts N and R. Meeting the final permit limit may require a discharger to pursue actions such as nonpoint source reductions in addition to advanced wastewater treatment technologies. Ecology is confused where the fine amount was derived in this comment, which is not consistent with RCW 90.48.
15. It [TMDL] doesn't promote reuse. It's flawed. It's un-peer reviewed. There's no plans for non-point removal.
Response: See response to comment number 13 for Part E and summary response to Parts N, Q, and R related to target pursuit actions and nonpoint source removal.
Spokane River / Lake Spokane Dissolved Oxygen Water Quality Improvement Report Page C-21
F. General Statements of Support 1. My family and I take great joy in being able to play in this body of water but it’s always been
in the back of our minds that it is down stream of the Spokane waste water treatment facility and other polluters … I fear for my family's safety by letting them swim in this lake now! Let’s use some common sense, identify the shell game polluters are playing and get some reasonable actions in place to clean up this river… Let’s use some good science and common sense to put into effect a plan to fix this sick river. We owe it to our kids, wherever we live. You owe it to the citizens who put you in place through support of government to look out for our common interest.
Response: Comment noted.
2. My family and I are residents of Suncrest. I wanted to voice my concern about the Toxic algae bloom and insist that something be done to clean up the Spokane River! …The safety of my family and many others depends on your help and hard work. We appreciate your effort in this work. Thank you.
Response: Comment noted.
3. The upstream dischargers need to be held accountable for the phosphorus load they contribute to the Lake Spokane area.
Response: See summary response for Part R.
4. Spokane County appreciates the Department of Ecology's hard work on the Spokane River and Lake Spokane draft Water Quality Improvement Plan (draft TMDL). Overall, we are pleased with the draft TMDL, and appreciate that this plan includes capacity for the County's new regional water reclamation facility. We thank Ecology for allocating Avista a proportionate share of responsibility for improving water quality. Because the Lake Spokane reservoir was formed by Long Lake Dam, which is operated by Avista, it is reasonable and appropriate for Avista to participate in this water quality cleanup plan. We also thank Ecology for authorizing the use of target pursuit actions, including offsets and trading, as tools available to achieve compliance with the TMDL's objectives. Finally, we appreciate the TMDL's adaptive management approach, including the 10-year review process.
Response: Comment noted.
5. If this TMDL is not approved, we [City of Spokane Valley] will be in a situation where many of us will not be able to continue the economic growth in this region because of the lack of capacity. I feel that we need to move on. The process has been going on for long enough. We have addressed almost every question that has been brought forward in those meetings for that 18 months when we were working with Department of Ecology and EPA. And I think now is the time to move on.
Response: Comment noted.
6. Spokane County supports the implementation of the Spokane River Draft Water Quality Improvement Plan. After five years of debate over the TMDL, last summer the Center for
Spokane River / Lake Spokane Dissolved Oxygen Water Quality Improvement Report Page C-22
Justice delayed the implementation by another 13 months because of objections over the water quality modeling between Idaho and Washington and concerns about leaving Avista out of the plan. The objections raised by the Center for Justice have been resolved in this draft plan.
Response: Comment noted.
7. The new plan is scientifically and legally defensible. The new plan complies with Federal Clean Water Act by proposing the most stringent phosphorous standards in the nation. And the plan calls for a 94 percent reduction of phosphorous discharge for our region's treatment plants compared to historical levels of treatment. This means that over 99 percent of the phosphorous discharged by our residents and businesses will be removed by our treatment plants. Under this plan over 40,000 pounds per year of phosphorous will be removed from the Spokane River by the wastewater treatment plants.
Response: Comment noted.
8. The plan allows for a new regional treatment plant which will allow Spokane County to eliminate an additional 9,000 septic tanks that currently discharge 20 pounds of phosphorous per day or over 7,000 pounds per year into our aquifer and eventually the Spokane River.
Response: Ecology would like to clarify that the TMDL itself does not allow for a new county treatment plant (a permit is necessary for this) but it recognizes the need for additional treatment capacity for the Spokane area. This document anticipates the new plant by including those proposed flows in the modeling, improvement, and implementation plans.
9. In addition, the new Spokane County treatment plant will divert flows from the City of Spokane plant at least three years earlier than the City will implement tertiary phosphorous removal. This will reduce phosphorous into the Spokane River by 24 pounds per day, which is nearly 6,000 pounds per year.
Response: Comment noted.
10. This Water Quality Improvement Plan is critical to the well-being of the Spokane River and is essential to the economic vitality of our region. Further delay by any stakeholder would simply be irresponsible. Now is the time for Ecology to submit the plan, for EPA to approve the plan, and for the stakeholders in the region to implement it.
Response: Comment noted.
11. Liberty Lake Sewer District is the smallest of the water reclamation plants involved. It's unknown if our plant or anyone's will be able to meet all expectations. Nonetheless, Liberty Lake is committed to meeting the TMDL. The District will continue our commitment to environmental stewardship.
Response: Comment noted.
12. For the, most of the last decade, dozens of Inland Northwesterners, experts, engineers, environmentalists, regulators, scientists, and laymen like me have been meeting regularly searching for a solution. Every treatment plant, Spokane, Kootenai Counties, the Lands
Spokane River / Lake Spokane Dissolved Oxygen Water Quality Improvement Report Page C-23
Council, the tribes, the Sierra Club, Idaho's DEQ, Washington's DOE, the EPA, the cities and counties and others have participated, and now we're about to begin implementation. The proposed TMDL, as you know, is one of the most stringent in the entire country.
Response: Comment noted.
13. This TMDL will require a partnership comprised of everyone who lives here. Both what we put down the drain and how we live our lives will require attention as we work together to lessen our negative impact on your rivers and lake. Are we willing to use our in-sink garbage disposals less, manage pet wastes more responsibility. Will we change our damaging agricultural practices. De-icer is a serious problem. The TMDL will require extensive plans to remove non-point sources of phosphorous in addition to the state-of-the-art technology we'll all be installing for water treatment.
Response: Comment noted. See summary response for Parts N and R.
14. The river's worth it. The economic conditions affect us all. The cost of meeting these stringent regulations, though critical, is necessary. Outside resources will probably be necessary. Funding sources have been reduced due to the loss of the public works trust fund. Will we be able to afford the necessary costs, well, we'll have to. And we all will pay. Nonetheless, the [Liberty Lake] District will continue our commitment to environmental stewardship. And that commitment includes doing everything possible to meet the TMDL.
Response: Comment noted.
15. The time for further parsing is over. Everyone has had their opportunity for comment. It's time to move on. It is time for action and to advance the study forward into implementation so that we can quit wasting taxpayer dollars on further studies, and delays in construction to the county plant that has already doubled in cost due to past delays, and to provide the desired deliverable and start improving the dissolved oxygen condition in the river as soon as possible.
Response: Comment noted.
16. Sometimes we need to make sure that we recognize the success that this TMDL accomplishes. It does impose the most stringent standards in the nation. It does incorporate conservation. It incorporates reuse. It incorporates efforts in both point and non-point sources of contamination.
Response: Comment noted.
17. Together, all the regulators, all the local jurisdictions, we know we're pushing the envelope with regard to technology. And that's a good thing. We should be stretching it. And we should be doing the absolute best that we can. This TMDL gets us there. It's time to move forward. And we look forward to quick action as we move to the next step in protecting our river.
Response: Comment noted.
Spokane River / Lake Spokane Dissolved Oxygen Water Quality Improvement Report Page C-24
G. Idaho Sources / NPDES Permits Summary: The assumptions made in the TMDL regarding the Idaho wastewater treatment plants are not equitable. Commenters acknowledged that the assumptions used in the scenario development regarding the reduction in phosphorus loads from Idaho, assume roughly equivalent effluent concentrations of phosphorus, ammonia and CBOD, relative to similar Washington point sources, at the outfalls of the Idaho treatment plants. Commenters stated that such assumptions do not, but should, take into account the fact that the Idaho wastewater treatment plants are much further from Long Lake reservoir than are the Washington sources. Commenters stated that there is a difference in assimilative capacity that occurs throughout the riverine portion of this water body.
Commenters state that Idaho dischargers can be allocated a 100 µg/L phosphorus discharge without adversely affecting the wasteloads granted to Washington point sources or the obligations placed on Avista Utilities. Commenters referenced modeling conducted by LimnoTech, which demonstrates that the Idaho sources, if set at allocation assumptions of 100 µg/l and 200 µg/l would add to the overall decrease in dissolved oxygen attributed to Idaho dischargers by only 0.01 and 0.045 mg/L, respectively, which is less than 0.7 to 3% of the total dissolved oxygen decrease from all sources at the worst-case model segment. Commenters stated that Idaho should therefore be afforded 100 µg/L seasonal average permit values under a consistent TMDL and the resulting permitting approach by the U.S. Environmental Protection Agency. One commenter stated that the modeling results support an assumed range of TP allocations to the Idaho sources from 50 to 200 mg/L [possibly meant units of micrograms]. In addition, Idaho dischargers feel there are no similar incentives available to reduce nonpoint nutrient sources, or receive credits for conservation and reuse that are available to Washington dischargers under the Target Pursuit Actions.
Summary Response: Developing equitable allocations and loading assumptions for Washington and Idaho point sources is a core goal for this project. Ecology believes the assumptions regarding loading from sources in Idaho (which were developed jointly with EPA) and the load and wasteload allocations for sources in Washington are equitable in their consideration of treatment levels (discharge concentrations), population growth projections, achievability, and proportional responsibility, as discussed below.
Equity in effluent concentration for municipal sources Ecology believes it is fair and equitable to assume that Idaho point sources will be required by their NPDES permits to achieve the same effluent phosphorus concentration as similar Washington point sources (see the TMDL at Table 5 [Table 4 in draft TMDL]). This “equal effluent concentration” approach is one of several methods suggested for equitably distributing loading capacity among several point sources in EPA’s Protocol for Developing Nutrient TMDLs. None of the suggested approaches in the Protocol consider attenuation or geography (see Page 7-4). This is reasonable because phosphorus is a persistent pollutant in the environment. While phosphorus changes form in the aquatic environment (e.g., dissolved to/from particulate forms, inorganic to/from organic forms), total phosphorus is not readily removed from the system by physical, chemical, and biological processes.
Spokane River / Lake Spokane Dissolved Oxygen Water Quality Improvement Report Page C-25
Equity in population growth and effluent flow allowance Each facility’s assumed load is based on projected effluent flow rates for the year 2027. In the case of the Idaho dischargers, these flow rates were provided by the utilities themselves. Achievability and proportional responsibility As explained in the TMDL, Ecology recognizes that Long Lake impairments are caused both by upstream dischargers and by the Long Lake Dam, and has sought to develop a TMDL that assigns allocations (and responsibility for Avista) to dischargers that reflect proportional responsibility. Through this process, Washington point sources have received WLAs for phosphorus that are among the lowest ever required in a TMDL and are achieved only at the highest-performing wastewater treatment plants in the United States. Commenters state, however, that increasing the phosphorus concentrations for Idaho point sources relative to those assumed in the TMDL would result in small additional, incremental decreases in dissolved oxygen concentrations, and that “Idaho dischargers can be allocated (100 µg/L total phosphorus) without adversely affecting the wasteloads granted to Washington point sources or the obligations placed on Avista Utilities.” However, as explained below, this statement is contradicted by the modeling results referenced by the commenters.
Specifically, model runs submitted by the commenters predict that doubling the TMDL’s assumed loading of phosphorus for Idaho dischargers (the “TP = 100 µg/L scenario) will add to the overall dissolved oxygen decrease in Lake Spokane by 0.011 mg/L, and that quadrupling the assumed loading of phosphorus (the “TP = 200 µg/L scenario) will add to the overall dissolved oxygen decrease by 0.045 mg/L (see LinmoTech memo at Table 2). These additions to the overall dissolved oxygen decrease are significant, considering that the total impact of the Idaho pollution sources upon dissolved oxygen concentrations in lake Spokane, at the levels of discharge assumed in the TMDL, is generally less than or equal to 0.10 mg/L (see the final PSU report at Tables 14 and 15). These proposed increases in phosphorus loading will increase the Idaho dischargers’ impact upon dissolved oxygen concentrations by 11 – 45%, relative to the TMDL’s assumptions.
Therefore, if Idaho point sources discharged higher phosphorus concentrations than Washington point sources, the Idaho point sources would have a disproportionately large impact on dissolved oxygen. Avista Corporation and/or Washington point and non-point sources would be responsible for offsetting these additional dissolved oxygen decreases. Given that Washington dischargers have been assigned WLAs that are achieved only at the best-performing wastewater treatment plants in the United States, this approach would be neither feasible nor equitable. On the contrary, increasing Idaho’s phosphorus loads beyond those assumed in the TMDL would be inequitable to both the Washington dischargers and to Avista Corporation. The modeling presented by dischargers fails to demonstrate attenuation The modeling analysis presented by the commenters demonstrates that the additional, incremental impact of increased phosphorus upon dissolved oxygen in Lake Spokane is small relative to the total dissolved oxygen decrease from all sources in both States, which is a maximum of 1.4 mg/L (see PSU 2009 at Page 21). However, the analysis presented does not demonstrate that phosphorus or its impact upon dissolved oxygen in Lake Spokane is significantly attenuated between the Idaho
Spokane River / Lake Spokane Dissolved Oxygen Water Quality Improvement Report Page C-26
dischargers’ outfalls and Lake Spokane. That is, the commenters’ analysis does not investigate whether increases in phosphorus loads equivalent to those they propose for Idaho sources would not cause similar dissolved oxygen decreases, if they were allowed to occur at a source located closer to Lake Spokane (e.g. the City of Spokane’s AWWTP). While it is theoretically possible to quantify the attenuation of phosphorus (if any) for each of the point sources along the Spokane River, the commenters did not conduct this analysis. As a result, there is no technical basis for an increase in Idaho phosphorus concentrations to the commenters’ recommended values (100 µg/L or 200 µg/L). Ecology and EPA disagree with the statement that there is a relevant “difference in assimilative capacity that occurs throughout the riverine portion of this waterbody.” The goal of the TMDL is to achieve water quality standards for dissolved oxygen in Lake Spokane. All anthropogenic sources of phosphorus to the Spokane River upstream of Lake Spokane contribute to dissolved oxygen depletion in Lake Spokane, regardless of whether those sources are located in Idaho or Washington. Thus, there is a single, aggregate assimilative capacity for oxygen demanding pollution (i.e. phosphorus, ammonia, and CBOD) from all anthropogenic sources in both Idaho and Washington. In summary, Ecology believes the proposed TMDL assumptions for Idaho sources and WLAs for Washington sources provide a more equitable plan for point sources than the commenters’ modeling proposals. The equal discharge concentration approach used in the TMDL sets aside an equitable portion of the assimilative capacity for each point source, including those in Idaho, and is consistent with EPA guidance for equitably allocating loading capacity to point sources in nutrient TMDLs.
Modeling Idaho point source dissolved oxygen impacts Modeling that separates the impacts of Idaho dischargers (described further below) shows that, when the whole lake is considered, half of the 0.2 mg/L human-caused dissolved oxygen decrease allowed by the applicable water quality standard is taken by Idaho sources’ impacts alone in certain reservoir segments during the most critical months. Without the incorporation of Avista, there would be no loading capacity for oxygen-demanding pollution available for point source dischargers. The incorporation of Avista’s dissolved oxygen responsibility in this latest TMDL effort creates enough loading capacity to allow for slightly higher point source wasteload allocations than in past drafts (which were around 10 µg/L total phosphorus).
Contrary to comments that follow, the Idaho dischargers’ impact on dissolved oxygen levels in Washington is not minimal when one considers the impact of the Idaho sources relative to the Washington dissolved oxygen standard for Lake Spokane. The Washington standard allows only a 0.2 mg/L decrease from all human actions considered cumulatively (WAC 173-201A-200(i)(d)(ii)). This includes Washington and Idaho sources combined. Idaho’s impact upon dissolved oxygen levels in Lake Spokane, once the reductions in pollution assumed in the TMDL have occurred, is a decrease of up to 0.10 – 0.15 mg/L. Therefore, the dissolved oxygen decrease caused by the Idaho dischargers can be as much as 50 – 75% of the maximum decrease allowed by the standards, even after the reductions assumed in the TMDL have occurred. The above quantification of the Idaho sources impact upon dissolved oxygen in Lake Spokane was based on the “Idaho only” source assessment modeling scenario described in the final PSU report.
Spokane River / Lake Spokane Dissolved Oxygen Water Quality Improvement Report Page C-27
In this scenario, all Washington pollution sources (point sources, stormwater, CSOs, groundwater, and tributaries) were set to the same conditions as the no source modeling scenario, which estimates the natural condition of the watershed by eliminating all human-caused point and non-point sources of pollution. All Idaho sources (Coeur d'Alene, Hayden, Post Falls, and stormwater) were set to the same conditions as the TMDL alternative #1 modeling scenario, which incorporates the assumptions about Idaho loading that were made in the draft TMDL. See the PSU (2009) at Page 24. In general, the dissolved oxygen decrease in Lake Spokane resulting from only the Idaho pollution sources is 0.10 mg/L or less, although there was one instance where the dissolved oxygen decrease was 0.15 mg/L. See the final PSU report at Tables 14 and 15. Dissolved oxygen decreases caused by current (or currently permitted) discharges from the Idaho point sources would be much larger. Modeling conducted in support of the draft Idaho NPDES permits issued for public review by EPA in February 2007 predicted that the levels of discharge allowed by the 1999 permits (which are currently administratively continued under 40 CFR 122.6) could decrease dissolved oxygen concentrations in Lake Spokane by as much as 1.1 mg/L at certain depths and by 0.43 mg/L as an average over the depth of the lake, which is greater than the 0.2 mg/L dissolved oxygen decrease allowed by the applicable water quality criterion (Cope 2006). Therefore, the Idaho dischargers impact on dissolved oxygen levels in Washington’s Lake Spokane is not minimal as demonstrated through the “Idaho only” scenario (PSU 2010). TMDL tools / additional modeling Ecology cannot offer tools such as the Target Pursuit Actions (which are available to Washington point sources) to the Idaho point sources. However, EPA may consider such tools in the development of its permits.
Rather than conduct individual modeling of alternative wasteload allocations, which are described above, Ecology recommends Idaho and Washington dischargers work together and with Avista to develop alternative scenarios that demonstrate an equivalent impact on dissolved oxygen in all of Lake Spokane as found in modeling scenario #1 (this suggestion has been made on several occasions to the dischargers, starting with a letter from Ecology dated August 11, 2009).
Alternatively, Idaho dischargers may separately develop an alternative scenario specific to Idaho sources, which demonstrates an equivalent impact on dissolved oxygen as found in the Idaho only source assessment scenario. Without such cooperation, Ecology and EPA cannot consider new permit limits that place a disproportionate burden on the other dischargers and Avista.
1. Idaho dischargers have minimal impact on dissolved oxygen levels in Washington.
Response: See summary response for Part G.
2. The Draft Report states that "EPA will incorporate permit limits, consistent with the assumptions in this TMDL, into the NPDES permits for Idaho point source dischargers."' Whose assumptions are being incorporated into Idaho NPDES permits? The State of Washington's.
Response: As stated on Page 29 of the draft TMDL, EPA and Ecology jointly developed the TMDL’s assumptions regarding loading from sources in Idaho. These assumptions, considered cumulatively with the load and wasteload allocations for Washington sources,
Spokane River / Lake Spokane Dissolved Oxygen Water Quality Improvement Report Page C-28
and with improvements required of Avista, will ensure compliance with Washington’s water quality criterion for dissolved oxygen in lakes and reservoirs (WAC 173-201A-200(1)(d)(ii)). Under federal regulations, EPA must issue NPDES permits that are consistent with these assumptions in order to ensure compliance with 40 CFR 122.4(d), which requires that NPDES permits be conditioned to ensure compliance with the applicable water quality requirements (in this case WAC 173-201A-200(1)(d)(ii)) of all affected States.
3. The TMDL mentions that EPA issues NPDES permits in Idaho and leans on EPA to issue these permits in concordance with the Washington TMDL. It seems incumbent on EPA, at this point, to provide assurance to this effect in any approval issued of the Washington TMDL.
Response: Federal regulations governing the issuance of NPDES permits require that permits be conditioned to ensure compliance with the applicable water quality requirements of all affected States (40 CFR 122.4(d)). This regulation applies regardless of whether the waters of the downstream state’s are impaired, whether the downstream state has prepared a TMDL for those waters, or what is stated or assumed in such a TMDL. Because effluent limits that ensure compliance with Washington’s water quality standards are independently required by federal regulations, it is not necessary for EPA to provide assurance of this in the TMDL approval.
4. The loading allowances granted for the Idaho discharger should be clearly presented in the TMDL as it provides important information about boundary conditions for developing the 2009 Draft TMDL.
Response: Ecology agrees with the commenters that it would be useful and appropriate for the draft TMDL to be more specific about the assumptions made about the amounts of oxygen-demanding pollution being discharged in Idaho. However, for the reasons stated in the response to comment number 13, Part G, it is not possible or practical to express the assumptions as loadings of phosphorus, ammonia, and CBOD at the state line. Therefore, the figures cited below are the amounts of pollutants assumed to be discharged in Idaho (i.e. the inputs, for Idaho sources, to the TMDL alternative #1 model scenario).
All of the assumed anthropogenic loading of these pollutants in Idaho comes from point sources (wastewater treatment plants and stormwater). Lake Coeur d’Alene is the model’s upstream boundary, and is assumed to be at natural background conditions. There are no significant surface water tributaries to the Spokane River in Idaho, and the river loses flow to groundwater in Idaho.
The total assumed anthropogenic loading of phosphorus, CBOD5 and ammonia from Idaho point sources are 7.2 lb/day, 497 lb/day, and 94.4 lb/day, respectively. These figures include 2.4 lb/day, 23 lb/day, and 0.4 lb/day of phosphorus, CBOD5, and ammonia, respectively, from stormwater. The assumptions for individual sources can be found in Table 2 of PSU (2009). The assumed Idaho point source loads (including stormwater) account for 18 percent of the phosphorus, 15 percent of the CBOD5, and 24 percent of the ammonia discharged by all of the point sources in both states (including stormwater and combined sewer overflows), under the TMDL’s wasteload allocations (which are listed in Table 4 of the TMDL) and assumptions. Ecology has edited the “Loading from Sources in Idaho” section of the TMDL to include these figures.
Spokane River / Lake Spokane Dissolved Oxygen Water Quality Improvement Report Page C-29
The dissolved oxygen sag predicted to result from these assumed Idaho pollutant loads is shown in Tables 14 and 15 of PSU (2009) (the Idaho only source assessment scenario results).
5. It is inappropriate to base wasteload permitted discharges on a technologically based target that lacks consensus and peer review [referring to Appendix J].
Response: Ecology assumes that the commenter is referring to the discussion of wastewater treatment plant performance for phosphorus removal in Appendix J to the draft TMDL. See summary response for Part R related to Appendix J. Ecology has the discretion to establish phosphorus wasteload allocations and to make reasonable assumptions about future reductions in phosphorus from Idaho in the TMDL, provided that these wasteload allocations and assumptions ensure compliance with water quality standards and federal TMDL regulations at 40 CFR 130.7. It is reasonable for Ecology to consider the performance of existing high-performing wastewater treatment plants when establishing wasteload allocations and when making assumptions about future reductions in phosphorus loading from Idaho.
6. The assumptions used in the scenario development regarding the reduction in phosphorus loads from Idaho do not, but should, take into account this difference in assimilative capacity that occurs throughout the riverine portion of this waterbody.
Response: See summary response for Part G.
7. The draft plan contains no identification of how much pollution is coming across the stateline from Idaho, no identification of the total loading from the tributaries, and no identification of the total amount that the Spokane River and Little Spokane can handle. Contrast this draft with the 2004 TMDL, which Sierra Club approved of, which provided a month by month allocation of acceptable pollution levels.
Response: See response to comment number 4, Part G.
8. IDEQ intends to work with EPA to ensure that, to the extent allowed by applicable law, Idaho dischargers are afforded the same or equivalent options to meet permitted constituent goals. In addition, Idaho will work with EPA to ensure there is an opportunity for Idaho to allocate responsibility for any needed phosphorus reductions between sources in Idaho in a manner which is reasonable and achievable and reflects the financial and technological capabilities of Idaho sources.
Response: Comment noted.
9. Please provide some definition or guidance on what factors are considered to meet these criteria of equitable distribution. It is not clear how it is "equitable" to give the largest dischargers, the City of Spokane and the City of Spokane Valley, WLAs based on 42 µg/L TP while, based upon the modeling, all the Idaho dischargers will presumably have their permitted mass loadings based on 36 µg/L TP. This appears to be a significant concept used in the TMDL strategy and yet is never adequately described in the document.
Spokane River / Lake Spokane Dissolved Oxygen Water Quality Improvement Report Page C-30
Response: See summary response for Part R. The phosphorus wasteload allocations (WLAs) for all Washington non-stormwater point sources except Kaiser Aluminum and the phosphorus loading assumptions for all non-stormwater Idaho point sources were based on the assumption that the phosphorus effluent limits for all of those sources would be a monthly average limit of 50 µg/L total phosphorus. See the draft TMDL at Page 19 and the PSU, 2009 at Table 2. In general, NPDES regulations require that effluent limits for continuous discharges be stated as average monthly discharge limitations (40 CFR 122.45(d)).
Ecology believes it is equitable to assign seasonal average phosphorus wasteload allocations, and to make assumptions about loading of phosphorus in Idaho, based on the assumption that all of the non-stormwater point sources, except Kaiser Aluminum, would have the same monthly average effluent limits (50 µg/L). As stated on Pages xi and 27 of the draft TMDL and the summary response to Part R, the differences among the WLAs and loading assumptions for these sources are due to differences in the sampling frequency expected to be required in the NPDES permits for these sources. The slight differences in the WLAs and loading assumptions are explained in detail below.
An “average monthly discharge limitation” is defined as “the highest allowable average of ‘daily discharges’ over a calendar month, calculated as the sum of all ‘daily discharges’ measured during a calendar month divided by the number of ‘daily discharges’ measured during that month.” (40 CFR 122.2) Because effluents are not constant, facilities must have a long-term average discharge that is less than their average monthly discharge limitation, in order to consistently comply with that limit. See the Technical Support Document for Water Quality-based Toxics Control or TSD (EPA/505/2-90-001) at section 5.3.1 and figure 5-3. To ensure that the model and the TMDL were realistic, Ecology used the long-term average phosphorus levels expected to result from compliance with average monthly discharge limitations of 50 µg/L total phosphorus as both the modeling inputs and the wasteload allocations, rather than using the expected permit limit directly as the model input (see the final PSU report at Table 2).
The degree that a facility’s long term average discharge must be less than the average monthly discharge limitation, in order to ensure compliance with such a limit, depends on the effluent variability and the sampling frequency. In the draft TMDL, all of the point sources were assumed to have the same effluent variability, specifically, a coefficient of variation or relative standard deviation of 0.6 (see the final PSU report at Table 2). On Page E-3, the TSD states that, when effluent variability is unknown, one possible approach “is to use a conservative estimate of the CV that assumes relatively high variability (e.g. CV = 0.6)….” If two facilities with similar effluent variability each have an average monthly discharge limitation of 50 µg/L, and one facility samples less frequently than the other, the facility that samples less frequently must achieve a lower long term average discharge, in order to consistently comply with the average monthly discharge limitation. This is because the small number of samples from which that facility’s monthly average is calculated may have been taken on days when the discharge concentration was relatively high. If a facility samples every day, there is less uncertainty, so such a facility can operate closer to their effluent limit and maintain compliance. This is why the city of Spokane and Spokane County have slightly higher WLAs than other dischargers.
Spokane River / Lake Spokane Dissolved Oxygen Water Quality Improvement Report Page C-31
Specifically, Ecology assumed that the city of Spokane and Spokane County would be required to sample for phosphorus daily and that the other, smaller facilities would be expected to sample 10 times per month (2-3 times per week). The estimated monthly average permit limits (50 µg/L except for Kaiser) were translated to seasonal average WLAs or loading assumptions, which are the same as the model inputs, by dividing the estimated monthly average permit limit by the “estimated limit factors” in Table 2 of the final PSU report. The estimated limit factors are estimates of the ratios of the long term average discharge level to the average monthly discharge limitation. For all facilities except for the City of Spokane and Spokane County are 1.4, corresponding to a seasonal average WLA or loading assumption of 36 µg/L. 1 The estimated limit factors for the city of Spokane and Spokane County are 1.2, corresponding to a seasonal average WLA of 42 µg/L. 2 As stated in Table 2 of the PSU modeling report, the source of the limit factors is Table 5-2, on Page 103 of the TSD. In the TSD, these factors are called long term average (LTA) multipliers. The LTA multiplier for 10 samples per month and a CV of 0.6 is 1.38; for 30 samples per month and a CV of 0.6, it is 1.19. The limit factors in the final PSU report have been rounded to two significant figures. The slightly smaller estimated limit factors and in turn the slightly larger model inputs and wasteload allocations for the city of Spokane and Spokane County reflect the reduced uncertainty inherent in a larger number of samples.
The required phosphorus sampling frequencies and the averaging periods for phosphorus effluent limits will be established in the NPDES permits in compliance with NPDES regulations (40 CFR 122.44(i), 122.45(d) and (e)). The required sampling frequencies and the averaging periods for the phosphorus effluent limits in the NPDES permits may differ from the assumptions described above. However, the WLAs for Washington point sources and the assumed loadings for Idaho point sources cannot be modified solely due to a sampling frequency that differs from the assumed frequencies discussed above. The model inputs for each point source are equal to the WLAs for Washington sources and to the loading assumptions for Idaho sources. The assumed sampling frequency was a factor in the calculation of these model inputs. However, once the model inputs are established, the results of a model run that uses such inputs are unique to those specific inputs. Any change to the WLAs or the loading assumptions (resulting from a change to sampling frequency or any other change) would require additional model runs to quantify the impact of such changes, to ensure that such revised WLAs and loading assumptions would ensure compliance with water quality standards for dissolved oxygen in Lake Spokane.
10. …it would still be useful to see how anticipated [Idaho NPDES] limits, expressed as concentration and pounds per day, fit in with the overall waste load allocations.
Response: See response to comment number 9, Part G.
11. The Draft Report cannot, and should not, apply beyond the borders of Washington.
1 50 ÷ 1.4 = 36
2 50 ÷ 1.2 = 42
Spokane River / Lake Spokane Dissolved Oxygen Water Quality Improvement Report Page C-32
Response: Ecology has established this TMDL to address impaired water bodies wholly within the state of Washington. The TMDL is established at a level to implement the applicable Washington state water quality standards and contains wasteload and load allocations for point and nonpoint sources within the state of Washington. Page 28 of the draft TMDL explicitly states that “Ecology lacks the authority to establish wasteload allocations for sources outside the state of Washington.”
However, NPDES permits for point sources in Idaho must include conditions that ensure compliance with the applicable water quality requirements (including water quality standards) of all affected states (40 CFR 122.4(d)). Modeling has shown that dissolved oxygen levels in Lake Spokane are affected by discharges of phosphorus, ammonia and CBOD by dischargers in Idaho (see Cope 2006 and PSU 2010). Therefore, NPDES permits for point sources discharging nutrients and oxygen-demanding pollution to the Spokane River in Idaho must include conditions that ensure compliance with both Idaho and Washington water quality standards.
It is reasonable for Ecology to assume for the purpose of establishing this TMDL for Washington waters that EPA will issue permits to the Idaho dischargers which include effluent limits as stringent as necessary to ensure compliance with Washington’s water quality standards, as required by federal regulations and the Clean Water Act (40 CFR 122.4(d), 122.44(d)(1), Clean Water Act Section 301(b)(1)(C)). The TMDL’s assumptions provide EPA, as the permitting authority for Idaho, with a technical basis to calculate such effluent limits.
12. Therefore, Idaho should be afforded 100 µg/L seasonal average permit values under a consistent TMDL and the resulting permitting approach by the U.S. Environmental Protection Agency ("EPA").
Response: See summary response for Part G.
13. The Draft Report should be limited to one determination with respect to the State of Idaho: to set a maximum wasteload allocation at the Washington-Idaho border.'
Response: As stated on Page 28 of the draft TMDL, “Ecology lacks the authority to establish wasteload allocations for sources outside the state of Washington. Therefore, this TMDL does not include specific load or wasteload allocations for Idaho sources.” As stated on Page 29 of the draft TMDL, “because EPA will develop and issue NPDES permits for Idaho point sources, Ecology worked closely with EPA to develop very specific assumptions about the anticipated permit-driven reductions of anthropogenic loading of phosphorus, CBOD, and ammonia from wastewater treatment plants and stormwater in Idaho.”
Under different circumstances, it may have been appropriate for Ecology to establish a single loading assumption for the amount of human-caused pollution present at the Washington-Idaho border. However, it is not possible or practical to make such an assumption in this case, for the reasons described below.
Most importantly, the goal of the TMDL is to attain water quality standards for dissolved oxygen, and, as explained in response number 11, Part G, modeling has shown that dissolved
Spokane River / Lake Spokane Dissolved Oxygen Water Quality Improvement Report Page C-33
oxygen concentrations in Lake Spokane are much more sensitive to loading of nutrients and CBOD than the state line. In other words, the Idaho dischargers, like all human sources of nutrient and oxygen-demanding pollution located upstream from Lake Spokane, exert their greatest influence upon dissolved oxygen concentrations in Lake Spokane.
Furthermore, more than one pollutant impacts dissolved oxygen levels in Lake Spokane and at the Idaho-Washington border. Phosphorus, ammonia, and CBOD all contribute to dissolved oxygen depletion in Lake Spokane. Therefore, at least three load allocations at the Washington-Idaho border would be necessary (one for each contributing parameter).
It is not practical in this case even to establish three loading assumptions (one each for phosphorus, ammonia and CBOD) at the Washington-Idaho state line, for several reasons. First, phosphorus, ammonia, and CBOD are processed by natural phenomena (which are simulated in the CE-QUAL-W2 model) as they travel downstream from the points of discharge, and the CE-QUAL-W2 model simulates these processes. Thus, the increase in loading of phosphorus, ammonia, and CBOD, relative to natural conditions, as measured or modeled at the state line, would not be equal to the loads of these parameters discharged in Idaho. Second, it is necessary in this case to require very low levels of discharge of oxygen-demanding parameters in order to ensure compliance with water quality standards on a cumulative basis. Third, the relevant water quality standard for dissolved oxygen is linked to natural background conditions, but natural background concentrations and loadings of oxygen-demanding parameters are not constant over time. Because of the “processing” of discharged pollution that occurs between the points of discharge and the state line, the fact that very low levels of discharge must be required in order to meet water quality standards, and because natural background concentrations and loadings of the relevant parameters are not constant over time, the increase in phosphorus, ammonia, and CBOD at the Washington-Idaho border, relative to natural conditions, would be impossible to measure.
Therefore, it is reasonable and appropriate for Ecology to make assumptions in the TMDL regarding the loads of phosphorus, CBOD, and ammonia that will be discharged in Idaho, because establishing a single, or even three, loading assumptions at the Washington-Idaho border would not necessarily provide assurance that water quality standards would be met in Lake Spokane. Furthermore, it would be impossible to determine through monitoring if the assumptions were being met.
The impact of these loading assumptions upon dissolved oxygen concentrations in Lake Spokane is quantified by the “Idaho only” source assessment modeling scenario (see PSU (2009) at Tables 14 and 15). As stated in the response to comment number 31, Part G, Ecology would accept NPDES permit limits for Idaho point sources which did not reflect the limits assumed in Table 2 for Idaho point sources, as long as the revised limits did not increase the dissolved oxygen sag in Lake Spokane attributable to the Idaho point sources relative to the TMDL alternative #1 modeling scenario, as quantified by the “Idaho only” source assessment model run.
14. Ecology's determination of what should be the maximum wasteload allocation at the Washington-Idaho border has an important limitation. The restriction should be no more than would be required to satisfy the State of Washington's water quality standards at the border.
Spokane River / Lake Spokane Dissolved Oxygen Water Quality Improvement Report Page C-34
Response: The force of 40 CFR 122.4(d) is not limited to the effects of an upstream state’s point sources upon water quality at the state line, or to water quality requirements that apply at the state line. Rather, this regulation requires permit conditions that ensure compliance with all of “the applicable water quality requirements of all affected States.” Therefore 40 CFR 122.4(d) does not apply exclusively at the nearest downstream state border, rather, it applies anywhere within any state where a given point source has an effect on water quality.
Modeling has shown that Lake Spokane is more sensitive than the state line to loading of nutrients and oxygen demand from sources in Idaho (Cope 2006). Thus, effluent limitations that satisfy the state of Washington’s water quality standards at the state line would likely not ensure compliance with water quality standards in Lake Spokane. Such effluent limits would therefore not comply with 40 CFR 122.4(d).
15. The decision as to what is an equitable distribution between Washington and Idaho is made by the state of Washington without any meaningful consideration of input from the state of Idaho. Idaho Department of Environmental Quality (IDEQ) representatives have made Ecology's lack of meaningful consideration of the state of Idaho's input abundantly clear on numerous occasions at public meetings during the TMDL process over the past twelve months.
Response: As stated on Page 29 of the draft TMDL, “Ecology worked closely with EPA to develop very specific assumptions about the anticipated permit-driven reductions of anthropogenic loading of phosphorus, CBOD, and ammonia from wastewater treatment plants and stormwater in Idaho.” Thus, the assumptions about loading from Idaho were jointly developed by EPA (which is the NPDES permitting authority for Idaho) and Ecology.
However, IDEQ and other Idaho stakeholders (e.g. the Idaho dischargers) were given numerous opportunities to provide input on the modeling scenarios and the draft TMDL in general. These opportunities for input included routine modeling conference calls during TMDL development that were attended by staff from IDEQ as well as Ecology and EPA, as well as numerous public and stakeholder meetings listed on Page 65 of the draft TMDL, in addition to the public comment period.
After considering all of the input from stakeholders given prior to issuance of the draft TMDL, including those representing Idaho interests, Ecology chose the “TMDL #1” modeling scenario (with corresponding assumptions regarding Idaho sources) as the basis for the TMDL, for the reasons explained on Page 21 of the draft TMDL.
16. This [draft TMDL] is an unfair and wasteful allocation of [Northern Idaho] public improvement dollars.
Response: NPDES permits for all point source dischargers must be conditioned to ensure compliance with the applicable water quality requirements (including water quality standards) of all states whose waters are affected by those dischargers (40 CFR 122.4(d)). This requirement is not unique to the Spokane River or to the states of Idaho and Washington.
Spokane River / Lake Spokane Dissolved Oxygen Water Quality Improvement Report Page C-35
Ecology does not agree that it is “wasteful” to spend public dollars to improve wastewater treatment facilities. This expenditure is necessary in order to comply with Washington’s water quality standards, as required by federal law (40 CFR 122.4(d)). Cost is not a factor in the calculation of effluent limits based upon water quality standards (40 CFR 122.44(d)(1), Clean Water Act Section 301(b)(1)(C)). As explained in the response to comment number 5 for Part G,
Ecology has assumed that the Idaho dischargers’ NPDES permits will require similar levels of phosphorus, ammonia, and CBOD as those required of the Washington dischargers, and Ecology believes this is a reasonable and fair assumption. It is no more costly or difficult for an Idaho discharger to attain a given effluent concentration of phosphorus than it is for a Washington discharger to attain that same effluent concentration.
17. Cal l ing fo r "equ iva len t" concentrations at the outfalls of the plants does not account for
the geography that the Idaho plants are much further from Long Lake reservoir than are the Washington sources.
Response: See summary response for Part G.
18. Ecology, through the TMDL process and its Draft Report, has looked upstream to their Idaho neighbors to bear the remedy disproportionately.
Response: See summary response for Part G.
19. Idaho dischargers can be allocated a phosphorus wasteload equivalent to a 100 microgram per liter (µg/L) discharge without adversely affecting the wasteloads granted to Washington point sources or the obligations placed on Avista Utilities ("Avista").
Response: See summary response for Part G.
20. The PSU modeling includes additional modeling for Idaho dischargers. The results from this modeling are not discussed anywhere in the TMDL. In response to these comments Ecology should explain how the PSU modeling results were used to arrive at the “specific assumptions” about Idaho discharge permits.
Response: See summary response for Part G.
21. Ecology in response to these comments should also acknowledge that the PSU modeling demonstrates that Idaho discharges do not cause or contribute to a violation of pH or dissolved oxygen criteria at the state line (PSU Report, Fig. 6) and at model segment 154 (PSU Report, Fig, 9). As shown in Fig. 9, there is no difference between dissolved oxygen levels at model segment 154 comparing the No Source Scenario and Idaho only dischargers under Scenario #1.
Response: Ecology acknowledges that, at the levels of discharge assumed in the draft TMDL, which represent substantial reductions from current loads, the Idaho dischargers do not cause or contribute to excursions above Washington’s water quality standards at the
Spokane River / Lake Spokane Dissolved Oxygen Water Quality Improvement Report Page C-36
state line, nor do they cause or contribute to excursions below Washington’s water quality standards for dissolved oxygen at model segment 154 (near Nine Mile dam).
However, the PSU (2009) report shows that, even at the reduced levels of discharge assumed in the draft TMDL, the Idaho dischargers, by themselves, cause a dissolved oxygen decrease of up to 0.1 – 0.15 mg/L in Lake Spokane, which is 50 – 75% of the cumulative human-caused dissolved oxygen decrease allowed in lakes and reservoirs by the Washington water quality standards (WAC 173-201A-200(1)(d)(ii)). Furthermore, previous modeling has shown that the Idaho dischargers, at the levels of discharge allowed by their currently effective NPDES permits (which were issued in 1999 and have been administratively continued under 40 CFR 122.6) do, in fact, cause or contribute to nonattainment of Washington’s water quality standards for dissolved oxygen and pH at the state line in addition to excursions below water quality criteria for dissolved oxygen in Lake Spokane (Cope 2006). Therefore, the Idaho dischargers have the reasonable potential to cause or contribute to excursions below Washington’s water quality standards for dissolved oxygen, and federal regulations thus require that NPDES permits for the Idaho dischargers include water quality-based effluent limits for phosphorus, CBOD, and ammonia, which influence dissolved oxygen in waters of the state of Washington (40 CFR 122.4(d), 40 CFR 122.44(d)(1)(i – iii)). See also the response to comment number1, Part G.
22. Ecology should explain whether it believes that the results [LimnoTech and PSU Idaho source assessment scenario modeling] would be any different in comparing the No Source results with Idaho only dischargers under Scenario #2. Ecology should also explain how it is reasonable and equitable to impose unachievable load allocations on Idaho when Idaho dischargers are not responsible for measurable or modeled increase in dissolved oxygen at the riverine assessment point.
Response: Ecology has chosen the TMDL #1 modeling scenario as the basis for the draft TMDL, for the reasons explained on Page 21 of the draft TMDL. Source assessment model scenarios, including the “Idaho only” source assessment scenario, were conducted only to assess the effects of various sources under the TMDL #1 scenario.
Since the TMDL #2 scenario included larger phosphorus loads than TMDL #1, Ecology expects that the Idaho dischargers’ impact upon dissolved oxygen in Lake Spokane, under scenario #2, would be marginally greater than the impact under scenario #1, but no model run was conducted to determine exactly how much greater the Idaho dischargers’ impact would be under scenario #2 relative to scenario #1.
23. At higher assumed TP allocations for Idaho sources, modeling conducted by LimnoTech, demonstrates the Idaho sources set at allocation assumptions of 100 µg/L and 200 µg/L would add to the overall decrease in DO attributed to Idaho dischargers by only .011 and .045 less than 0.7 to 3% at the worst case depth (187 for Scenario #1 as modeled by PSU) and critical depth (188 for Idaho only scenarios of 100 and 200).
Response: See summary response for Part G.
24. Ecology has ignored the PSU report which demonstrates that Idaho sources under Scenario #1 contribute to improved DO at the critical depth and demonstrates that the application of
Spokane River / Lake Spokane Dissolved Oxygen Water Quality Improvement Report Page C-37
Scenario #1 allocations to Idaho is not equitable for Idaho. Ecology should not arbitrarily disregard their own modeling results.
Response: The state of Washington’s approved water quality criterion for dissolved oxygen in lakes reads, “for lakes, human actions considered cumulatively may not decrease the dissolved oxygen concentration more than 0.2 mg/L below natural conditions” (WAC 173-201A-200(1)(d)(ii)). This criterion does not apply exclusively at some “critical depth,” rather, it applies to the entire volume of the lake or reservoir. If dissolved oxygen anywhere within the lake or reservoir is decreased more than 0.2 mg/L below natural conditions, the criterion is not attained.
At depths below 8 meters, the Idaho dischargers, like other anthropogenic sources of phosphorus, ammonia, and CBOD, decrease dissolved oxygen in Lake Spokane relative to the natural condition. See PSU (2009) at Tables 14 and 15. The Idaho dischargers therefore have the reasonable potential to cause or contribute to nonattainment of dissolved oxygen criteria in Lake Spokane and must have water quality-based effluent limits for phosphorus, ammonia, and CBOD that are based on Washington’s water quality standards (40 CFR 122.4(d), 122.44(d)(1)(i – iii)). The fact that Idaho dischargers contribute to increased dissolved oxygen at certain water depths is irrelevant.
25. Idaho sources do not cumulatively or independently contribute to a decrease in DO at the critical depth under Scenario #1; they contribute to an increase or improvement in DO.
Response: See summary response for Part G and response to comment number 24, Part G.
26. Ecology needs to reassess the assumed Scenario #1 allocations for Idaho sources based on the PSU modeling results and the LimnoTech modeling results…The modeling results support an assumed range of TP allocations to the Idaho sources from 50 to 200 mg/l.
Response: See summary response for Part G.
27. During the development of the water quality modeling it was understood that Idaho dischargers would have a higher seasonal average than Washington dischargers except Inland Empire Paper Company which would have the same seasonal average as Idaho dischargers and Kaiser Aluminum which would have a lower seasonal average [Exhibit 6 of City of Coeur d’ Alene letter]. Ecology should explain why this essential assumption was abandoned in the final modeling specifications.
Response: The commenter is correct that, as of April 3, 2009 (the date of Exhibit 6 to the City of Coeur d’Alene’s comment letter), Ecology was considering running a modeling scenario that would have set phosphorus levels for the Idaho point sources and Inland Empire Paper at 50 µg/L total phosphorus, and 35 µg/L for all other Washington point sources (this was referred to as “Scenario #2”). The exhibit does not specify the averaging period associated with these figures (e.g. seasonal or monthly).
However, the other modeling scenario being considered at that time, “Scenario #1,” would have included equal phosphorus concentrations of “50 µg/L for all sources except Kaiser,” which would have had a wasteload allocation of 35 µg/L. The “TMDL alternative #1” scenario described in the Spokane River Modeling Scenarios Report 2009 and used to
Spokane River / Lake Spokane Dissolved Oxygen Water Quality Improvement Report Page C-38
develop the draft TMDL is very similar to the “Scenario #1” scenario described in the exhibit. Under “TMDL alternative #1,” all of the point sources, except Kaiser, have an “estimated TP limit” of 50 µg/L, except Kaiser, whose “estimated TP limit” is 35 µg/L (see PSU (2009) at Table 2).
Ecology decided to base the wasteload allocations for Washington point sources and the assumptions regarding Idaho point sources on the “TMDL alternative #1” modeling scenario for the reasons explained on Page 21 of the draft TMDL. Although higher phosphorus levels for Idaho sources and Inland Empire Paper, relative to Washington sources, were considered during TMDL development, as explained in the response to comment number 5 for Part G, Ecology decided it would not be fair or equitable to assume that the Idaho dischargers or Inland Empire Paper could discharge more phosphorus, on a concentration basis, than similar sources in Washington. See summary response for Part G related to additional modeling.
28. The Idaho allocation improperly assumes that effluent offsets are available in Idaho.
Response: Ecology chose to base the draft TMDL on the TMDL #1 modeling scenario, including the corresponding assumptions for Idaho sources, for the reasons stated on Page 21 of the draft TMDL. The availability or non-availability of offsets was not a factor in this decision. The draft TMDL does not state that Ecology assumes that effluent offsets are available in Idaho and Ecology has made no such assumption. As stated in the summary response to Part R, Ecology and EPA believe that the loading assumptions for phosphorus, for the Idaho dischargers, in the draft TMDL are, in fact, achievable with available technology.
29. In response to these comments Ecology should explain whether the use of effluent offsets was a factor is selecting Scenario #1 as the basis for the TMDL. Since the allocations of 36 µg/L are not achievable with known technology, the allocations must assume that allocations will only be achievable through technology and nonpoint source reduction.
Response: See summary response to Part G and response to comment number 28, Part G.
30. Ecology should explain how effluent offsets are available to Coeur d’Alene and how offsets are factored into the “very specific assumptions” Ecology and EPA have made about the Idaho discharger permits.
Response: See response to comment number 28, Part G.
31. Ecology improperly rejected EPA’s proposed allocation to Idaho dischargers. The proposed allocation [from EPA to Ecology for Idaho permits – Exhibit 8 of City of Coeur d’ Alene’s letter] would have been based on the percentage of DO deficit in Lake Spokane attributable to Idaho dischargers and would have allowed EPA permitting in Idaho to set limits for the three municipalities in a manner that would address actual impacts relative to a water quality standard.
Response: The “proposed allocation to Idaho dischargers” described in Exhibit 8 to the city of Coeur d’Alene’s comment letter is not materially different from the assumptions made regarding Idaho point sources in the draft TMDL. The phosphorus, ammonia, and ultimate
Spokane River / Lake Spokane Dissolved Oxygen Water Quality Improvement Report Page C-39
carbonaceous biochemical oxygen demand (CBODult) levels in Table Y of Exhibit 8 are identical to those used in the “TMDL alternative #1” modeling scenario that the draft TMDL, including its assumptions about Idaho loading, is based upon (see the PSU Report at Table 2).
Ecology assumes that the commenter is referring to the language under the heading “NPDES Permits for Idaho Point Sources” in Exhibit 8 to the city of Coeur d’Alene’s comment letter, which reads, in relevant part “the total loadings of phosphorus, ammonia, and CBOD discharged in Idaho could be different than those presented… as long as the cumulative dissolved oxygen sag does not exceed 0.XX mg/L. Since all three constituents contribute to dissolved oxygen depletion, any increase in a given constituent would require compensating reductions in other constituents.” At the time that Exhibit 8 was written, the “Idaho only” source assessment model run, which computed the cumulative dissolved oxygen sag attributable to Idaho sources, had not yet been completed, which is why a placeholder is used for the total dissolved oxygen sag attributable to Idaho sources.
Ecology’s assumptions regarding the future permitted levels of oxygen demanding pollution from the Idaho point sources (i.e. the modeling inputs for those sources) are listed in Table 2 of PSU (2009). The results of the “Idaho only” source assessment model run are now complete, and the results are summarized in Tables 14 and 15 of the PSU report. The total dissolved oxygen sag in Lake Spokane attributable to the Idaho point sources, under the TMDL alternative #1 modeling scenario, is generally less than or equal to 0.1 mg/L (see summary response for Part G). While the above language regarding a certain allowable dissolved oxygen decrease for Idaho was not adopted in the public comment draft TMDL, Ecology would accept NPDES permit limits which did not reflect the limits assumed in Table 2 for Idaho point sources, as long as the revised limits did not increase the dissolved oxygen sag in Lake Spokane attributable to the Idaho point sources relative to the TMDL alternative #1 modeling scenario, as quantified by the “Idaho only” source assessment model run. See summary responses to Parts G and R regarding Ecology’s recommendation for coordinated follow-up modeling runs with other dischargers.
32. The proposed allocation [from EPA to Ecology for Idaho permits – Exhibit 8 of City of Coeur d’ Alene’s letter] would have been based on the percentage of DO deficit in Lake Spokane attributable to Idaho dischargers and would have allowed EPA permitting in Idaho to set limits for the three municipalities in a manner that would address actual impacts relative to a water quality standard. In response to these comments Ecology should explain why it has proposed to base allocations on assumed capabilities of technology as opposed to any application of the state water quality criteria.
Response: See summary response to Part G.
33. Coeur d’Alene cannot possibly implement technology to achieve a seasonal average of 36 µg/L for total phosphorus (TP). Allowing a larger allocation to Idaho dischargers will not adversely impact dissolved oxygen levels in the Spokane River or Lake Spokane. Thus granting an achievable allocation to Idaho will not impact the obligations of Avista or any other discharger subject to the TMDL.
Spokane River / Lake Spokane Dissolved Oxygen Water Quality Improvement Report Page C-40
Response: Because an “increase in dissolved oxygen at the riverine assessment point” would not constitute a lowering of water quality, Ecology assumes that it was the commenter’s intent to say either “increase in phosphorus” or “decrease in dissolved oxygen” at the riverine assessment point.
As explained in the response to comment number 5 for Part G, Ecology believes that the assumptions made in the TMDL, regarding loading from sources in Idaho, are equitable.
The Clean Water Act requires effluent limits as stringent as necessary to meet water quality standards, even if those limits cannot be achieved with available technology (Clean Water Act Section 301(b)(1)(C)). However, Ecology and EPA believe that the levels of phosphorus reduction from sources in Idaho assumed in the TMDL are, in fact, achievable. As noted in Appendix J, EPA’s Municipal Nutrient Removal Technologies Reference Document (the “Reference Document,” EPA 832-R-08-006) states that “special filters have proved effective in achieving low concentrations below 30 μg/L. They include the Trident filter from U.S. Filter, the Dynasand D2 advanced filtration system from Parkson, and membrane filtration processes from various manufacturers.” See the Reference Document at Section 2.6.3. The ten wastewater treatment plants for which discharge monitoring report data were analyzed in Part 2 of Appendix J had an average effluent phosphorus concentration of 26 µg/L (see Table 7 in Appendix J).
Because existing technologies can and do reduce phosphorus concentrations in discharges of treated municipal wastewater to 26 – 30 µg/L, on average, Ecology and EPA believe that the TMDL’s assumed reduction to a seasonal average phosphorus concentration of 36 µg/L for Idaho sources is, in fact, achievable. In addition, nutrient effluent limits in NPDES permits are generally expressed in terms of mass (40 CFR 122.45(f)). Mass effluent limits can be met in part through reductions in effluent flow rate through re-use or conservation. In other words, if a discharger can limit its effluent flow rate, it may be able to discharge phosphorus concentrations greater than 36 µg/L, yet maintain compliance with their effluent limits, assuming the limits are expressed in terms of mass.
The water quality standard that the TMDL is designed to achieve is the state of Washington’s approved water quality criterion for dissolved oxygen (WAC-173-201A-200(1)(d)(ii)). As stated in the draft TMDL on Page 35, “a water quality goal at the benchmark location is being used to confirm that when the Spokane River enters the reservoir upstream sources of dissolved oxygen impairment have been reduced to a point where remaining dissolved oxygen impairments in the reservoir is caused by Long Lake Dam and is Avista’s responsibility to address. Ecology elected to use EPA’s Clean Water Act Section 304(a) recommended criterion of 10μg/L for total phosphorus in Ecoregion II (EPA 822-B-00-015, Table 2) as a water quality benchmark for this location.”
The fact that the Idaho dischargers do not measurably increase phosphorus or decrease dissolved oxygen concentrations at the riverine assessment point under the TMDL #1 modeling scenario is irrelevant. None of the load and wasteload allocations and none of the assumptions regarding loading from sources in Idaho were based directly on the riverine assessment point targets. Modeling has shown that point source discharges of phosphorus, ammonia, and CBOD in Idaho “have the reasonable potential to cause or contribute” to
Spokane River / Lake Spokane Dissolved Oxygen Water Quality Improvement Report Page C-41
excursions below dissolved oxygen criteria in Lake Spokane (Cope 2006 and PSU 2010). Therefore, federal NPDES regulations require that permits for these dischargers must include water quality-based effluent limits for these parameters (40 CFR 122.4(d), 122.44(d)(1)(i – iii)).
34. I appreciate how far we have come, especially being from Idaho in gaining EPA’s attention to reconsider Bistate pollution allocations, thus pulling dischargers from Idaho into greater accountability for our share of upstream pollution sources.
Response: Comment noted.
35. Washington Department of Ecology (WDOE) has stated on various occasions and in the draft TMDL document that it seeks an equitable solution, fair to each state. To the contrary, WDOE is pre-determining the outcome of the TMDL process by specifying key input criteria to the water quality model used to predict the impact on dissolved oxygen levels in Long Lake reservoir. Specifically, WDOE has selected Scenario #1, which effectively dictates a waste load allocation (WLA) based on effluent total phosphorus (EFF TP) concentrations of 36 ug/L for Idaho municipalities and the City of Liberty Lake, and 42 ug/L for the City of Spokane and Spokane County. The seemingly "insignificant" difference of 6ug/L will have a huge impact economically, to the benefit of Spokane City/County and disadvantage of Idaho municipalities. …This seemingly minor difference in concentration will give Spokane City/County the opportunity to increase its population by an additional 122,500 people...a highly significant amount...while Idaho's growth will be effectively stifled.
Response: Ecology chose the “TMDL #1” modeling scenario (with corresponding assumptions regarding Idaho sources) as the basis for the TMDL, for the reasons explained on Page 21 of the draft TMDL. As stated on Page 28 of the draft TMDL, the draft TMDL does not establish wasteload allocations for Idaho sources, and Ecology lacks the authority to do so. However, as explained in the summary response to Part G and the response to comment numbers 2, 3, 5, 11, and 16 in Part G, it is reasonable and appropriate for Ecology to assume that the NPDES permits for Idaho point sources will include conditions that ensure compliance with Washington’s water quality requirements, as required by 40 CFR 122.4(d).
The basis for the 6 µg/L difference in the effluent concentrations used to calculate the wasteload allocations for the city of Spokane and Spokane County (42 µg/L) as opposed to the loading assumptions for the Idaho wastewater treatment plants and the city of Liberty Lake (36 µg/L) is explained in the response to comment number 9 in Part G and in the summary response for Part R.
36. According to the U.S. Government Accounting Office (2008), the per capita gross domestic product (GDP) of Washington was $49,287 and for Idaho it was $34,615. Assuming an average per capita GDP of $41,951, the effluent concentration difference of 6 ug/L will open the door to $5,000,000,000 ($5 Billion) in additional annual GDP to Spokane City/County and at a great expense to Idaho.
Response: None of the wasteload allocations or loading assumptions in the TMDL were based on a certain population per pound of phosphorus discharged. As explained on Page
Spokane River / Lake Spokane Dissolved Oxygen Water Quality Improvement Report Page C-42
27 of the draft TMDL, the wasteload allocations for Washington municipal point sources and the loading assumptions for Idaho point sources were based on certain seasonal average effluent concentrations (either 36 or 42 µg/L) and projected effluent flow rates for the year 2027. The city of Post Falls’ projected effluent flow rate of 5.0 mgd for the year 2027 was based on information requested by and submitted to the Idaho Department of Environmental Quality and EPA by the city of Post Falls on April 7, 2009. Specifically, Michael Neher of the city of Post Falls stated that:
“Flow projections for the Post Falls POTW for year 2027 are for all practical purposes equal to the design flow of 5 mgd used in the current CE QUAL W2 Model (Model). I believe this number is valid and appropriate for the following reasons:
1. It is consistent with the 2008 Post Falls WWTP Master Plan (JUB Engineers), in which the flow projection when extended to year 2027 would equate to about 4.14 mgd. This projection used a linear regression analysis, which results in lower numbers than natural growth curve projections. It also was based on 4 years of flow data (2001 through 2004). Therefore the Master Plan projection may under-estimate the 2027 flows.
2. An analysis of Post Falls POTW monthly average data for the period 2000 to March 2009 indicates the year 2027 to be 4.6 mgd, based on exponential regression trendline. This also corroborates the 5 mgd design flow used in the Model. The growth rate derived from this trendline is 3.5% per year.
3. The 2007 Demographic Analysis & Growth Projections by J.P. Stravens/Planning Associates, Inc. report further corroborates the validity of the 5 mgd flow projection for 2027 in that the City's population is projected to grow at a rate of 3.5% reaching 65,000 in 2028. Based on the 2008 average per capita flow for Post Falls, this implies a 2028 flow of 5.3 mgd.”
Furthermore, in a letter to EPA dated February 27, 2008, the city of Post Falls explains that the city was in the process of increasing the WWTP’s design flow capacity to 5.0 mgd and stated that “if the Permits are delayed, Post Falls requests that the new 5.0 mgd capacity be utilized to calculate loadings.” Finally, in a memorandum dated September 19, 2005 from the Spokane River Dissolved Oxygen TMDL Collaboration Flows and Loadings Workgroup to the Steering Workgroup and Full Group of the Collaboration, Post Falls’ effluent flow rate was predicted to be 5.0 mgd by 2023 and 5.7 mgd by 2028. Linear interpolation suggests a flow rate of 5.56 mgd by 2027, which is similar to the later projections provided by the city of Post Falls.
Therefore, Ecology believes the flow projection of 5 mgd for 2027, which was provided by the city of Post Falls in February 2008 and in April 2009, was reasonable. If the actual increase in effluent flow rates for POTWs is different than projected, the wasteload allocations and loading assumptions may be re-evaluated as part of the ten-year assessment described in the Managed Implementation Plan section of the TMDL. See also the summary response for Part G.
37. We [City of Post Falls] strongly believe that the TMDL is grossly unfair. It effectively
Spokane River / Lake Spokane Dissolved Oxygen Water Quality Improvement Report Page C-43
constricts Idaho communities out of future economic opportunity that they are rightly entitled to. There are better scenarios that will still meet WDOE's dissolved oxygen objectives for Long Lake reservoir. The EPA-approved water quality model shows that Idaho municipalities could discharge 100 ug/L seasonal average with no practical difference in dissolved oxygen at Long Lake reservoir compared to Scenario #1. With that in mind, we ask WDOE to abandon Scenario #1 and allow Idaho dischargers a seasonal WLA equivalent of 100 µg/L. This is even more important in light of WDOE' s acknowledgement that opportunities for delta management actions are not available in Idaho and that WDOE appears to dismiss natural stream attenuation of Idaho sources (documented elsewhere), whereas Washington has significant septic tanks and other non-point sources to control for waste load credits which can be used for additional growth.
Response: Ecology assumes that the commenter’s estimate of a population increase of 122,500 people is based on the ratio of population to pounds of effluent phosphorus provided by the city of Post Falls in comment number 36 Part R (41,666 capita per pound) and the 2.944 lb/day phosphorus load represented by the 6 µg/L difference in effluent concentration for Spokane City and Spokane County relative to other municipal dischargers (2.944 × 41,666 ≈ 122,500).
None of the wasteload allocations or loading assumptions for phosphorus in the draft TMDL were based on economic factors, nor were they based on a certain population per pound of phosphorus discharged. As explained on Page 27 of the draft TMDL, the wasteload allocations for Washington municipal point sources and the loading assumptions for Idaho point sources were based on certain seasonal average effluent concentrations (either 36 or 42 µg/L) and projected effluent flow rates for the year 2027. The basis for Post Falls’ effluent flow projection is explained in the response to comment number 36 in Part G. The bases for the city of Spokane and Spokane County’s effluent flow projections are explained in the response to comment number 39, Part G. As explained in the response to comment number 16, Part G, cost is not a factor in the calculation of effluent limits based upon water quality standards.
The loading assumptions for Idaho sources were not intended to “stifle” Idaho’s growth; on the contrary, they were intended to account for projected growth in population and effluent flow rates, based on information submitted by the utilities themselves. If the actual increase in effluent flow rates for POTWs is different than projected, the wasteload allocations and loading assumptions may be re-evaluated as part of the ten-year assessment described in the Managed Implementation Plan section of the TMDL. See also the response to comment number 36, Part G, and the summary response for Part G.
38. [from City of Post Falls] Lastly, it appears that the flow projections used in the TMDL for Spokane City/County, which subsequently are the bases for the assignment of WLAs, are much greater than is indicated by published population growth rates for the Spokane County area. The WLA being proposed by the TMDL for Spokane City/County will support about 850,000 people based on the 41,666 capita per pound of EFF TP that WDOE believes is reasonable for Idaho. Yet according to the Washington Center for Real Estate Research (WSU, 2009), Spokane County has a historic growth rate of 1.07% per annum, equaling about 560,000 people by 2027. We ask that WDOE document the reasoning behind this apparently large discrepancy
Spokane River / Lake Spokane Dissolved Oxygen Water Quality Improvement Report Page C-44
in the final TMDL report. The WDOE's current formula, when analyzed through the above provided information, would lead one to believe that Washington is intentionally trying to moderate and control the growth of Idaho communities. This scenario is simply untenable and we would respectfully request that this inequity be cured immediately.
Response: See response to comment number 36, Part G. To be clear, Ecology is not trying to moderate and control the growth of Idaho communities. At the time the flow projections were made, the City and County were experiencing more rapid growth. The Washington State Office of Financial Management (OFM) produces a growth projection based on long term trends. Local jurisdictions are not required to use OFM’s projection. Local planners chose to amend OFM projections based on local data. For the two wastewater facilities planning efforts a middle ground projection was used. At the time of the TMDL collaboration the Flow and Loading Work Group collected flow projections from each discharger. Neither the City’s nor the County’s projection was challenged at that time as the projections look reasonable.
The county has an agreement for the city of Spokane to treat 10 mgd. Of that total, 2 mgd is for North Spokane and 8 mgd for the valley. To accommodate growth in the valley the basic option was to divert and treat or enlarge the truck sewer system, which goes through downtown, including additional storage to eliminate CSOs. The cost effective answer was treatment somewhere in the valley.
Spokane River / Lake Spokane Dissolved Oxygen Water Quality Improvement Report Page C-45
H. Loading Capacity / Total Maximum Daily Load
Summary: The TMDL does not provide the total maximum daily load of nutrient pollution that can be discharged into the Spokane River and Lake Spokane, and still meet water quality standards for dissolved oxygen. Specifically, there is no information on the phosphorus loading capacity for the Spokane River and Lake Spokane, or on the amount of pollution that can be discharged into the river.
Summary Response: The TMDL does provide the total maximum daily load of nutrient pollution that can be discharged into the Spokane River and Lake Spokane and still meet water quality standards for dissolved oxygen, but has been modified to express the total loading capacity of the lake for ammonia, CBOD and phosphorus in units of lbs/day. The TMDL divides those total loads into the wasteload and load allocations for all point and nonpoint sources of ammonia, CBOD and phosphorus in Washington (Tables 5 and 6) that, when considered in light of Avista’s assigned water quality improvements and assumed reductions from Idaho sources, will ensure water quality standards are met in Lake Spokane.
It is not possible to identify one single number for the “loading capacity” of Lake Spokane; rather, the loading capacity is expressed as a combination of three different pollutants. Unlike many TMDLs, the parameter of concern (dissolved oxygen) is not a pollutant; dissolved oxygen is a water quality characteristic that responds to the discharge of oxygen demanding pollutants. This means that in this TMDL, the term “loading capacity” relates to both the oxygen “resource” within the reservoir and allowable changes to it (e.g., 0.2 mg/l relative to natural conditions), and the allowable discharge of the “pollutants” to this resource (CBOD, ammonia and phosphorus). The water quality model provides the quantitative link between the pollutants being discharged and the dissolved oxygen response.
Avista may augment the loading capacity of the reservoir either by adding oxygen (resource) to the reservoir and/or reducing pollutant discharges to meet its responsibility. 1. Loading Capacity and “total maximum daily loads.” Numerous people commented on the
incomplete nature of the draft TMDL because it fails to identify a “total maximum daily load” including a phosphorus loading capacity for the Spokane River or Lake Spokane.
Response: As discussed in the Summary Response above, the TMDL has been modified to include the total loading capacity of ammonia, CBOD and phosphorus; and the TMDL does define all elements of the standard TMDL equation, LC=LA+WLA+MOS.
Lake Spokane’s loading capacity is augmented by Avista’s water quality improvement requirements, and is the amount of oxygen-demanding pollution (i.e. phosphorus, CBOD and ammonia) that Lake Spokane can receive, and still meet the dissolved oxygen water quality standard. These pollutant loading capacities are presented in Table 4 of the final TMDL.
2. Avista’s Responsibility in lbs/day. Commenters requested that Avista’s responsibility be
expressed as lbs/day of phosphorus in order to provide clear implementation guidance. Commenters also attempted to quantify Avista’s responsibility in lbs/day of phosphorus:
Spokane River / Lake Spokane Dissolved Oxygen Water Quality Improvement Report Page C-46
• The load allocation (termed “responsibility”) assigned to Avista appears to represent a third
of the pollutant loading to the Lake, but is not calculated.
• The TMDL states that the current load (2001 conditions) equals about 350 lbs/day of total P and that a 66% reduction (i.e., 231 lbs/day) will be achieved in 10 years. (TMDL, p. 24). Adding the total LAs (87.1 lbs/day from Table 5 [Table 6 in final TMDL]) and total WLAs (32.55 lbs/day from Table 4 [Table 5 in final TMDL]) for the July to Oct period equals 120 lbs/day. Subtracting 120 from 231 indicates that Avista’s responsibility will be 111 lbs/day. For purpose of comparison, the TMDL proposed in 2004 (Cusimano, Merrill) identified the average phosphorous loading capacity to Lake Spokane for the June to October period as being 126.7 lbs/day (Table 1, page 22), which is 104.3 lb/day less than identified in the 2009 TMDL for the July to October period.
Response: The 401 Certification for Long Lake dam relies upon the TMDL to quantify those water quality improvements in Lake Spokane which are the responsibility of Avista’s operations. The water quality modeling scenarios used to develop this TMDL were designed to quantify Avista’s responsibility as “dissolved oxygen improvement,” rather than in lbs/day of phosphorus, ammonia and CBOD for several reasons. Expressing Avista’s responsibility as dissolved oxygen improvement serves to highlight those portions of the reservoir where more dissolved oxygen improvement is needed; and provides the information that’s needed for any future oxygenation efforts. Avista’s responsibility can be converted into pollutants (lbs/day) during implementation, but such a conversion must consider the oxygen demand from all three pollutants, the location of the pollutant reductions, and in-stream processes governing the effect of those pollutants on Long Lake oxygen levels. In other words, Avista’s responsibility can be converted into lbs/day pollution only after the location of planned non-point source reductions are known, and must be done using a water quality model.
We also want to point out that the commenters’ estimates are not accurate. Tables 4 and 5 of the draft TMDL [Tables 5 and 6 in the final TMDL] do not indicate load reductions, as indicated in the commenter’s calculation; rather, these tables list the allocated loads that enter the river. In fact, one cannot glean an equivalent phosphorus load reduction for Avista from information on Page 24 and Tables 4 and 5 of the draft TMDL. The sum of the WLAs and LAs, compared to the total current load, defines the expected reduction in loading. Avista’s responsibility, which will augment the loading capacity, is not part of that calculation.
Also, it is not accurate to apply the expected percent reduction to estimated current loadings and label the result as the loading capacity. This approach fails to consider the responsibility assigned to Avista. The past draft TMDL estimate of loading capacity was a product of the development method for that draft TMDL and does not apply to the current TMDL. Avista was not included in previous draft TMDLs, and Avista’s inclusion has fundamentally changed the definition and analysis of loading capacity in this TMDL.
Spokane River / Lake Spokane Dissolved Oxygen Water Quality Improvement Report Page C-47
I. Margin of Safety / Reasonable Assurances Summary: The use of a low flow year (2001) is not an adequate margin of safety considering continuous declining flows and increased groundwater withdrawals from the Spokane Valley / Rathdrum Prairie Aquifer. The reasonable assurances are similarly inadequate since there are serious doubts that the tributary load allocations can be met and target pursuit actions will reduce nonpoint sources of nutrients to the Spokane River. There needs to be specific, measurable reasonable assurances tied to timeframes rather than general statements as found in the TMDL.
Summary Response: The Margin of Safety discussion in the TMDL has been expanded to explain the conservative assumptions that have been incorporated in the hydrologic model, including conservative assumptions about natural background phosphorus levels, bioavailable phosphorus, stormwater flows, SOD, and phosphorus loading from groundwater and the lake watershed. The requirement for additional flows as part of Avista’s 401 certification and the incentives to conserve water as part of the target pursuit actions provide additional reasonable assurances that flows will not be lower than they were in 2001. See summary responses for Parts N and Q related to tributary load allocations and target pursuit actions (delta management). The TMDL provides reasonable assurance that the water quality standards will be met through the development of achievable wasteload and load allocations, and reasonable assumptions about the dissolved oxygen improvement for which Avista is responsible. More specific information (e.g. timeframes, funding, efficacy in reducing nutrient pollution, etc) will be spelled out through the numerous plans required by the TMDL and permits (delta management plans, water quality attainment plans, nonpoint source committee reports, etc) during TMDL implementation.
1. I am unsure that the Margin of Safety or Reserve Capacity is sufficient given the historically declining flow rates in the Spokane. Additionally, the low flows of 2001 are relatively recent. Given that water consumption in the basin continues to increase and given that climate change continues to affect snow pack and summer low flows in the region, then a responsible Margin of Safety and Reserve Capacity should be incorporated. Although ancillary to this document, this is opportunity to revive discussion of a minimum instream flow on the Spokane. It is important to bear in mind that not all users of the Spokane hold permits to that use.
Response: Spokane River flow rates are addressed in Avista’s 401 water quality certification. See summary response for Part B related to climate change. Reducing water consumption is one area municipal dischargers can pursue as a target pursuit action, and is described in the summary response for Part N.
2. Ecology's Reasonable Assurance section relies on a mixture of actions that have already occurred (i.e. ban on phosphate detergent) and actions that may occur in the future. Ecology should revisit this section, and provide a detailed list and schedule for actions Ecology and others will do to meet the LAs for the tributaries.
Response: A detailed list of implementation activities and schedules will be included in the numerous plans that will be developed by Ecology, dischargers and other during TMDL implementation (delta plans, water quality attainment plan, etc). Each of these plans is discussed in detail in the Managed Implementation Plan section of the TMDL.
Spokane River / Lake Spokane Dissolved Oxygen Water Quality Improvement Report Page C-48
3. The continuing reliance on the “Delta Elimination Plan” concept is misplaced, given that dischargers are not eligible for non-point source reduction credit until after tributary LAs are met…Given the improbability of reducing tributary phosphorus in the percentages called for in Table 5 [Table 6 in final TMDL], Delta Elimination is now out of reach, and is certainly not a basis for finding reasonable assurance.
Response: See summary response for Part Q related to tributary load allocations and response summary for Part N related to Target Pursuit Actions (including delta elimination).
4. While Sierra Club agrees with implementing a strategy of influent source reduction (e.g., dish detergent phosphate and fertilizer bans) as a strategy, no analysis is provided to indicate that such reductions translate to effluent reductions.
Response: The city of Spokane has provided a preliminary analysis showing a wide range of reduction in influent phosphorus following the detergent ban; from 1 to 14 percent. Ecology and others will provide further analysis during TMDL implementation.
5. Spokane County has prepared a reasonable study of reclaimed water, but, as discussed below, this program is undermined by allocation of an illegal WLA to the County plant. Likewise, the septic tank offset program will not comply with Washington’s water quality offset regulation.
Response: See summary response for Part L related to the Spokane County treatment plant.
6. Reference to the new Hangman Creek TMDL is appropriate, but there is no mention that that document indicates maximum reductions in TSS (which may serve as a surrogate for phosphorus) considerably less than what is required in this TMDL to achieve water quality standards.
Response: Revisions have been made to the Reasonable Assurances and Load Allocation sections and in Appendix M to clarify the linkage between TSS and phosphorus reductions in Hangman Creek. Preliminary estimates using the same TSS watershed modeling procedures in the Hangman TMDL suggested annual average total phosphorus will be reduced by a similar amount as TSS – approximately 20 percent when sediment control actions are implemented. In addition, more aggressive phosphorus reduction activities may be necessary to prevent dissolved oxygen and pH water quality criteria violations in the Hangman Creek watershed. The role of phosphorus in Hangman Creek dissolved oxygen and pH water quality issues will be examined in 2010.
7. There is no analysis to connect the Lake Coeur d’Alene Lake Management Plan to phosphorus reductions in the Spokane River and Lake Spokane. Boundary conditions at Lake CdA indicate natural background concentrations, so it is unclear how nutrient reductions in that Lake will reduce Spokane River concentrations.
Response: This information may come forward during TMDL implementation through the work of the TMDL advisory committee. The Lake Management Plan is focused on controlling dissolved metals, partially by controlling the nutrient loading from the tributary streams (especially the St. Joe River). The nonpoint source advisory committee is currently assessing phosphorus loading throughout the entire Spokane River watershed, including tributaries into Lake Coeur d’Alene. It is through this project where it may be determined
Spokane River / Lake Spokane Dissolved Oxygen Water Quality Improvement Report Page C-49
that reductions in lake nutrient loads may translate into reductions in the river nutrient loads.
8. Continued monitoring and assessment to determine whether water quality standards are or are not being achieved does not equate to reasonable assurance that they will in fact be achieved.
Response: Monitoring is necessary to determine if actions described in the TMDL are improving water quality and if certain assumptions need to be modified in future permit cycles or during the ten-year assessment. Funding for this most crucial piece of information over the coming years is no trivial matter and dedication to monitoring is a reasonable assurance that these crucial questions can be answered and that course-corrective actions can be made at the appropriate time.
9. The general reference to Avista’s responsibilities under the 401 Certification does not provide reasonable assurance that Avista will be capable of meeting the requirements of this TMDL.
Response: As discussed in the summary response for Part A related to Avista’s dissolved oxygen responsibility, Ecology believes that the responsibility assigned to Avista is both reasonable and achievable. The water quality attainment plan Avista will prepare following TMDL approval will identify reasonable and feasible measures to improve dissolved oxygen in Lake Spokane.
10. The increase in Post Falls Dam spill is not a guarantee that those flows will remain in the River over time. Other factors, notably increased water right permitting in Idaho and increased groundwater pumping under Washington’s municipal water rights is not discussed and will have a negative effect on instream flows.
Response: See summary response for Part I and the response to comment number 1, Part I.
11. The DO TMDL should revisit the MOS, and develop an MOS that addresses climate change.
Response: See summary response to Part B related to climate change.
12. The MOS should be redeveloped to address the increased withdrawals of groundwater and such withdrawals effect on flows and the River's loading capacity.
Response: See response to comment numbers 1 and 10, Part I.
13. Return to the 2004 Draft TMDL levels for the point source dischargers and eliminate the delta reductions/non-point source element from the 2009 Draft TMDL unless Ecology and the dischargers can measurably demonstrate that the reductions are reasonably assured to meet water quality standards.
Response: See summary response to Parts N and Q related to target pursuit actions and tributary load allocations, respectively. It is unclear to Ecology how returning to a previous draft with wasteload allocations far below what is currently technologically achievable for nutrient reduction provides any greater assurance that water quality standards would be met. See response to comment number 7, Part E.
Spokane River / Lake Spokane Dissolved Oxygen Water Quality Improvement Report Page C-50
14. Only critical condition river flow is offered as a margin of safety. This is not conservative given that River flows are declining (1700 down to 600 cfs over the past 100 years. Cusimano 2004) and are likely to continue to decline with development over (withdrawal from) the aquifer. The 2009 Draft TMDL should include an MOS that provides reasonable assurance that water quality standards will be met.
Response: See summary response for Part I. The Margin of Safety discussion in the TMDL has been expanded to explain the conservative assumptions that have been incorporated in the model. The following conservative assumptions comprise the implicit margin of safety for this TMDL:
• For each tributary, the headwater phosphorus concentration has been used as the “natural background” concentration at the mouth of the tributary, even though natural phosphorus concentrations may increase between the headwaters and the mouth.
• Stormwater flows from an “average” rainfall year have been assumed to occur during the 2001 low-flow year.
• All phosphorus is assumed to be bioavailable.
• The top eight meters of the reservoir are not included in the vertical averaging because of amplified algal activity which increases daytime dissolved oxygen levels.
• Conservative estimates are used for anthropogenic phosphorus loading from sources in the Lake Spokane watershed downstream of Nine Mile Dam.
15. The Spokane River cleanup plan must demonstrate reasonable assurance that water quality standards can be met. Because of the false tributary and Avista credits, the, that reasonable assurance is missing.
Response: See summary response for Part I.
16. The draft describes no fixed funding mechanisms for these reductions. It does not describe a fixed schedule for these reductions. And it does not describe a method by which the State will overcome its historic reluctance to pursue non-point source pollution, polluters for violations. In short, this draft fails to provide a reasonable assurance that the hope for reductions in non-point source pollution will actually occur.
Response: See summary response for part I.
17. …the draft's margin of safety is inadequate. It fails to address the potential effect a climate change will have on the flows of the river, and the river's reduced loading capacity because of such flow changes. It fails to address the continued and virtually unregulated withdrawals of groundwater within the basin both in Idaho and Washington and those withdrawals' effect on the river flows.
Response: See summary responses for Part I and B (climate change) and response to comment number 1, Part I.
Spokane River / Lake Spokane Dissolved Oxygen Water Quality Improvement Report Page C-51
18. What if the MIP does not actually work and increase oxygen in the river, this seems like a guarantee? While we understand the need for stability in the financial markets, we would like to see a commitment from Ecology and the dischargers and Avista that they will continue to reach for attainment of the goal of increasing dissolved oxygen to meet the legal requirements.
Response: See summary response for Part I. This commitment has been demonstrated throughout this nearly 12-year process by all parties involved as evidenced by the funding (and rate increases) to date.
19. How can Ecology have reasonable assurance that the reductions will be achieved without funding for specific programs to implement TMDLs on the tributaries?
Response: See summary response for Part I. See the Reasonable Assurance and Potential Funding Sources sections in the TMDL for specific current and potential funding of programs.
20. Where does Ecology envision finding the funding and resources for achieving the required load allocations for non-point source reductions by the required compliance date?
Response: See summary response for Part I, response to comment number 19, Part I, and the “Potential Funding Sources” section of the TMDL.
21. What actions will occur if Ecology fails to achieve the stated reductions in the tributaries by the required compliance date?
Response: See summary response for parts I and Q (tributary load reductions).
22. Who will be held responsible if Ecology fails to achieve the stated reductions in the tributaries by the required compliance date?
23. The “implicit margin of safety” (TMDL p. 40) is not rationally related to and does not address the actual and significant uncertainties in the plan, i.e., the questionably large load allocations assigned to the tributaries and Avista. Because there are serious questions as to whether these allocations can be reduced to the levels called for, the margin of safety should identify additional methods for pollutant load reductions. Use of the 10% exceedance flow as a margin of safety is irrelevant to the pollutant reduction uncertainties raised in the draft plan.
Response: See summary response for Part I.
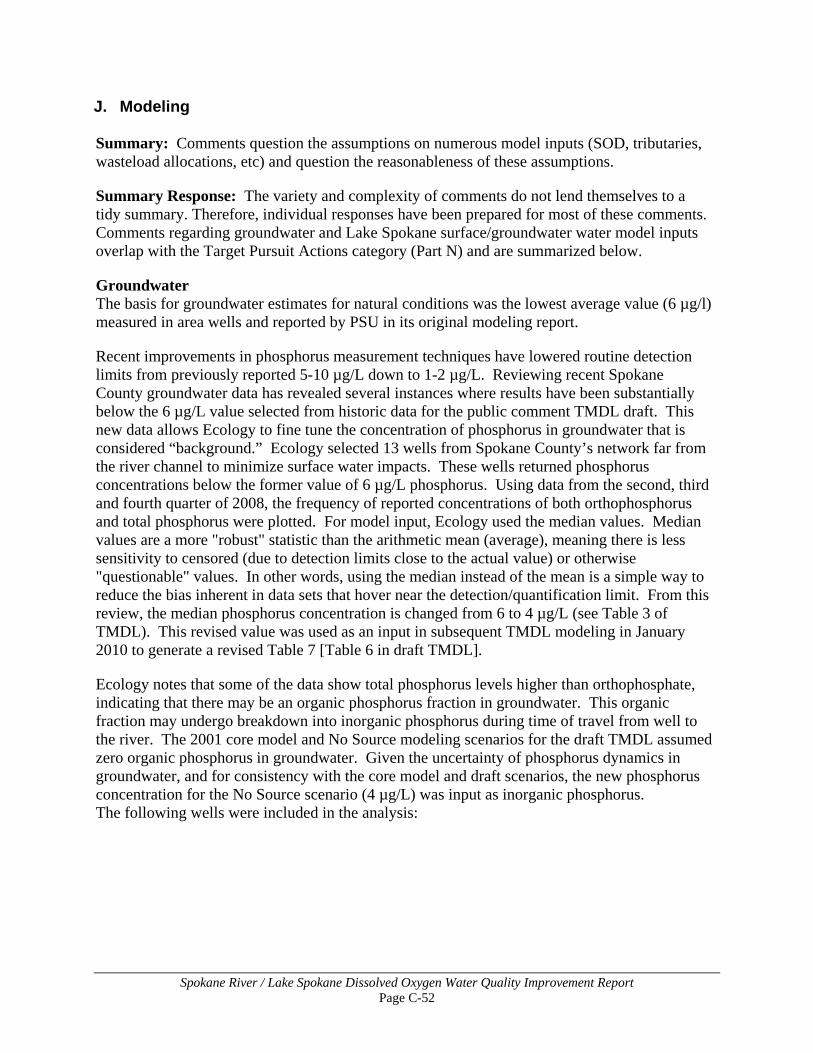
Spokane River / Lake Spokane Dissolved Oxygen Water Quality Improvement Report Page C-52
J. Modeling Summary: Comments question the assumptions on numerous model inputs (SOD, tributaries, wasteload allocations, etc) and question the reasonableness of these assumptions.
Summary Response: The variety and complexity of comments do not lend themselves to a tidy summary. Therefore, individual responses have been prepared for most of these comments. Comments regarding groundwater and Lake Spokane surface/groundwater water model inputs overlap with the Target Pursuit Actions category (Part N) and are summarized below.
Groundwater The basis for groundwater estimates for natural conditions was the lowest average value (6 µg/l) measured in area wells and reported by PSU in its original modeling report.
Recent improvements in phosphorus measurement techniques have lowered routine detection limits from previously reported 5-10 µg/L down to 1-2 µg/L. Reviewing recent Spokane County groundwater data has revealed several instances where results have been substantially below the 6 µg/L value selected from historic data for the public comment TMDL draft. This new data allows Ecology to fine tune the concentration of phosphorus in groundwater that is considered “background.” Ecology selected 13 wells from Spokane County’s network far from the river channel to minimize surface water impacts. These wells returned phosphorus concentrations below the former value of 6 µg/L phosphorus. Using data from the second, third and fourth quarter of 2008, the frequency of reported concentrations of both orthophosphorus and total phosphorus were plotted. For model input, Ecology used the median values. Median values are a more "robust" statistic than the arithmetic mean (average), meaning there is less sensitivity to censored (due to detection limits close to the actual value) or otherwise "questionable" values. In other words, using the median instead of the mean is a simple way to reduce the bias inherent in data sets that hover near the detection/quantification limit. From this review, the median phosphorus concentration is changed from 6 to 4 µg/L (see Table 3 of TMDL). This revised value was used as an input in subsequent TMDL modeling in January 2010 to generate a revised Table 7 [Table 6 in draft TMDL].
Ecology notes that some of the data show total phosphorus levels higher than orthophosphate, indicating that there may be an organic phosphorus fraction in groundwater. This organic fraction may undergo breakdown into inorganic phosphorus during time of travel from well to the river. The 2001 core model and No Source modeling scenarios for the draft TMDL assumed zero organic phosphorus in groundwater. Given the uncertainty of phosphorus dynamics in groundwater, and for consistency with the core model and draft scenarios, the new phosphorus concentration for the No Source scenario (4 µg/L) was input as inorganic phosphorus. The following wells were included in the analysis:
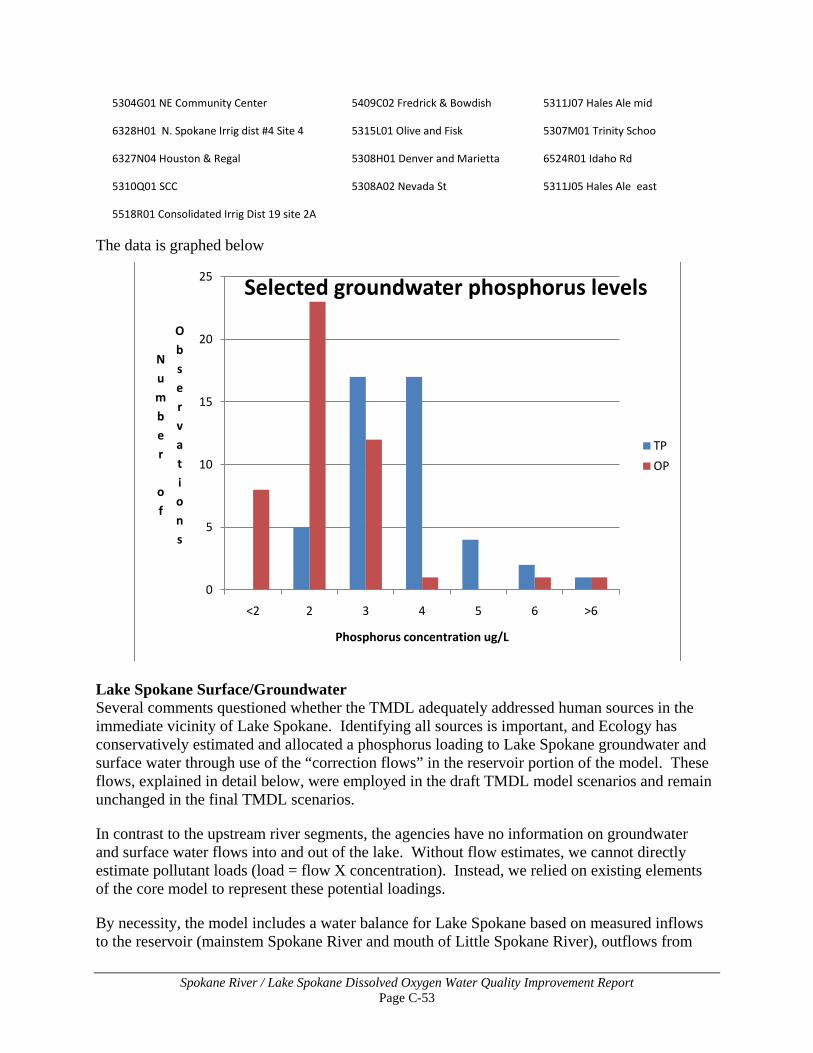
Spokane River / Lake Spokane Dissolved Oxygen Water Quality Improvement Report Page C-53
5304G01 NE Community Center 5409C02 Fredrick & Bowdish 5311J07 Hales Ale mid
6328H01 N. Spokane Irrig dist #4 Site 4 5315L01 Olive and Fisk 5307M01 Trinity Schoo
6327N04 Houston & Regal 5308H01 Denver and Marietta 6524R01 Idaho Rd
5310Q01 SCC 5308A02 Nevada St 5311J05 Hales Ale east
5518R01 Consolidated Irrig Dist 19 site 2A
The data is graphed below
Lake Spokane Surface/Groundwater Several comments questioned whether the TMDL adequately addressed human sources in the immediate vicinity of Lake Spokane. Identifying all sources is important, and Ecology has conservatively estimated and allocated a phosphorus loading to Lake Spokane groundwater and surface water through use of the “correction flows” in the reservoir portion of the model. These flows, explained in detail below, were employed in the draft TMDL model scenarios and remain unchanged in the final TMDL scenarios.
In contrast to the upstream river segments, the agencies have no information on groundwater and surface water flows into and out of the lake. Without flow estimates, we cannot directly estimate pollutant loads (load = flow X concentration). Instead, we relied on existing elements of the core model to represent these potential loadings.
By necessity, the model includes a water balance for Lake Spokane based on measured inflows to the reservoir (mainstem Spokane River and mouth of Little Spokane River), outflows from
0
5
10
15
20
25
<2 2 3 4 5 6 >6
Number
of
Observations
Phosphorus concentration ug/L
Selected groundwater phosphorus levels
TP
OP
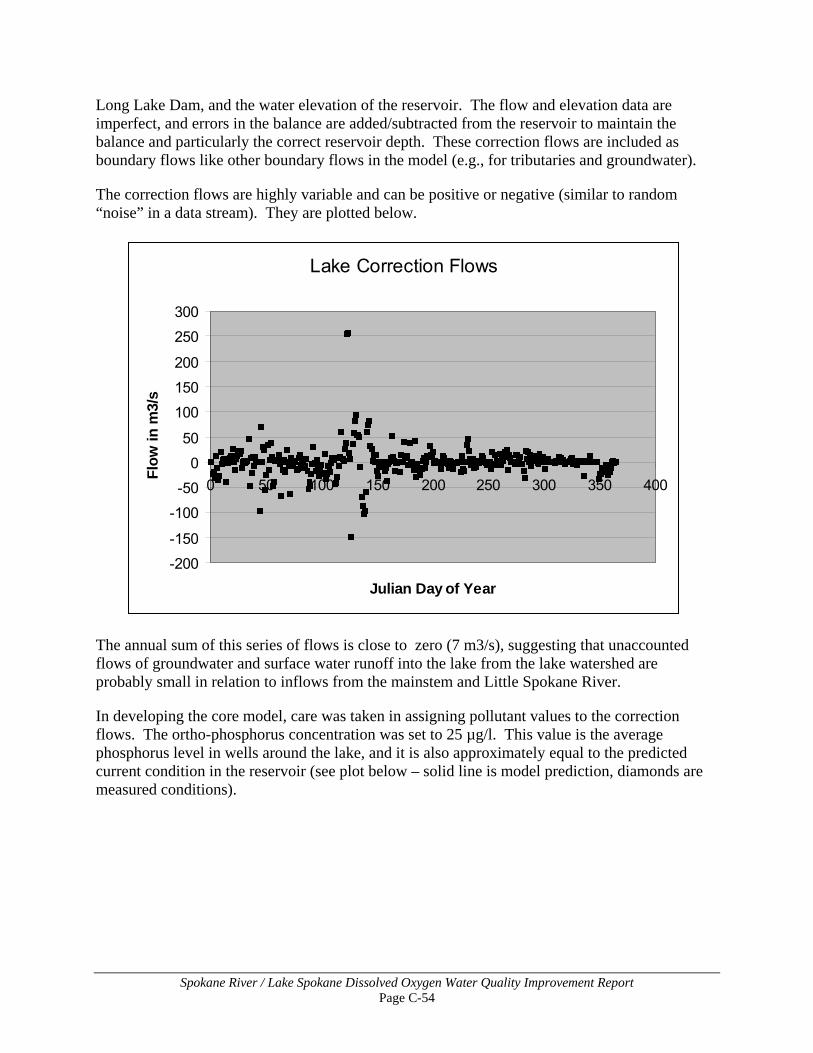
Spokane River / Lake Spokane Dissolved Oxygen Water Quality Improvement Report Page C-54
Long Lake Dam, and the water elevation of the reservoir. The flow and elevation data are imperfect, and errors in the balance are added/subtracted from the reservoir to maintain the balance and particularly the correct reservoir depth. These correction flows are included as boundary flows like other boundary flows in the model (e.g., for tributaries and groundwater).
The correction flows are highly variable and can be positive or negative (similar to random “noise” in a data stream). They are plotted below.
The annual sum of this series of flows is close to zero (7 m3/s), suggesting that unaccounted flows of groundwater and surface water runoff into the lake from the lake watershed are probably small in relation to inflows from the mainstem and Little Spokane River.
In developing the core model, care was taken in assigning pollutant values to the correction flows. The ortho-phosphorus concentration was set to 25 µg/l. This value is the average phosphorus level in wells around the lake, and it is also approximately equal to the predicted current condition in the reservoir (see plot below – solid line is model prediction, diamonds are measured conditions).
Lake Correction Flows
-200
-150
-100
-50
0
50
100
150
200
250
300
0 50 100 150 200 250 300 350 400
Julian Day of Year
Flow
in m
3/s
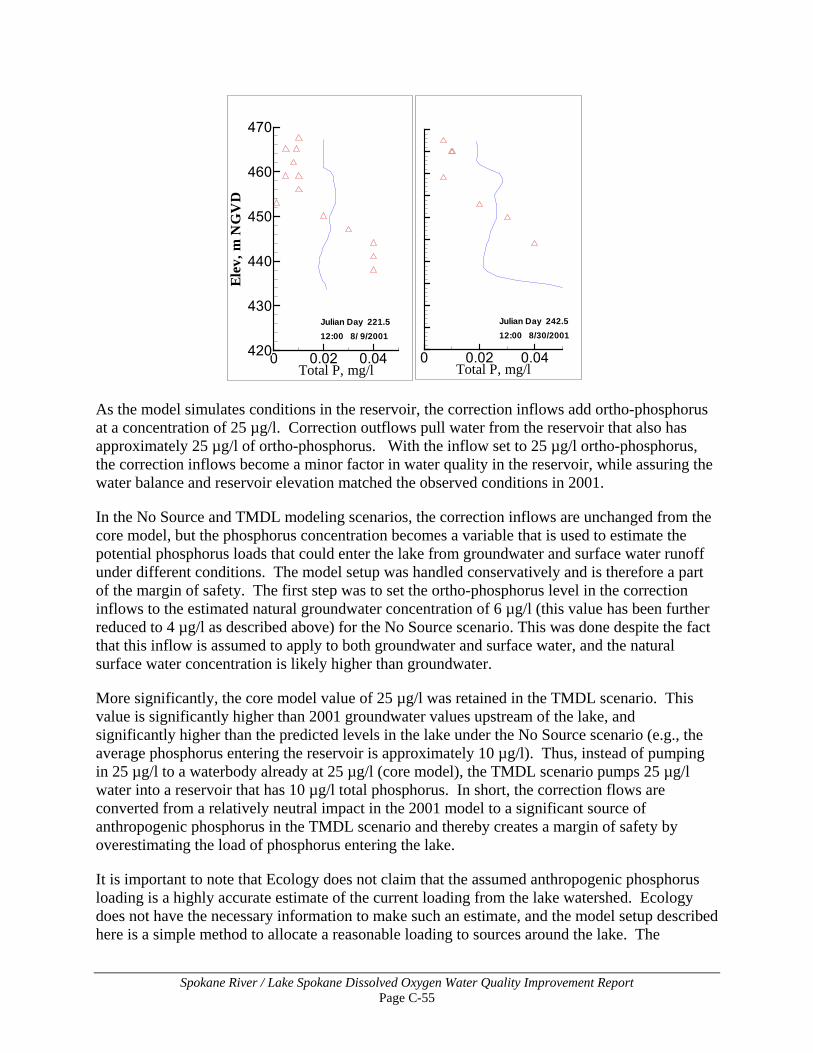
Spokane River / Lake Spokane Dissolved Oxygen Water Quality Improvement Report Page C-55
As the model simulates conditions in the reservoir, the correction inflows add ortho-phosphorus at a concentration of 25 µg/l. Correction outflows pull water from the reservoir that also has approximately 25 µg/l of ortho-phosphorus. With the inflow set to 25 µg/l ortho-phosphorus, the correction inflows become a minor factor in water quality in the reservoir, while assuring the water balance and reservoir elevation matched the observed conditions in 2001.
In the No Source and TMDL modeling scenarios, the correction inflows are unchanged from the core model, but the phosphorus concentration becomes a variable that is used to estimate the potential phosphorus loads that could enter the lake from groundwater and surface water runoff under different conditions. The model setup was handled conservatively and is therefore a part of the margin of safety. The first step was to set the ortho-phosphorus level in the correction inflows to the estimated natural groundwater concentration of 6 µg/l (this value has been further reduced to 4 µg/l as described above) for the No Source scenario. This was done despite the fact that this inflow is assumed to apply to both groundwater and surface water, and the natural surface water concentration is likely higher than groundwater.
More significantly, the core model value of 25 µg/l was retained in the TMDL scenario. This value is significantly higher than 2001 groundwater values upstream of the lake, and significantly higher than the predicted levels in the lake under the No Source scenario (e.g., the average phosphorus entering the reservoir is approximately 10 µg/l). Thus, instead of pumping in 25 µg/l to a waterbody already at 25 µg/l (core model), the TMDL scenario pumps 25 µg/l water into a reservoir that has 10 µg/l total phosphorus. In short, the correction flows are converted from a relatively neutral impact in the 2001 model to a significant source of anthropogenic phosphorus in the TMDL scenario and thereby creates a margin of safety by overestimating the load of phosphorus entering the lake.
It is important to note that Ecology does not claim that the assumed anthropogenic phosphorus loading is a highly accurate estimate of the current loading from the lake watershed. Ecology does not have the necessary information to make such an estimate, and the model setup described here is a simple method to allocate a reasonable loading to sources around the lake. The
Total P, mg/l
Elev
,mN
GV
D
0 0.02 0.04420
430
440
450
460
470
12:00 8/ 9/2001Julian Day 221.5
Total P, mg/l0 0.02 0.04
12:00 8/30/2001Julian Day 242.5
Spokane River / Lake Spokane Dissolved Oxygen Water Quality Improvement Report Page C-56
allocation is set for phosphorus only. To the extent that it applies not only to groundwater (which has low or zero ammonia and CBOD) but also surface water runoff (which likely contains ammonia and CBOD), it can be considered a surrogate for impacts from surface water CBOD and ammonia as well as phosphorus. Future analysis of lake watershed loadings would be needed to assess whether the combined impact to the reservoir from all lake watershed sources approaches the allocated impact. Ecology believes the current phosphorus loads are likely overestimated, and the resulting allocation therefore represents an element of the margin of safety. The TMDL value of 25 µg/l is probably too high for existing conditions in groundwater and surface water combined, and 4 µg/l is probably too low for natural groundwater and surface water combined. Additionally, the correction inflows are significant, and this results in substantial loadings as seen by comparing the lake watershed allocations to the allocations to the other tributary loads. Based on the concerns about the loadings in the lake watershed, Ecology has separated the allocated loads for the lake watershed from the other distributed inflows (i.e., groundwater upstream of the lake) in the final TMDL. Figure 4 (loading comparisons) and Table 6 (tributary and groundwater load allocations) have therefore been modified to include the Lake Spokane loading information (“Lake Watershed”). Ecology notes that no changes were made to the model setup or total allocated loads in response to the comments about the lake watershed; rather, existing characteristics of the model setup were simply analyzed and summarized in more detail in response to comments on the draft TMDL. All of the model files that characterized the lake watershed loadings were available for review during the comment period.
1. The model is simply a regulatory tool; it cannot legitimately be used as a precise measure of compliance with numeric water quality criteria.
The CE-QUAL-W2 model used in the DO TMDL should only be used as a diagnostic tool to guide watershed management, and is inadequate to establish NPDES permit effluent limitations or compliance requirements for 401 Water Quality Certification.
The computer model used in the development of the waste load allocations on a going forward basis should not be used for compliance determinations. The model is only a tool for evaluating conditions or changes.
Response: Since the water quality criterion is expressed as an allowable departure from natural conditions, the model is a necessary tool for estimating pollution levels that will achieve water quality standards. This is how the model is used in TMDL development.
The TMDL does establish allocations and responsibilities directly pertinent to NPDES permits and 401 certifications. EPA and Ecology believe the model is adequate for establishment of allocations and assignment of implementation responsibilities.
2. There is no reason provided for the 2009 Draft TMDL to include the month of March when making Tributary Estimates in Table M4.
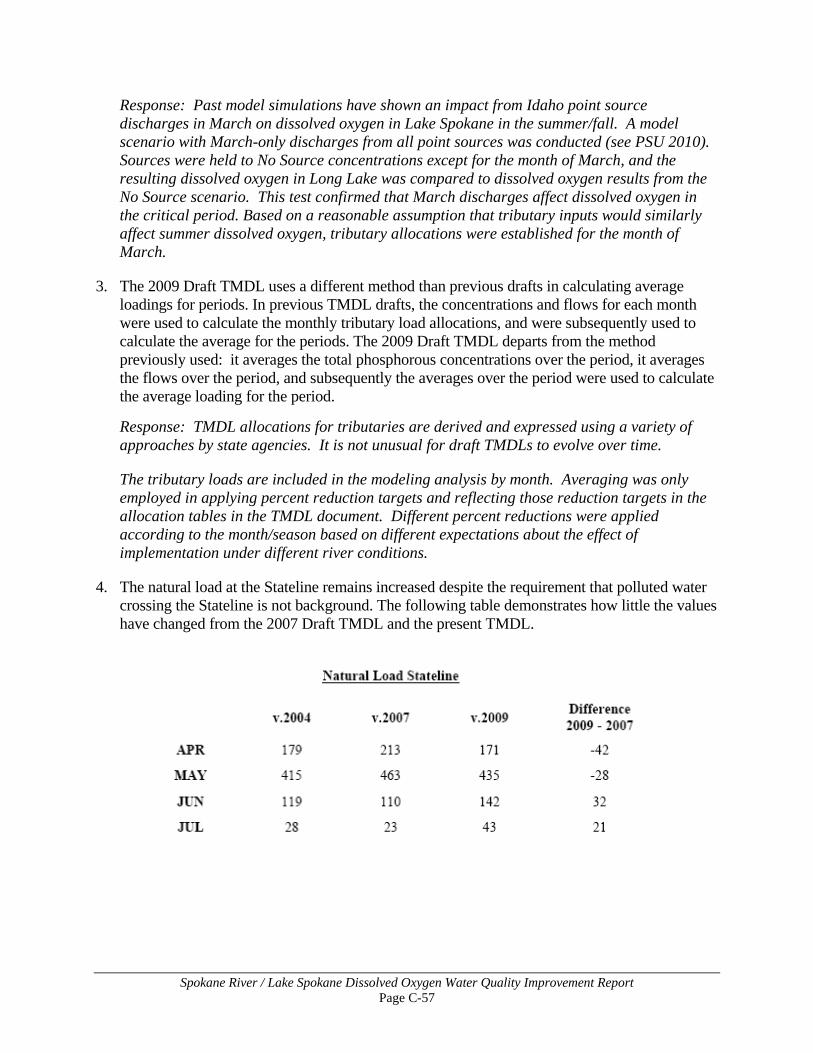
Spokane River / Lake Spokane Dissolved Oxygen Water Quality Improvement Report Page C-57
Response: Past model simulations have shown an impact from Idaho point source discharges in March on dissolved oxygen in Lake Spokane in the summer/fall. A model scenario with March-only discharges from all point sources was conducted (see PSU 2010). Sources were held to No Source concentrations except for the month of March, and the resulting dissolved oxygen in Long Lake was compared to dissolved oxygen results from the No Source scenario. This test confirmed that March discharges affect dissolved oxygen in the critical period. Based on a reasonable assumption that tributary inputs would similarly affect summer dissolved oxygen, tributary allocations were established for the month of March.
3. The 2009 Draft TMDL uses a different method than previous drafts in calculating average loadings for periods. In previous TMDL drafts, the concentrations and flows for each month were used to calculate the monthly tributary load allocations, and were subsequently used to calculate the average for the periods. The 2009 Draft TMDL departs from the method previously used: it averages the total phosphorous concentrations over the period, it averages the flows over the period, and subsequently the averages over the period were used to calculate the average loading for the period.
Response: TMDL allocations for tributaries are derived and expressed using a variety of approaches by state agencies. It is not unusual for draft TMDLs to evolve over time.
The tributary loads are included in the modeling analysis by month. Averaging was only employed in applying percent reduction targets and reflecting those reduction targets in the allocation tables in the TMDL document. Different percent reductions were applied according to the month/season based on different expectations about the effect of implementation under different river conditions.
4. The natural load at the Stateline remains increased despite the requirement that polluted water crossing the Stateline is not background. The following table demonstrates how little the values have changed from the 2007 Draft TMDL and the present TMDL.
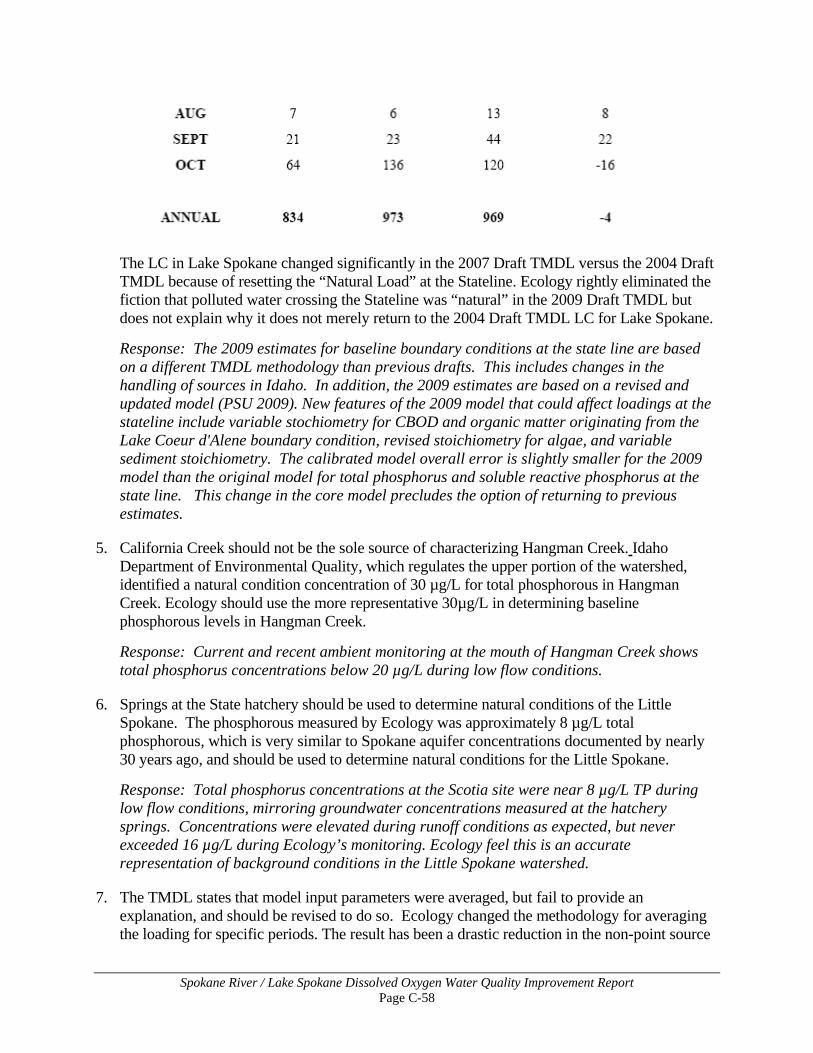
Spokane River / Lake Spokane Dissolved Oxygen Water Quality Improvement Report Page C-58
The LC in Lake Spokane changed significantly in the 2007 Draft TMDL versus the 2004 Draft TMDL because of resetting the “Natural Load” at the Stateline. Ecology rightly eliminated the fiction that polluted water crossing the Stateline was “natural” in the 2009 Draft TMDL but does not explain why it does not merely return to the 2004 Draft TMDL LC for Lake Spokane.
Response: The 2009 estimates for baseline boundary conditions at the state line are based on a different TMDL methodology than previous drafts. This includes changes in the handling of sources in Idaho. In addition, the 2009 estimates are based on a revised and updated model (PSU 2009). New features of the 2009 model that could affect loadings at the stateline include variable stochiometry for CBOD and organic matter originating from the Lake Coeur d'Alene boundary condition, revised stoichiometry for algae, and variable sediment stoichiometry. The calibrated model overall error is slightly smaller for the 2009 model than the original model for total phosphorus and soluble reactive phosphorus at the state line. This change in the core model precludes the option of returning to previous estimates.
5. California Creek should not be the sole source of characterizing Hangman Creek. Idaho Department of Environmental Quality, which regulates the upper portion of the watershed, identified a natural condition concentration of 30 µg/L for total phosphorous in Hangman Creek. Ecology should use the more representative 30µg/L in determining baseline phosphorous levels in Hangman Creek.
Response: Current and recent ambient monitoring at the mouth of Hangman Creek shows total phosphorus concentrations below 20 µg/L during low flow conditions.
6. Springs at the State hatchery should be used to determine natural conditions of the Little Spokane. The phosphorous measured by Ecology was approximately 8 µg/L total phosphorous, which is very similar to Spokane aquifer concentrations documented by nearly 30 years ago, and should be used to determine natural conditions for the Little Spokane.
Response: Total phosphorus concentrations at the Scotia site were near 8 µg/L TP during low flow conditions, mirroring groundwater concentrations measured at the hatchery springs. Concentrations were elevated during runoff conditions as expected, but never exceeded 16 µg/L during Ecology’s monitoring. Ecology feel this is an accurate representation of background conditions in the Little Spokane watershed.
7. The TMDL states that model input parameters were averaged, but fail to provide an explanation, and should be revised to do so. Ecology changed the methodology for averaging the loading for specific periods. The result has been a drastic reduction in the non-point source
Spokane River / Lake Spokane Dissolved Oxygen Water Quality Improvement Report Page C-59
reduction values, from approximately 96% in the 2004 version, to 50% in the 2007 version to 36 in the 2009 draft TMDL, yet conditions on the ground haven’t changed that drastically.
Response: This comment reflects a misunderstanding of the basis and analysis of allocations for tributaries in this draft TMDL as compared to previous drafts. Previous draft allocations were based on back-calculated, trial-and-error model simulations to achieve the dissolved oxygen criterion in Lake Spokane. This draft TMDL applies upfront percent reductions to the tributaries based on best professional judgment of a feasible level of nonpoint source control. While conditions in the watershed may not have changed, the methodology for the TMDL allocations for tributaries has fundamentally changed and is not comparable to previous draft TMDLs. The change in methodology is the primary cause for different percent reduction values, not averaging over specific periods. Note also that model input values for tributaries were not averaged (See response to comment numbers 46 and 47, Part J for additional discussion of averaging).
Another change in methodology is that the 2009 draft TMDL applied the percent reductions to the estimated anthropogenic fraction of the tributary loadings, rather than applying the percent reduction to the total tributary loading (natural plus anthropogenic). For this reason, the percent reduction values from previous drafts cannot be compared directly to the 2009 reductions.
8. …figures in Table M4 are incorrect and result in tributary load allocations being off as much as …21 percent. Please correct the numbers and recalculate the load allocation using the appropriate data.
Response: The comment is correct that errors were found in the tributary model inputs. The agencies were contacted during the comment period with this concern and we confirmed that there were errors in the calculation of tributary phosphorus concentrations for the scenarios. These errors were corrected in the final TMDL scenario run and report, and the table in the TMDL document reflects the corrected calculation method.
9. It also finally appears that you're grossly overestimating the loads to the lake from natural conditions, particularly groundwater. Please clearly explain the basis for your calculations to come up with these natural conditions.
Response: See summary response for Part J.
10. The 2009 Draft TMDL fails to provide data to support the difference between the CBOD decay level value of 0.076 day-1 for the Current Condition scenario and the CBOD decay level value of 0.050 day-1 for the TMDL scenario.
Response: The TMDL scenario is a future condition that reflects operation of upgraded treatment plants. Therefore, there is no available data for the CBOD decay rate, and there is no choice but to estimate the future rate in a generalized manner. Since additional treatment is expected to reduce existing rates, it is assumed that the future rate will be at least as low as the lowest current rate (Liberty Lake, 0.05 per day – see PSU 2009). This rate was applied uniformly to all municipal treatment plants, since all will be upgrading their systems.
Spokane River / Lake Spokane Dissolved Oxygen Water Quality Improvement Report Page C-60
11. More data are needed to be confident with the model output, in my opinion. Has minimum hypolimnetic DO changed since the mid 1980s? It varies considerably year-to-year as shown by Patmont, and one or two years of data may not be enough to determine a reliable average minimum. Also, more complete data throughout the reservoir would allow internal P loading in the upper reservoir to be determined by mass balance. Algae produced in the riverine zone from internal loading may be responsible for a significant portion of the meta and hypolimnetic DO demand down reservoir.
Response: Ecology and EPA recognize that there are uncertainties in the model. Additional data collection may or may not reduce these uncertainties. We believe the current model is reasonable and suitable for TMDL development.
If data show that in the 1980's minimum hypolimnetic dissolved oxygen was less and phosphorus loads have been reduced, it indicates the lake is more sensitive to external rather than internal loading. Regardless, internal loading of phosphorus from reservoir sediments is included in the model simulations. Comparison of measured versus simulated phosphorus in the reservoir indicates that this process is reasonably represented.
12. In reference to Lake Coeur d'Alene, [page 16, paragraph 4] the text states that "The current concentrations of nutrients in the lake, while not natural, are very low at the lake outlet forming the Spokane River;" however, we do not believe that this statement is accurate. Although the concentrations of phosphorous coming out of Lake Coeur d'Alene are relatively low, the initial findings of the Regional Non-Point Source Study have determined that the volume of water and the phosphorus mass loading from the lake are very significant, especially during several key months of the year. We request that Ecology revise the language to state that significant mass loading of phosphorus into Lake Spokane is contributed by Lake Coeur d'Alene during some key months.
Response: We believe the TMDL text is accurate. The mass loading is not the relevant measure. The important aspect for the TMDL is the agencies’ decision to establish the upstream boundary for the modeling analysis at the outlet of Lake Coeur d’Alene. This decision is based on the “very low” (draft TMDL language) or “relatively low” (commenter’s language) phosphorus concentrations at that location. The comment does not dispute that this is a reasonable upstream boundary for the analysis. See response to comment number 7, Part I.
13. The plan [page 16, paragraph 5] states that "Nonpoint source pollution in groundwater is defined in this TMDL as concentrations of phosphorous in groundwater above 6 µg/L, which was the lowest measured value in valley aquifer wells". We are unaware of any study or analysis that supports this conclusion. We believe that it is inaccurate to assume that the lowest measured level of phosphorus in the ground water should be assumed to have no anthropogenic contributions. There are numerous septic tanks in the Spokane Valley and upgradient in Idaho that contribute phosphorous to groundwater. There are also significant contributions of phosphorous to groundwater from the Spokane River and from upgradient lakes. Therefore, it is equally reasonable to assume that the natural level of phosphorus in the groundwater is nearly zero, and that all concentrations above zero are attributable to non-point source pollution. By assuming a natural background level of 6 µg/L in groundwater, it is establishes an erroneous baseline for non-point source reduction that reduces the available loading for
Spokane River / Lake Spokane Dissolved Oxygen Water Quality Improvement Report Page C-61
offsets.
Response: See summary response for Part J related to groundwater.
14. Table 3. p. 18, Note 4 – Note indicates “ammonia limits = 1 mg/l in March, May and October. All other months = 0.25 mg/l ” and “Spring (sp.) values apply to March, May and October.” April is left out. Should these read March-May and October? Shown as March-May, October on p. 28.
Response: Yes, the note has been corrected to read ‘March – May and October”.
15. Table 3. p. 17 and 18 – Ammonia is abbreviated NH3. This should be NH3-N? There is no item in the report or in the appendix with definitions regarding terminology. NH3 data submitted to Ecology by dischargers for development of the input to the model was as NH3-N. The value for TP in the table is as “P”, which would carry the implication that the NH3 should be as “N”.
Table 4. p. 28 – Ammonia is abbreviated NH3. This should be NH3-N?
Response: The commenters are correct that “NH3-N” is the parameter used in both the model and NPDES permits. The final TMDL report has been edited accordingly.
16. The point source flows for IEP and Kaiser were reversed, resulting in overstatement of the total BOD contribution by as much as 25% in the Scenarios.
Response: The commenter is correct, and this error has been corrected in the final TMDL scenario run. To clarify, this error only affected the pollutant contributions from IEP and Kaiser, and the overall effect on estimated loadings under the draft TMDL was relatively small. For example, the overall phosphorus loading to Long Lake was overestimated by only 1.0%. As a result, this correction has had a modest effect on downstream conditions.
17. Data availability for model calibration is grossly inadequate, resulting in uncertain and unreliable model results.
Response: Ecology and EPA believe that the available data are sufficient to develop a model that reasonably captures the water quality dynamics in this watershed.
18. Insufficient sediment oxygen demand (SOD) and sediment phosphorus flux data in Lake Spokane.
Response: These data are not routinely collected in reservoirs and therefore are frequently not available for TMDL model development. The model calibration indicates that the model reasonably represents the SOD and internal flux in the reservoir.
19. Underestimation of NPS loads due to the use of the low-flow year for calibration.
Response: The low-flow year is used not only for calibration but also as the TMDL design condition (i.e., the flow regime for the TMDL scenario). It is correct that the tributary flows and associated loads are lower than would be expected in higher flow years. To allow for
Spokane River / Lake Spokane Dissolved Oxygen Water Quality Improvement Report Page C-62
comparison of wet versus dry years during implementation, the TMDL allocation table also includes target concentrations.
20. Underestimation of NPS loads apparent from recent groundwater and surface water data.
Response: There was no data provided that indicated underestimation of NPS loads. Since tributary loads are based on 2001 data and tributary conditions are variable from year to year, recent data would not be directly comparable to the TMDL. Groundwater has been re-assessed in response to comments and the estimated natural condition has been modified (see summary response for Part J). This has increased the NPS load associated with groundwater.
21. Mass balance concerns that do not account for the blue-green algal blooms.
Response: Blue-green algae are included in the model as a specific algae compartment, and the model update included specific tasks directed toward improved algae growth dynamics. The model representation of 2001 conditions is reasonable.
22. Underestimation of background TP concentrations due to improper selection of the eco-region criteria…
Response: The estimated natural background total phosphorus concentrations are based on water quality data and model predictions, not eco-region criteria.
23. Insufficient and unreliable chlorophyll-a calibration results.
Response: All available data for chlorophyll-a were incorporated into the calibration process. The model representation of 2001 conditions is reasonable.
24. Additional unidentified errors that result in illogical and inconsistent modeling results.
Response: Specific errors were not identified in the comment.
25. The P04 ratio for IEP is misstated in the PSU Modeling Report, Table 2, at 0.70. The correct ratio is in the range of 0.20 to 0.25 based on pilot testing and full-scale operation of the Trident HS system.
Response: Based on data submitted by IEP, the reported average PO4 ratio for the pilot test of the Trident HS system was 0.25. This revised model input was used for the final TMDL scenario simulation.
26. The modeler's agreement [Appendix G], included in this Appendix does not seem to be appropriate for inclusion in the TMDL. All of the modeling efforts that were conducted for the previous draft TMDL have been superseded by the modeling efforts conducted since September 2008. In addition, Spokane County did not sign the modeler's agreement, and sent a letter to Ecology following the modelers meeting taking specific exception to the process and conclusions of the modelers meeting. If Ecology continues to include this document in the TMDL, then the County requests that its letter also be included.
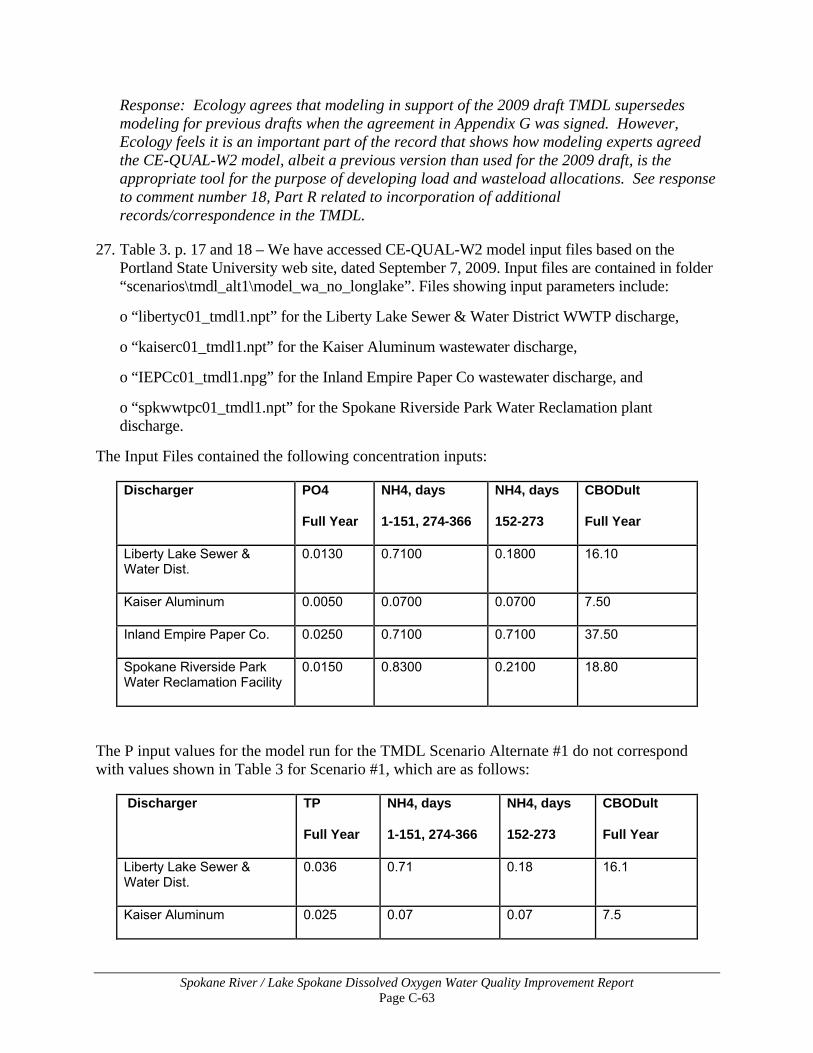
Spokane River / Lake Spokane Dissolved Oxygen Water Quality Improvement Report Page C-63
Response: Ecology agrees that modeling in support of the 2009 draft TMDL supersedes modeling for previous drafts when the agreement in Appendix G was signed. However, Ecology feels it is an important part of the record that shows how modeling experts agreed the CE-QUAL-W2 model, albeit a previous version than used for the 2009 draft, is the appropriate tool for the purpose of developing load and wasteload allocations. See response to comment number 18, Part R related to incorporation of additional records/correspondence in the TMDL.
27. Table 3. p. 17 and 18 – We have accessed CE-QUAL-W2 model input files based on the Portland State University web site, dated September 7, 2009. Input files are contained in folder “scenarios\tmdl_alt1\model_wa_no_longlake”. Files showing input parameters include:
o “libertyc01_tmdl1.npt” for the Liberty Lake Sewer & Water District WWTP discharge,
o “kaiserc01_tmdl1.npt” for the Kaiser Aluminum wastewater discharge,
o “IEPCc01_tmdl1.npg” for the Inland Empire Paper Co wastewater discharge, and
o “spkwwtpc01_tmdl1.npt” for the Spokane Riverside Park Water Reclamation plant discharge.
The Input Files contained the following concentration inputs:
Discharger PO4
Full Year
NH4, days
1-151, 274-366
NH4, days
152-273
CBODult
Full Year
Liberty Lake Sewer & Water Dist.
0.0130 0.7100 0.1800 16.10
Kaiser Aluminum 0.0050 0.0700 0.0700 7.50
Inland Empire Paper Co. 0.0250 0.7100 0.7100 37.50
Spokane Riverside Park Water Reclamation Facility
0.0150 0.8300 0.2100 18.80
The P input values for the model run for the TMDL Scenario Alternate #1 do not correspond with values shown in Table 3 for Scenario #1, which are as follows:
Discharger TP
Full Year
NH4, days
1-151, 274-366
NH4, days
152-273
CBODult
Full Year
Liberty Lake Sewer & Water Dist.
0.036 0.71 0.18 16.1
Kaiser Aluminum 0.025 0.07 0.07 7.5
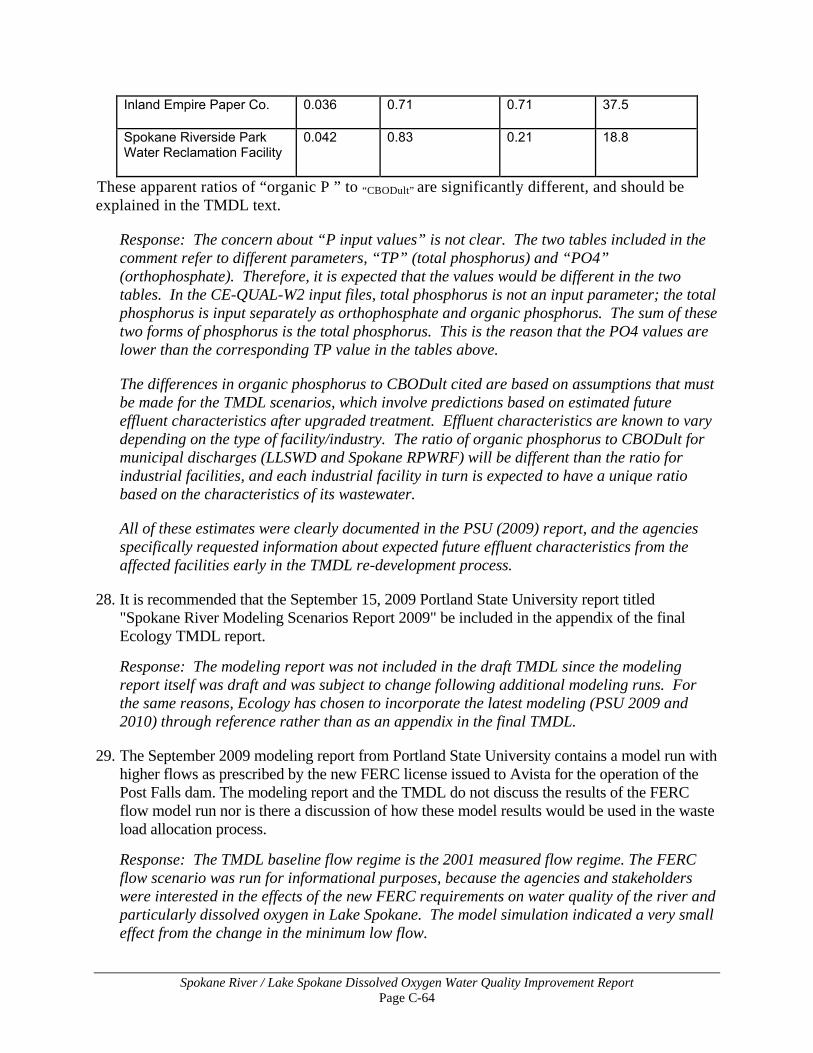
Spokane River / Lake Spokane Dissolved Oxygen Water Quality Improvement Report Page C-64
Inland Empire Paper Co. 0.036 0.71 0.71 37.5
Spokane Riverside Park Water Reclamation Facility
0.042 0.83 0.21 18.8
These apparent ratios of “organic P ” to “CBODult” are significantly different, and should be explained in the TMDL text.
Response: The concern about “P input values” is not clear. The two tables included in the comment refer to different parameters, “TP” (total phosphorus) and “PO4” (orthophosphate). Therefore, it is expected that the values would be different in the two tables. In the CE-QUAL-W2 input files, total phosphorus is not an input parameter; the total phosphorus is input separately as orthophosphate and organic phosphorus. The sum of these two forms of phosphorus is the total phosphorus. This is the reason that the PO4 values are lower than the corresponding TP value in the tables above.
The differences in organic phosphorus to CBODult cited are based on assumptions that must be made for the TMDL scenarios, which involve predictions based on estimated future effluent characteristics after upgraded treatment. Effluent characteristics are known to vary depending on the type of facility/industry. The ratio of organic phosphorus to CBODult for municipal discharges (LLSWD and Spokane RPWRF) will be different than the ratio for industrial facilities, and each industrial facility in turn is expected to have a unique ratio based on the characteristics of its wastewater.
All of these estimates were clearly documented in the PSU (2009) report, and the agencies specifically requested information about expected future effluent characteristics from the affected facilities early in the TMDL re-development process.
28. It is recommended that the September 15, 2009 Portland State University report titled "Spokane River Modeling Scenarios Report 2009" be included in the appendix of the final Ecology TMDL report.
Response: The modeling report was not included in the draft TMDL since the modeling report itself was draft and was subject to change following additional modeling runs. For the same reasons, Ecology has chosen to incorporate the latest modeling (PSU 2009 and 2010) through reference rather than as an appendix in the final TMDL.
29. The September 2009 modeling report from Portland State University contains a model run with higher flows as prescribed by the new FERC license issued to Avista for the operation of the Post Falls dam. The modeling report and the TMDL do not discuss the results of the FERC flow model run nor is there a discussion of how these model results would be used in the waste load allocation process.
Response: The TMDL baseline flow regime is the 2001 measured flow regime. The FERC flow scenario was run for informational purposes, because the agencies and stakeholders were interested in the effects of the new FERC requirements on water quality of the river and particularly dissolved oxygen in Lake Spokane. The model simulation indicated a very small effect from the change in the minimum low flow.
Spokane River / Lake Spokane Dissolved Oxygen Water Quality Improvement Report Page C-65
30. The scenarios simulated with the CE-QUAL-W2 model that determine load allocations did not accurately account for the newer, increased flow regimes that are required in the Federal Energy Regulatory Commission (FERC) license for the Post Falls Hydroelectric Project. These new flow regimes from Post Falls Dam are significantly higher than those used to develop the TMDL load allocations. Using lower flow regimes discounts dilution effects and minimizes the waters assimilation response to nutrients through the TMDL reach of the Spokane River and Lake Spokane Reservoir. It is not appropriate to attribute different flows than will actually occur to the Margin of Safety (MOS) required in TMDLs. Typically the Margin of Safety accounts for 10% of the load allocation to provide a buffer against uncertainty.
Response: See response to comment number 29, Part J. Margins of safety can be expressed in a variety of ways. These include either explicit (e.g., 10% of loading capacity) or implicit (conservative assumptions) approaches to setting the margin of safety. This TMDL employs conservative assumptions, particularly the low flow condition and the conservative estimate of loadings from the Lake Spokane watershed.
We conclude from the model scenario report that the effect of the FERC minimum flow requirements on water quality is relatively small, and the effect may not always trend positive by some measures (see phosphorus levels at segment 154 in Figure 7 of the PSU 2009 report).
31. Neither the Draft TMDL nor the PSU modeling report describe the difference in modeling results between Scenarios #1 and #2. This appears to be an intentional action by Ecology to obscure the evident fact that there is no meaningful difference between the results from either modeling scenario. In response to these comments Ecology should fully disclose and discuss the differences in results for both scenarios.
Response: See summary response to Part K. The PSU (2009) modeling report includes multiple comparison plots of the two scenarios, and the scale of the difference can be readily observed by reviewers. In addition, differences between the two scenarios are discussed in the “Modeling Selection, Results, and Discussion” section of the TMDL.
32. There has been a large increase in lake hypolimnetic DO already. The effect of AWT in the 1980s was to remove 85% of the effluent TP (effluent concentration decreasing from maybe – 5 mg/L to – 0.75 mg/L) and that raised summer minimum hypolimnetic (below 15 m) DO from an average of 1.4 mg/L in 1972 –1977 to 3.6 mg in 1978-1985, and to 4.5 'AWL the last four years, 1982 – 1885 (Patmont, 1987). This suggests that reservoir hypolimnetic DO is sensitive to TP loading. However, continued TP reduction may not achieve that much improvement, despite Patmont's Fig. 20a (attached) that indicates further increase in minimum DO at inflow TP concentrations below about 20 µg/L. Judging from DO profiles (Fig. 2e, DOE 9/09), minimum average DO (> 15 m, to compare with Patmont's values) for existing conditions (8/27) is about 3 mg/L at an inflow TP concentration of about 25 µg/L, thus fitting near the line in Fig. 20a. However, the average minimum DO (8/27) expected from reducing the inflow TP to 10 µg/L (TMDL #1) is only about 4 mg/L (> 15 m), which is similar to the 1982 - 1985 average minimum.
Response: It is true that previous efforts to reduce phosphorus discharges have been very beneficial, as evidenced by the information provided in this comment from the 1987 Patmont
Spokane River / Lake Spokane Dissolved Oxygen Water Quality Improvement Report Page C-66
study. We also agree that the additional improvement in dissolved oxygen may not match previous improvements in the 1970s and 1980s, simply because the gross load of phosphorus in play in this TMDL is smaller than earlier periods when there was no phosphorus treatment in the basin.
However, in questioning the benefits of additional treatment, this comment neglects the critical issue of population growth in this basin. The TMDL #1 scenario reflects a future condition with a significantly higher municipal population (2027 projections) and associated higher flows from the treatment plants. This means that the benefits of the TMDL are higher than the comparisons made in this comment, and EPA and Ecology believe these benefits are worthwhile.
33. The apparent lack of improvement predicted might be because there are other DO demands unaccounted for. Possibly background DO demands may have been underestimated. The no source SOD was set at 0.25 g/m2 per day and the reasonableness of that rate was questioned earlier. It is the oligotrophic – mesotrophic boundary criterion for AHOD (areal hypolimnetic oxygen deficit rate) in lakes, which includes SOD as well as water column demand. Reservoirs are known to have higher AHODs than lakes, because of larger watershed-to-reservoir area ratios, which means larger water, and hence, nutrient loading, to reservoirs than lakes. Walker (1985) has shown that reservoir AHODs are about 40 % higher than for lakes (see attached). The lowest AHOD in Walker's group of 38 COE reservoirs was, ironically, 0.25 g/m2 per day and that corresponded to a mean chl concentration of 1.6 mg/L, which is less than one half the oligotrophic – mesotrophic borderline criterion for lakes, and less than currently in Long Lake (PSU report, 5/09).
Response: See response to comment number 32, Part J. Ecology and EPA believe the dissolved oxygen improvement is substantial, particularly given that it occurs despite the significant counter-trend of population growth. We agree that SOD is an important factor in reservoir dissolved oxygen levels. The assumed SOD value is uncertain, but we believe the information in the comment about the reservoir SOD values generally suggests that the value used for the TMDL scenarios is reasonable. According to the comment, the value used for the TMDL falls in the range of that data, albeit at the low end of the range of values – from a dataset that only includes reservoirs and not lakes.
It is also important to note that the model includes not only the “baseline” zero-order SOD set to 0.25 gm2-day but also includes the first order decay of settled organic matter computed dynamically during the simulation (see Figure 119 and 120 in the PSU 2009). Depending on the time and location, this second component of SOD (“sediment uptake”) can be equal or greater than the baseline SOD (“SOD uptake”). Furthermore the definition of AHOD includes water column oxygen demand, and water column demand is accounted for in the model through the decay of the organic matter constituents (labile dissolved organic matter, refractory dissolved organic matter, labile particulate organic matter, and refractory particulate organic matter) and CBOD constituents.
34. Long Lake was considered to operate more like a lake than a reservoir because expected chl concentration related to TP matched that for lakes (Patmont, 1987, p. 176). That is not unusual; chl-TP relationships from reservoirs are typically similar to those from lakes. However, DO
Spokane River / Lake Spokane Dissolved Oxygen Water Quality Improvement Report Page C-67
demand matches that for reservoirs more closely than for lakes. An important reason for that is because hypolimnetic temperature is higher in reservoirs than lakes. Long Lake's hypolimnetic temperature was 16 C, compared to natural lakes with 4-8 C (Patmont, 1987). From Walker's regression attached, the expected AHOD for a chl of 8-15 [ig/L in Long Lake in 1978-1985 is 0.79-1.16 g/m per day, while the observed was even higher than predicted at 1.8-2.6 g/m2 per day and that was after waste water P reduction (Patmont, 1987, p. 62). Observed AHOD averaged 2.2 higher than expected. Expected AHOD for a natural lake with 8-15 lig/L chl from Walker's equation is 0.56-0.74. The highest AHOD in Walker's 38 reservoirs is about 1.26 g/m2 per day. Clearly, Long Lake operates more like a reservoir than a lake. Also, water from up reservoir plunges to below the epilimnion in the lower reservoir during summer causing the slight metalimnetic minimum DO. The plunging forms an interflow that is recognized by conductivity and nitrate and Well's model represents that. That process is less common in lakes.
Response: See Ecology’s interpretation of water quality standards as applied to Lake Spokane in Appendix I of the TMDL.
35. DOE (draft report, 9/09) considers lakes to have residence times > 15 days, therefore Long Lake is classified as a lake and not a reservoir, because its water residence time is 5 days to 50 days (0.14 yr) in summer. Thornton et al. (1990) characterize reservoirs as having residence times of days to several weeks, while in lakes it is one too many years. However, reservoirs with residence times much greater than 15 days (1 year is common) have water inflow and distribution patterns of constituents similar to that in Long Lake. Therefore, Long Lake should be considered a reservoir, based on its higher AHOD than lakes, partly due to higher hypolimnetic temperature, as well as its shape and inflow characteristics.
Response: See Ecology’s interpretation of water quality standards as applied to Lake Spokane in Appendix I of the TMDL.
36. If there is background SOD unaccounted for in the model, what should be used for "no source"? One approach could be to start with a volume-weighted chl concentration that is considered acceptable; that is, volume weighted from the dam (section 188) through to the riverine zone (section 157). Then calculate an AHOD from Walker's regression for reservoirs. Next, allocate a fraction of that calculated AHOD to SOD. Lake research has shown that most of the AHOD is due to SOD, and the rest to decomposition of settling algae. However, Patmont (1987, p. 62) estimated 40 % of AHOD (2.6 mg/m2 per day) was due to SOD (1.08 g/m 2 per day in 1981). In reservoirs, there is also the inflowing organic matter from the river and upper reservoir algal production that accounts for some of the AHOD. These are probably taken care of in Walker's equation, given the higher rates in reservoirs than in lakes. Patmont (1987, p. 63) analyzed organic C inflowing from the river to the reservoir and found it much less important to DO demand than phytoplankton production within the reservoir.
Suppose the oligotrophic-mesotrophic boundary of 3.5 mg/L chl was used to estimate SOD. The related AHOD would be 0.54 g/m2 per day (from Walker, attached). Then say 40 % (from Patmont) of that AHOD is due to SOD, with the remainder due primarily to decomposition of settling algae produced in the reservoir and a lesser amount to inflowing organic matter. That gives about 0.22 g/m2 per day as SOD, similar to the no source 0.25 g/m2 per day rate used in the core model. However, Long Lake AHODs observed in the 1980s were about 2.2 times
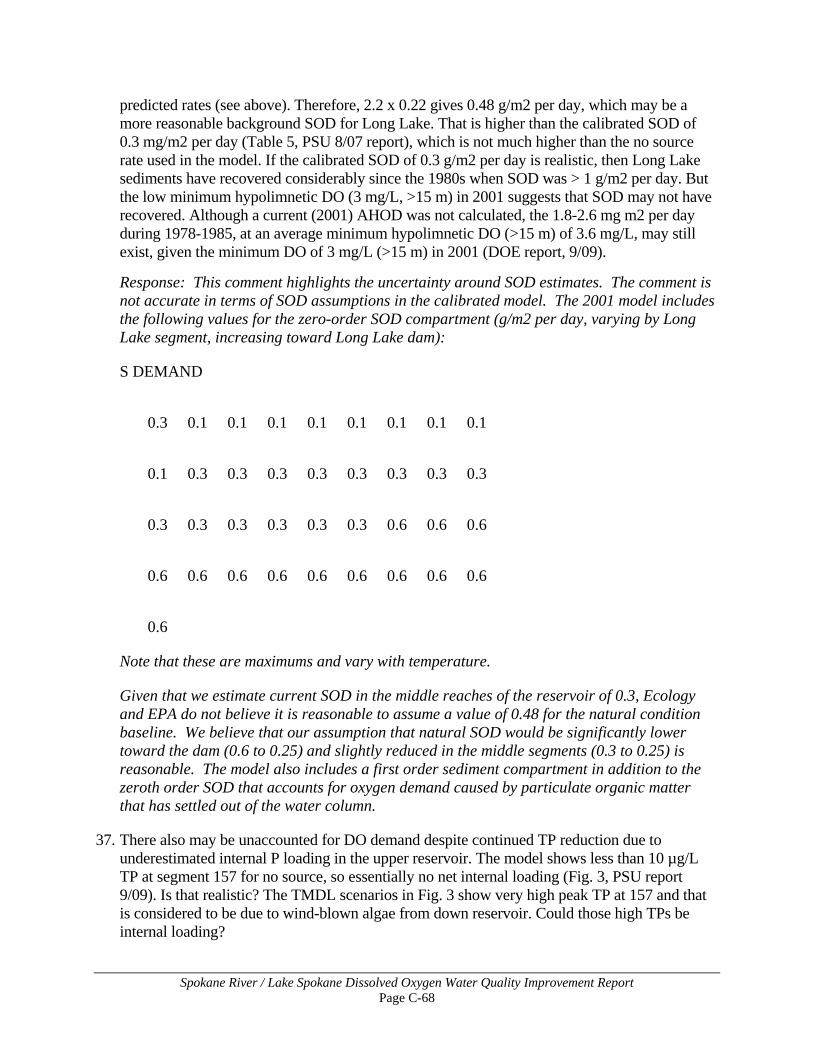
Spokane River / Lake Spokane Dissolved Oxygen Water Quality Improvement Report Page C-68
predicted rates (see above). Therefore, 2.2 x 0.22 gives 0.48 g/m2 per day, which may be a more reasonable background SOD for Long Lake. That is higher than the calibrated SOD of 0.3 mg/m2 per day (Table 5, PSU 8/07 report), which is not much higher than the no source rate used in the model. If the calibrated SOD of 0.3 g/m2 per day is realistic, then Long Lake sediments have recovered considerably since the 1980s when SOD was > 1 g/m2 per day. But the low minimum hypolimnetic DO (3 mg/L, >15 m) in 2001 suggests that SOD may not have recovered. Although a current (2001) AHOD was not calculated, the 1.8-2.6 mg m2 per day during 1978-1985, at an average minimum hypolimnetic DO (>15 m) of 3.6 mg/L, may still exist, given the minimum DO of 3 mg/L (>15 m) in 2001 (DOE report, 9/09).
Response: This comment highlights the uncertainty around SOD estimates. The comment is not accurate in terms of SOD assumptions in the calibrated model. The 2001 model includes the following values for the zero-order SOD compartment (g/m2 per day, varying by Long Lake segment, increasing toward Long Lake dam):
S DEMAND
0.3 0.1 0.1 0.1 0.1 0.1 0.1 0.1 0.1
0.1 0.3 0.3 0.3 0.3 0.3 0.3 0.3 0.3
0.3 0.3 0.3 0.3 0.3 0.3 0.6 0.6 0.6
0.6 0.6 0.6 0.6 0.6 0.6 0.6 0.6 0.6
0.6
Note that these are maximums and vary with temperature.
Given that we estimate current SOD in the middle reaches of the reservoir of 0.3, Ecology and EPA do not believe it is reasonable to assume a value of 0.48 for the natural condition baseline. We believe that our assumption that natural SOD would be significantly lower toward the dam (0.6 to 0.25) and slightly reduced in the middle segments (0.3 to 0.25) is reasonable. The model also includes a first order sediment compartment in addition to the zeroth order SOD that accounts for oxygen demand caused by particulate organic matter that has settled out of the water column.
37. There also may be unaccounted for DO demand despite continued TP reduction due to underestimated internal P loading in the upper reservoir. The model shows less than 10 µg/L TP at segment 157 for no source, so essentially no net internal loading (Fig. 3, PSU report 9/09). Is that realistic? The TMDL scenarios in Fig. 3 show very high peak TP at 157 and that is considered to be due to wind-blown algae from down reservoir. Could those high TPs be internal loading?
Spokane River / Lake Spokane Dissolved Oxygen Water Quality Improvement Report Page C-69
Is there sediment P flux (internal loading) in the upper reservoir during spring and early summer that causes DO depletion and how much is that effect? The aerobic and anaerobic flux rates that Owens and Cornwell determined in plant beds are quite high; aerobic averaged 3 mg/m2 per day at sites 3, 4 and 6 and anoxic 20 mg/m2 per day at site 5, and 7 mg/m2 per day at site 7.5. Those rates are larger than those determined by similar methods in cores from Moses Lake (outside plant beds), and 30% of the total TP load at the time was net release from sediments, determined by mass balance. No cores were collected from outside plant areas in Long Lake. The problem is, internal loading that actually occurs in shallow, unstratified lakes (and reservoir riverine and transition zones) cannot be estimated from cores in the lab. That has to be done by mass balance or observing the rate of increase in the lake. There are several mechanisms that cause release in shallow lakes; Owens and Cornwell mention only two. There is probably a combination of oxic and anoxic release that goes on, but anoxic conditions at the sediment water interface come and go with mixing conditions and are difficult to detect, as they attest to bottom p. 22 – first bullet – of their report. The fact that Owens and Cornwell got any release at all under oxic conditions is significant – some shallow lake sediments have no oxic release determined from cores in the lab, yet have relatively high net internal loading determined from mass balance.
Net sediment P flux should be determined by mass balance using model derived water movement through several of the upper reservoir segments along with observed TP. However, observed data appear to be inadequate. The only data and model output from sta. 4 are for chi (PSU, 5/09, p. 64). The average for the three observed chi values is about 35 µg/L, so TP would have been at least 70 µg/L and maybe higher (a typical chl:TP ratio is – 0.35). Most of that TP would have had to come from net sediment flux, given an inflow TP of 20-25 Kg/L (if not from wind-blown algae). Riverine and transition zones (without macrophyte beds) are often important sources of TP and organic matter (algae) that affect DO in the lower reservoir's meta and hypolimnion. That effect occurs in Long Lake as represented in the model, according to Scott Wells.
Response: The location, timing, and magnitude of internal loading (from sediments) of phosphorus is difficult to ascertain from the available data, but the model includes estimates of the internal flux of phosphorus from the sediments. Estimated phosphorus fluxes from the model simulation were calculated and documented in PSU (2009) (Figures 121 – 123). Based on these estimates, which provide a reasonable calibration outcome, the sediment flux process does not appear to be a dominant source of phosphorus to the water column compared to loads entering from the mainstem river. This is also indicated by Patmont (1987) where the change in total phosphorus loading in the 1970's and 1980's significantly influenced hypolimnetic dissolved oxygen. Since reservoir phosphorus concentrations observed in 2001 are reasonably matched in the model simulation for 2001 (and other years previously tested in model development), we conclude that the internal loading estimates are also reasonable
38. All of the information and comments provided in the Spokane River Stakeholder Group / SRSP letters to Ecology and EPA during the development of the Draft DO TMDL should be considered as comments to the Draft DO TMDL. All of these letters (dated February 25, 2009; April 3, 2009; April 10, 2009; May 6, 2009; May 29, 2009; and August 27, 2009) are attached to ensure they are part of the official comment record.
Spokane River / Lake Spokane Dissolved Oxygen Water Quality Improvement Report Page C-70
Response: Ecology and EPA have reviewed these letters and included some comments that were not submitted during the comment period but that have some relevance to TMDL analysis and decisions, along with responses.
39. The draft DO TMDL discusses water quality modeling results as if they are a precise measure of reality, and of Avista’s level of legal responsibility for achieving water quality standards. This is inconsistent with the comments of Ecology and EPA during the public meetings, where EPA’s lead modeler, Mr. Ben Cope, and others repeatedly acknowledged that a water quality model is not itself reality, but is rather a “pretty good representation” of what is happening in the Spokane River and Lake Spokane, based on a number of assumptions. These latter comments are consistent with comments by Ecology early in the TMDL process (2004), when it stated that “the model provides a good approximation of the major forcing processes and features of the system that affect water quality such as the hydrodynamics of Lake Spokane, pools associated with the dams, periphyton growth, and pollutant loading.” Cusimano, R. F., 2004, Spokane River and Lake Spokane (Long Lake) Pollutant Loading Assessment Report for Protecting Dissolved Oxygen (Cusimano 2004) at 56.
This more cautious characterization of the modeling results also reflects the limited amount of actual data used to verify the model. The entire model is based on DO measurements gathered over a period of nine days; two days at six stations in 2001, and on seven days at two stations in 2000. Wells, S. and C. Berger, June 2009, Spokane River Modeling Report 2009: Model Update and Calibration Check at 52 and 83. Thus the apparent precision of Table 6 [Table 7 in final TMDL], with its 32 lake segments and 14 semi-monthly periods, each with DO values expressed in tenths of micrograms, is derived by substantially extrapolating and interpolating the actual data. It is important that this be acknowledged in the final DO TMDL so that those who implement it (most of whom will not be trained modelers) will understand and appreciate that the modeling results are but one simulated measure of success, not the sole indicator of compliance. Response: The entire model is not based on data gathered over 9 days. We refer to the series of reports on the model development and calibration on the PSU or Ecology website.
The TMDL does not describe the model predictions as a “precise measure of reality;” on the contrary, sources of uncertainty are described in the TMDL (Appendix E) and modeling reports showing the difference between predicted and measured water quality conditions are available for review.
While EPA and Ecology recognize the uncertainty in model predictions, we also believe the modeling results provide the best available information for development of the TMDL.
Table 7 is not “derived by substantially extrapolating and interpolating the actual data.” The numbers are direct outputs from the TMDL Scenario #1 river simulation. The model is developed not only with the available data for dissolved oxygen in the reservoir (that portion of the data that the commenter focuses on) but also includes: temperature, nutrients, river flow, groundwater flow, reservoir elevation, point source discharge, weather data, and tributary inputs. For this reason, the statement that the “entire model is based on dissolved oxygen measurements…” is unreasonably narrow.
Spokane River / Lake Spokane Dissolved Oxygen Water Quality Improvement Report Page C-71
Ecology and EPA disagree with the comment that the values in Table 7 are “but one simulated measure of success”. These values represent the best estimate of necessary improvements to water quality in the reservoir, in combination with the upstream allocations. We agree, however, that the values in Table 7 are derived from model estimates for a particular low-flow year (2001). Future compliance and implementation assessments may employ supplemental analyses of the departure from natural conditions under a range of seasonal conditions. On a related note, a wider range of seasonal conditions should be considered in the development of Avista’s water quality attainment plan.
40. The draft DO TMDL states that the top 8 meters have “amplified algal activity which increases daytime dissolved oxygen levels.” Draft DO TMDL at 36. However, the draft DO TMDL neglects to mention that amplified algal activity (i.e., respiration) reduces DO levels at nighttime. Thornton et al., 1990, Reservoir Limnology: Ecological Perspectives at 75. Because the draft DO TMDL measures compliance with the numeric DO criteria on the basis of a daily minimum (i.e., the minimum over a 24 hour period), the fact that algal activity may increase the daytime DO levels is not a reason to exclude the upper 8 meters from the analysis.
Response: This comment warranted more analysis to determine if exclusion of the top 8 meters might be resulting in a lower responsibility than is warranted. Ecology directed PSU to run a “March Test” with the water quality model, in which point source discharges were set to a positive flow only in the month of March and set to zero for the rest of the year, with all other inputs set to the No Source condition. The model outputs for reservoir oxygen impacts were expanded to include: 1) locations below 8 meters depth and 2) the entire water column from surface to bottom.
The March Test scenario shows lower dissolved oxygen in the reservoir than the No Source results. Therefore, the assumption that March discharges have an impact on reservoir dissolved oxygen is reasonable.
41. The Draft TMDL correctly states that the state of Washington does not have any authority to set wasteload allocations for Idaho dischargers, Draft TMDL, at 28. The same section of the Draft TMDL nonetheless claims that “Ecology has worked closely with EPA to develop very specific assumptions about the anticipated permit-driven reductions of anthropogenic loading of phosphorus, CBOD, ammonia from wastewater treatment plants and stormwater in Idaho.” Draft TMDL, at 29.
Please confirm that the “very specific assumptions” described in this statement are the modeling assumptions used by Portland State University (PSU) to develop the water quality modeling described in the Draft TMDL. The assumptions are set forth in the PSU Spokane River Modeling Scenarios Report 2009 (September 15, 2009), Table 2 (“PSU Report”). In response to these comments please disclose any other “very specific assumptions” that are referenced on page 29 of the Draft TMDL.
Response: The PSU scenario report includes all model inputs for the Idaho discharges. This is a technical report, however, and a number of the model inputs reflect coordinated policy/technical determinations by both EPA and Ecology prior to the modeling. The agencies defined all TMDL scenario inputs, and PSU ran the model simulations, processed the model output, and reported the results.
Spokane River / Lake Spokane Dissolved Oxygen Water Quality Improvement Report Page C-72
42. Washington has many homes along both sides of Long Lake's nearly 24-mile length. Most of these homes are on septic tanks, which leach nutrients into the groundwater. Much of this groundwater is hydraulically connected to the water in Long Lake. In turn, the nutrients from these septic tanks, including phosphorus, enters Long Lake. Ecology has created a regulatory structure that has allowed these septic tanks to contribute phosphorus to Long Lake for decades. A count of structures in an aerial photograph shows that there are about 1,600 septic systems in the vicinity of Long Lake, of which about 25 percent are within 500 feet of the shoreline…This source of phosphorus, directly adjacent to slow-moving Long Lake, is not identified in the Draft Report.
In modeling from where the sources of phosphorus are coming, Ecology has made a judgment to ratchet down the far-away dischargers in Idaho, rather than clean up the septic tanks adjacent to the problem areas in Long Lake reservoir. This is not permissible.
Response: See summary response for Part J related to Lake Spokane surface/groundwater. Ecology expects that nonpoint sources along Lake Spokane will be addressed through Avista’s water quality attainment plan in order to meet its dissolved oxygen responsibility.
43. The waste load allocation assigned to IEP must consider the nonreactive fraction of phosphorus in IEP’s effluent. IEP supports the inclusion of the bio-available phosphorus loading in the “Target pursuit actions – delta elimination section of the Managed Implementation Plan” (Draft DO TMDL, at 49). The modeling used to develop the TMDL does not accurately consider the fraction of phosphorus in IEP’s effluent that is reactive and therefore biologically available in the Spokane River and Lake Spokane.
IEP’s inability to obtain ultra-low TP levels with tertiary treatment is due to a significant fraction of non-reactive phosphorus in its pulp and paper mill effluent. This characteristic of IEP’s effluent was repeatedly confirmed during IEP’s pilot testing of eight different state-of-the art tertiary treatment technologies, long-term operation of IEP’s full-scale tertiary treatment system, research conducted at other pulp and paper mills, and through several bio-availability studies. IEP’s pilot test results that first documented this observation were submitted to Ecology and EPA for consideration. NCASI Technical Bulletin No. 879 “Biodegradability of Organic Nitrogen and Phosphorus in Pulp Mill Effluents was submitted to Ecology and a Technical Subcommittee for further consideration. IEP also furnished Ecology and the Technical Subcommittee, the results of two studies that were commissioned by IEP to study this issue. A memorandum by the National Council for Air and Stream Improvement, Inc. (NCASI) dated August 30, 2006, reports the results of a 133-day study of reactive potential of phosphorus in the IEP effluent. The report states that “essentially no organic nitrogen or phosphorus was converted to bio-available (inorganic) forms.” A more recent phosphate biodegradation report by researchers at Washington State University provides more conclusive evidence that a significant portion of the phosphorus in IEP’s effluent is not bio-available. That report found in an 87-day test that Total Phosphorus (TP) concentrations remain relatively constant over time IEP is currently participating in a watershed-wide “Phosphorus Bioavailability Study” in conjunction with Ecology and the University of Washington.
Spokane River / Lake Spokane Dissolved Oxygen Water Quality Improvement Report Page C-73
IEP’s inability to remove the non-reactive fraction of phosphorus from its pulp and paper mill effluent is well documented and restricts its ability to achieve the effluent limits defined in the TMDL. In order to meet the WLAs, the TMDL must include an offset of this non-reactive phosphorus. Response: There is currently no standard method or protocol for quantifying the non-biodegradable fraction of phosphorus in an effluent sample. Ecology has provided correspondence to IEP and others in late 2008 stating why the studies referenced in this comment failed to satisfactorily determine the bioavailable fraction of phosphorus. As IEP is aware, Ecology is providing half of the funding for a bioavailable study being conducted by the University of Washington (the other half being provided by the dischargers) with an estimated completion date in 2011. It is possible that the findings from this study would support, following approval by Ecology, a higher phosphorus permit limit in subsequent permit cycles. This is explained in the “Managed Implementation Plan” section of the TMDL and in the response to comment 18, Part N.
In the context of a TMDL requiring a margin of safety, we believe it is reasonable to establish WLAs on the total phosphorus in the effluent discharges.
The model inputs for IEP reflect an estimated ratio of inorganic to organic phosphorus, and a reasonable decay rate for the expected effluent after upgraded treatment. The agencies have considered IEP input on these model input values for their discharge in the final TMDL scenario run.
44. Ecology's modeling efforts should be adjusted so that the WLAs and LAs in this TMDL meet the downstream water quality standards of the Tribe.
…The Tribe has modeled two scenarios for the lower arm of the Spokane River. The existing conditions were modeled with 2001 flow data and 2006 water quality data. Scenario number one modeled the 2009 Draft TMDL and reset the D.O. levels to 8 mg/L at the tailrace of Lake Spokane Dam. Scenario number two again used the 2009 Draft TMDL, but reduced the tributary reductions to the 2001 levels and reset the D.O. levels to 8 mg/L at the tailrace of Lake Spokane Dam. 8 mg/L of D.O. was used based on Avista’s assurances that it would meet that level. The second scenario used 2001 tributary numbers because the proposed reductions in tributary loading appear unachievable at this time. The results indicate dissolved oxygen levels far below the Tribe’s 8 mg/L standard for a sustained period. Ecology must meet the Tribes downstream water quality standards and the 2009 Draft TMDL does not provide reasonable assurances that it will meet the 8 mg/L standard. Ecology should rework the 2009 Draft TMDL to ensure that it meets water quality standards throughout the Spokane River reaches, including the downstream arm.
Response: See summary response for Part M.
45. Known pollutant sources adjacent to Long Lake which contribute to the non-attainment of Washington’s water quality standards have not been included in the draft report… (see Post Falls letter, exhibit A).
Spokane River / Lake Spokane Dissolved Oxygen Water Quality Improvement Report Page C-74
Response: See summary response to Part J regarding concerns about groundwater and Lake Spokane surface/groundwater. The model analysis does include anthropogenic phosphorus from groundwater and other sources in the lake watershed.
Regarding agriculture, we do not have any data for phosphorus in runoff from the agricultural areas described in the comment. As noted above, the anthropogenic phosphorus entering the lake from the lake watershed is likely set at a conservatively high loading. Ecology expects reduction of nonpoint sources along Lake Spokane to be the focus of Avista’s water quality attainment plan.
Regarding the hatchery on the Little Spokane River, the TMDL allocations do not reach upstream into the tributaries. This TMDL scope only includes the loading from the tributary mouths. The hatchery may be part of TMDL implementation in the Little Spokane watershed.
46. In reference to the point sources, the TMDL repeatedly uses the term “seasonal average” to describe effluent concentrations and wasteload allocations. The modeling scenarios that were developed to help identify potential WLA’s use terminology such as maximum monthly average and long-term average to describe different concentrations of effluents used in the modeling analysis. Please provide a definition of seasonal average that is consistent with the terminology used in the modeling analysis and better describes how Ecology is using these various terms.
Response: The modeling scenarios apply a constant concentration for the time period identified in the scenario setups (PSU 2009 scenario report tables). This is considered a long term average discharge. The NPDES permits must address the translation of this model input into a “matching” permit limit over a specified time frame (e.g., daily maximum, monthly average, seasonal average). Depending on the time frame of the permit limit, the limit value may differ from the model input. The model scenario tables were devised to show the estimated monthly average permit limits associated with a particular model input. Changes have been made to Table 3 to clarify long-term average periods.
47. In the section on Load and Wasteload Allocations, Ecology shows equation #1 to describe how wasteload allocations are calculated from an effluent concentration. Table 4 lists the effluent concentration for each point source which were derived from Scenario #1. The TMDL and PSU modeling report do not adequately describe the differences between the permit limits and the modeling limits and why Ecology chose to use the lower effluent limits versus the maximum monthly averages to calculate the wasteload allocation.
Response: The TMDL and supporting technical documentation includes information about the statistical relationship between the model input values, TMDL wasteload allocation values, and NPDES permit limits. The goal is to reduce potential confusion in (1) aligning model assumptions with wasteload allocations expressions and (2) aligning future development of NPDES permits limits with the TMDL. Table 2 in PSU (2009) includes all the relevant information and references regarding the statistical relationships. The table indicates that the wasteload allocation value is equal to the model input value; however, the estimated permit limit is not necessarily equal to the wasteload allocation. This is because the model input and wasteload allocation are long term averages, while the permit limit is commonly expressed as a monthly average value.
Spokane River / Lake Spokane Dissolved Oxygen Water Quality Improvement Report Page C-75
48. Suggestion/Request: …the regulatory agencies should run additional model iterations at progressively higher effluent concentrations to determine the upper boundary condition that achieves the water quality standard…
Response: The modeling analysis for this TMDL does not involve progressive iterations (i.e., trial and error) simulations to achieve the water quality standard, because the Avista responsibility is factored into the analysis. The agencies had to weigh any increases in point source phosphorus allocations against the commensurate increase in Avista responsibility caused by those increases. See summary response to Part R.
49. Suggestion/Request: Run enough appropriate scenarios to determine the nutrient concentrations (e.g. Ammonia) that achieve the water quality standard, rather than assigning predetermined concentrations.
Response: See response to comment number 48, Part J.
50. Suggestion/Request: We [Spokane River Stewardship Partners] strongly recommend the use of assessment points in the lower Spokane River and in the transition zone at the upper end of Lake Spokane reservoir. Also, the approach to selecting and averaging cells to determine whether the model predicts compliance with the 0.2 mg/L differential water quality standard needs to be explicitly defined and consistent with the management of the Lake Spokane reservoir. The approach needs to recognize the accuracy and precision of the model in both a longitudinal and vertical direction. An approach that incorporates exceedance frequency would better describe the variability in water quality and the ability of the model to predict the small differences in water quality that form the basis for the water quality criteria being applied.
Response: The averaging approach applied to reservoir model predictions is clearly described in the TMDL, and it strikes a balance between the need to identify critical conditions and the uncertainty in model predictions. The use of average values across time and space, rather than instantaneous maximum values, addresses concerns and suggestions in the comment about exceedance frequency.
51. Suggestion/Request: We [Spokane River Stewardship Partners] encourage the agencies to model years other than just 2001 to gain an understanding of the variability of the effects of nonpoint and point source discharges, and establish to what degree 2001 is representative of a 1 in 10 year occurrence.
Response: The hydrographic record indicates that 2001 is representative of 1 in 10 year low flow conditions. There is no limit on the number of years that one could analyze to evaluate potential future variability. Additional-year assessments are not needed to develop a reasonable TMDL. The year 2001 has two unique features that make it a good candidate for the TMDL. One is the low flow conditions, which tend to increase impacts because of less dilution in the system. The second is that 2001 was one of the years for which calibration was conducted, so the uncertainty of the underlying model can be readily reviewed and considered.
Spokane River / Lake Spokane Dissolved Oxygen Water Quality Improvement Report Page C-76
K. Selection of TMDL Scenario Summary: In Ecology’s selection of the TMDL modeling scenario, they have ignored the fact that the differences between the chosen scenario (#1), which is based on a monthly average total phosphorus wasteload allocation of 50 µg/L, are negligible compared to the less stringent Scenario #2, which is based on a seasonal average total phosphorus wasteload allocation of 50 µg/L. Meeting the wasteload allocations in an NPDES permit based on a monthly average of 50 µg/L will be next to impossible with advanced wastewater treatment technologies alone.
Summary Response: Ecology has been very clear and deliberate in providing the specific reasons for its selection of TMDL Scenario #1. The following text appears in the Modeling Selection, Results, and Discussion section of the TMDL and in an earlier memo prepared on August 11, 2009. While Ecology recognizes the challenge in meeting these wasteload allocations, many of the perceived challenges will be further clarified in draft NPDES permit limits (i.e., how they are averaged) and conditions (delta management plans for Washington dischargers).
From the Modeling Selection, Results, and Discussion section of the 2009 draft TMDL: In selecting a TMDL scenario, Ecology must choose a scenario that achieves compliance with water quality standards. Based on all of the available information and considerations for this TMDL, Ecology believes TMDL Scenario #1 is appropriate and proposes the load and wasteload allocations based on this scenario for the following reasons:
• Implementation of these wasteload allocations will result in an average total phosphorus concentration in the upper, riverine section of Lake Spokane (model segment 154) of 10 µg/L from June through September (see Figure 3).
• TMDL Scenario #1 reduces the average total phosphorus load of 350 lbs/day to Lake Spokane (model segment 154) by approximately 66 percent from March to October under TMDL Scenario #1. The human caused total phosphorus load is reduced by an average of 85 percent over the same time period.
• Analysis of findings in the PSU (2009) report show that TMDL Scenario #1 represents an average of approximately 6 lbs/day less total phosphorus in Lake Spokane (model segment 154) compared to TMDL Scenario #2 from June through September considering sources in both Washington and Idaho. Lower phosphorus levels benefit dissolved oxygen in Lake Spokane and Tribal waters downstream.
• TMDL Scenario #1 results in an average of approximately 0.04 mg/L more dissolved oxygen than TMDL Scenario #2 from June through September.
• Modeling results for TMDL Scenario #1 show that the greatest dissolved oxygen difference from background conditions in Lake Spokane is 1.38 mg/L, and occurs during the August 16-31 time period in the deep model segments closest to Long Lake Dam (see Table 7 [Table 6 of draft TMDL] and Figure 2). Avista will be required to develop a WQAP, which will describe all measures that will be taken to improve dissolved oxygen in Lake Spokane. The proposed wasteload allocations in conjunction with the load allocations and water quality improvements by Avista are designed to achieve the water quality standard for dissolved oxygen in Lake Spokane.
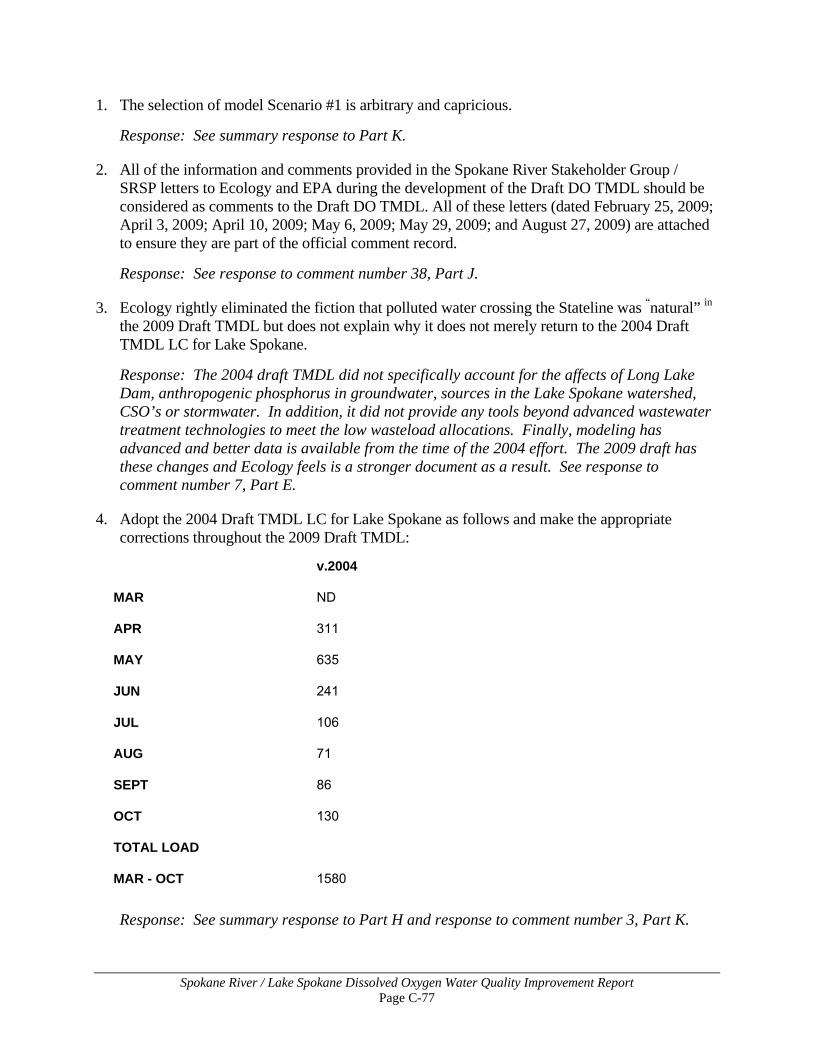
Spokane River / Lake Spokane Dissolved Oxygen Water Quality Improvement Report Page C-77
1. The selection of model Scenario #1 is arbitrary and capricious.
Response: See summary response to Part K.
2. All of the information and comments provided in the Spokane River Stakeholder Group / SRSP letters to Ecology and EPA during the development of the Draft DO TMDL should be considered as comments to the Draft DO TMDL. All of these letters (dated February 25, 2009; April 3, 2009; April 10, 2009; May 6, 2009; May 29, 2009; and August 27, 2009) are attached to ensure they are part of the official comment record.
Response: See response to comment number 38, Part J.
3. Ecology rightly eliminated the fiction that polluted water crossing the Stateline was “natural” in the 2009 Draft TMDL but does not explain why it does not merely return to the 2004 Draft TMDL LC for Lake Spokane.
Response: The 2004 draft TMDL did not specifically account for the affects of Long Lake Dam, anthropogenic phosphorus in groundwater, sources in the Lake Spokane watershed, CSO’s or stormwater. In addition, it did not provide any tools beyond advanced wastewater treatment technologies to meet the low wasteload allocations. Finally, modeling has advanced and better data is available from the time of the 2004 effort. The 2009 draft has these changes and Ecology feels is a stronger document as a result. See response to comment number 7, Part E.
4. Adopt the 2004 Draft TMDL LC for Lake Spokane as follows and make the appropriate corrections throughout the 2009 Draft TMDL:
v.2004
MAR ND
APR 311
MAY 635
JUN 241
JUL 106
AUG 71
SEPT 86
OCT 130
TOTAL LOAD
MAR - OCT 1580
Response: See summary response to Part H and response to comment number 3, Part K.
Spokane River / Lake Spokane Dissolved Oxygen Water Quality Improvement Report Page C-78
5. As previously discussed with Ecology, the County, continues to believe that Scenario # 2 should be the preferred solution because it appears that there is very little difference in the amount of phosphorous discharged to the river between Scenario #1 and #2, and we understand that Scenario # 2 meets the criteria in the River at Segment 154. Because the difference between the two scenarios is minor as compared to the burdens imposed on the dischargers by selecting Scenario #1, the County again requests that Ecology select Scenario #2 for this TMDL.
Response: See summary response to Part K.
6. Ecology should also explain the justification for how the eco-region criteria are actually applied in the TMDL analysis. Scenario #1 is justified because it meets a 10 µg/L eco-region criterion 65% or 106 days during the critical times of the year. Scenario #2 meets the same criterion 62% of the time, a difference of less than five days compared to Scenario #1. Why is this slight difference in achieving the ad-hoc phosphorus criterion a deciding factor in the selection of Scenario #1 for establishing WLAs? Ecology should acknowledge that the modeling results for both scenarios demonstrate achievement of the legally established phosphorus criteria for total phosphorus under the EPA approved water quality standards. WAC 173-201-602, Table 602.
Response: See summary response to Part K and Part T. The ecoregion criteria benchmark was but one consideration listed among the five main bullet points and have not been adopted as a standard.
7. It is not readily apparent from the TMDL that Ecology considered the benefits of Scenario 1 over Scenario 2 in light of the underlying costs of achieving these benefits. For example, in order to achieve the 0.04 mg/L increase in dissolved oxygen (TMDL p. 21) the community may need to spend tens of millions of dollars in addition to what is necessary to achieve Scenario 2. For the City of Spokane to achieve an additional 16% reduction in total phosphorous under Scenario 1 vs. 2, the City's ratepayers may need to spend significant additional resources that might better be spent on CSOs or other water quality projects. In addition, the model predicts that total phosphorous concentrations at River segment 154 would be 10 µg/L under Scenarios 1 and 2 but that the WQS could not be achieved in Long Lake under either scenario. If Ecology did not consider the cost of achieving WLAs, then a statement to that effect should be added to the TMDL or the agency's response to comments. The City understands that the TMDL modeling exercises are merely a tool for developing WLA and LA and, as noted above, compliance with WQS and the TMDL will be determined in 10 years using actual ambient water quality, point source waste loads and non-point source loads, as well as modeling at that time.
Response: See summary response to Part K. Cost information is not included in a TMDL analysis and was not considered in this TMDL. However, unique to this TMDL, the investment stability provision in the Managed Implementation Plan should provide dischargers some assurance that sizeable investments will be protected from major change-orders over the first 20 years. Other cost-related factoring and analysis that would be considered outside of the TMDL during permit development includes alternatives such as schedules of compliance, variances, and attainable uses.
Spokane River / Lake Spokane Dissolved Oxygen Water Quality Improvement Report Page C-79
8. In response to these comments please explain both the full results for Scenario #2 and the basis for selecting Scenario #1 over Scenario #2.
Response: This has been done as described in the summary response to Part K.
9. The modeling results for Scenario #1 and Scenario #2 indicate that these are no real differences in the projected TP concentrations at model segment 154. (Exhibit 4.) Exhibit indicates that Scenario #1 model results meet 10 µg/L 65% of the time from March through October. The modeling results also indicate, however, under Scenario #2 that the TP level at model segment 154 will meet 10 µg/L 62% of the time over the same period.
Response: See summary response to Part K.
10. In light of the nearly identical results for both scenarios, Ecology should explain in response to these comments how it made the determination described on page 35 that the “water quality goal at the benchmark location is being used to confirm that when the Spokane River enters the reservoir upstream sources of dissolved oxygen impairment have been reduced to the point where remaining dissolved oxygen impairments in the reservoir is caused by Long Lake Dam and is Avista’s responsibility.” How does Ecology make this determination? How is it legally defensible, equitable or reasonable to impose an allocation on Idaho dischargers that cannot be achieved where Avista is only assigned “responsibility” to “improve” dissolved oxygen conditions in Long Lake?
Response: See summary responses to Part A and K as well as response to comment number 1, Part A. To be clear, wasteload allocations have not been imposed on Idaho point sources in the TMDL.
Spokane River / Lake Spokane Dissolved Oxygen Water Quality Improvement Report Page C-80
L. Spokane County New Discharge Summary: The TMDL appears to allow Spokane County, which currently does not have a discharge into the Spokane River, a permit to do so. Based on recent case law, new dischargers may not be allowed into waterbodies with a TMDL. Summary Response: This TMDL does not provide a permit for the county nor does it approve of any delta credits such as for septic tank elimination. Whether or not septic tank elimination is accepted towards meeting the county’s phosphorus wasteload allocation will be determined following approval of the TMDL and when the county applies for a permit. If a permit is issued, Spokane County will not have a ten year compliance schedule as the other Dischargers will, but must be in compliance with the water quality based permit limit (based on the TMDL wasteload allocation) when it is first operational. Ecology is aware of recent case law on this issue. If a permit is issued to the County for discharge to the Spokane River, it will comply with legal requirements. 1. The County should not be allowed any discharge unless all parties meet their pollution targets.
And the County should not be allowed to build a new wastewater plant that will further pollute the river.
Response: See summary response to Part L. The TMDL does not allow Spokane County to discharge into the river. It merely accounts for that possibility.
2. The new Spokane County Plant, once it reaches peak operations, may require 2 years, assuming conditions like flows and temperature are average during both years. While considering the combination of offset actions and the Counties water treatment for the volume to be discharged achieving 10µg/L phosphorus. The reasonableness for compliance of interim discharge limits has a relatively short duration proposed.
Response: Under this version of the TMDL, Spokane County must meet a final wasteload allocation of 42 µg/L total phosphorus (2.8 lbs/day mass equivalent), not 10 µg/L. As described in the “Managed Implementation Plan” section of the TMDL, the new county plant is expected to meet this limit when it begins normal, routine operations, likely in 2011. In other words, there are no interim limits for the County. The County would, however, be allowed to use delta management (target pursuit actions) to meet their nutrient permit limits.
3. Ecology should comply with the offset rules [offsets cannot be granted prior to the pollutant reductions being accomplished] and the decision of the Ninth Circuit and refuse to allow additional loading until loading capacity exists in the receiving water.
Response: Ecology intends to comply with the offset rule as well as applicable caselaw in regulating discharges from a new County facility.
4. For technical and legal reasons, the County’s septic elimination proposal for water quality offsets is insufficient and will not support issuance of an NPDES discharge permit for the proposed new treatment plant.
Response: See summary response for Part L.
Spokane River / Lake Spokane Dissolved Oxygen Water Quality Improvement Report Page C-81
5. The Draft DO TMDL should unequivocally state that the proposed Spokane County wastewater treatment plant will not be granted an NPDES permit until such time when Spokane River has the capacity to accept such pollutant loading, while continuing to meet applicable water quality standards. (2) Ecology should explain the legal authority and legal difference between "target pursuit actions" and "Delta Management" when they appear to be just different terms for water quality "offsets." In short, "target pursuit actions" or "delta management" are identical to "offsets" described in WAC 173-201A-450 (Ex. 5), and should be treated accordingly.
Response: See response to comment number 3, Part L.
6. Page 57: "In addition, the Spokane County's new wastewater treatment plant is currently under construction and will be in operation after this TMDL is approved." This sentence is under the section: "What is the schedule for achieving water quality standards?" This sentence should be removed from this section. Construction of the new plant will increase pollution discharges in the River, and should not be listed as a scheduled action item for achieving the opposite goal.
Response: Ecology has made the requested change but Ecology disagrees that pollution will be increased to the river. Instead, if the County is able to get an NPDES permit, that will mean a portion of the wastewater currently treated by the City of Spokane will received advanced treatment years earlier than it would without the County plant. That is because a significant portion of the county’s wastewater is already treated and discharged by the City of Spokane. The new county plant would be required to treat that existing discharge to a higher level, mostly through advanced treatment technology but also (upon Ecology approval) through target pursuit actions as described in the summary response to Part N. Further details would be provided in a draft NPDES permit for the county.
7. Table 3 incorrectly lists Spokane’s WWTP discharge as 50.8 mgd and the County of Spokane at 8 mgd. The County currently has no plant and no discharge. The 2009 Draft TMDL fails to explain how additional loading can be authorized for plant expansion (City of Spokane) or building a new plant (Spokane County) without adequate loading capacity in the receiving water.
Response: Table 3 correctly identifies the amount of wastewater the County is currently authorized to discharge from Spokane’s WWTP. Discharges from a new County facility or from an expanded City facility will be regulated in accordance with applicable requirements.
8. We [City of Spokane Valley] are under a fear that if we do not get new discharges, we are not gonna be able to continue the elimination of septic systems out there, because we are running out of capacity. As you're aware, we have 10 million gallons capacity at the City of Spokane plant in which we can allocate our particular discharges into. We are running out of that capacity. We don't have capacity for new development in the future and near future. And we do not have capacity to continue the elimination.
Response: Comment noted.
9. The assertion that zero discharge for the county is absurd on its face in that the county already discharges through existing septic tanks in the City of Spokane's facility. Not allowing the
Spokane River / Lake Spokane Dissolved Oxygen Water Quality Improvement Report Page C-82
county to go forward with their plant only harms the effects of this proposed TMDL and further damages the residents of our region through unrealistic expectations with the continuation of current practices. With this TMDL there's a light at the end of the tunnel for county users, county residents. Should the opposition's position prevail going forward, the light may very well be an oncoming train.
Response: Comment noted. See summary response for Part L.
10. It is absolutely impossible from a technological perspective to get all of those discharges to the Riverside facility, treatment facility located on the west end of the City of Spokane. The piping infrastructure simply is not capable of handling those flows through downtown Spokane. And you'd literally tear up downtown Spokane and have to rebuild it to change that infrastructure.
Response: Comment noted.
11. The draft plan would allow Spokane County to stick another pipe into the river and discharge from its new sewage treatment plant based on incorrect assumption that septic removal equates to phosphorous reduction in the river.
Response: See summary response for Part L.
12. Removing septic tanks from the Aquifer is good, but will not reduce phosphorus loading to the Spokane River. The draft plan would allow Spokane County to stick another pipe into the River and discharge from its new sewage plant based on the incorrect assumption that septic removal equates to phosphorus reduction in the River.
Response: See summary response for Part L.
13. As set forth in Sierra Club’s comments on the second draft of the DO TMDL, dated 11/13/07 at pp. 45-48, Spokane County cannot obtain a new NPDES permit to discharge into the Spokane River. It is improper to assign a waste load allocation or compliance schedule to Spokane County, or to assume the efficacy of water quality offsets, for its as-yet un-built wastewater treatment plant. Given the assignment of unattainable load reductions to the tributaries and Avista, there is no new capacity for NPDES discharges into the Spokane River. Absent affirmative showing of new capacity, the draft TMDL improperly assigns a WLA to Spokane County.
Response: Ecology does not agree that Avista’s DO responsibility or the load reductions in the tributaries are unattainable.
14. From a policy perspective, it is particularly disappointing that the draft TMDL assigns a WLA to Spokane County because the County has recently issued its Reclaimed Water Use Study (Final Report, June 26, 2009) indicating good potential for end uses of reclaimed water from the proposed new treatment plant. See Spokane County Utilities Water Reclamation Program webpage, which includes substantial information, including the cited report, concerning reclamation and reuse of County WWTP wastewater, incorporated by reference, at http://www.spokanecounty.org/utilities/waterreclamation/content.aspx?c=2224. Assigning a WLA to the County raises false hopes that a critical season discharge permit is available and provides a major disincentive for aggressive pursuit of a zero discharge reclaimed water program.
Spokane River / Lake Spokane Dissolved Oxygen Water Quality Improvement Report Page C-83
Response: See summary response for Part L. The County will likely need to aggressively pursue wastewater reuse and conservation to meet the wasteload allocations in this TMDL (assuming they are issued a permit) on the first day of operation.
15. First, this draft describes a method by which Ecology plans to issue an NPDS permit for a new discharger that is contrary to both Federal and State law. Both Federal regulation and Washington Administrative Code will be violated by this plan.
Response: See response to comment number 3, Part L.
16. The TMDL provides a WLA for a new point source discharge- Spokane County (8 mgd at a TP concentration of 42 pg/L for a load of 2.80 lb./day). It is not clear how this is considered an "equitable" distribution of the point source reductions when it is actually an additional load. The allowance for population growth within Spokane County that this WLA provides takes away from the other existing point sources and the loads that can be discharged in Idaho. Please provide a more complete explanation of the logic behind allowing a new source and load to an already over-allocated watershed.
Response: See response to comment numbers 3 and 6, Part L.
17. It is likewise absurd to expect to obtain enough reduction from Inland Paper to be able to permit another municipal discharge into the River.
Response: See summary response for Part L.
18. The plan can't continue to allow the County of Spokane to discharge sewage into the river based on removing septic systems from the Aquifer. That doesn't remove phosphorus to the river.
Response: See summary response for Part L.
Spokane River / Lake Spokane Dissolved Oxygen Water Quality Improvement Report Page C-84
M. Spokane Tribe of Indians / Spokane Arm Water Quality Summary: Ecology's modeling efforts should be adjusted so that the wasteload allocations and load allocations in this TMDL meet the downstream Spokane Tribe’s water quality standards. Preliminary (at the time of public comment period) Spokane Tribe modeling results indicate that the WLAs and LAs upstream from the Tribal waters will not be adequate to meet the Tribe's water quality standards. Alternatively, the TMDL should acknowledge that Tribal standards will not be met by the TMDL. Portions of the Tribe's waters are currently uninhabitable for aquatic life. Summary Response: The preliminary Spokane Arm modeling report available during the public comment period has been finalized, under the direction of EPA and in consultation with the Spokane Tribe of Indians. The final modeling report for the Spokane Arm (Cadmus Group and Scott Wells, December 2009) contains additional information about the impact of the removal of upstream sources, as discussed below.
The goal of this TMDL is to solve the dissolved oxygen water quality problems in the Spokane River between the Idaho / Washington state line and Long Lake Dam. While this TMDL was not designed to fix impairments on the Spokane Arm, it will improve water quality in the Spokane Arm even as population increases in the watershed. The final modeling report indicates that the upstream TMDL will improve the phosphorus levels in Tribal waters from an average of 0.025 mg/L (current conditions) to 0.016 mg/L (Cadmus 2009, Table 30) and will result in minor dissolved oxygen improvements in the Spokane Arm. The modeling report also indicates that reducing sediment oxygen demand (SOD) in the Spokane Arm is the single most important factor in improving water quality in the Spokane Arm; and is, in fact, more important than the reductions required by the upstream TMDL. Without a clear interpretation of Spokane Tribal water quality standards, it is unclear whether or not the TMDL meets the EPA-approved Water Quality Standards for the Spokane Tribe. Specifically, there is ambiguity regarding the appropriate classification of the Spokane Arm. The EPA-approved Water Quality Standards for the Spokane Tribe of Indians classifies the Spokane Arm as a “Class A” river, even though the lower portion of the Arm may fall within the Tribe’s definition of a “lake” (e.g. parts of the Spokane Arm become stratified in the summer). Additionally, it is unclear how the presence of the impoundment will be considered in the “natural condition” provision of the Tribal Standards. The way in which the “natural condition” is interpreted (e.g. hydrologic impact of Grand Coulee dam; SOD) significantly impacts the interpretation of the Tribe’s water quality standards.
If the Spokane Arm is riverine, there are two standards that could apply; a numeric standard and a natural condition standard:
• “Dissolved oxygen shall not be less than 8.0 mg/L (9.2.c.ii);
• “Whenever the natural conditions of any specific surface waters of the reservation are of a lower quality than the criteria assigned to waters typical of that class, the Department may determine that the natural conditions shall constitute the water quality criteria.”(Part 3.2)
Spokane River / Lake Spokane Dissolved Oxygen Water Quality Improvement Report Page C-85
The standards define “all reservoirs with a mean detention time of greater than 15 days” as Lake Class. If the Spokane Arm is considered to be a lake, the following standard applies:
• “Dissolved oxygen shall exhibit no measurable decrease from natural conditions,”
Despite uncertainty about the way in which the Tribal standards will be interpreted, many conclusions can be drawn from the water quality modeling of the Spokane Arm performed by Cadmus Group and Scott Wells (2009). Four different modeling scenarios, described below, were developed in order to better understand the existing and potential future water quality in the Spokane Arm after the TMDL is implemented.
1. TMDL Scenario. This scenario illustrates the way in which the upstream Spokane TMDL, when fully implemented, will impact water quality in the Spokane Arm. Oxygen-demanding pollutants are reduced to the levels required by the TMDL, and dissolved oxygen levels at the Long Lake Dam tailrace are increased to 8.0 mg/L (in recognition of Avista’s requirement to increase dissolved oxygen in the tailrace). The impacts of Avista’s responsibility (i.e. oxygenation or non-point source reductions) are not included in this scenario, which means that the results of this scenario under- predict future water quality improvements.
2. TMDL Scenario with increased Tributary Sources. This scenario is identical to scenario #1, except that tributary loadings are increased to the 2001 levels. This scenario looks at the impact on Tribal water quality if non-point sources are not reduced during TMDL implementation.
3. No Source. This is similar to the Spokane TMDLs “no source” model run; all upstream anthropogenic sources are removed. Sediment oxygen demand levels in the Arm (ranging from 0.1 to 1.1) reflect estimated current conditions, and they are higher than the levels in Lake Spokane in the “no source” TMDL run. The impacts of Avista’s responsibility (i.e. oxygenation or non-point source reductions) are not included in this scenario.
4. No Source with 50% reduced SOD. This scenario is identical to scenario #3 except that sediment oxygen demand is reduced 50%, and ranges from 0.05 to 0.55.
As noted above, Scenario #1 indicates that implementation of the upstream TMDL will improve the quality of Tribal waters even as population grows (the TMDL scenarios consider growth through 2027).
Scenario #2 predicts that the upstream TMDL will improve water quality even if upstream non-point sources are not reduced as much as the TMDL requires. The impact of these increased non-point source loads on water quality is relatively small (Cadmus, Tables 30 and 31).
Scenario #3 (“no source”) predicts that, even if all upstream anthropogenic sources are removed, the dissolved oxygen will decrease rapidly in the bottom portions of the river, reaching concentrations as low as 1 mg/L (See Figure 77 of Cadmus 2009 report). In other words, the 8 mg/L riverine standard will not be achieved in portions of the Spokane Arm even if all upstream sources of pollution are eliminated, indicating that application of the natural condition provision may be the best way to assess the quality of the lower Spokane Arm.
Spokane River / Lake Spokane Dissolved Oxygen Water Quality Improvement Report Page C-86
Scenario #4 predicts that SOD is the most important factor affecting dissolved oxygen in the Spokane Arm (See Figure 78 of Cadmus 2009 report). When SOD is reduced by 50 percent, dissolved oxygen levels in the deeper portions of the Arm increase to above 3 mg/L, and anoxic conditions are eliminated. While conditions are improved, they still do not achieve the 8 mg/l riverine standard. The elevated SOD in the Spokane Arm is a legacy of the accumulation of oxygen-demanding pollutants in sediment. Sediment accumulation is, in turn, caused by the hydrologic regime created by Grand Coulee Dam. These results indicate that improving SOD is critical to improving water quality, and that assumptions about SOD will have a significant impact on the estimation of “natural conditions” within the Arm.
Finally, although EPA’s regulations expressly require that NPDES permit limits ensure compliance with downstream state water quality standards, it is less clear that TMDLs must be set at a level necessary to implement all downstream jurisdictions’ water quality standards. However, even if it is assumed that there is such a requirement, it is not possible at this time, and for purposes of developing this TMDL (which addresses impairments in the Spokane River and Lake Spokane upstream of Long Lake Dam), to determine whether the Tribe’s water quality standard is being met based on the ambiguities discussed above.
1. In the first paragraph on page 13, the reference to the Spokane Tribe's Reservation should be eliminated since the Water Quality Improvement Plan is not applicable beyond Lake Spokane. Any other similar references should also be eliminated.
Response: Ecology feels it is important to acknowledge the water quality impairments located downstream in tribal waters.
2. In various locations throughout the DO TMDL, Ecology states, "the Spokane Tribe of Indians collaborated" with the other agencies and Ecology in developing the TMDL. (DO TMDL P. 14). "Collaborated" does not properly describe what occurred throughout the development of the DO TMDL. Tribal DNR and legal staff were kept informed and consulted with during Ecology's development of this draft, but in the end, the Tribe did not help write the DO TMDL, nor did it have any decision making power within the process.
Suggested Change: Ecology should change this and other similar language referring to the Tribe. For example, it could be changed to, "The Spokane Tribe was kept informed and consulted with throughout the process, but it did not have decision-making power within Ecology's development of the DO TMDL."
Response: Ecology has made the suggested change.
3. Meeting Downstream State Standard. Ecology's modeling efforts should be adjusted so that the WLAs and LAs in this TMDL meet the downstream water quality standards of the Tribe. Preliminary Spokane Tribe modeling results indicate that the WLAs and LAs upstream from the Tribal waters will not be adequate to meet the Tribe's water quality standards. Ecology should utilize the lower arm model and the upstream model to develop WLAs and LAs in this TMDL. Such use of the modeling could allow for more assurance that the Tribal standards will be met. Alternatively, the TMDL should acknowledge that Tribal standards will not be met by the TMDL. Portions of the Tribe's waters are currently uninhabitable for aquatic life.
Spokane River / Lake Spokane Dissolved Oxygen Water Quality Improvement Report Page C-87
Response: See summary response to Part M.
4. Future changes to TMDL. The draft DO TMDL states that “[i]f downstream [monitoring] results indicate non-compliance with Tribal water quality standards for dissolved oxygen, then corrective action will be taken by both the upstream dischargers and Avista per the implementation plans to meet the standard.” Draft DO TMDL at 43. Our understanding is that the DO TMDL study area ends at Long Lake Dam, the base of Lake Spokane. As discussed above, Avista is already in the process of improving DO conditions downstream from the Long Lake Dam. In addition, Avista and the Spokane Tribe have entered into an agreement to work together to improve water quality within reservation waters.
Response: As stated in the summary response to Part M, it is not known whether or not the TMDL will result in Tribal water quality standards being met. Water quality modeling does indicate that the TMDL will improve the water quality of the Spokane Arm; and that when the TMDL is implemented, the long term average dissolved oxygen concentration will increase, and the long-term average phosphorus levels will decrease. Evaluation of the impact of the TMDL on the water quality of the Spokane Tribe will need to be evaluated after the Tribe has determined the way in which their water quality standards will be interpreted; and can be evaluated more accurately after the impacts of Avista’s dissolved oxygen responsibility are known and can be incorporated into the model. Comment noted with regards to the Avista and Spokane Tribe agreement.
5. On page 13, Ecology should change a portion of the first sentence from "and contribute to degradation of downstream water quality on the Spokane Tribe of Indian's Reservation" to "cause and contribute to the violation of the Spokane Tribe's Water Quality Standards for the Spokane River."
As Ecology is aware, very little, if any, of the nutrient loading resulting in the violation of Tribal Water Quality Standards comes from sources between the tail race of Long Lake Dam and the Reservations Boundary or from within the Reservation.
Response: This change has not been made in text. Please see the summary response for Part M.
6. Page 24: "In other words, Long Lake Dam causes Lake Spokane to violate water quality standard for dissolved oxygen by making the lake more sensitive to pollutants than the River." This sentence is confusing and the presumed premise should be more closely analyzed. The Tribe observes in Lake Roosevelt much better DO conditions throughout the Lake, which is created by a dam. This DO condition is a result of very little anthropogenic phosphorus loading upstream from Tribal waters. In addition, on Page 24 the Draft states: "The TMDL contemplates reducing this load by an average of approximately 66 percent during the March to October within ten years." This should be changed to “requires.”
Response: As explained in the TMDL, and as discussed in Section A of this document, Long Lake Dam changes the character and hydrodynamic characteristics of the river system (e.g. increased residence time and depth) such that Lake Spokane is more sensitive to the loading of oxygen-demanding pollutants. A comparison of the Lake Spokane to Lake Roosevelt is beyond the scope of this TMDL.
Spokane River / Lake Spokane Dissolved Oxygen Water Quality Improvement Report Page C-88
The text on page 24 has been changed to state that “The TMDL requires [emphasis added] reducing this load by an average of approximately 66 percent during the March to October within 10 years.”
7. Page 47: In the first full paragraph, "downstream of Lake Spokane by the Spokane Tribe of Indians" should be changed to "by EPA."
Response: Requested change has been made.
Spokane River / Lake Spokane Dissolved Oxygen Water Quality Improvement Report Page C-89
N. Target Pursuit / Delta Elimination Actions [water quality offsets] Summary: The “target pursuit / delta elimination actions,” which refers to the tools outside of advanced wastewater treatment that will be employed by Washington dischargers to meet the final permit limits, are unclear and unrealistic.
It is also unclear where the incentives are for reducing tributary load allocations for nonpoint sources of nutrients when credits towards meeting a wasteload allocation or dissolved oxygen responsibility by pursing such actions may not be granted until the reductions in the tributary load allocations (which call for reductions in the overall pollutant load to be reduced by 10 to 30 percent in Hangman Creek) are met, if they ever are. Finally, the total phosphorus concentration for the groundwater load allocation (6 µg/L) is too high based on a review of groundwater well data.
Summary Response: Through implementation of the TMDL, Ecology intends to gradually replace the nebulous terms “target pursuit actions” and “delta elimination” with a specific plan for nonpoint source reductions.
It is up to the Washington dischargers and Avista to determine which target pursuit actions they need or want to pursue and to demonstrate, through modeling and other means how those actions will reduce nutrients or increase dissolved oxygen to the Spokane River. These actions include nonpoint source reduction or elimination (septic system, agriculture, stormwater), wastewater reuse, water conservation, nutrient trading. To meet its dissolved oxygen responsibility, Avista can pursue similar actions to increase the nutrient loading capacity (reduce nutrients or increase dissolved oxygen) to Lake Spokane.
As stated in the summary response for Part Q related to tributary load allocations and response to comment number 20, Part A, offset (delta) credits for water quality improvements in the tributaries (repairing eroding streambanks for example) cannot be given to dischargers until those load allocations have been met (in other words, when needed improvements are taken by tributary sources as defined in TMDLs for Hangman Creek and the Little Spokane River and/or by those entities with responsibilities under a Shoreline Master Program), as determined through the ten-year assessment. However, there are no load allocations for nonpoint sources to the river mainstem, including stormwater and groundwater pollution. Therefore, committing to those actions could provide earlier conditional credit to the dischargers towards meeting the final wasteload allocation, when modeling (conducted by those parties) shows those actions would provide the needed water quality improvement. Between permit cycles and as part of the ten-year assessment, monitoring and modeling information will be used to determine if the action achieved the benefit. Only then would final approval be given by Ecology.
Ecology has met with an advisory group during development of the TMDL comprised of dischargers from both states, Avista, the Spokane Tribe of Indians and environmental groups to share their view that this advisory group needs to continue working together following approval of the TMDL into implementation to develop a phosphorus reduction program with Ecology being the sole approval authority in this committee. It is during this implementation phase that many of the details called for in this comment category will emerge through the advisory committee, such as the nutrient loads associated with specific nonpoint sources, the potential
Spokane River / Lake Spokane Dissolved Oxygen Water Quality Improvement Report Page C-90
nutrient load reductions that can result from the target pursuit actions, and which party will commit to and fund which needed action (to be spelled out in Avista’s Water Quality Attainment Plan and NPDES permit documents listed in the Managed Implementation Plan).
Groundwater load allocation Previous modeling scenarios have relied on results from groundwater samples collected by Ecology and Spokane County. Recent improvements in phosphorus measurement techniques have lowered routine detection limits from previously reported 5-10 µg/L down to 1-2 µg/L. Reviewing recent Spokane County groundwater data has revealed several instances where results have been below the 6 µg/L value selected from historic data for the public comment TMDL draft. This new data allows Ecology to fine tune the concentration of phosphorus in groundwater that is considered “background.” Ecology selected 13 wells from Spokane County’s network far from the river channel to minimize surface water impacts. These wells returned phosphorus concentrations below the former value of 6 µg/L phosphorus. Using data from the second, third and fourth quarter of 2008, the frequency of reported concentrations of both orthophosphorus and total phosphorus were plotted. For model input, Ecology used the median values. Median values are a more "robust" statistic than the arithmetic mean (average), meaning there is less sensitivity to censored (due to detection limits close to the actual value) or otherwise "questionable" values. In other words, using the median instead of the mean is a simple way to reduce the bias inherent in data sets that hover near the detection/quantification limit. From this review, the orthophosphorus median value is 2 µg/L and the median total phosphorus concentration is changed to 6 to 4 µg/L (see Table 3). This revised value was used as an input in subsequent TMDL modeling in December 2009 to generate a revised Table 7 [Table 6 of draft TMDL] (see summary response to Part J for more information on groundwater model inputs). 1. …the draft DO TMDL also states that offsets “may only be awarded for actions above and
beyond landowners existing requirements to manage land in a manner that does not violate RCW 90.48.” Draft DO TMDL at 51. It is unclear to us what sorts of “existing requirements” Ecology has in mind. Please clarify this statement so that Avista and the Dischargers understand what types of controls are eligible for offsets.
Response: See summary responses for Part N and Part Q. Existing requirements refers to the actions called for in TMDL’s developed for Hangman Creek and the Little Spokane River.
2. Given the failed effort at a UAA [Use Attainability Analysis] for the Spokane, discussion of water quality offsets seems premature and misplaced at this time. Development of a responsible TMDL for the Spokane has been delayed for too long as it is.
Response: Ecology disagrees that discussions of water quality offsets or trading is premature. As described in the summary response for Part N, while specific details will need to be spelled out during TMDL implementation, reductions of both point and nonpoint sources of nutrients, which may involve water quality trading, will be critical to meeting water quality standards for this TMDL.
3. The brief discussion of water conservation programs is valuable. It is unfortunate that more effort is not going into water use reduction. The City of Spokane has long ignored the opportunity for leadership in this regard.
Spokane River / Lake Spokane Dissolved Oxygen Water Quality Improvement Report Page C-91
Response: The city of Spokane can provide more details on its current and future planned efforts for conservation but this TMDL provides incentives for the city and other dischargers to maximize conservation to meet the permit limits.
4. The Water Quality Improvement Plan identifies Stormwater as a contributor and assigns a Load Allocation to it. The Load Allocation is based on current conditions and does not apply and reduction factors to current loading even though new Stormwater permits will require Best Management Practices to reduce discharges. Since stormwater discharged from the industrial facilities covered by the Water Quality Improvement Plan must meet new, more stringent limitations it would appear that stormwater dischargers are not being equitably treated.
Response: While there is a numeric stormwater wasteload allocation in the TMDL, estimated reductions from that modeled number are difficult to estimate due to myriad complexities and flow variability involved with stormwater. Therefore, Ecology will implement the stormwater regulations (NPDES Phase II permits and TMDL conditions) with narrative best management practices (BMPs) described in the permits and in the Managed Implementation Plan section of the TMDL. Municipal stormwater and industrial stormwater are regulated under separate permits because they are quite different. This does not create inequitable treatment. It is ultimately up to the jurisdictions covered by the municipal stormwater permits mentioned in the TMDL whether they want to demonstrate how stormwater reduction requirements will reduce phosphorus in order to meet their wastewater NPDES permit limit.
5. We would further ask, if septic tanks are considered to be contributing phosphorus to surface water via groundwater, why are they not subject to NPDES permitting?
Response: Individual septic systems, like all nonpoint pollution sources, are not subject to NPDES permitting. They are subject to state and local health permits. While they do not have an NPDES permit requirement, Ecology feels this TMDL offers an incentive to reduce these sources to meet final permit limits. However, it will be up to the discharger wishing to pursue these credits to provide the technical analysis to Ecology showing the nutrient reductions to the Spokane River prior to receiving these credits.
6. Page 45: Ecology states: "reductions in ammonia may be used to offset equivalent loads of phosphorous as a target pursuit action." Ecology should explain the reasoning behind this statement.
Response: This is known as “equivalency offsets” where one pollutant, ammonia, can be reduced below the wasteload allocation amount, thereby offsetting the dissolved oxygen impact from another pollutant (phosphorus or BOD) at a concentration higher than the wasteload allocation. This type of offset action is commonly done in many NPDES permits and may be useful for dischargers in this TMDL. These offsets would be discharger specific; and additional model runs would be required to determine the equivalent dissolved oxygen demand between pollutants (i.e., will achieve at least an equivalent level of improvement to Lake Spokane comparable to their WLA). Ecology envisions that equivalency offsets will be one of the many tools the TMDL advisory committee will work on with us.
Spokane River / Lake Spokane Dissolved Oxygen Water Quality Improvement Report Page C-92
7. No entity on the River should be given offset credit until the Septic Tank Elimination program is proven scientifically defensible.
Response: See summary response for Part N. Any discharger pursuing septic tank elimination will need to provide the technical analysis showing how this action will reduce nutrients into the Spokane River. Ecology, working with stakeholders and in-house technical experts, will have final approval authority on these analyses.
8. The 2009 Draft TMDL fails to provide any supporting data demonstrating a nutrient-trading program would contribute to meeting lower phosphorous discharges into the Spokane River and Lake Spokane… The 2009 Draft TMDL should be revised to provide this information and demonstrate with reasonable assurance that a program of this type would contribute to the end-goals of this Draft.
Response: See summary response for Part N. Upon the establishment of a phosphorus reduction following approval of the TMDL, any discharger wishing to pursue target pursuit actions listed in the Managed Implementation Plan section would need to provide the technical analysis showing the nutrient reductions to the Spokane River following the action.
9. The 2009 Draft TMDL should be revised to provide exact dates by which Spokane must comply with the storm water requirements in the 2009 Draft TMDL, and should describe methods by which such compliance is to be met and monitored.
Response: These details are spelled out in the NPDES Phase II stormwater permits. If stormwater permittees wish to pursue stormwater reductions to meet their final wasteload allocation, they would need to provide the technical analysis to Ecology showing how those actions will reduce nutrients into the Spokane River and would have to demonstrate that those reductions provide more reduction than required by their stormwater permits.
10. Insufficient data to support the value of 0.006 mg/L for background or natural concentrations of phosphate in groundwater. Ecology must analyze if the value of 0.006 mg/L is to be relied upon as accurate, and is to be used as a basis of determining load and wasteload allocations. That analysis should be detailed in the 2009 Draft TMDL.
Response: See summary response for Part N.
11. The data included in the Spokane County database used to arrive at the 0.006 mg/L value for background or natural concentrations of PO4 is outdated, and therefore unreliable. Much of the data in the Spokane County database is older and was analyzed with detection limits quite higher than 0.006 mg/L. This older data is outdated as far as it can provide accurate information about the current PO4 concentrations in clean groundwater. In analyzing the data from the Spokane County database, it was observed that about one-half of the 1,679 phosphorus data points collected after January 1, 2000, or 849 data points, yielded PO4 concentrations less than 0.006 mg/L. The average concentration for the 849 samples with PO4 data less than 0.006 mg/L was 0.003 mg/L. This implies that many of the wells have PO4 concentrations significantly less than the 0.006 mg/L value assumed in the 2009 Draft TMDL for background or natural groundwater. Consequently, the TMDL may over-estimate the PO4 loads to Spokane Lake under natural conditions, and therefore underestimate the effect of anthropogenic impacts.
Spokane River / Lake Spokane Dissolved Oxygen Water Quality Improvement Report Page C-93
Response: See summary response to Part N.
12. There is no evidence that phosphorus in groundwater is reaching the Spokane River. Phosphorus is well documented as not moving through soils via subsurface flow. Monitoring of near-river groundwater by Ecology did not identify it to contain more phosphorous than considered natural. The outflow from Lake Coeur d’Alene is documented as containing about 6.7 µg/L total phosphorous, which is very similar concentration to the Ecology’s measurements of phosphorous in near-river groundwater. If the Spokane aquifer actually contained even a fraction of the high phosphorous concentrations reported in Spokane County’s non-point source report, these high levels of phosphorous should be evident in the river as it enters Lake Spokane. Since the lower Spokane River flow consists of about 90% groundwater during the critical period, phosphorous concentrations in the river should be the same as groundwater concentrations. Absent the point source discharges to the Spokane River during the summer critical period, groundwater and River water concentrations of phosphorous would be the same.
Response: See summary responses for Part J and N related to groundwater load allocations. Groundwater phosphorus concentrations are highly variable and their impacts on surface water are highly dependent on location in the aquifer and soil type. In addition to considering any new data to refine the groundwater load allocation in the TMDL, any technical work done in support of removing nonpoint sources of phosphorus or other nutrients to groundwater as a target pursuit action to meet a wasteload allocation will only be approved upon sufficient review by Ecology and a group of internal and external technical experts (as part of the planned TMDL advisory committee following TMDL approval).
13. … the draft 2009 TMDL states "The Dischargers and Ecology will work together to seek funding of up to two million dollars per year for a regional nonpoint source reduction program. The program will identify cost-effective phosphorus reduction strategies and verify actual phosphorus reductions." A legal interpretation of that sentence could the program without any actual money or commitment for cleanup. We would prefer that the TMDL have an actual two million dollar value, with a clause that if the target levels for offsets were met, by actual monitoring results, the funding for the source reduction program would be reduced. That way the dischargers could include that cost in their overall treatment program and it could be guaranteed, giving greater certainty of success.
Response: This amount was sought and awarded several years ago for TMDL implementation and is currently being used to fund, in advance of an approved TMDL, the Nonpoint Source Reduction study (headed by Spokane County) and the Spokane River Forum, among other projects. This commitment will be revisited when the TMDL moves to implementation and the TMDL advisory committee is convened.
14. We [Lands Council] note with interest that Stormwater is now given a Waste Load Allocation, but the remedy for decreasing phosphorus does not mention the fact that Stormwater Permits should be required of industrial dischargers and a schedule be established to issue those permits. Perhaps Ecology considers that issuing stormwater permits falls under the goal of Illicit discharge detection and elimination, but in any case it should establish funding and a compliance schedule to find and permit industrial stormwater sources.
Spokane River / Lake Spokane Dissolved Oxygen Water Quality Improvement Report Page C-94
Response: Please see response for comment number 9, Part N. Ecology also administers industrial stormwater permits and works to provide technical assistance or permit industrial stormwater sources after they are identified and resources allow.
15. In the 2004 and 2007 documents the portion of non-point source phosphorus that was available to be used as an offset was less that the 2009 document, what caused this change? Any change in groundwater phosphorus above background levels is now available to be used as offsets, this also seems like a change from the earlier document and we have concerns about the scientific justification for a groundwater WLA – the interaction between groundwater flow and septic tanks needs further clarification.
Response: Changes in offsets and all numbers are a result of updated modeling and data and the new approach on this TMDL that assesses the cumulative impact of all dischargers in both states and incorporates Avista’s impacts on dissolved oxygen in Lake Spokane. In addition, groundwater load allocations and stormwater wasteload allocations were developed to better identify the impacts from those sources and provide a mechanism for potential offsets. Clarification of septic tank elimination impacts on groundwater and surface water quality would need to be provided by the dischargers that choose to pursue those efforts to receive credits towards meeting their wasteload allocations.
16. We [Lands Council] still have questions about the modeling that was done for septic tank elimination offsets. The 2009 draft assumes that the Spokane County report on those non-point offsets is suitable. In 2008 was a critique of the Spokane County calculations that calls this program into question. Given the importance of this offset, we would like to see a peer reviewed study, rather than the calculations submitted by Spokane County and Center for Justice/Sierra Club being at odds. We ask that this be reconciled before the county is given permission to use these offsets.
Response: Review and approval of this proposal by the County will be conducted following receipt of a permit application. Ecology performs peer reviews of all engineering reports in support of permits and intends to perform a peer-reviewed critique of this proposal.
17. We [Lands Council] support this [Spokane County’s] program of water conservation, but indoor conservation of water of 20 percent in older neighborhoods and 10 percent in newer is not very ambitious. Where are the targets for outdoor conservation, commercial, industrial, and government water users. It should also be clarified how this water conservation will help improve dissolved oxygen in the Spokane River. We can assume that less pumping in the summer will improve flow from the aquifer to the Spokane River, and it may also slow the flow of septic tank effluent into the aquifer, but are there other benefits?
Response: See response to number 3, Part N and response to number 33, Part G. Ecology believes the County has an incentive to maximize reuse to meet its final wasteload allocations but it is up to the County to determine how aggressively they want to pursue such an action and to show how that action will reduce nutrient loading to the Spokane River.
18. Bio-available Phosphorus - The Draft 2009 TMDL states: NPDES permit holders may seek to prove to Ecology that a certain stable fraction of their phosphorus discharge is not bioavailable in the river environment for a time sufficient to consider it not bio-available
Spokane River / Lake Spokane Dissolved Oxygen Water Quality Improvement Report Page C-95
and not a nutrient source. If Ecology agrees, the pounds of phosphorus that are not bio-available will be recognized as contributing toward achieving the total phosphorus wasteload allocation.
This is not a clear statement and should be reworded to say the phosphorus that is found to be not bioavailable will not count as part of the allowed pounds.
Response: Ecology believes the statement as written provides more details on how such credits need to be determined for bioavailable phosphorus, and more importantly, how it must have Ecology’s approval prior to being credited towards meeting the wasteload allocation.Our specific concern [Greater Spokane Incorporated] with regard to IEP in this TMDL is the apparent lack of an opportunity for IEP to develop workable delta elimination program, as they can only come about this from the perspective of a privately held company and aren't able to wield the authority that a municipal entity can employ in creation of the program. We would ask that additional consideration be given IEP with regard to achieving a workable program that can help this company, and the jobs it provides remain viable for our community.
Response: Ecology recognizes the challenges faced by Inland Empire Paper Company and certainly does not wish to put the company out of business. Ecology is committed to continue working with the company and all other dischargers to identify opportunities to meet permit limits outside of advanced wastewater treatment technology. Ecology believes there are numerous opportunities that will present themselves even more clearly working through the TMDL advisory committee. For example, trading, nutrient offsets, water conservation, wastewater reuse, and bioavailable phosphorus (which Ecology and most dischargers are currently funding) are all possible actions that could be pursued by IEP specifically. It’s ultimately up to IEP and all dischargers to determine which actions they wish to pursue to meet their wasteload allocations.
20. Ecology's plan, however, does not include, define or prove sufficient mitigating measures for all of the treatment plant operators. Inland Empire Paper Company specifically has not been afforded any of these mitigating measures, and therefore, has no defined means to make up the difference [delta management].
Response: Please see response for number 19, part N.
21. [from Sierra Club] Removing septic tanks from the aquifer is good but will not reduce phosphorous loading to the Spokane River.
Response: Please see response to comment numbers 12 and 16, Part N. Whether or not this comment is true or the degree to which it is or is not true will be better understood when a discharger presents a technical analysis in support of receiving offset credits for septic tank elimination.
22. The TMDL needs to outline exactly how the delta reductions or the proposed nutrient trading will work and demonstrate how these methods versus an easy understand end of pipe limitation will actually result in compliance with water quality standards.
Response: See summary response for Part N.
Spokane River / Lake Spokane Dissolved Oxygen Water Quality Improvement Report Page C-96
23. I [Mike Chappel, University Legal Assistance] applaud the inclusion of storm water in the calculations. I will, however, note that at the same time you have a long or detailed discussion about the reduction of storm water, DOE is extending the period for compliance for Phase II permittees to develop and implement their storm water management plans and other significant elements of the Phase II permit. I think you need to address that in the TMDL.
Response: See response for number 9, Part N. The Phase II stormwater permit is a distinct and separate action from the TMDL. However, Ecology believes there is an incentive for Phase II permittees to reduce stormwater dischargers as part of this TMDL, perhaps beyond what is already required in the Phase II permit, in order to meet the wasteload allocations.
24. WLAs are too high for Combined Sewer Overflows and storm water, p. E-7: The proposed TMDL allocates the existing loading from CSOs. Like storm water, CSO flow is highly variable and has a unique flow pattern each year, and the TMDL scenario includes the daily mean flow (scaled to the March to October period from the city’s annual estimates). The mean is used under the assumption that an average precipitation year could occur during a low base flow year like 2001.
Response: Ecology believes the wasteload allocations developed for CSO’s and stormwater (analysis is provided in Appendix K) are reasonable given the lack of stormwater data and its highly variable flow.
25. 2001 is the critical condition year and WLAs for CSO and storm water should be based on the discharges that occurred that year, not the mean value as was done in the TMDL.
Response: See response for number 24, part N.
26. The text [page 29, paragraph 3] states that Spokane County does not have any stormwater outfalls. That statement is inaccurate because Spokane County has at least one known outfall that discharges to the Spokane River. The County is covered under the Phase II Municipal Stormwater General Permit for Eastern Washington and is in the process of implementing that Permit. As part of the inspection and mapping process required by that Permit, the County may discover other outfalls that discharge to the Spokane River. Also, the County is currently aware of several County stormwater outfalls that discharge to Latah Creek and the Little Spokane River. The text should be revised to include these facts. Also, the current text uses several different references when discussing the Phase II Municipal Stormwater Permit for Eastern Washington. For clarity, we suggest that the TMDL consistently use the same name for this Permit.
Response: Changes have been made to this section to reflect Spokane County’s stormwater outfalls. Thank you for the clarification.
27. The DO TMDL contemplates the use of offsets by the existing dischargers to meet their WLAs. (draft DO TMDL P.40-41, 47-48). However, the offset regulations clearly state that offsets are designed, "for the purpose of creating sufficient assimilative capacity to allow new or expanded discharges...." WAC 173-201A-450(1) (Ex. 5). Ecology in this DO TMDL describes the use of offsets by existing dischargers that are reducing their discharges, not increasing them. The Regulations do not appear to give Ecology the authority to take such
Spokane River / Lake Spokane Dissolved Oxygen Water Quality Improvement Report Page C-97
measures when working with existing dischargers.
Suggested Change: Ecology should explain its legal authority to allow for the use of offsets by existing dischargers in this DO TMDL.
Response: The offset rule may be used to assist dischargers in meeting the requirements of a TMDL, as well as creating capacity for expanding or new discharges.
28. Based upon the inventory contained in Table 5 [Table 6 in final TMDL], only reductions in these identified sources of nutrients are available for Delta Elimination Plans since no others are model inputs. Since Ecology's view is that the reductions being sought on tributaries are very aggressive, groundwater is the only potentially meaningful non-point source of offsets. As a practical matter there are no accessible sources for privately owned dischargers to include in a Delta Elimination Plan.
Response: See summary response for Part N related to other offsets and the response for comment 19, Part N.
29. Information given to Lake Spokane Advisory Group members is that existing septic systems in the Subdivisions of Suncrest (Lake Spokane UGA) do not contribute measurably to the phosphorus load in Lake Spokane. The Stevens PUD has purchased land to allow for the building of a treatment system for any new subdivisions in the Lake Spokane UGA. Having a sewer treatment system would allow for higher density than presently allowed. The proposal would not sewer existing lots in the Lake Spokane UGA.
Response: Connecting septic systems to a sewer system in the Suncrest area was one idea put forward by Ecology several years ago as a potential water quality offset to dischargers that could possibly reduce a nonpoint source of nutrients to Lake Spokane. The TMDL does not call for any specific target pursuit actions by any particular discharger since there are potentially many opportunities that would be missed. If septic elimination is proposed by Avista or any of the dischargers at Suncrest or anywhere else, notwithstanding the limitations mentioned in the comment above, they would have to provide the technical documentation to demonstrate nutrient reductions to the Spokane River or Lake Spokane from those actions to Ecology.
30. Although not directly related to the TMDL, I have heard that tens of millions are being considered to be spent to get Suncrest onto a septic system without any knowledge about what, if any, contribution this non-point source contributes to the nutrient loading of the lake. I've heard that studies done in the 1990s showed the contribution was negligible. Seems to me like a play to displace blame.
Response: See response to comment number 29, Part N. While the contribution from septic systems may have been negligible in the early 1990’s, this may no longer be the case with increased development over the last 20 years in the area and the increased likelihood of existing systems failing.
31. Please identify and quantify each and every non-point control effort specifically available to IEP to achieve its proposed WLA.
Spokane River / Lake Spokane Dissolved Oxygen Water Quality Improvement Report Page C-98
Response: See summary response to Part N and response to comment 19, Part N.
32. Does Ecology believe that the TMDL numerically accounts for all significant non-point sources contributing to the watershed?
Response: Ecology has conservatively estimated the impact of nonpoint source loadings. For example, unlike past drafts of the TMDL, Ecology has provided itemized load and wasteload allocations for groundwater and stormwater pollution, respectively. The way in which nonpoint sources adjacent to Lake Spokane have been estimated is discussed in the summary response to Part J. Determining the individual contribution of each individual nonpoint source, such as from septic systems or lawn fertilizers, is beyond the scope of the TMDL but is an option for dischargers pursuing water quality offsets to meet their permit limit.
33. The Draft TMDL would require most Delta reduction activities to meet Ecology's offset regulation, which is a rather onerous process. The City of Spokane is not aware of any offset that has actually been approved by Ecology under this rule in any watershed. It might be useful for Ecology to reference in the TMDL projects that Ecology has approved under the offset rule as examples. The City is, of course, aware of the "conditional approval" provided to Spokane County for its septic tank elimination program. See Draft TMDL, p. 52.
Response: Pollutant equivalency offsets have been approved for NPDES permits in Willapa Bay. It’s true that a water quality trading program has not been developed in Washington State and this would be the first. The success of this phosphorus reduction program, which can be developed upon approval of the TMDL, will depend on the degree to which stakeholders actively pursue these actions based on the need and cooperation within the Spokane River advisory committee.
34. Are non-point sources that are not numerically identified in the TMDL available to dischargers for delta elimination?
Response: Please see summary response to Part N and response to comment number 32, Part N. Yes, nonpoint sources that are not numerically identified, or roughly identified (stormwater and groundwater) would be available for delta elimination or offset credits provided that the appropriate technical analysis can demonstrate the water quality benefits to the Spokane River of eliminating that nonpoint source of nutrients.
35. The waste load allocation assigned to IEP must consider the non-reactive fraction of phosphorus in IEP’s effluent. Will Ecology provide IEP a credit for non-reactive phosphorus as a result of the study that is still being performed in cooperation with Ecology?
Response: As IEP is aware, this study (half funded by Ecology and half by the dischargers) is just beginning and will run through 2011. It is possible that the findings from this study would support, following approval by Ecology, a higher phosphorus permit limit in subsequent permit cycles. This is explained in the “Managed Implementation Plan” section of the TMDL and in the response to comment 18, Part N.
36. Since delta management efforts, such as non-point source control actions in the tributaries, will likely result in CBOD reductions as well, such CBOD reductions must also be considered towards the dischargers’ delta.
Spokane River / Lake Spokane Dissolved Oxygen Water Quality Improvement Report Page C-99
Response: Yes, this is an example of a nutrient equivalency offset as explained in the response to comment number 6, Part N.
37. The City of Spokane agrees that narrative effluent limits and BMPs are appropriate regulatory mechanisms to address point source stormwater discharges to the Spokane River in the Draft TMDL. See Draft TMDL, p. 51. However, point source stormwater discharges to tributaries, such as Hangman Creek, should be addressed in the TMDLs Ecology is preparing for those water bodies, not this Draft TMDL for the Spokane River. The third bullet at the top of p. 51 should therefore be deleted. As a practical matter, this may not affect how the City of Spokane manages or monitors its point source stormwater discharges to tributaries, but a decision on WLAs for point sources to the tributaries should be made in TMDLs for the tributaries.
Response: This section has been modified to clarify there are separate but related stormwater requirements in the recently approved Hangman TMDL and such requirements will be identified in the TMDL under development for the Little Spokane River.
38. The City of Spokane agrees that point source CSO discharges to the Spokane River should have a WLA in the Draft TMDL, and that CSOs and non-CSO point source stormwater discharges to the Spokane River can be combined for purposes of the TMDL model. See Draft TMDL, pp. 29 and E-5. The City also agrees that the NPDES Permit for Riverside Park Water Reclamation Facility is the appropriate regulatory mechanism for addressing CSOs. Id. at 47. However, point source CSO discharges to tributaries, such as Hangman Creek, should be addressed in the TMDLs Ecology is preparing for those water bodies, not this Draft TMDL for the Spokane River. As a practical matter, this may not affect how the City of Spokane manages or monitors its point source CSO discharges to tributaries, but a decision on WLAs for point sources to the tributaries should be made in TMDLs for the tributaries.
Response: See response to comment number 37, Part N.
39. Ecology has already agreed to grant Spokane County up to 12 to 20 lbs/day of TP credit for septic tank conversions. The city has also been provided with credit opportunities for CSO reductions that will afford significant flexibility to meets its WLA
Response: While conditional approval has been granted, Ecology will not issue final approval on Spokane County’s septic tank elimination plan until this TMDL is approved and the County submits a permit application.
40. Page 48-49 – Conservation. Water use reduction and its affect toward management of P discharge to the river has not been clearly demonstrated. Incorporation of a recommendation that this be investigated may be justifiable, but this recommendation, which appears to read like a mandate, of implementation of water reduction measures just adds more cost without demonstrated value.
Response: See related response to comment number 39, Part N and comment number 33, Part G. It is up to each discharger to determine whether they need or want to pursue any specific action to meet the final permit limit. Therefore, it would be up to that discharger to demonstrate how that action would improve water quality in the Spokane River.
Spokane River / Lake Spokane Dissolved Oxygen Water Quality Improvement Report Page C-100
41. Page 49 – Class A Effluent. It is not necessarily in the interest of reducing oxygen demanding substances to the River to discharge Class A (Reuse Standards) effluent. Once again this should not be mandated in the TMDL. Treatment technology to reduce TP to the degree necessary to meet the proposed WLAs may include some unit processes common to production of Class A reclaimed effluent, but all unit processes needed for Class A reclaimed effluent production will not be required to meet TP WLAs (assuming that there are processes that can meet WLAs). Production of Class A effluent will be needed where reuse is a strategy of the individual dischargers toward meeting WLAs, but the decision to reuse effluent should be based on the specific plan for each POTW to reach intended effluent goals or requirements.
Response: Ecology agrees with the last sentence in this comment. It is important to note that all of these “target pursuit actions” were developed and agreed to by the dischargers as part of the TMDL Collaboration effort several years ago. Wording for the target pursuit actions has largely remained intact from the Foundational Concepts to the draft TMDL, so it is unclear to Ecology how this could be perceived as a mandate.
42. Page 52, Septic Tank Elimination Program, and Table 8, p. 56 – Septic tank elimination by sewer installation by Spokane County, the City of Spokane, and Liberty Lake Sewer and Water District have been the policy established pursuant to the Spokane Rathdrum Aquifer studies and Spokane Aquifer Water Quality Management Plan (208) for many years. It should not be confused with attempts to reduce phosphorus loading to the Spokane River, even though that may be an ancillary benefit. Crediting one entity with “Delta” credit for this action toward meeting river water quality goals is of questionable justification, when the overall program is community-wide toward meeting a different objective, protection of the Spokane Aquifer water quality. Other entities appear to have progressed further toward achieving protection of aquifer water quality due to more aggressive compliance with the ‘208’ program objectives without receiving complimentary credit toward river water quality objectives. ‘Credit’ for removal of P input to the river from this source should be shared among all entities, as overall community resources have been expended toward the effort (e.g., State CCWF is an overall community funded program. Aquifer cleanup funds generated from water user assessments and septic tank assessments are an overall community funded program.).
Response: No entity has been credited with a delta reduction for septic tank elimination in this TMDL. Any discharger seeking this credit will need to demonstrate to Ecology how reductions will reduce nutrient impacts to the Spokane River. Technical studies in support of these efforts will be shared and reviewed amongst members of the advisory committee, described in the summary response to Part N. This could conceivably reduce the complications described here among multiple entities (who will sit on the committee) seeking delta reduction credits by eliminating septic systems. Ideally, such coordination would encourage an outcome that would be mutually beneficial towards meeting multiple wasteload allocations.
43. Table 8, p. 55 and 56 – Some of the “commitments” included in this table are either presumptions or inappropriate:
• Conservation by reduction of household flows should not be mandated. Any policy decisions in this regard should be up to entities based on cost-effectiveness compared to
Spokane River / Lake Spokane Dissolved Oxygen Water Quality Improvement Report Page C-101
other available strategies to reduce loading and meet WLAs.
• Participation in nonpoint source reduction appears to be a burden that is not a direct responsibility of the dischargers. In addition, other provisions in this TMDL indicate that dischargers would not be eligible for any “delta credit” until the non-point reduction goals are achieved.
• Meeting Class A reclaimed water quality standards for POTW is not necessary nor helpful in assisting DO compliance in the Spokane River for discharges. It adds cost for construction and operation that may not be justifiable toward meeting P discharge limits.
• Aquifer recharge (by Spokane County) should not be suggested, and certainly not mandated by this TMDL. There are other potentially health related factors surrounding the potential for “indirect reuse” that have not been adequately addressed to include this option at this time. It may be many years before these questions have been adequately addressed to include this as an alternative. Furthermore, the Spokane Aquifer Water Quality Management Plan (April 1979) as adopted by Spokane County, the Cities of Spokane, Millwood and Liberty Lake, and approved by the Department of Ecology precludes wastewater discharge to the aquifer unless it has been treated to “potable water standards”. Class A reclaimed water does not meet “potable water standards” according to the Water Reclamation and Reuse Standards (Washington State Departments of Health and Ecology, September 1997).
• “Credit” for P reduction as a result of the Septic Tank Elimination Program should not be accorded only to Spokane County. Any potential credit should be accorded to the community at large since all residents have participated and are participating in this program through imposed fees and taxes. (Note: No documentation of quantitation for this potential credit has been presented in this document.)
Response: See summary response for Part N, and response numbers 40 and 41, Part N.
44. In addition, it is critical that Avista and the Dischargers be allowed to meet their respective obligations under the DO TMDL by helping to reduce non-point source loadings. The draft DO TMDL states that Ecology may award water quality offsets for non-point source reductions, but not “until the load allocations in Table 5 [Table 6 in final TMDL] have been met as determined through data collected for the biennial and ten-year assessments.” Draft DO TMDL at 51. This limitation is both counter-productive and contrary to law. It should be deleted from the final DO TMDL, and water quality offsets for non-point source reductions should be awarded when the conditions in WAC 173-201A-450 are satisfied.
Response: See summary responses for Part N and Part Q and response number 20 for Part A. According to state law, a pollution reduction project can only be used as an offset for those pollution controls which occurs beyond existing requirements for those sources, and when it results in a net environmental benefit. Therefore, reductions capable for use as an offset must demonstrate that load allocations and additional reductions will be achieved, or that monitoring shows that load allocations have already been achieved and proposed reduction projects are above and beyond these existing requirements. Without such, a single pollution reduction project would be counted twice as both meeting the WLA and LA, therefore not achieving a net environmental benefit and not complying with state law.
Spokane River / Lake Spokane Dissolved Oxygen Water Quality Improvement Report Page C-102
45. Denying offsets for non-point source reductions until the load allocations in Table 5 [Table 6 in final TMDL] have been met also will make it far more difficult for the Dischargers to meet their WLAs.
Response: See summary responses for Part N and Part Q and response number 20 for Part A.
46. Furthermore, this limitation [offset credits only once tributary load allocations are met] is contrary to Ecology’s regulation on offsets. WAC 173- 201A-450(2) sets forth the conditions that must be met before Ecology can grant a water quality offset. One of those conditions states that "[o]nly the proportion of the pollution controls which occurs beyond existing requirements for those sources can be included in the offset allowance." WAC 173-201A-450(2)(e) (emphasis added). However, the DO TMDL will not establish “requirements” for any non-point source. Instead, it will set collective reductions for the tributaries and groundwater to which these non-point sources discharge. In other words, the DO TMDL will set a percentage reduction for a water body, but will not specify how, or by whom, the reduction will occur. This is an important distinction. It means that no individual non-point source to the tributaries or to groundwater will have a “requirement” to reduce its nutrient loading. Therefore, if the Dischargers or Avista take action to control loadings from such sources, there is no chance that they would relieve someone else of an existing obligation or that they would receive credit for a non-point source reduction that has already been required.
Response: See summary responses for Part N and Part Q and response to comment number 20, Part A. Tributary load reduction requirements (BMPs) are spelled out in the TMDLs for Hangman Creek and Little Spokane River (latter under development). The TMDL load allocations provide systemic benchmarks so that the tributaries can meet water quality standards. However, individual responsibilities in meeting the water quality standards and the subsequent load reductions are highly dependent on the source and related jurisdiction. In some cases individuals are required to meet WQS, LAs, and RCW 90.48 by applying Ecology approved BMPs. See WAC 173-201-510. In other situations it may be the responsibility of local entities to enforce existing ordinances. Avista and the discharges can also pursue actions to reduce pollution to the mainstem to meet their dissolved oxygen responsibility and wasteload allocations, where these limitations do not apply.
47. Furthermore, the Spokane-Coeur d’Alene region needs a regional wastewater treatment authority. To protect the Spokane River and promote cost efficiency, dischargers should coordinate.
Response: See summary response for Part N. This is essentially the idea of developing a phosphorus reduction program through a TMDL advisory committee. This may be an effective way to pursue nonpoint source reductions and other target pursuit actions, as has been shown in other established regional wastewater authorities.
48. The issue of who gets to claim which offsets as a credit is unclear, as is the timing and dollar commitments for those offsets. Since the hunt for offsets will also involve the dischargers, and the cost of removing non-point phosphorus will become more difficult as the easier tasks are completed, we believe the TMDL should have a more coordinated approach with guaranteed funding and commitments.
Spokane River / Lake Spokane Dissolved Oxygen Water Quality Improvement Report Page C-103
Response: See summary response for Part N, particularly the section describing implementation activities.
Spokane River / Lake Spokane Dissolved Oxygen Water Quality Improvement Report Page C-104
O. Timeframe / Permit Compliance Schedule Summary: It has taken too long to implement any necessary actions to improve water quality on the Spokane River and the dischargers and Avista should not be given ten additional years or possibly more to comply with their respective permits developed based on the conditions of this TMDL. Summary Response: Ecology understands the frustrations with the continued delays and setbacks in developing this TMDL, which has taken nearly 12 years to date. As a result of these setbacks, Ecology has had to work hard with stakeholders to develop this current plan, which Ecology feels is an improvement over past efforts in that it provides a balance between requirements for dischargers and Avista and offers incentives to reduce nonpoint sources of pollution and encourage desirable actions such as wastewater reuse and water conservation. Ecology shares the concern that it is past time to move forward with implementing this plan. The primary means of implementation is through the NPDES permits for dischargers and Avista’s 401 Certification. Both of these permits have ten year compliance schedules as allowed by law. This does not mean dischargers or Avista can wait for ten years before implementing necessary conditions in their permits, such as advanced wastewater treatment and the target pursuit actions described in the summary response for Part N. On the contrary, all of the dischargers have begun these actions despite the delay in the TMDL and permits. In addition, all of the required actions need to be in place and working prior to year ten according to the schedule in Table 10 [Table 9 of draft TMDL]. Legislation was recently passed that directs Ecology to amend the water quality standards to allow more than ten years to comply with TMDL requirements under certain conditions. As stated in the introduction to the Managed Implementation Plan section of the TMDL:
“The required amendment to the water quality standards is subject to EPA’s review and approval, and it is unclear whether or how amended water quality standards may apply to the dischargers NPDES permits...” (emphasis added)
While the TMDL acknowledges this legislation, current regulations authorize a ten year compliance schedule.
1. It has taken too long to clean up the Spokane River. The phosphorus causes 'blooms' in the downstream lakes (Long Lake). I ask that the state takes action now.
Response: See summary response for Part O.
2. Page 46, Last ¶ in “Managed Implementation Plan” Introduction – Discussion regarding ten-year compliance vs potential for changes in 10 years is not clear. It is stated in this TMDL that the Foundational Concepts agreed among the dischargers and DOE would be a part of this document. This paragraph refutes that statement. As noted in this paragraph, the Washington Legislature has directed DOE to develop regulations making compliance with directives (effluent limits) resulting from TMDLs effective over a longer period than 10 years, whereas this paragraph appears to mandate compliance within a ten year period.
Response: See summary response for Part O.
Spokane River / Lake Spokane Dissolved Oxygen Water Quality Improvement Report Page C-105
3. Page 57, ¶ following table - The TMDL report should not comment on schedules, as that is the purview of subsequent actions, including completion of pilot testing to determine feasibility for removing P to the levels called for by the WLAs in the TMDL. Funding availability and time-related funding uncertainties make it necessary to allow the dischargers to proceed at a normal rate instead of mandating an emergency when none exists. The discussion in this paragraph regarding efforts to ascertain P removal feasibility by dischargers (pilot studies) is irrelevant to the TMDL at this time, and should be eliminated from this document. All pilot efforts underway are only now yielding preliminary results, with no assurance that the pilot results will be implementable to achieve the levels of phosphorus removal required. Pilot treatment projects to date have made only preliminary progress toward determining if P removal to low levels can be achieved, and how consistently. Other effects of implementation of the technologies piloted, such as initial cost, life cycle cost, environmental cost (e.g., “carbon or energy footprint”, depletion of resources, residuals disposal cost, etc.), and the implications of the technology toward meeting other water quality objectives (e.g., micro-contaminants) are yet to be assessed.
Response: It is unclear to Ecology how it can avoid discussions of schedule, given that they are a TMDL requirement. It should be noted that these schedules are general in nature and the details described in the comment above will be provided in the NPDES permits.
4. [page xii, paragraph 5; Page 46, paragraph 2, page 58, paragraphs 2 and 3] Because imposing more stringent requirements is contradictory with investment stability, we request that the language be revised to clarify that waste load allocations and NPDES permit requirements based on WLA's will not be made more stringent over the 20-year life of the plan. Also, the County requests that Ecology include additional language specifically acknowledging that a Use Attainability Analysis [UAA] or Site Specific Criteria may be used to modify or adjust this TMDL in the future, if the water quality in Lake Spokane does not meet the state's water quality standards.
Response: The investment stability provision listed in the “Managed Implementation Plan” section of the TMDL refers to stability for technology investments, not wasteload allocation stability. Therefore Ecology cannot guarantee wasteload allocations will not be more or less stringent in the future. In addition, UAA’s are clearly described under 173-201A WAC and are always an option for the dischargers to pursue whether or not they are referenced in a TMDL (which they are in Figure 8).
5. Therefore I encourage you and the Washington Department of Ecology NOT TO DELAY enforcement of the pollution targets; dischargers should not be given 10 more years to comply.
Response: See summary response for Part O.
6. There has finally been a good start to the clean-up, but it is only a start, and it needs to be implemented immediately while more initiatives are considered.
Response: Comment noted.
7. The time table to reach compliance could be pushed up from 10 years. While predicting realistic compliance expectations has many variables, both with the new Spokane County Plan
Spokane River / Lake Spokane Dissolved Oxygen Water Quality Improvement Report Page C-106
and Avista, their interim tasks have goals that could contribute somewhat in moving ahead compliance target schedules.
Response: While the compliance schedule is ten years, there will be interim targets defined in the NPDES permits that must be achieved prior to ten years. See Tables 8 and 9 for these targets.
8. Page 56-58: Ecology discusses schedules in this section, but there is no fixed schedule as required by Pinto Creek for the non-point source reductions "sufficient to achieve water quality standards". See 504 F.3d at 1014. Ecology should develop schedules for the non-point source reductions.
Response: Dates for tributary load allocation reduction targets (as specified by the tributary TMDLs) have been added to the Load Allocation, Reasonable Assurance, and Managed Implementation Plan sections of the TMDL. If dischargers choose other nonpoint source load allocations to the river mainstem, (groundwater, for example), dates for meeting those reductions would be specified in subsequent (2nd cycle) NPDES permits.
9. The plan still allows the polluters to get away with doing nothing substantial as far as cleanup goes. This isn't "reasonable assurance" that the plan calls for in meeting water quality standards. Stop giving the polluters a break! They have had one for too long.
Response: Meeting these nutrient permit limits will require substantial investment and commitments by the dischargers and ratepayers in general. These commitments are summarized in Table 8 and will be further detailed in the NPDES permits and associated documents (delta management plans, etc).
10. None of the parties signing onto this comment letter [by the University Legal Assistance / Kootenai Environmental Alliance / Lake Spokane homeowners] wants to unnecessarily extend the implementation of a TMDL on the Spokane River and Lake Spokane. However, given that dischargers are provided with a minimum of 10 years to meet the TMDL requirements, the parties do not want to wait another 10 years to properly address the phosphorous/D.O. issue on Lake Spokane. Further, KEA, Mr. Bollie, Mr. Buterbaugh, and Mr. Chaney also do not want the dischargers to spend millions of dollars on technology that will not result in a clean Lake free from toxic algae blooms. The parties hereby request that Ecology implement the changes outlined in this comment letter and circulate a new draft TMDL for public comment.
Response: See summary response for Part O related to compliance schedules and actual conditions that must be met prior to year ten. Eleven years is long enough delay in pursuing implementation actions called for in this TMDL, actions which will reduce algae blooms and improve dissolved oxygen in Lake Spokane. Ecology shares the concerns related to toxic algae blooms. It’s important to realize, however, that reducing these blooms will not only require significant investments by upstream sources and Avista, but will also require lakeshore owners to adopt better practices related to landscaping, septic system maintenance, and water conservation. An additional public comment period is not being considered at this time.
Spokane River / Lake Spokane Dissolved Oxygen Water Quality Improvement Report Page C-107
11. The draft TMDL doesn't contain clear requirements that demonstrate to the discharger and the public that an entity is complying with its waste load allocation.
Response: Compliance with a wasteload allocation is determined based on a permit compliance schedule, which is outlined in Table 10 of the final TMDL. Further details on compliance metrics are provided in the NDPES permits. As stated in the “Water Quality Standards and Numeric Targets” section of the TMDL, compliance with the water quality standards over the course of TMDL implementation will be determined by the following:
1. Reviewing measured discharger [NPDES permittees] and tributary water quality data to determine if wasteload and load allocations are being met;
2. Reviewing Avista’s implementation activities and data as part of the 401 Certification WQAP; and
3. Comparing model scenarios for the natural (the No Source modeling scenario described in the TMDL Analysis section) and current water quality to determine the difference once actions described in this TMDL are implemented.
12. Enough is enough. The polluters can't have another 10 years or more to clean up the phosphorus in the river. Citizens and taxpayers have already waited 11 years.
Response: See summary response for Part O.
13. The time table to reach compliance could be pushed up from 10 years. While predicting realistic compliance expectations has many variables, both with the new Spokane County Plant and Avista, their interim tasks have goals that could contribute somewhat in moving ahead compliance target schedules.
Response: While the compliance schedule is ten years, there will be interim targets defined in the NPDES permits that must be achieved prior to ten years. See Table 10 for these targets.
14. [from Sierra Club] Next, delay, delay, delay. The Spokane River has waited 11 years for a legally sufficient phosphorous cleanup plan. This draft, the fourth, allows dischargers another 10 years or more to comply with the plan. This strategy of delay is harming the Spokane River and the fish and wildlife that depend on the river.
Response: See summary response for Part O. Ecology shares the desire to move forward on this much needed plan.
Spokane River / Lake Spokane Dissolved Oxygen Water Quality Improvement Report Page C-108
P. Toxics – PCBs, Metals, etc. Summary: The TMDL should account for other pollutants that violate water quality standards in the Spokane River (303(d) list), namely PCBs and other toxic pollutants. Summary Response: Because this TMDL addresses low dissolved oxygen, its focus is on control of nutrients. Other water quality issues such as heavy metals and PCBs are addressed through separate TMDLs (the draft PCB TMDL will be revised over 2010 or may be addressed through an overall toxics reduction strategy). A TMDL for metals was completed in 1999 and sets limits on the amount of metals that can be discharged to the river. In addition, Ecology is developing an integrated toxics strategy, which includes implementing the Urban Water Initiative for the Spokane River (the only one in Eastern Washington, the two others being on the Duwamish and Commencement Bay waterways in Western Washington) which will determine sources of toxic substances to the river and work to remedy them. Because most toxics are ubiquitous legacy pollutants with innumerable potential sources, Ecology feels that it is important to develop the integrated strategy, which includes developing TMDLs but more importantly would expand the Urban Waters Initiative effort to detect and eliminate sources of toxic compounds. This work would be the necessary actions called for with such a TMDL regardless of the wasteload allocations or other findings. Developing and implementing this strategy will be Ecology’s focus over the coming years. 1. Since listed water bodies, including the Spokane River, are affected by more than one pollutant
(TP), coordination in limits for PBDE’s (found in waste water and sludge from wastewater treatment plants) and for PCB’s (largely from historical contamination, stormwater, and paper mills) need further attention in the Draft plan.
Response: See summary response for Part P.
2. What about PCBs. Cleanup plans for phosphorous and PCBs must connect. When dischargers install expensive technology to remedy phosphorous, that technology must also clean up PCBs. The public will pay dearly if these two plans do not connect.
Response: See summary response for Part P. Washington discharger NPDES permits will include monitoring requirements for PCBs to gather sufficient data to establish permit limits in future permits. The dischargers are aware that strict PCB permit limits are coming and have that in mind as they evaluate source control and treatment technologies.
3. The plan also needs to clean up PCBs and that clean up has to coordinate with phosphorus cleanup.
Response: See summary response for Part P.
Spokane River / Lake Spokane Dissolved Oxygen Water Quality Improvement Report Page C-109
Q. Tributary Load Allocations / Nonpoint Source Reductions Summary: The tributary load allocations (Table 6 in final TMDL, Table 5 in draft TMDL) for phosphorus, particularly the percent reductions in human loading, are unrealistic given the scope and scale of nonpoint source pollution particularly in the Hangman and Little Spokane River watersheds. In addition, there does not appear to be any accountability for reducing nonpoint source pollution in those watersheds nor is there any incentive for Dischargers or Avista to pursue offset credits in those watersheds since the percent reductions in pollution loading must be met prior to receiving those credits.
Summary Response: The tributary load allocations are calculated by taking the loading above the natural load (human caused nonpoint source load) and applying the percent reductions identified in Tables 3 and 6 to the human caused nonpoint source load. For the Hangman watershed, these percentage reductions are the outcome of applying the WARMF model to scenarios before and after full implementation of best management practices (BMP’s) specified in the total suspended solids (TSS) section of the Hangman Creek water quality improvement report (TMDL) (Joy et al. 2009, also Appendix M). The Little Spokane River reductions are based on considering existing land uses and extent of implementation of BMP’s compared to similar watersheds. The Hangman Creek dissolved oxygen and pH TMDL remains under development and is expected to be complete in 2011. This TMDL may further differentiate the amount of nutrient loading in these tributaries that is naturally-occurring from that which is human-caused. Further refinement of expected seasonal load reductions is also expected. The detailed implementation plans expected from this TMDL will also outline BMP’s needed to meet load reductions specified for Coulee Creek. These should be very similar to the BMPs specified in the Hangman Creek TMDL TSS section.
The load allocations in Table 6 [Table 5 of draft TMDL] have been modified by identifying the overall (total) nutrient load reduction percentages, not just the reductions to the human caused load (see Table 6b). These overall load reductions only apply to the 2001 modeling year. That year was a critical low-flow year for the Spokane River but was a more typical flow year for the tributaries. Recent monitoring of the tributaries has shown nutrient concentrations close to the allocation concentrations in this table over the past several years. Therefore, the allocation concentrations should be achievable in typical flow years, especially upon implementation of needed BMPs in those watersheds (as required by the tributary TMDLs) but still may be difficult during high flow years. These percent reductions were developed by considering the modeling results for the tributary TMDL efforts that determined the best potential water quality at the tributary mouths after several years of BMP implementation (see modifications to Load Allocation and Reasonable Assurance sections and Appendix M).
As described in the Managed Implementation Plan section of the TMDL, offset credits cannot be given for water quality improvements in the tributaries as part of a discharger’s delta elimination plan until the tributary load allocations are met. However, as stated in the summary response for Part N, there are no percent reduction allocations for some sources to the river mainstem, including stormwater and groundwater (including Lake Spokane watershed ground and surface water) wasteload and load allocations, respectively. Therefore, actions to reduce those sources could provide credit to Avista and the dischargers towards meeting the dissolved oxygen responsibility and the final wasteload allocation, respectively. Modeling, conducted by those
Spokane River / Lake Spokane Dissolved Oxygen Water Quality Improvement Report Page C-110
parties, would have to show those actions would provide the needed water quality improvement and future monitoring would have to show the action achieved the benefit, as determined through the ten-year assessment.
The Reasonable Assurance section of the final TMDL has been modified to include a description for the Shoreline Management Plans (SMPs), developed by the City of Spokane and Spokane County and approved by Ecology. These SMPs define BMPs within their jurisdictions for water quality improvements, which include most of Hangman Creek and the Little Spokane River. Therefore, upon approval by Ecology, these plans provide a potential means of enforcing water quality BMPs for nonpoint source pollution. To integrate SMPs with the TMDL effort will require cooperation amongst the wastewater treatment and planning departments within the City and County.
1. In order to be able to actually use the offsets that are contemplated and encouraged in the TMDL, we [Avista] believe that it is very important that the TMDL make it clear that dischargers and Avista can obtain offsets for any reductions in nonpoint source loading in the tributaries.
Response: See summary response for Part Q. Offset credits are allowed only for those reductions that are beyond current requirements for the tributaries. Avista can also pursue nonpoint source reductions for nutrients around Lake Spokane to increase the loading capacity for dissolved oxygen.
2. Ecology must explain and demonstrate why the 2009 Draft TMDL utilizes a different methodology for calculating load allocations for the tributaries. Further, Ecology must demonstrate how it calculated the reduction values for the tributaries and explain the rational for what appears to be completely arbitrary load reductions.
Response: See summary response for Part Q. Work performed on tributaries (modeling in support of TMDLs in those watersheds) since the last draft TMDL helped guide the refined tributary load reductions in the 2009 TMDL. Regarding calculation methodology for the tributaries, see response to comment number 7, Part J.
3. The 2009 Draft TMDL should use the 7 µg/L -11 µg/L in Table 5 [from Cusimano 2004, Table B3], and not the unexplained 19 µg/L as the phosphorous target for Little Spokane in the July to October period. Further, the LAs (% reductions) assumed in the 2009 Draft TMDL for Hangman Creek are incorrect and need to be revised to represent lower, realistic loading reductions.
Response: Table B3 in the 2004 TMDL described model inputs for modeling scenarios that were previously used. The values in the PO4 column represent Orthophosphorus. Total phosphorus includes orthophosphate, algae and organic phosphorus. The updated model uses a different (dynamic) algorithm to characterize orthophosphate and organic phosphorus speciation. Input files for the new model are available. The mean TP concentration (from table 4, page 21 of the same report) was 0.027 µg/L. The value of 0.019 was the target phosphorus level, which represents a 30% reduction.
Spokane River / Lake Spokane Dissolved Oxygen Water Quality Improvement Report Page C-111
4. Latah Creek and Little Spokane River have problems of their own. But any contribution they make to the content of the big Spokane is of minor consequence and lets the main polluters off the hook.
Response: High spring flows from Hangman creek and high year round flows from Little Spokane River make load reductions in those watersheds critical for the success of the TMDL.
5. Hangman Creek cleanup is equally unrealistic [as target for the Little Spokane River]. These tributary pollution targets are not realistic. But on paper the draft plan claims tributary credits to relax pollution limits for the sewage and industrial dischargers.
Response: See summary response for Part Q. Wasteload allocations are slightly higher than previous drafts due to assigning a dissolved oxygen responsibility to Avista, something all Spokane River stakeholders requested in previous drafts.
6. The [Spokane] Tribe strongly supports Ecology's desire to reduce non-point source pollution in the basin, however, the contemplated reductions are unrealistic.
Response: See summary response for Part Q.
7. The assumptions used in the modeling scenarios are not conservative or realistic for the LAs assigned to the tributaries and should be reevaluated. The WLAs must be water quality-based, not technology-based.
Response: See summary response for Part Q and R.
8. Page 16: Ecology states the following, "Nonpoint source pollution in groundwater is defined in this TMDL as concentrations of phosphorous in groundwater above 6 µg/L, which was the lowest measured value in valley aquifer wells." Upon review of the groundwater data, there are 849 samples with phosphorous data less than 6µg/L. Accordingly, Ecology's use of the 6 µg/L overestimates phosphorous loads under natural conditions. Ecology should explain its use of 6 µg/L in groundwater when the data shows concentrations much lower in the samples.
Response: See summary responses to Parts J and N related to groundwater data and the load allocation.
9. Page 18: Footnote 6 describes the percentage reduction in tributary nutrient loads. Ecology should clearly explain how the reductions were reached and their scientific support.
Response: See summary response for Part Q and response to comment number 7, Part J.
10. Page 31: Table 5 [Table 6 in final TMDL] should be explained in more detail. It appears that Groundwater allocation is significantly increased. Table 5 sets load allocation for groundwater at 1031bs/day during the months of March-May, June is set to 591bs/day, and July-October 471bs/day. However, on Page M-3 a chart describing groundwater flows per month states that March is 53.81bs per day, April is 51.6 lbs/day, and May is 202.51bs/day. Under the proposed allocations, TP pollution would be increased for the months of March and April, and decreased only in May. What is the scientific reason for this? The same type of increase is set out for Aug-Oct. Again, within the TMDL there is no explanation for such monthly increases.
Spokane River / Lake Spokane Dissolved Oxygen Water Quality Improvement Report Page C-112
Response: See summary response for Part Q. Differences in numbers used for this draft are a result of a review of all relevant groundwater information, including updated monitoring and data analysis.
11. …explain why you included the month of March in your tributary load allocations when the previous two draft TMDLs only used April and May. Please explain why you changed your methodology for calculating tributary load allocations. Please explain how you calculated the non-point source reduction values, because they appear to be arbitrary. Yet, they are obviously important to the remaining calculations.
Response: The draft TMDL included March allocations for both point and nonpoint sources, because past model simulations by EPA had shown an impact from Idaho point source discharges in March on dissolved oxygen in Lake Spokane in the critical period. Given that the model has been updated, EPA has run a new scenario to isolate impacts from discharges in the month of March to confirm the previous findings. This test confirms that discharges in March impact dissolved oxygen in Long Lake in the critical period and allocations are warranted (see PSU 2010).
Regarding changes to the methodology for calculating tributary allocations, see comment number 7, Part J.
12. It's my understanding you previously modeled the tributary load allocations and then calculated the percent load reductions. Why the change in methodology?
Response: Since the last Spokane TMDL effort, both Little Spokane River and Hangman Creek began their own TMDL processes. Data and modeling from those efforts guided the current load reduction estimates for those tributaries in the 2009 draft TMDL. See also response to comment number 7 for Part J.
13. These [load] allocations translate to nutrient loading reductions ranging from 20 to 50 percent. Thus, water quality standards for Lake Spokane cannot be achieved unless the 20 to 50 percent reductions in non-point source loadings are actually achieved. Avista strongly encourages Ecology to take all actions necessary to meet these load allocations.
Response: See summary response for Part Q related to the explanation on percent reductions. Working with the stakeholders on this project, Ecology is committed to taking all actions to reduce nonpoint source pollution in the watersheds to meet these load allocations.
14. The TMDL does not provide any documentation on how these [tributary load] reductions were determined or any documentation of what type of best management practices might be utilized to achieve these reductions… it will be very difficult to ascertain whether or not the Best Management Practices included in a delta elimination plan or Avista's Water Quality Action Plan are separate and unique from the reductions identified in the load allocation scenario for nonpoint sources. It appears that there is a great potential for confusion and possible double-counting of proposed nonpoint source control efforts due to the lack of specific details in the TMDL.
Response: See summary response for Part Q and Part N (related to advisory group following TMDL approval).
Spokane River / Lake Spokane Dissolved Oxygen Water Quality Improvement Report Page C-113
15. …with respect to non-point sources, no entities are identified that will "have their feet held to the fire" to address these sources. In addition, no enforcement mechanisms such as permits for point sources or Avista FERC license requirements are identified that will force the actions to achieve the Load Allocations for the non-point sources. In addition, Kaiser is concerned that nonperformance with respect non-point sources not achieving the identified reductions in phosphorous will eventually place further burdens for reductions on point sources and Avista.
Response: See summary response for Part Q. If nonpoint reductions are not achieved, more reductions may be required from point sources. However, Washington’s water quality standards require that nonpoint reductions used to achieve the wasteload allocations in this TMDL must be secured using binding legal instruments between any involved parties for the life of the project.
16. These bullet points [page 14, bullets 5 and 6] state that DO in the hypolimnion is most impacted by non-point source pollution, and that DO in the metalimnion during the summer is most impacted by point source pollution. Please include an explanation and/or data in the plan to support these statements.
Response: This is a reference to conclusions in Cusimano (2004), where the data resides. During critical low flow conditions, as was found in 2001, point source dominates river flow during the critical summer period.
17. The 2009 Draft TMDL must provide more than plans and studies insofar as it accepts non-point source reduction methods as sufficient to satisfy the responsibilities of Avista and dischargers. Tested and proven methods of monitoring non-point source reductions are necessary to guarantee that such methods will comply with the 2009 Draft TMDL as planned, and should be specified and supported with analysis prior to adoption of the 2009 Draft TMDL. Proper monitoring of non-point sources will require attaining solid numeric results to be compared to LA and WLAs.
Response: Individual implementation plans will be drafted for tributaries with TMDLs. Monitoring will continue to be conducted in the tributaries, confluences, and throughout the river mainstem and Lake Spokane as part of TMDL efforts in those areas. Quality Assurance Project Plans (QAPPs), which must be approved by Ecology, will be developed by any entity monitoring existing nonpoint source pollution and the results of BMP implementation as part of any chosen target pursuit actions (see summary response for Part N). Ecology will determine which actions support offsetting wasteload allocations as part of the ten-year assessment.
18. [the TMDL] fails to address the winter and early spring discharges of pollutants and their effect on sediment oxygen demand during the critical months.
Response: Conditions prohibiting bypass of treatment facilities and requiring proper operation and maintenance of treatment facilities are currently and will continue to be incorporated into the Washington NPDES permits (as required by 40 CFR 122.41(e), (m)). These conditions, coupled with specific Best Management Practices (BMPs) for phosphorus control, will ensure that discharges are well-controlled year-round.
Spokane River / Lake Spokane Dissolved Oxygen Water Quality Improvement Report Page C-114
19. Why did you change the methodology for averaging, the loading for specific periods? The result has been a drastic reduction in non-point source reduction values from approximately 96 percent in the 2004 draft TMDL to 50 percent in the 2007 draft TMDL to 36 percent in the 2009 draft TMDL, yet conditions on the ground haven't changed that drastically to indicate why those reductions are so drastic.
Response: See summary response for Part Q, and for methodology changes, see response to comment number 7, Part J.
20. When the Little Spokane River is flowing near baseline conditions, flow is largely derived from groundwater, and phosphorus concentrations are usually less than 10 µg/L. See Cusimano 2004, Table B-3. The draft TMDL estimate for Little Spokane phosphorus concentrations at 0.019 μ/l are inconsistent with Ecology’s ambient data, and likely inaccurate. Moreover, the draft TMDL contains no analysis to support the conclusion that a 36% reduction from the actual low groundwater P concentrations could be achieved during the critical period. As a result, the draft TMDL does not contain reasonable assurance that phosphorus loading from the Little Spokane River can be reduced as set forth in Table 5 [Table 6 in final TMDL] and as required to achieve attainment of water quality standards (and to allow liberal WLAs for and increased loading from the point source dischargers).
Response: See summary response for Part Q and response for comment number 3, Part Q. Ecology’s Ambient Monitoring program has several years of monitoring data (link below) demonstrating elevated phosphorus levels at the mouth of Little Spokane River.
http://www.ecy.wa.gov/apps/watersheds/riv/station.asp?theyear=2002&tab=notes&scrolly=0&wria=55&sta=55B070&docextension=.xls&docextension=.xls
21. The draft TMDL does not contain reasonable assurance that phosphorus loading from Hangman Creek can be reduced by up to 50% as set forth in Table 5 [Table 6 in final TMDL], as required to achieve attainment of water quality standards for dissolved oxygen (and to allow liberal WLAs for and increased loading from the point source dischargers).
Response: See summary response for Part Q. Wasteload allocations are slightly higher than previous drafts due to assigning a dissolved oxygen responsibility to Avista, something all Spokane River stakeholders requested in previous drafts.
22. The Hangman Creek TMDL, at Tables ES-8 and ES-9, pp. 29-30, indicates that best estimates for reduction in total suspended solids, which may serve as a surrogate for reductions in phosphorus, top out at 26% in the upper Hangman area (which is in Idaho and outside the reach of the DO TMDL) and average around 16% in the lower Washington reaches. The draft TMDL does not discuss these findings or indicate how Ecology has arrived at its estimates of up to 50% phosphorus reductions in Hangman Creek that are used as a basis for concluding that water quality standards in the Spokane River and Lake Spokane can be met. Reasonable assurance is not only absent, it is contra-indicated.
Response: This confusion about tributary load reductions is due to differences in the basis for load reductions. In the tributary TMDLs, reductions are based on total loads and Table 6 has been modified by providing total load reductions. The load reductions called out in the
Spokane River / Lake Spokane Dissolved Oxygen Water Quality Improvement Report Page C-115
draft Spokane TMDL only included reductions to the human caused loads. See summary response for Part Q.
23. Finally, the new expansion of the critical season into March incorporates substantial new loading from Hangman Creek, inflating phosphorus loading presumably to support water quality trading or offsets. However, March loading has not been shown to affect water quality in Lake Spokane. Moreover, averaging March loading from Hangman Creek over the course of several months (rather than month-by-month loads as was set forth in the 2004 TMDL) allows an averaging of tributary non-point source reduction benefits, which will not actually help reduce the harm to Lake Spokane.
Response: See response to comment number 11, Part Q regarding March loading and response to comment number 7, Part J related to averaging.
24. The Draft TMDL sets targets for nonpoint source controls in the tributaries based on what "can reasonably be expected" but also requires these reductions to occur before any point source, such as the City, could utilize non-point source activities along the tributaries to meet any Delta obligation. TMDL, p. 29. It seems unlikely that these reasonably expected reductions will occur on the tributaries within the next 5 - 10 years, or that any cost-effective actions would remain to be completed after what "can reasonably be expected" has already been done. As a practical matter, this approach eliminates non-point source controls along the tributaries as an option for Delta reductions strategies.
Response: See summary responses for Part N and Q.
25. The plan calls for 36% clean-up [Little Spokane River] – an impossible target. Hangman Creek cleanup is equally unrealistic. These tributary pollution targets are not realistic – but on paper the draft plan claims tributary credits to relax pollution limits for the sewage and industrial dischargers."
Response: See summary response for Part Q. Wasteload allocations are slightly higher than previous drafts due to assigning a dissolved oxygen responsibility to Avista, something all Spokane River stakeholders requested in previous drafts.
26. …The load reductions assigned to the tributaries and Avista are unrealistic and unattainable. Nonetheless, these LAs will drive (are driving) the dischargers toward selection of less-than-optimal treatment technologies.
Response: See summary response for Part Q. The fact that millions of dollars are being spent on pilot treatment technologies does not support the notion that the dischargers are pursuing anything other than the most advanced wastewater treatment technologies to achieve the lowest nutrient loads.
27. Pretending that you are going to reduce the natural background phosphate content of The Little Spokane River is laughable.
Response: See summary response for Part Q.
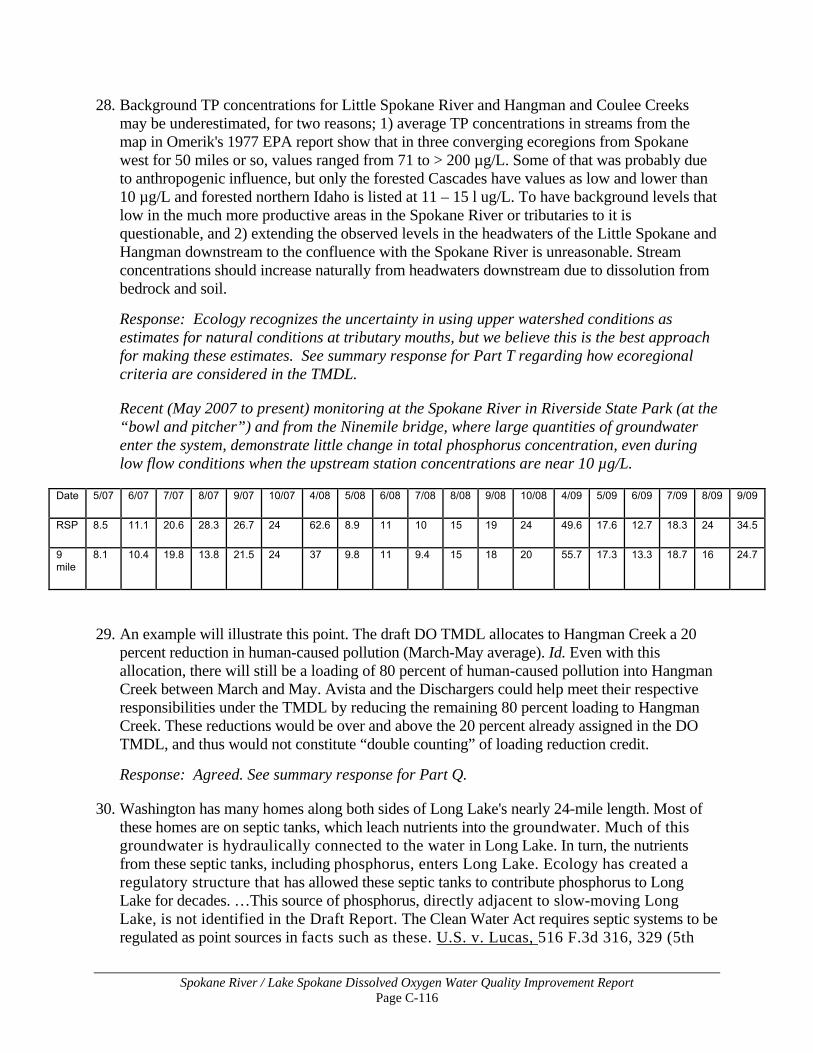
Spokane River / Lake Spokane Dissolved Oxygen Water Quality Improvement Report Page C-116
28. Background TP concentrations for Little Spokane River and Hangman and Coulee Creeks may be underestimated, for two reasons; 1) average TP concentrations in streams from the map in Omerik's 1977 EPA report show that in three converging ecoregions from Spokane west for 50 miles or so, values ranged from 71 to > 200 µg/L. Some of that was probably due to anthropogenic influence, but only the forested Cascades have values as low and lower than 10 µg/L and forested northern Idaho is listed at 11 – 15 l ug/L. To have background levels that low in the much more productive areas in the Spokane River or tributaries to it is questionable, and 2) extending the observed levels in the headwaters of the Little Spokane and Hangman downstream to the confluence with the Spokane River is unreasonable. Stream concentrations should increase naturally from headwaters downstream due to dissolution from bedrock and soil.
Response: Ecology recognizes the uncertainty in using upper watershed conditions as estimates for natural conditions at tributary mouths, but we believe this is the best approach for making these estimates. See summary response for Part T regarding how ecoregional criteria are considered in the TMDL.
Recent (May 2007 to present) monitoring at the Spokane River in Riverside State Park (at the “bowl and pitcher”) and from the Ninemile bridge, where large quantities of groundwater enter the system, demonstrate little change in total phosphorus concentration, even during low flow conditions when the upstream station concentrations are near 10 µg/L.
Date 5/07 6/07 7/07 8/07 9/07 10/07 4/08 5/08 6/08 7/08 8/08 9/08 10/08 4/09 5/09 6/09 7/09 8/09 9/09
RSP 8.5 11.1 20.6 28.3 26.7 24 62.6 8.9 11 10 15 19 24 49.6 17.6 12.7 18.3 24 34.5
9 mile
8.1 10.4 19.8 13.8 21.5 24 37 9.8 11 9.4 15 18 20 55.7 17.3 13.3 18.7 16 24.7
29. An example will illustrate this point. The draft DO TMDL allocates to Hangman Creek a 20 percent reduction in human-caused pollution (March-May average). Id. Even with this allocation, there will still be a loading of 80 percent of human-caused pollution into Hangman Creek between March and May. Avista and the Dischargers could help meet their respective responsibilities under the TMDL by reducing the remaining 80 percent loading to Hangman Creek. These reductions would be over and above the 20 percent already assigned in the DO TMDL, and thus would not constitute “double counting” of loading reduction credit.
Response: Agreed. See summary response for Part Q.
30. Washington has many homes along both sides of Long Lake's nearly 24-mile length. Most of these homes are on septic tanks, which leach nutrients into the groundwater. Much of this groundwater is hydraulically connected to the water in Long Lake. In turn, the nutrients from these septic tanks, including phosphorus, enters Long Lake. Ecology has created a regulatory structure that has allowed these septic tanks to contribute phosphorus to Long Lake for decades. …This source of phosphorus, directly adjacent to slow-moving Long Lake, is not identified in the Draft Report. The Clean Water Act requires septic systems to be regulated as point sources in facts such as these. U.S. v. Lucas, 516 F.3d 316, 329 (5th
Spokane River / Lake Spokane Dissolved Oxygen Water Quality Improvement Report Page C-117
Cir. 2008) (holding that septic tanks that discharge into waters of the United States are point sources); see N. Cal. River Watch v. City of Healdsburg, 496 F.3d 993, 997-98 (9th Cir. 2007) (holding that point source was discharging illegally into a pond that is hydrologically connected to a water of the United States). In modeling from where the sources of phosphorus are coming, Ecology has made a judgment to ratchet down the far-away dischargers in Idaho, rather than clean up the septic tanks adjacent to the problem areas in Long Lake reservoir. This is not permissible.
Response: See summary response for Part N and Q, response to comment number 29, Part N and response to comment number 5, Part N. While the Clean Water Act does not require the septic tanks to be regulated as point sources, there appears to be much initial interest among several stakeholders to study and eliminate nonpoint sources of pollution, including septic systems, in Lake Spokane.
31. The Tributary streams can't make up for the relaxing of the limits that the sewage and industrial polluters want.
Response: See summary response for Part Q. Wasteload allocations are slightly higher than previous drafts due to assigning a dissolved oxygen responsibility to Avista, something all Spokane stakeholders requested in previous drafts.
32. Nonpoint source reduction under the TMDL is illusory.
Response: See summary response for Part Q.
33. In Appendix E, at E-6, the TMDL assumes aggressive nutrient reductions in Hangman Creek and the Little Spokane River. The Clean Water Act requires that Ecology demonstrate reasonable assurance that these reductions can be achieved. The TMDL does not describe, however, any established program, timeline, or funding to accomplish these reductions. In response to these comments Ecology should explain what specific actions it will take to fund and implement a program to reduce the nutrient loading from these tributaries.
Response: See summary response for Part Q.
Spokane River / Lake Spokane Dissolved Oxygen Water Quality Improvement Report Page C-118
R. Wasteload Allocations – Washington NPDES Permit Limits Summary: The wasteload allocations in Table 4 [Table 5 in final TMDL] were determined arbitrarily based on faulty science and are not achievable with advanced wastewater treatment. Additional modeling runs by dischargers show higher wasteload allocations by individual treatment plants have little effect on dissolved oxygen in Lake Spokane and these higher numbers should be utilized in the TMDL. Despite its stated goals, the TMDL does not equitably distribute the wasteload allocations across all dischargers in both states. The TMDL should specifically state that NPDES permits will be structured based on a seasonal average wasteload allocation. Summary Response: As described in the Load and Wasteload Allocation section of the TMDL, the goals of this TMDL effort are embodied in the following statements: • The limited loading capacity of the river requires that point sources, nonpoint sources and
Avista significantly reduce their impact on water quality impairments;
• Point source reductions should be equitably distributed among point sources, with a goal of establishing achievable reductions.
Ecology feels these goals were met by establishing modeled wasteload allocations based on a maximum monthly average concentration of 50 µg/L total phosphorus (equivalent mass value) for all dischargers in both states. In the Foundational Concepts, Ecology and the dischargers agreed that currently available treatment technologies can achieve a seasonal average 50 µg/L total phosphorus. Since then further advancements in treatment technologies are demonstrating that the permit limitations based on the WLA can be met. There is some debate and confusion on how there can be equity with different modeled wasteload allocations expressed as an average monthly limit. Because effluents are not constant and fluctuate, facilities must have an average discharge that is less than their effluent permit limits, in order to consistently comply with those limits. The extent to which the average discharge must be below the average monthly limit in order to ensure compliance depends on two things: 1) the effluent variability and 2) the sampling frequency. Ecology and EPA assumed the same variability for all of the dischargers (a coefficient of variation or relative standard deviation of 60%). It's the assumed sampling frequency that's different, for different point sources. If two otherwise identical facilities each have an effluent limit of 50 g/L, as a monthly average, but one facility samples less frequently than the other, the facility that samples less frequently must achieve a lower long-term average discharge, in order to consistently comply with their limit. This is because there's more uncertainty inherent in a smaller sample size. If the facility samples every day, this reduces the uncertainty. A facility that samples more frequently can operate somewhat closer to its effluent limit and still maintain compliance. Based on this assumed sampling frequency and effluent variability, there is increased confidence that the City of Spokane can meet a monthly average of 50 g/L P with a seasonal average of 42 g/L P. Other dischargers, with less frequent sampling and a higher degree of uncertainty, were given lower seasonal average WLAs to meet a monthly average of 50 g/L.
Spokane River / Lake Spokane Dissolved Oxygen Water Quality Improvement Report Page C-119
The assumption for establishing modeled wasteload allocations is that the City of Spokane and Spokane County would be required to sample for phosphorus daily, but other facilities would be required to sample ten times per month or two to three times per week. That is why Spokane City and County have slightly different wasteload allocations than the rest of the dischargers. 40 CFR122.45(d) does allow that if the normal monthly averages, weekly averages and daily maximum are impractical, alternatives such as an annual or seasonal limit may be appropriate. Impractical means the water body does not respond in a measurable way to short term variations and long term trend measurements such as seasonal averages are appropriate. For dischargers to the Spokane River, impractical also means that reliable data sets with log normal distributions for conversion of maximums to averages do not exist. Following installation of new treatment technology, Ecology will use the flexibility provided by 40 CFR 122.45(d) to derive effluent limits and will use the data from the new treatment technologies to develop appropriate future permit limits. As stated in previous versions of the TMDL, there is currently no capacity for point source nutrient and oxygen demand loading to Lake Spokane. Accordingly, wasteload allocations for total phosphorous were set at background water quality levels (~10 µg/L) in the previous TMDLs. The incorporation of Avista’s dissolved oxygen responsibility creates enough loading capacity to allow for slightly higher point source wasteload allocations in the current draft. Many comments criticize the memo from EPA in Appendix J, which is perceived as providing the sole basis for determining wasteload allocations. This memo was one of several documents considered that stretch back to the TMDL Collaboration and Foundational Concepts, which was developed by dischargers. Appendix J is “a summary of previous reports [some commissioned by dischargers] and effluent data regarding existing wastewater treatment plants achieving low (≤ 50 μg/L) effluent phosphorus concentrations” (see Page 1 of Appendix J). Appendix J states that “existing (wastewater treatment plants) are consistently achieving monthly average phosphorus concentrations in the range of 21 to 60 ppb” (see Page 14 of Appendix J) and that eight of the eleven wastewater treatment plants described in the memorandum consistently produce effluents with monthly average phosphorus concentrations of 50 µg/L or lower. Ecology has the discretion to make reasonable assumptions about future reductions in phosphorus from Idaho in the TMDL. It is reasonable for Ecology to consider the performance of existing high-performing wastewater treatment plants when establishing wasteload allocations and when making assumptions about future reductions in phosphorus loading from Idaho. Pages 1 and 2 of Appendix J state that “this memorandum does not calculate a technology-based effluent limit for phosphorus. Rather, it is intended to inform (but not substitute for) a water quality-based analysis….The final determination of wasteload allocations in a TMDL must ensure compliance with water quality standards, federal TMDL regulations (40 CFR Part 130), and any more stringent requirements of State law. This memorandum does not address the question of
Spokane River / Lake Spokane Dissolved Oxygen Water Quality Improvement Report Page C-120
whether the levels of performance discussed herein are adequate to ensure compliance with these requirements.” Thus, Appendix J is neither a “technology-based target” nor is it a water quality-based analysis of phosphorus loading capacity in the Spokane River. It simply provides information about the phosphorus removal capabilities of eleven existing high-performing wastewater treatment plants. This information does not require the level of consensus or peer or public review that would be required for the establishment of a generally applicable technology-based effluent limit (e.g. an effluent limit guideline published under Section 304(b) of the Clean Water Act) in order to be considered in the establishment of wasteload allocations and assumptions. In the TMDL, wasteload allocations are established for all Washington point sources based on a total phosphorus concentration of 50 µg/L (monthly average), which, while low, can be achieved with technology and “target pursuit actions” such as nonpoint source reductions, conservation and wastewater reuse (see summary responses for Parts N and Q and Managed Implementation Plan section of TMDL). The NPDES permits will consider actual performance in establishing effluent limits. As stated in the Load and Wasteload Allocation section of TMDL:
Modeling assumptions about future municipal effluent quality are consistent for all facilities, and variation in monitoring frequency is factored into the analysis. Statistics may be used in the NPDES permitting process to calculate maximum monthly and daily or weekly effluent limits that consider facility-specific effluent variability, are consistent with these seasonal average wasteload allocations, and comply with NPDES regulations. Effluent limits that implement wasteload allocations in NPDES permits need not be identical to the wasteload allocations in order to be consistent with the wasteload allocations (EPA Environmental Appeals Board, 10 E.A.D. 135, 2001). [emphasis added]
Many of the dischargers have separately run the model to demonstrate a higher wasteload allocation is appropriate for a single discharger. In order to remain equitable to all other dischargers and Avista, Ecology cannot raise a wasteload allocation for one discharger at the expense of the others and Avista for the TMDL or permits. Ecology has informed the dischargers that during implementation, they should coordinate through the TMDL advisory group (see summary response for Part N) on one set of revised model inputs with variable wasteload allocations. If all parties are agreeable to these variable wasteload allocations, Ecology will consider these changes in future NPDES permit cycles and in the ten-year assessment. In other words, the dischargers and Avista can cut the wasteload allocation pie in different proportions as long as there is agreement that some will have larger and smaller pieces than under the TMDL and the resulting impacts in Lake Spokane are equivalent to the TMDL. See also the summary response for Part G. The NPDES permits will be released for draft public comment following approval of the TMDL. The permits will provide the details many comments request on how the wasteload allocations will be averaged into permit limits. 1. The “Estimated Limit Factors” (PSU Modeling Report, Table 2) should be 1.2 for all
dischargers. The lower factor used for the City of Spokane and Spokane County should be the
Spokane River / Lake Spokane Dissolved Oxygen Water Quality Improvement Report Page C-121
same for all dischargers. Using different values results in inequitable WLAs based on mass loading.
Response: Ecology assumed that the City of Spokane and Spokane County would be required to sample for phosphorus daily and that the other, smaller facilities would be expected to sample 10 times per month (2-3 times per week). The estimated monthly average permit limits (50 µg/L except for Kaiser) were translated to seasonal average WLAs or loading assumptions, which are the same as the model inputs, by dividing the estimated monthly average permit limit by the “estimated limit factors” in Table 2 of PSU (2009). The estimated limit factors are estimates of the ratios of the long term average discharge level to the average monthly discharge limitation. For all facilities except for the City of Spokane and Spokane County are 1.4, corresponding to a seasonal average WLA or loading assumption of 36 µg/L. The estimated limit factors for the City of Spokane and Spokane County are 1.2, corresponding to a seasonal average WLA of 42 µg/L. As stated in Table 2 of PSU (2009),, the source of the limit factors is Table 5-2, on Page 103 of the Technical Support Document (TSD). In the TSD, these factors are called long term average (LTA) multipliers. The LTA multiplier for 10 samples per month and a coefficient of variation (CV) of 0.6 is 1.38; for 30 samples per month and a CV of 0.6, it is 1.19. The limit factors in the final PSU report have been rounded to two significant figures. The slightly smaller estimated limit factors and in turn the slightly larger model inputs and wasteload allocations for the City of Spokane and Spokane County reflect the reduced uncertainty inherent in a larger number of samples.
2. Table 3. p. 17 and 18 – Differences in phosphorus input values for the CE-QUAL-W2 model runs, and for development of WLAs between equivalent discharges (e.g., Liberty Lake SWD and Inland Empire Paper Co., and Spokane RPWRF and Spokane County) are not justified. These municipal dischargers will likely use comparable technologies for achievement of effluent objectives, and therefore should be treated equivalently in establishment of WLAs. When this was pointed out to DOE representatives an explanation was offered that the difference was put in the TMDL due to an assumption that sampling frequency would be different between the smaller plant (LLSWD) and the larger plants (RPWRF, Spokane Co.). This explanation is totally unacceptable, and if it is a factor in establishing limitations to be placed in permits, that is not a subject that should be included in the TMDL report. Placement of assumptions for Permits should not be included in the TMDL report. It is up to negotiations between the dischargers and DOE what limitations should be placed in the Permit, and up to the dischargers as to how to achieve those limitations. Considerations of treatment and testing variability must be taken into account by DOE and the dischargers and incorporated into these decisions. The writer of the TMDL does not have adequate information to make assumptions regarding either at this time. We recommend taking all information tied to potential permits out of the TMDL document to avoid placing inadvertent limitation on the permit writer’s ability to consider innovative ways to meet TMDL WLAs.
Response: See summary response for Part R and the response to comment number 1 for Part R.
Spokane River / Lake Spokane Dissolved Oxygen Water Quality Improvement Report Page C-122
3. Table 4. p. 28 – WLA Mass Emission Rates (MERs) for dischargers in the same class are not equivalent. Liberty Lake SWD and Inland Empire Paper Co. have lower TP concentration (mg/l) used in calculation of the WLA MER than Spokane or Spokane County, while it is probable that similar technology will be used for reduction of TP in the effluents from each. When asked about this discrepancy by the dischargers, an explanation regarding statistical requirements for permits based on sampling frequency was offered. This is an unacceptable explanation. If MER WLAs are to be calculated using “attainable” effluent concentrations (apparently in order to avoid implications that concentration is the regulated value), then the same concentration should be used for MER calculations for all dischargers. In other words, an MER WLA for all dischargers should be determined, and divided equivalently among the dischargers (e.g., according to flow). Permits should not be developed, or even recommended in the TMDL, but should be the subject of an application and subsequent deliberation between DOE and the dischargers as to how to meet the WLA. (Note: The different concentration for Kaiser was explained as being due to dilution by ground water used for non-contact cooling, although no specific information was included to justify the calculation difference.) All information tied to or derived from potential permits should be taken out of this document. Inclusion only impedes the permit writer’s flexibility and ability to consider innovative ways to comply with WLAs. Also inclusion of this information here may impede ability to implement pollutant trading.
Response: See summary response for Part R and the response to comment number 1 for Part R.
4. Table 9, p. 57 – This time schedule does not appear to comply w/ the legislative mandate to extend compliance schedules for ordered improvements resulting from TMDL actions (see comment regarding page 46, and reference on page 46). Subsequent discussion that “compliance with permit requirements within ten years are required” gives the impression of urgency, when urgency is not necessary given that there will be no deterioration of river environment if a 20 year period is allowed, as apparently legislatively directed. The TMDL is intended to provide beneficial effects in the river environment, but the rate of recovery from the current annual seasonal low DO conditions after implementation of the discharger P reduction is uncertain given the uncertainty of the model, and uncertainty of the affect of sediment P release and other factors. There is no health and safety issue requiring that these effluent control projects should be placed on a higher than necessary (e.g., emergency) compliance schedule.
Response: See summary response for Part O related to extended compliance schedules.
5. The Draft TMDL determination on treatment technology is arbitrary and capricious.
Response: See summary response for Part R.
6. …the draft DO TMDL does not limit discharges from upstream sources from November through February, notwithstanding that those discharges have the same effect on the bottom of the lake as nutrients discharged from March through October, and any effect those nutrients have during the “critical season” becomes the sole responsibility of Avista under the terms of the draft DO TMDL.
Spokane River / Lake Spokane Dissolved Oxygen Water Quality Improvement Report Page C-123
Response: See response for comment number 6, Part R.
7. It is fair to say that it is not well understood how winter discharges of TP, CBOD, and Ammonia affect the critical periods dissolved oxygen levels. Furthermore, the Tribe is very concerned about how winter discharges of TP, CBOD, and Ammonia affect oxygen levels in Tribal waters during the months dissolved oxygen is at its lowest. Given this uncertainty, Ecology should set stringent year-round LAs and WLAs in this TMDL.
Response: See response to comment number 6, Part R.
8. Page 56: Ecology states: "The TMDL considers that Dischargers will meet the wasteload allocations in Table 4 [Table 5 of final TMDL] within ten years (2019) [2020 in final draft]." Ecology should change "considers" to "requires."
Response: Ecology has made the suggested change but notes that the TMDL also acknowledges that wasteload allocations, as with all other numbers in this document, may require modification based on new information such as may be found in the ten-year assessment.
9. The Water Quality Improvement Report should state that the DO TMDL model uses assumptions to establish waste load allocations, however those assumptions and the waste load allocations are not themselves NPDES permit effluent limitations. The Water Quality Improvement Report should also state that the model should not be used to establish compliance requirements for 401 Water Quality Certification. During implementation, the DO TMDL model should be used only as an evaluation tool, and not for determining compliance.
Response: The distinction between wasteload allocations and permit limits is adequately described in the Load and Wasteload Allocation section of the TMDL. As stated in the “Water Quality Standards and Numeric Targets” section of the TMDL, compliance with the water quality standards over the course of the TMDL will be determined by considering more than just modeling; it will include a full assessment of measured water quality data by the dischargers and Avista in addition to modeling. Modeling will be used both to determine the estimated improvements for planned target pursuit actions and to determine (as part of the ten-year assessment) the effectiveness of those actions once they are implemented.
10. In reference to the point sources, the TMDL repeatedly uses the term "seasonal average" to describe effluent concentrations and waste load allocations. The modeling scenarios that were developed to help identify potential WLA's use terminology such as maximum monthly average and long-term average to describe different concentrations of effluents used in the modeling analysis. Please provide a definition of seasonal average that is consistent with the terminology used in the modeling analysis and better describes how Ecology is using these various terms.
Response: The terms “seasonal average” and “long-term average” both refer to the average effluent concentrations during the March – October time period. A long-term average number was developed for each of the point sources to be used during model simulation; this long-term average number is the WLA, and is based on the monthly average value of 50 µg/L and assumed sampling frequencies. The long-term average can vary
Spokane River / Lake Spokane Dissolved Oxygen Water Quality Improvement Report Page C-124
between treatment plants, as described in the summary response for Part R. Modifications have been made to Tables 3 and 4 [Table 5 of final TMDL] to clarify these issues.
11. The text in this paragraph, and the text above Table 4 [Table 5 of draft TMDL] discuss the translation of WLA's to NPDES permit limits, but the references are confusing. In particular, the sentence in the table which states that "Average concentrations can be converted to appropriate monthly and maximum daily loads in the Dischargers NPDES permits." appears to be completely unnecessary to state in the TMDL and presumes structural aspects of NPDES permits that are impracticable. Please edit the text to state that seasonal limits are appropriate in NPDES permits for phosphorus and to state that seasonal limits are also appropriate for NH3 and CBOD, with appropriate consideration of chronic and acute toxicity for NH3 in the immediate vicinity of outfalls to the River.
Response: See summary response for Part R and response to comment number 10, Part R.
12. As we [Spokane County] have explained, and consistent with the TMDL modeling, a seasonal average for phosphorus is appropriate. After one NPDES permit cycle, operational results may be available to run a statistical analysis to determine reasonable monthly limits. Prior to that, trying to guess about effluent variability creates a high risk of imposing even more stringent seasonal performance limitations on the plant than are included in the TMDL. Imposition of inappropriate monthly limits that result in a more stringent seasonal performance limit than is required by the TMDL is arbitrary and unreasonable.
Response: See summary response for Part R.
13. The TMDL [page 17, table 3] would benefit from an explanation of the derivation of the specific WLA's in the table, especially the numbers for NH3 and CBOD. In the past, Spokane County has provided model results to Ecology to demonstrate that higher concentrations of NH3 and CBOD can be discharged to the Spokane River in compliance with the water quality standards in the river. Past water quality modeling work demonstrated the insensitivity of Lake Spokane water quality to upstream NH3 and CBOD loadings.
Response: For municipal point sources, wasteload allocations for CBOD5 are based on a maximum monthly average CBOD5 concentration of 5 mg/L. The same assumptions regarding sampling frequency and variability that were applied to the phosphorus WLAs were also applied to the CBOD5.
Ecology and EPA believe that a maximum monthly average effluent concentration of 5 mg/L CBOD5 is achievable with available technology. The BOD5 or CBOD5 removal performance of several wastewater treatment plants that achieve low effluent phosphorus concentrations is provided in “Advanced Wastewater Treatment to Achieve Low Concentration of Phosphorus (EPA 2007)”. Of the thirteen wastewater treatment plants for which BOD5 effluent data were provided in that publication, ten had maximum monthly average BOD5 or CBOD5 concentrations of less than 5 mg/L. Design flows of these ten facilities ranged from 1.5 – 67 million gallons per day, and a variety of liquid and solid treatment processes were employed at these facilities.
See also the summary response for Part R and the response to comment number 1 for Part R.
Spokane River / Lake Spokane Dissolved Oxygen Water Quality Improvement Report Page C-125
14. Ecology should explain the methods for determining the WLAs for CBOD and N-NH3 and why limits that are more stringent were not required given the results at other WWTP.
Response: See response to comment number 13 for Part R.
15. [from University Legal Assistance] EPA’s conclusion (2009 Draft TMDL Appendix J) about WWTP performance was used to identify a phosphorous concentration produced by the “most effective feasible wastewater removal treatment technology" (2009 Draft TMDL page vii). EPAs analysis in the memo is flawed by its use of year-round performance from the plants evaluated. Winter period performance from plants in cold and/or wet climates is more variable and typically not as good as during summer months and should have been excluded from the analyses. In contrast, the Spokane area dischargers only have to provide treatment for phosphorous removal on a seasonal basis. Much of the treatment performance data is less-than values, which EPA arbitrarily assigned a value.
Response: See the summary response for Part R regarding the use of Appendix J. Year round limits are not proposed in the TMDL as described in the response to comment number 6, Part R.
16. The 2004 Draft TMDL is legally and scientifically defensible, something the 2009 Draft TMDL is not. Ecology should defend the results of the 2004 Draft TMDL requiring a point source discharge of no more than 10 µg/L.
Response: The 2004 draft did not provide any incentives for wastewater reuse, nonpoint source reductions, or incorporate the effects of Avista’s Long Lake Dam into the process or identify nonpoint source loads from stormwater and groundwater. Ecology feels these additional items, requested by all stakeholders, are significant improvements from prior drafts of the TMDL.
17. The Tributary streams can't make up for the relaxing of the limits that the sewage and industrial polluters want. Avista is also being asked to be responsible for more clean up that it can realistically do. The plan still allows the polluters to get away with doing nothing substantial as far as cleanup goes. This isn't "reasonable assurance" that the plan calls for in meeting water quality standards.
Response: See summary response for Part Q related to tributary load allocations and response to comment number 9, Part O. Wasteload allocations are slightly higher than previous drafts due to assigning a dissolved oxygen responsibility to Avista, something all Spokane River stakeholders requested in previous drafts. Ecology believes the dissolved oxygen responsibility assigned to Avista is reasonable and feasible.
18. The County does not believe that this memorandum [Appendix J] should be included in the TMDL. Spokane County, as a member of the Spokane River Stewardship Partners, has provided Ecology with substantial comments explaining its concerns with this memorandum. For reasons stated in the Spokane River Stewardship Partners' letter, the County requests that the memorandum be removed. If Ecology does not remove the memorandum, then the County requests that the Spokane River Stewardship Partners' letter be included as well.
Spokane River / Lake Spokane Dissolved Oxygen Water Quality Improvement Report Page C-126
Response: See summary response for Part R related to use of the Appendix J memo. Ecology respectfully chooses to retain the memo as an appendix to the TMDL. While the County correspondence has not been included as an appendix, it remains part of the public record and was considered during development of the TMDL.
19. Ecology should provide an explanation as to why the WLAs are not set year round, or change the WLAs to year round to provide a better MOS.
Response: See response to comment number 6, Part R.
20. But the problem is that everybody combines the Spokane River with the issue of Long Lake into one issue. 100 micrograms, 500 micrograms [of total phosphorus] would probably easily protect the water quality standards in the Spokane River.
Response: See summary response for Part R.
21. The human caused total phosphorus load is reduced by an average of 85 percent over the same time period." Yet on page 25, in the Section title Loading Capacity, it states that "Total phosphorus from point sources will be reduced by up to 94 percent (Figure 4)" - why is this?
Response: Changes have been made to clarify these percent reduction estimates. As noted in the comment, the TMDL requires an estimated 94 percent reduction in point source phosphorus discharges.
The 85 percent reduction estimate is not comparable to the point source reduction, because it represents the total human-caused loading entering the river from both point and nonpoint sources. This estimate is calculated by comparing loads entering the reservoir based on the TMDL allocations to loads in 2001.
22. There is no justification for Ecology’s determination that IEP can achieve a seasonal average phosphorus limit of 36 µg/L. IEP is not aware of any water quality treatment technology that would allow it to achieve this limit. Nor is IEP aware of any source reductions or available non-point source reductions that would afford a reasonable opportunity to comply with the proposed waste load allocation in the Draft TMDL…Ecology has been unable to identify any legitimate opportunities that would provide IEP with confidence that the delta can be achieved.
Response: See summary response for Part R and response to comment number 19, Part N.
23. The plan should clearly state that this TMDL does not establish effluent limitations for NPDES permits.
Response: See summary response to Part R.
24. Modeling performed with IEP’s phosphorus loading at a seasonal average of 200 µg/L demonstrates that there would be no violation of applicable standards at the riverine assessment point and no decrease in DO levels in Lake Spokane compared to the results for Scenario #1.
Response: See summary response to Part R.
Spokane River / Lake Spokane Dissolved Oxygen Water Quality Improvement Report Page C-127
25. In addition to the above comments, IEP incorporates that critique by reference [HDR review report of Appendix J] and asks that Ecology respond specifically to each and every comment made therein.
Response: The HDR review report of Appendix J (the March 24, 2009 memorandum from Brian Nickel of EPA Region 10 to David Moore of Ecology) makes the following general critiques:
• The facilities selected for analysis in Appendix J are smaller than some “key Spokane River dischargers” such as the City of Spokane, Spokane County, and the City of Coeur d’Alene; may have been operating significantly below their design flow capacity; and do not utilize anaerobic digestion for solids handling.
• “The plants selected in the EPA Memorandum do not have daily effluent phosphorus data for review and analysis. Phosphorus data from the plants analyzed in the EPA Memorandum are (monthly averages calculated) from sampling conducted twice per week, one per week, or at an unknown frequency.”
• Appendix J does not consider the results of pilot testing performed by Spokane River dischargers.
• “The EPA Memorandum offers little insight into factors important in governing how low phosphorus effluent can be accomplished. No new information is provided about treatment technologies or the factors determining effluent performance.”
All of these limitations are acknowledged in Appendix J itself. Specifically, regarding the size of the facilities analyzed and the impact of solids handling, Appendix J states that “the facilities achieving the lowest effluent phosphorus concentrations tend to be relatively small,” and that “larger facilities may face unique challenges. For example, the physical footprint of the scaled-up unit operations may be large. Also, it may be more difficult to maintain optimal operational parameters (e.g. volatile fatty acids, alkalinity, aeration/dissolved oxygen, chemical dosing, management of return streams from solids handling, etc.) at larger facilities” (see Appendix J at Page 3).
Regarding the difference between some of the facilities’ design capacities and their actual flow rates, Appendix J acknowledges that “according to the (Stantec) white paper, (the Iowa Hill, Farmer’s Korner and Snake River WWTPs) are operating at less than half of their design capacities. This may be a factor in these facilities’ good performance.”
Regarding the fact that daily effluent phosphorus data were not available for review and analysis, Appendix J states that:
“The data gathered specifically for this memorandum and analyzed in Part 2, as well as most of the data summarized in other sources referenced herein, are from discharge monitoring reports (DMRs) submitted by NPDES permittees as required by their respective permits…. DMRs provide only a summary of the effluent data collected during a reporting period (typically a calendar month). Typically, a DMR will provide only the average and either the maximum daily or weekly concentration and loading for the month. This makes it difficult to
Spokane River / Lake Spokane Dissolved Oxygen Water Quality Improvement Report Page C-128
determine the variability (e.g. standard deviation) of the effluent data…. Differences in sampling frequency among different facilities may also influence the DMR data” (see Appendix J at Page 3) .
Regarding the fact that Appendix J does not include a discussion of the results of pilot testing performed by Spokane River dischargers, Appendix J states that the memorandum provides a “summary of previous reports and effluent data regarding existing wastewater treatment plants achieving low (≤ 50 μg/L) effluent phosphorus concentrations. This information is intended to be used to estimate the level of phosphorus removal that is currently being attained by processes in use at existing facilities, as a maximum monthly average concentration” (see Appendix J at Page 1, emphasis added). Thus, it was made clear in Appendix J that the memorandum’s purpose was to evaluate the performance of existing facilities, as opposed to pilot studies. However, it is important to note that the average phosphorus concentrations from the City of Coeur d’Alene’s pilot testing (Table 3 of the HDR review report), which range from 19.2 to 39.6 µg/L, are within the range of the average concentrations observed at the facilities discussed in Appendix J, which range from 10 to 46 µg/L (see Appendix J at Table 7). Thus, the Coeur d’Alene pilot study referenced in the HDR review report does not indicate a materially different level of phosphorus removal than is achieved at the facilities described in Appendix J.
Finally, regarding the absence of new information about treatment technologies and “factors important in governing how low effluent phosphorus effluent can be accomplished,” Appendix J states that “this memorandum does not address the cost of attaining low effluent phosphorus concentrations, nor does it discuss the advantages, disadvantages, or design and operational considerations for the various treatment options that exist for achieving low effluent phosphorus concentrations” (see Appendix J at Pages 1-2). As stated on Page 1, this is because Appendix J “does not calculate a technology-based effluent limit for phosphorus.” Appendix J refers the reader to EPA’s Municipal Nutrient Removal Technologies Reference Document for information about specific treatment technologies.
While all of these limitations are expressly acknowledged in Appendix J, EPA and Ecology believe Appendix J nonetheless achieves its stated purpose of providing “a summary of previous reports and effluent data regarding existing wastewater treatment plants achieving low (≤ 50 μg/L) effluent phosphorus concentrations.”
The HDR report also states that Appendix J “suggests using a 95th percentile statistic of effluent performance is appropriate for Spokane River phosphorus discharges.” The HDR report states that, “since effluent limits are low and daily variability in effluent performance will be skewed to higher, rather than lower values, the 95th percentile statistics will be considerably higher than the mean values.” The HDR report suggests that using a longer term seasonal mean or a monthly median value would be more appropriate.
The rationale for the use of the 95th percentile monthly average concentration is explained on Pages 11 and 12 of Appendix J. Appendix J was never intended to “suggest” that wasteload allocations or NPDES permit limits should be expressed using a 95th percentile value or any other statistic. The only statements made in Appendix J regarding the structure of NPDES permit limits are simply references to federal NPDES regulations (specifically 40 CFR
Spokane River / Lake Spokane Dissolved Oxygen Water Quality Improvement Report Page C-129
122.45(d)). The 95th percentile monthly average was chosen strictly as a way of characterizing the facilities’ performance, that is compatible with the way NPDES permit limits must generally be stated, under NPDES regulations (i.e. as “average monthly discharge limitations”).
In fact, the wasteload allocations for Washington point sources and the loading assumptions for Idaho point sources are seasonal average values, which is consistent with the stated preference of the HDR review report (see the draft TMDL at Page 27). Furthermore, Appendix J acknowledges that “in order to consistently achieve low effluent phosphorus limits, the long term average discharge must be considerably less than the monthly average effluent limit.” Finally, while the 95th percentile monthly average phosphorus concentration is emphasized, Appendix J also provides each facility’s minimum, median, average, maximum, and 75th and 90th percentile monthly average phosphorus concentrations, as well as the percentages of the time that monthly average effluent phosphorus concentrations of 10, 20, 30, 40, 50, and 60 µg/L are attained at each facility (see Appendix J at Table 7).
26. Does Ecology agree with the quoted statement by EPA on April 30, 2009 (“the predicted water quality at the riverine location will provide us with information to support our decisions on the proper balance of responsibility between upstream sources and Avista.”)?
Response: Ecology and EPA have strived to develop a TMDL that assigns an equitable distribution of wasteload allocations and assigns a proportionate level of responsibility to Avista. See summary response to Part T related to the nutrient benchmark. Ecology agrees that the use of the riverine assessment point was a logical way to apportion responsibility between the upstream sources and Avista.
27. Why is IEP not afforded the same basis for calculating a mass loading WLA as the City of Spokane and Spokane County?
Response: As explained in the summary response for Part R, Ecology assumed a more frequent sampling schedule for the city of Spokane and Spokane County. This resulted in the different WLAs between IEP and the city of Spokane/Spokane County.
28. Elsewhere in the Draft TMDL, however, the text is confusing and should be clarified. For example, the Draft TMDL, p. 30, refers to a "final wasteload allocation of 36 µg/L" and then refers the reader to Table 4. Table 9 the Draft TMDL also refers to concentrations of total phosphorous as WLAs. The Executive Summary, p. ix, mistakenly refers to 42 µg/L as a "wasteload allocation." The text of the Draft TMDL should be consistent and refer to the lb/day WLAs established in Table 4, such as 17.81 lbs/day total phosphorous for the City of Spokane's wastewater treatment plant and 6.1 lbs/day total phosphorous for the City's point source stormwater discharges to the Spokane River.
Response: Text modifications have been made to these sections to clarify wasteload allocations are based on mass equivalents.
29. The Table 4 [Table 5 in final TMDL] “projected flow rates” include as-yet unauthorized increase in flows at the City of Spokane WWTP and a new discharge permit for the Spokane County. It is improper for the draft TMDL to assign WLA’s for this new loading to the
Spokane River / Lake Spokane Dissolved Oxygen Water Quality Improvement Report Page C-130
Spokane River when the plan itself does not include reasonable assurance that water quality standards can be achieved.
Response: See summary response for Part L.
30. What factors did Ecology use to determine “the proper balance of responsibility”?
Response: This is explained under the “Avista’s Dissolved Oxygen Responsibility” section of the TMDL as well as in Part A of this document.
31. What regulatory standard did Ecology use to determine “the proper balance of responsibility”? Please provide a citation to each and every EPA and Ecology regulation that was relied upon to determine “the proper balance of responsibility”.
Response: Ecology used its best professional judgment to determine a proper balance of responsibility.
32. Did Ecology rely on any manuals, guidance documents or policy statements by EPA or Ecology to determine “the proper balance of responsibility”? If so, please identify the manuals, guidance documents or policy statements.
Response: See responses to comments 30 and 31, Part R.
33. WAC 173-201A-510(5) states that dam operators are obligated to take “reasonable and feasible” actions to improve water quality within an impoundment. Did Ecology rely on this provision of the state water quality standards to determine “the proper balance of responsibility” [for Dischargers]?
Response: Ecology relied on the water quality standards in developing the TMDL, and believes the TMDL is consistent with the water quality standards.
34. How does Ecology define “reasonable” as that term is used in WAC 173-201A510?
Response: The water quality standards do not define the term “reasonable” as it is used in WAC 173-201A-510(5). Ecology exercises best professional judgment in defining the term.
35. How does Ecology define “feasible” as that term is used in WAC 173-201A-510?
Response: The water quality standards do not define the term “feasible” as it is used in WAC 173-201A-510(5). Ecology exercises best professional judgment in defining the term.
36. Is IEP required to take actions that are not “reasonable” as that term is used in WAC 173-210A-510 to improve DO levels in Lake Spokane? Is so, please explain the basis for your answer.
Response: IEP is required to take all actions necessary to comply with water quality standards.
37. Is IEP required to take actions that are not “feasible” as that term is used in WAC 173-201A-510 to improve DO levels in Lake Spokane? If so, please provide a basis for your answer.
Spokane River / Lake Spokane Dissolved Oxygen Water Quality Improvement Report Page C-131
Response: IEP is required to take all actions necessary to comply with water quality standards.
38. Does Ecology disagree with any statement, assumption or conclusion in the HydoQual sensitivity analysis described above and submitted with these comments? If so, please explain the basis for your disagreement.
Response: Ecology does not dispute the technical analysis conducted by HydroQual, Inc. for Inland Empire Paper. However, Ecology disagrees with the interpretive conclusion of the HydroQual document:
HydroQual should not be rounding impacts to the nearest 0.1 mg/l when evaluating whether increases in IEP discharges are relevant, given that the total allowable impact is 0.2 mg/l and this quantity must be divided among all human activities. In the context of this TMDL, an increase in IEP discharges from 36 to 200 µg/l has a relevant impact on dissolved oxygen in Lake Spokane. In the body of the HydroQual document, the maximum impact of the increase is reported at 0.044 mg/l.
See summary response for Part R for discussion of the rationale for the wasteload allocation values.
The HydroQual document also identifies some errors in the model configuration. These errors have been corrected in the final modeling analysis (some are noted in comments elsewhere in this response document). The following errors and discrepancies are resolved:
- error in IEP and Kaiser flows (reversed in the input files)
- discrepancies in scenario assumptions for tributary algae concentrations
- computing discrepancies in the model that affect comparisons between scenario results
39. Ecology has erroneously determined that treatment technology is available to IEP that can achieve a 36 µg/L seasonal average of phosphorus discharges.
Response: See summary response for Part R.
40. Ecology cannot rely on the EPA memorandum attached as Appendix J to conclude that treatment technology can routinely achieve a seasonal average of 36 µg/L.
Response: See summary response for Part R.
Spokane River / Lake Spokane Dissolved Oxygen Water Quality Improvement Report Page C-132
41. IEP objects to the biased use of discharge monitoring data in the 2009 EPA memorandum [Appendix J]. The 2009 memorandum uses data from a 2008 EPA report on nutrient removal technologies but relies on just three facilities out of 29 full-scale treatment plants. The three plants selected are among the three smallest plants evaluated in the 2008 report and are not representative of the flows or configurations of the plants operating in the Spokane River basin.
Response: See summary response for Part R.
42. Does Ecology believe that it is feasible for IEP to achieve a seasonal average of 36 µg/L and maximum monthly average of 50 µg/L for TP?
Response: IEP is required to take all actions necessary to comply with water quality standards, and Ecology believes it is feasible for IEP to do so.
43. What information did Ecology rely upon to answer the preceding question?
Response: This question is not a comment on the draft TMDL.
44. Does Ecology think it is reasonable to expect IEP to achieve 36 µg/L as a seasonal average and 50 µg/L as a maximum monthly average for TP?
Response: IEP is required to take all actions necessary to comply with water quality standards, and Ecology thinks it is reasonable to expect IEP to do so.
45. What information did Ecology rely upon to answer the preceding question?
Response: This is not a comment on the draft TMDL.
46. Does Ecology disagree with the conclusions of the IEP pilot study? If so, why?
Response: See summary response for Part R.
47. What specific technology is available to IEP to achieve a 36 µg/L WLA?
Response: See summary response for Part R.
48. Please identify each and every pulp and paper mill with processes similar to IEP’s that can achieve a seasonal average of 36 µg/L.
Response: Ecology has not evaluated pulp and paper mills with processes similar to IEP’s to determine what effluent limits those mills can achieve.
49. Has Ecology independently reviewed the 2007 report authored by Dave Ragsdale?
Response: This question is not a comment on the draft TMDL.
50. Was Ken Merrill specifically authorized by Ecology to consult with Dave Ragsdale regarding this report?
Response: This question is not a comment on the draft TMDL.
Spokane River / Lake Spokane Dissolved Oxygen Water Quality Improvement Report Page C-133
51. Did Ecology ever advise IEP that the Ragsdale report was being prepared?
Response: This question is not a comment on the draft TMDL.
52. Does Ecology think it is appropriate to rely on data from the three small WWTPs for the conclusions in the Ragsdale report?
Response: This question is not a comment on the draft TMDL.
53. Has the Ragsdale report been subject to peer review? If so, when was that done and who participated in the review?
Response: This question is not a comment on the draft TMDL.
54. Why did Ecology include Appendix J in the Draft TMDL?
Response: See summary response for Part R.
55. How much time did Brian Nickel spend drafting Appendix J?
Response: This question is not a comment on the draft TMDL.
56. Did Ecology determine IEP can achieve 36 µg/L for TP based on a letter from Veolia’s Vice President for Business Development, Appendix J, at 2 n. 4?
Response: No.
57. Does Ecology agree that data from pilot studies are not useful in determining treatment capabilities as stated in Appendix J?
Response: Data from pilot studies can be useful in determining treatment capabilities.
58. Has Ecology made any effort to determine the similarity between any facility described in Appendix J and IEP?
Response: Yes.
59. What factors are important in determining the capability of technology to achieve low effluent phosphorus?
Response: See summary response to Part R.
60. Did Ecology use the results from local pilot testing to determine that IEP can achieve a WLA of 36 µg/L for TP? If so, please describe how Ecology used the results from local pilot testing.
Response: See summary response to Part R.
61. Please explain how results from treatment technology performance installed at municipal WWTPs can be translated to pulp and paper mill [IEP] applications.
Response: Results from treatment technology performance installed at municipal WWTP’s may or may not be translated to pulp and paper mill applications.
Spokane River / Lake Spokane Dissolved Oxygen Water Quality Improvement Report Page C-134
62. Please describe each and every technology discussed in Appendix J that has been applied at facilities similar to IEP.
Response: See summary response to Part R.
63. Why did Ecology abandon its commitment to the 2007 Memorandum of Agreement regarding “technical selection protocol” as set forth in Appendix D, at D-9 in the Draft TMDL?
Response: See summary response to Part R.
64. Why did Ecology reject the conclusions of the Collaborative Process Technical Working Group in establishing the wasteload allocations for dischargers?
Response: See summary response to Part R.
65. The memorandum attached as Appendix L to the draft permit sets forth several statements regarding the limitation of data evaluation. Does Ecology disagree with any of the statements? If so, please state the basis for such disagreement.
Response: Draft permits were not included in the TMDL comment period and do not pertain to this TMDL document.
66. Does Ecology believe that it is possible to provide accurate, consistent and reliable measurements for total phosphorus at levels below 50 µg/L? If so, please provide supporting data and describe the test methods and equipment available to make such measurements.
Response: Accurate, consistent and reliable measurements for total phosphorous at levels below 50 µg/L is possible.
67. Ecology has arbitrarily and capriciously imposed a 36 µg/L seasonal average on IEP in Scenario #1 for the water quality modeling.
Response: See summary response to Part R.
68. It was understood earlier this year that IEP should not be treated the same as the POTWs in the TMDL modeling assumption. The modeling assumptions under Scenario #1 originally retained a 50 µg/L seasonal average for IEP while the municipalities were assumed to be able to treat to a monthly maximum of 50 µg/L.22 In May of this year IEP confirmed with both Ecology and EPA that this would be the modeling assumption for Scenario #1.23 Please respond to the foregoing comments and provide an explanation as to why Ecology changed the assumption for IEP.
Response: See summary response to Part R (regarding equitability) and response to comment number 26, Part R and response to comment number 27, Part G.
69. The water quality model and waste load allocations to IEP are not equitable.
Response: See summary response to Part R.
Spokane River / Lake Spokane Dissolved Oxygen Water Quality Improvement Report Page C-135
70. IEP fully supports the flexible approaches to TMDL implementation that are available for the City of Spokane, Spokane County and the dam operator. IEP requests similar flexibility by adjusting its WLA to what is achievable at its facility.
Response: Ecology interprets this statement to mean IEP does not believe it has the option to pursue target pursuit actions. Ecology disagrees. See response to comment number 19, Part N.
71. Because the TMDL does not demonstrate with reasonable assurance that water quality standards can be met through load reductions in the tributaries and through Avista’s “responsibility,” the WLAs assigned to the dischargers must be based on water quality-based limitations, not treatment technology capabilities (which are underestimated in the draft TMDL). The assignment of WLAs for projected (year 2027) flows and for a new county treatment plant is illegal.
Response: See summary response for Part Q (tributary load allocations) and summary response to Part L (Spokane County new discharge). Ecology believes there is reasonable assurance that implementation of this TMDL will result in compliance with water quality standards.
72. Per Appendix J (EPA memo re treatment technology) facilities around the country are routinely achieving phosphorus effluent reductions substantially lower than the target 50 μg/l called for in this TMDL. As App. J notes, a number of these facilities are not required to achieve lower P limits and could possibly do better if such were required in the NPDES permits.
Response: See summary response for Part R.
73. IEP objects to cursory dismissal of the Collaborative Process Technology Work Group in the 2009 memorandum [Appendix J]. The recommendations of the work group were the result of considerable efforts by professionals responsible for designing and operating water quality treatment plants.
Response: See summary response for Part R. The work of this group was not dismissed.
74. As part of the Collaborative Process, IEP conducted pilot testing of numerous state-of-the-art tertiary treatment technologies at its facility. The results of that testing demonstrated that IEP, with aggressive application of treatment technology and management, could achieve an average effluent level for total phosphorus between 70 and 100 µg/L
Response: See summary response to Part R. Like other dischargers, IEP will have the ability to pursue target pursuit actions (delta management) to address the difference between IEP’s WLA and the technology IEP implements at its facility.
75. Why does the TMDL establish a 10-year schedule to implement the TMDL when state law allows up to 20 years for implementing the TMDL? When does Ecology intend to adopt a regulation consistent with the legislation?
Response: See summary response for Part O.
Spokane River / Lake Spokane Dissolved Oxygen Water Quality Improvement Report Page C-136
76. The model runs of the Idaho discharges at 50 µg/L (scenario #2) and 100 µg/L (discharger model runs) show very small increases in the dissolved oxygen deficits in Lake Spokane Reservoir. Permitted effluent limits based on 70 µg/L to 100 µg/L for TP would be much more achievable based on the current phosphorus control technology and would provide a greater degree of certainty that facilities constructed over the next seven (7) years will comply with the permit limits and waste load allocations.
Response: See summary response for Part R related to equitability between the dischargers and Avista. Also see summary responses to Part G and K.
77. The Water Quality Improvement Plan should not contain language that might be misconstrued as requiring that permit limitations be established in a certain way. In the second paragraph on page 27, the document does a good job of acknowledging that permit writers have flexibility in establishing permit limits based on facility specifics. However, in two other places, the document appears to dictate limitation related requirements. In the third paragraph on page 27, the last sentence specifies how permits will demonstrate compliance with the waste load allocations. In the third paragraph on page 56, the last sentence specifies an effluent limitation.
Response: See summary response for Part R related to permit development.
78. In Appendix E of the TMDL, the term "limit of technology" is used to describe how the effluent limits were established in developing the modeling scenarios. The TMDL does not provide any details on what constitutes the limit of technology. A definition should be provided that is consistent with the delta management strategy discussed in the MIP section.
Response: See summary response for Part R.
79. In the section on Load and Wasteload Allocations, Ecology shows equation #1 to describe how waste load allocations are calculated from an effluent concentration. Table 4 lists the effluent concentrations for each point source which were derived from Scenario #1. The TMDL and the modeling report by PSU referenced in the TMDL do not adequately describe the differences between the permit limits and the modeling limits and why Ecology chose to use the lower effluent limits versus the maximum monthly averages to calculate the waste load allocation.
Response: See summary response for Part R regarding permit limits versus wasteload allocations. Wasteload allocations and permit limits may be expressed differently (monthly vs. seasonal averages) but remain equivalent.
80. The 2004 and 2007 documents compared current and proposed in the same chart, and included both Washington and Idaho sources, we would like to see this in the 2009 document, and an explanation of any differences in current and proposed loading from the 2004 document.
Response: The 2009 TMDL includes all the relevant information needed to understand how point sources are addressed and how the point source requirements fit into the plan to achieve water quality standards. The previous table showing point source information did not list the current flows and pollutant concentrations. In response to this comment, this information was added in the final Table 3.
Spokane River / Lake Spokane Dissolved Oxygen Water Quality Improvement Report Page C-137
81. The chart below [in Lands Council’s letter], which was developed during the Foundational Concepts indicates a very different set of waste load allocations (WLA) than Table 4 in the 2009 draft TMDL, there needs to be an explanation about this, since it appears as though the City is now given a WLA of 17.81 pounds per day vs. the target level of 3.40 in 2007.
Response: This is mostly the result of two changes to the approach in this version of the TMDL; the incorporation of Avista’s dissolved oxygen responsibility, and a cumulative analysis that equitably distributes the wasteload across all dischargers in both states.
82. Monthly and weekly maximum permit limits are impracticable.
Response: See summary response to Part R.
83. The TMDL is based on “specific assumptions” about permit limits for Washington and Idaho dischargers. Ecology should acknowledge that it is impracticable to convert seasonal average allocations to monthly and weekly permit limits. Ecology has in fact made this determination with respect to Washington dischargers and the response to these comments should explain its rationale for this decision and acknowledge that the same rationale applies to Idaho facilities.
Response: See summary response to Part R.
84. Ecology should acknowledge that the basis for the TMDL allocations to dischargers is not based on achieving a specific water quality standard but on assumptions about the capabilities of phosphorus removal technology and the availability of effluent offset credits.
Response: See summary response to Part R. Ecology disagrees with this comment. The TMDL is based on achieving water quality standards, and relies on a combination of phosphorus removal technology, offset credits and non-point source reductions to achieve this objective.
85. Please confirm that the “very specific assumptions” [page 29 draft TMDL] described in this statement are the modeling assumptions used by Portland State University (PSU) to develop the water quality modeling described in the Draft TMDL.
Response: See summary responses for Parts G and R.
86. Ecology should explain its basis for assuming in Table 2 of the PSU Report that Coeur d’Alene cannot achieve a monthly TP average of 36 µg/L.
Response: See summary responses for Parts G and R.
87. Ecology should acknowledge that it is not aware of any technology that would enable Coeur d’Alene to achieve a seasonal TP average of 36 µg/L. If Ecology does not acknowledge this, then Ecology should in response to these comments identify the specific treatment technologies that are available to Coeur d’Alene, other facilities that have installed the treatment technology, the expected treatment capacity of the technology and any data that confirms the assumptions Ecology has made about the treatment technology. To the extent Ecology is not able to provide such information, Coeur d’Alene will assume that the “specific assumptions” are
Spokane River / Lake Spokane Dissolved Oxygen Water Quality Improvement Report Page C-138
simply arbitrary and capricious numbers selected by Ecology and EPA staff for water quality modeling.
Response: According to Section 2.6.3 of EPA’s Municipal Nutrient Removal Technologies Reference Document (Reference Document), “special filters have proved effective in achieving low concentrations below 0.03 mg/L. They include the Trident filter from U.S. Filter, the Dynasand D2 advanced filtration system from Parkson, and membrane filtration processes from various manufacturers.”
Specifically, the Reference Document states on Page 2-43 that “(a membrane bioreactor) facility at Lone Tree Creek, Colorado, achieves an annual average of 0.027 mg/L.” The Reference Document states on Page 2-71 that “the Pinery Water plant removes phosphorus biologically in the five-stage Bardenpho process, which is followed by a clarification and filtration process called Trident, manufactured by U.S. Filter. The Trident process involves tube clarification, adsorption clarification, and multimedia filtration. Alum is fed upstream of the tube clarifier to promote flocculation. The plant meets a monthly average permit limit of 0.05 mg/L.” The Reference Document also states on Page 2-71 that “the Iowa Hill Water Reclamation Facility achieves low effluent phosphorus concentrations, beginning with an anaerobic selector upstream of the activated-sludge process. A (biological aerated filter) follows. Then the wastewater enters a high-rate solids contact clarifier known as the Densadeg process, manufactured by Infilco-Degremont. The process involves flocculation and plate settling. The sand is recycled and reused in the flocculation process. The wastewater then passes through a Dynasand filter, manufactured by Parkson.” The Stamford and Walton WWTPs described in Appendix J also use two-stage Parkson Dynasand filters (see Advanced Wastewater Treatment to Achieve Low Concentration of Phosphorus, EPA Region 10 2007, at Pages 35 and 40-41).
Some other facilities described in Appendix J that achieve low effluent phosphorus concentrations use tertiary clarification and multimedia filters (Stonegate Village Metro District, Parker Water and Sanitation District, Summit County Snake River, and Farmer’s Korner) or microfiltration (Grand Gorge, see EPA Region 10 2007 at Page 8). Effluent data for all of the plants mentioned above, except Iowa Hill, are summarized in Appendix J. As stated in Table 6 of Appendix J, the maximum monthly average phosphorus concentration at the Iowa Hill facility, as provided by various sources, is between 16 and 32 µg/L (0.016 – 0.032 mg/L).
See also the summary responses for Parts G and R.
88. Ecology should explain in response to these comments why this information [EPA Region 10 letter, dated September 27, 2007 – Exhibit 1 of City of Coeur d’Alene letter] does not justify revising the “very specific assumptions” about Coeur d’Alene’s anticipated permit limits.
Response: See summary responses for Parts G and R.
89. It is simply too soon for any qualified engineer to assert that 36 µg/L is an attainable seasonal average for Coeur d’Alene [referring to Appendix J]. Would Ecology ever accept a memorandum such as Appendix J as adequate AKART analysis under its permitting regulations?
Spokane River / Lake Spokane Dissolved Oxygen Water Quality Improvement Report Page C-139
Response: State law (Chapter 90.48.010 RCW) requires the use of all know available and reasonable methods of prevention, control and treatment (AKART) for discharges into waters of the state.
For a particular discharge, the information in Appendix J could be used as part of an AKART analysis. However, an AKART analysis would typically contain much more detail for the specific wastewater and treatment process. These details would include, among other items, the type of treatment process proposed, the degree of treatment required, discussion of the alternatives evaluated, the basic design data and sizing calculations of each unit of the treatment works, expected efficiencies of each unit and also of the entire plant, etc.
90. In your response to these comments, please specifically explain whether you agree or disagree with the concerns raised in the HDR document [Exhibit 2 of City of Coeur d’Alene letter]. If you do not specifically respond to the HDR critique, Coeur d’Alene will assume that Ecology agrees with analysis by HDR as to the inadequacies of Appendix J.
Response: See response to comment number 25 for Part R.
91. That memorandum [Appendix L of TMDL] sets forth specific conclusions about the limitations of data and additional evaluation of data. In your response to comments specifically state for each comment whether you agree or disagree with the statements. If Ecology does not respond specifically to each statement in Appendix L, Coeur d’Alene will assume that Ecology agrees with the statements made in the memorandum.
Response: Ecology assumes that by "specific conclusions about the limitations of data and additional evaluation of data" in Appendix L, the commenter is referring to item numbers 1 and 2, on the first, second and third pages of Appendix L, under the headings "Limitations of the Data" and "Additional Evaluation of the Data." In general, Ecology believes the statements made in these sections remain valid, with the following exceptions.
Ecology and EPA no longer agree with item "f" under "Limitations of the Data," which states that "(t)he 50 ug/L value is simply a reasonably predictable concentration and 'place holder' for TMDL evaluation at this time." While that was likely a reasonable statement at the time, as shown in Appendix J and in EPA's Municipal Nutrient Removal Technologies Reference Document (EPA 832-R-08-006) a limited number of existing wastewater treatment plants using available treatment technology do, in fact, reduce effluent phosphorus concentrations to 50 µg/L or lower. Pilot studies at the city of Spokane are posing questions about implementation and reasonableness.
Item "l" under "Limitations of the Data" states that the data and the 50 ug/L suggestion "should be utilized to preliminarily estimate phosphorus loading (pounds) only, and not to establish permit limits. Permit limits for effluent total phosphorus should be established only after completion of much more detailed and substantive study of applicable data and other considerations, including pilot testing." EPA agrees that permit limits should not be based directly upon Appendix L. Rather, NPDES permit limits must be based on the wasteload allocations in an approved TMDL (40 CFR 122.44(d)(1)(vii)(B)).
Spokane River / Lake Spokane Dissolved Oxygen Water Quality Improvement Report Page C-140
Ecology agrees that, as of September 2005, when Appendix L was written, more pilot testing was needed to determine achievable TP concentrations (see items "k" and "l" under "Limitations of the Data" and item "e" under "Additional Evaluation of the Data"). While yet more pilot testing may be needed, it is important to note that, since 2005, Spokane River dischargers have been designing and conducting total phosphorus removal pilot studies of increasing complexity.
92. The plan substantially increases the amount of pollution that the City and the County may put into the River.
Response: The TMDL does not allow for an increase in the amount of nutrient pollution. Rather, it reduces the current nutrient pollution load by upwards of 90 percent during the critical summer season.
93. In response to these comments Ecology should explain why it has proposed to base allocations on assumed capabilities of technology as opposed to any application of the state water quality criteria.
Response: See summary response for Part R. Wasteload allocations are not based entirely on technological capabilities and are only slightly higher than previous TMDL versions (which were set at background water quality) due to the incorporation of Avista’s dissolved oxygen responsibility.
Spokane River / Lake Spokane Dissolved Oxygen Water Quality Improvement Report Page C-141
S. Water Quality Monitoring Summary: Ecology needs to provide more water quality monitoring on the Spokane River and Lake Spokane, especially for algae in Lake Spokane, where toxic blooms continue to occur.
Summary Response: See the Managed Implementation Plan section of the TMDL, specifically the Monitoring Progress section for a description of the water quality monitoring that has been and will continue to be conducted on the Spokane River. Algae monitoring is not conducted by Ecology due to the fact that sampling algae blooms for potential toxicity in all lakes is resource-intensive and is mostly the responsibility of state and local health departments. However, Avista and Ecology will work on an algae monitoring plan to coincide with the regular monitoring activities.
Ecology shares the concerns related to toxic algae blooms. It’s important to realize, however, that reducing these blooms will not only require significant investments by upstream sources and Avista, but will also require lakeshore owners to adopt better practices related to landscaping, septic system maintenance, and water conservation.
1. Ecology must require of itself and the dischargers to closely monitor how pollutants in the river risk public and environmental health.
Response: See summary response for Part S. Monitoring is also required of dischargers as a condition of their permit.
2. And finally, water quality monitoring is essential. Lake Spokane resident Scott Chaney watched a toxic algae bloom into a monster. He called the Department of Ecology and Department of Health, but no agency would claim responsibility for monitoring where the water quality problems might harm the public…Ecology must require of itself and the dischargers to closely monitor how pollutants in the river risk public and environmental health.
Response: See summary response for Part S.
3. Implementation of the Spokane River TMDL calls for reductions in phosphorus, carbonaceous biological oxygen demand (CBOD) and ammonia (NH3) to meet WLAs by 2019. Monitoring is slated for 2019 to detect a response in Lake Spokane Reservoir that is manifested by increased DO. Adaptive Management is identified in the TMDL to refine load allocations based on monitoring that would occur within 10 years of the TMDL development (not approval of the TMDL, or completion of TMDL implementation). This response, i.e. increased dissolved oxygen, is not likely to be detected due to the continued impact of nutrients stored in sediments. It is possible that nutrient reductions prescribed in the TMDL or through implementation monitoring could be masked by persistent sediment oxygen demand that would result in future prescribed nutrient reductions beyond reasonable WLA capabilities and economic feasibility.
Response: See summary response for Part S. Monitoring will be conducted on a more frequent basis than just once near the end of ten years. The ten-year assessment will assess all the monitoring data that has been collected in the intervening ten years. Sediment oxygen
Spokane River / Lake Spokane Dissolved Oxygen Water Quality Improvement Report Page C-142
demand is one study that the dischargers and Avista can pursue through implementation to provide better understanding of that process by the ten-year assessment.
4. It's up to Ecology to monitor the water quality, especially if they have the potential to harm the public. The polluters and the DOE need to legally monitor the pollutants in the river. Monitoring a plan to see if it works is just good science. Not requiring that is like the FDA just approving some new medication without any drug trials simply based on the assurances of the company who is making the drugs.
Response: See summary response for Part S.
Spokane River / Lake Spokane Dissolved Oxygen Water Quality Improvement Report Page C-143
T. Water Quality Standards Summary: Washington’s water quality standards for dissolved oxygen in Lake Spokane are not appropriate as applied to Lake Spokane, which is not a natural lake but a reservoir. In addition, the standards are too stringent, will be impossible to meet, and are unfair to Idaho. There is no evidence to show what the beneficial uses are (salmonid fish species mainly) that would be improved upon improved dissolved oxygen. Therefore, the water quality standards for Lake Spokane should be changed through a Use Attainability Analysis (UAA).
Comments also claim that a new phosphorus standard is being imposed on Lake Spokane without the appropriate rule-making based on EPA eco-region criteria guidance for nutrients in streams and rivers.
Summary Response: Some comments reflect confusion over the dissolved oxygen standard for Lake Spokane. Some commenters misinterpret the standard that says there can be no greater than a 0.2 decrease in dissolved oxygen from natural conditions as a 0.2 mg/L absolute standard. The dissolved oxygen standard for lakes is complicated due to the fact that lakes stratify and dissolved oxygen naturally decreases as the depth increases. Therefore, the criterion varies with depth (depending on the natural condition of the lake) and there is no singular numeric criterion for Lake Spokane, unlike the river mainstem (8 mg/L or 9.5 mg/L, the dissolved oxygen criterion for the Spokane River). The dissolved oxygen criterion for Lake Spokane can be no lower than 0.2 mg/L below natural background conditions. The background condition for this TMDL was calculated by modeling the No Source scenario. The TMDL goal is to be within 0.2 mg/L of the No Source scenario within ten years, based on the allowable compliance schedules in the state’s water quality standards. This is explained in the footnote for Table 2 Baseline Conditions section of the TMDL. Clarification has been added to Figure 2 in this regard.
Use Attainability Analysis A use attainability analysis (UAA) is an assessment of existing, attainable, and unattainable uses for a waterbody. Because this assessment is for a waterbody, it would need to include ALL sources to the lake including Avista, non-point sources, and the Washington and Idaho NPDES dischargers. Because the UAA process uses rigorous economic tests to determine attainability of use, the actions currently planned to meet the TMDL targets would still be required to be factored into any use change, and most likely additional actions could be required. If it appears that standards cannot be met within the timeframes set under NPDES permits and FERC licenses with compliance schedules, then Ecology may consider leading a UAA in the future. In the interim any party can submit a UAA to Ecology if they feel they have sufficient data and information to warrant a UAA analysis ahead of the process.
At present, the designated uses and dissolved oxygen criteria for Lake Spokane have not been determined to be unattainable. Ecology has gathered a summary of fish surveys for Lake Spokane and has determined that while it has not been specifically studied by the Washington Department of Fish and Wildlife (WDFW), which is the responsible agency for this type of study, salmonid species do exist in Lake Spokane and according to WDFW, salmonid habitat would be improved with better dissolved oxygen. Ecology strongly recommends that any party wishing to undertake a UAA coordinate with Ecology and the EPA as early as possible in the process to determine information needs and avoid wasted resources by the UAA proponent.
Spokane River / Lake Spokane Dissolved Oxygen Water Quality Improvement Report Page C-144
Because uses changes must be approved through both formal rule-making at the state level and Clean Water Act approval by EPA, it is important that the UAA analysis provide adequate data and information needed to support the use change being proposed.
Ecoregion Nutrient Criteria / Nutrient Benchmark Ecology provided an interpretation of its water quality standards as applied to Lake Spokane in Appendix I. As stated in the Avista’s Dissolved Oxygen Responsibility section of the TMDL and in the summary response to Part A, the ecoregional criteria is used to quantify Long Lake Dam’s contribution to impairments in Long Lake because it represents riverine conditions minimally impacted by human activities. The ecoregional criteria do not establish a new total phosphorus standard in the TMDL.
Please see the response to Part G for Idaho modeling assumptions and NPDES permits.
1. The model does not focus on “dominant aquatic habitat” of the Lake, as required by Ecology’s regulations. Ecology’s regulations [WAC 173-201A-200(1)(d)(iv)] require that DO levels be measured in the dominant aquatic habitat of the water body. However, the draft DO TMDL makes no mention of the dominant aquatic habitat of Lake Spokane. More importantly, the monitoring points identified in the draft DO TMDL do not, in fact, represent the dominant aquatic habitat of the lake.
Response: The water quality standards referenced in this comment apply to sample collection and not to how a water body should be modeled. The water quality model used to examine the natural conditions in Lake Spokane assesses stratification. In doing so the dominant bodies of water within the lake are each examined. This approach allows all aquatic habitats (those habitats supporting fish and other aquatic biota) to be examined and used in compliance assessment. Avista, in developing its water quality attainment plan, can focus on what it perceives to be the dominant aquatic habitat (choosing a representative species, for example) where dissolved oxygen improvements will have the greatest impact in protecting that critical species or set of species.
2. The current water quality standard for phosphorus in the Long Lake reach of the Spokane River fits within EPA's range at a maximum concentration of 25 mg/L from June 1 to October 31. Ecology's institution of a lower amount in effect creates a new water quality standard that, instead of being applied state-wide, applies to one discretionary location on one river. Ecology lacks the legal authority to set such a benchmark. If Ecology wants this level of clean water, it can do so, it just has to bear that burden throughout Washington and not just pick a location that has the effect of disproportionately burdening Idaho. It also needs to do so through the rulemaking process, not through unilaterally drafting a few paragraphs in a TMDL document.
Response: See summary responses for Part T and Part A related to riverine assessment point.
3. All efforts at restoration of water quality and habitat in the Spokane should recognize that, despite any applicable legal standard of "natural conditions," the Spokane did historically support an assemblage of native cold-water fish and invertebrates. Current conditions throughout the Spokane are altered from natural.
Spokane River / Lake Spokane Dissolved Oxygen Water Quality Improvement Report Page C-145
Response: Comment noted.
4. Page 24, last paragraph – It is unlikely that Long Lake reservoir has ever been, or could be expected to be lower mesotrophic or oligotrophic in character on a year round basis. It is highly doubtful that it will achieve this character even if all phosphorus is eliminated in discharges, and reduced by the assumed amounts of the TMDL in other tributary waters. It should not be implied that this could happen, as it merely misleads the public into believing in the unattainable.
Response: See summary response for Part T. Modeling shows that a critical season average concentration of 10 µg/L total phosphorus would exist in the reservoir with attainment of wasteload and load allocations. Ecology would be interested in reviewing additional analysis in support of this comment.
5. Washington State has not developed numeric nutrient water quality standards, and eco-region guidance criteria falls on the boundary of two subregions requiring interpretation and rulemaking for proper application.
Response: See summary responses for Part A and T related to riverine assessment point.
6. [From page 1] A TMDL is a numerical value representing the highest pollutant load a surface water body can receive and still meet water quality standards. Any amount of pollution over the TMDL level needs to be reduced or eliminated to achieve the water quality standard." In the second sentence, "reduced or" should be deleted.
Response: This sentence is a general statement for all TMDLs and refers to more than one type of pollution. Some forms of pollution (namely nutrients) cannot be eliminated entirely so they need to be reduced to a level that brings the water body into compliance with water quality standards. Others, such as toxics, may need to be eliminated entirely.
7. [from pages 7-8] DO concentrations may not decrease "more than .2 mg/L below estimated natural conditions." Then again, on Page 8 Table 2 "No measurable (0.2mg/L decrease from natural conditions." However, nowhere in this DO TMDL is the estimated natural condition clearly stated. On Page 16, the Draft TMDL states, "The dissolved oxygen water quality standard for Lake Spokane is the No Source scenario minus 0.2mg/l." Then on Pages 22-23, Ecology provides a chart that hints at what the standard will be at the various depths. However, nowhere is the numeric goal and sampling location clearly stated. Ecology should insert into either Table 2 the numeric value of the estimated natural condition and where that numeric value applies, or create a new Table that explicitly states, the DO standard for Lake Spokane is X at this location. This would allow all parties involved to know the numeric goal for Lake Spokane. In addition, it will allow interested parties to determine if actions are successful.
Response: See summary response for Part T.
8. As the water quality improvement plan is implemented, and to prepare for the 10 year review, it will be important to better understand the beneficial uses and dominant aquatic habitat in Lake Spokane. This improved understanding will be critical to accurately assess the effects of actions taken to improve water quality in Lake Spokane by reducing point and non-point
Spokane River / Lake Spokane Dissolved Oxygen Water Quality Improvement Report Page C-146
source phosphorus.
Response: Ecology agrees. Requirements leading from the TMDL should include assessment of the lake’s biota.
9. The issue is Lake Spokane and the Washington State DOE blanket standard for having a 0.2 milligram per liter DO delta from a theoretical pre manned condition throughout the entire lake on a year-round basis. Every first year ecology student learns that in a lake where it develops a thermocline and stratifies temperature-wise in the summer, that the hypolimnion or the bottom part of the lake will have zero DO [dissolved oxygen]. Nothing goes down there. There's no DO.
Response: The water quality standard for Lake Spokane shifts with the natural decline in dissolved oxygen (see summary response to Part T). The model used to estimate natural conditions accounts for stratification and lower dissolved oxygen levels at depth. The modeling shows that the depth of supportable dissolved oxygen levels for salmonids would be increased by 15 meters during selected parts of the critical season upon attainment of the wasteload and load allocations.
10. Plus, at the end of doing all of that money and spending all of that, we will still not meet the DOE standard based upon the TMDL model.
Response: See summary response to Part T. Attainment of the wasteload and load allocations and Avista dissolved oxygen responsibility will result in meeting state water quality standards.
11. The DOE [should] lead a task force of stakeholders to do a site specific beneficial use analysis of Lake Spokane and identify those specific uses and the criteria and standards necessary to protect those uses. Basically, why the Clean Water Act was enacted. Have the science of Lake Spokane set the standards.
Response: The assessment being suggested in this comment appears to be a use attainability analysis (UAA). See summary response to Part T.
12. The TMDL model indicates that if all the dischargers did not put a zero amount of phosphorous in the river, the DOE standard of 0.2 milligrams per liter would still not be met.
Response: See summary response to Part T with regards to misinterpretation of water quality standard and response to comment numbers 9 and 10, Part T.
13. By running a Lake Spokane site specific standard, we can set the appropriate standard for the lake and also the treatment facilities. The treatment facilities at the tertiary standard and low phosphorous levels say at about .02 milligrams per liter is a reasonable goal in both capital cost and operational cost with a tremendous improvement on the water both at the river and at the lake.
Response: Ecology interprets this statement as referring to a UAA (a Lake Spokane-specific dissolved oxygen criterion developed to fully protect any new use developed from a UAA).
Spokane River / Lake Spokane Dissolved Oxygen Water Quality Improvement Report Page C-147
See summary response to Part T related to a UAA and the summary response to Part R related to wasteload allocations.
14. Well, what we're shooting for is 0.2 milligrams per liter dissolved oxygen, which is immeasurable…
Response: See summary response to Part T related to misinterpretation of the Lake Spokane dissolved oxygen standard. The resolution of the reporting limit for the methods most frequently used to measure dissolved oxygen are 0.1 mg/L. (Swanson, T., 2007. Standard Operating Procedure (SOP) for Hydrolab® DataSonde® and MiniSonde® Multiprobes, Version 1.0. Washington State Department of Ecology, Olympia, WA. SOP Number EAP033. www.ecy.wa.gov/programs/eap/quality.html)
15. Lake Spokane is a reservoir and not a natural lake. In a free flowing river, without the presence of the Long Lake Dam, the impacts from dischargers including IEP would not cause a violation of the dissolved oxygen criteria.
Response: This comment does not take into account the fact that the Spokane Tribe of Indians has water quality standards for the Spokane Arm, immediately downstream of Lake Spokane. If standards were not violated in a free-flowing river, they would surely be violated in the Spokane Arm.
16. Does Ecology agree that the Spokane River at Nine Mile Bridge is in a transitional area between Western Mountain and Xeric West aggregate nutrient regions?
Response: See summary responses for Part A and T related to use of the riverine assessment point.
17. If so, does Ecology agree that the applicable criteria using the EPA document should also be transitional?
Response: See summary responses to Part A and T related to use of the riverine assessment point.
18. Does Ecology agree with EPA that caution should be used in relying on reference conditions to derive nutrient criteria?
Response: Ecology agrees with this comment. If phosphorus criteria are ever developed for the river, other factors in addition to reference conditions would be evaluated.
19. Does Ecology agree that a weight of evidence approach should be used which addresses all key elements to derive a site specific criteria? Did Ecology do that for the Draft TMDL?
Response: A weight-of-evidence approach is not used to develop site-specific standards, although the concept could possibly be used when select data are evaluated. Specific guidance is provided by EPA on how to develop site specific criteria. (EPA Water Quality Standards Handbook, Second edition). None of the EPA methods fit the Lake Spokane situation. Ecology has not developed a site-specific criterion for Lake Spokane. If a site-specific criterion is developed at some point in the future it must be adopted into the state
Spokane River / Lake Spokane Dissolved Oxygen Water Quality Improvement Report Page C-148
water quality standards via formal rule-making and given CWA approval by the USEPA before it could be used.
20. Did Ecology analyze the database EPA used to develop the eco-region criteria? Did Ecology determine that the data was not biased? Did Ecology determine whether the data was randomly sampled?
Response: See summary response to Part T related to use of the riverine assessment point. Ecology determined that EPA’s eco-region criteria was an appropriate way to quantify Long Lake Dam’s contribution to impairments in Lake Spokane.
21. Did Ecology determine whether the data used by EPA included values that were below detection limits?
Response: See summary response to Part T related to use of riverine assessment point. Ecology determined that EPA’s eco-region criteria was an appropriate way to quantify Long Lake Dam’s contribution to impairments in Lake Spokane.
22. Did Ecology evaluate any peer review of the EPA document?
Response: No.
23. Does Ecology agree with the frequency distribution approach in the EPA document?
Response: See summary response to Part T related to use of riverine assessment point. Ecology agrees that EPA’s eco-region criteria was an appropriate way to quantify Long Lake Dam’s contribution to impairments in Lake Spokane.
24. Has Ecology ever provided public notice that it was adopting the EPA eco-region criteria?
Response: See summary response to Part T related to use of riverine assessment point. Ecology has not “adopted” EPA’s eco-regional criteria as a criterion in the river. Instead the 10 µg/L concentration is an estimate of typically occurring natural concentrations that are used in the TMDL to help determine a reasonable division of responsibility for dissolved oxygen impairments in Long Lake. Ecology has provided public notice of its limited use of EPA’s eco-region criteria to help determine a reasonable division of responsibility for dissolved oxygen impairments in Lake Spokane.
25. What independent analysis, if any, has Ecology performed on the EPA documents?
Response: See summary response to Part T related to use of riverine assessment point.
26. Does Ecology believe it is appropriate to apply Oligiotrophic Lake criteria to a non-Oligiotrophic riverine assessment point? And if so, why?
Response: Ecology has not used the EPA documentation as a criterion in the river. Instead the 10 µg/L total phosphors is an estimate of typically occurring natural concentrations that are used in the TMDL to help determine a reasonable division of responsibility for dissolved oxygen impairments in Lake Spokane. Ecology believes this is an appropriate way to help
Spokane River / Lake Spokane Dissolved Oxygen Water Quality Improvement Report Page C-149
determine a reasonable division of responsibility for dissolved oxygen impairments in Lake Spokane.
27. Does Ecology agree that Lake Spokane is a man-made reservoir?
Response: Yes. See Appendix I of TMDL.
28. Does Ecology agree that Lake Spokane thermally stratifies during the late summer months?
Response: Yes.
29. Does Ecology agree that low DO levels in Lake Spokane result from the fact that it is a reservoir?
Response: The low dissolved oxygen levels in lake Spokane are due to a combination of high nutrient loads from upstream sources and water detention and circulation patterns in the lake.
30. Does Ecology agree that the Spokane River encompassed by Lake Spokane would likely achieve DO criteria if it was a free-flowing river?
Response: See response to comment number 15, Part T. This comment is irrelevant since it ignores Spokane Tribe water quality standards, which would not be met.
31. If Ecology is in disagreement with any of the preceding questions, please explain the basis of the disagreement.
Response: See responses to individual questions.
32. Ecology does not apply natural dissolved oxygen criteria to artificial reservoirs created by hydroelectric projects.
Response: Ecology follows the water quality standards in applying criteria to reservoirs. In the case of Lake Spokane, the reservoir is specifically called out as a lake for regulatory purposes, in addition to qualifying as a lake under the broader criteria of 15-day retention time. Thus the criteria are applied to Lake Spokane as a lake. See Appendix I of the TMDL.
33. IEP has not been able, in fact, to find a single temperature TMDL related to a reservoir that treated the impoundment as a natural condition for water quality modeling.
Response: Comment noted.
34. The Draft TMDL improperly applies the EPA eco-region criteria to the Spokane River. These concerns are set forth in two e-mail messages from Idaho DEQ staff and incorporated herein by reference. IEP requests that Ecology respond to the specific concerns raised in these e-mail messages
Response: See summary response to Part T related to use of riverine assessment point.
Spokane River / Lake Spokane Dissolved Oxygen Water Quality Improvement Report Page C-150
35. Is it accordingly unlawful for Ecology to define the effects of the Long Lake Dam impoundment as “natural” for the purposes of the state water quality criteria for dissolved oxygen.
Response: Ecology disagrees. Ecology has lawfully applied the water quality standards for dissolve oxygen in developing the TMDL.
36. IDEQ continues to object to the adoption of 10 µg/l water quality goal or benchmark with the following concerns: 1) the upper part of Lake Spokane Reservoir and the area that the water quality goal or benchmark is being applied is in an area that is transitional between EPA's Western Mountains and Xeric West aggregate level III ecoregions. The criteria should also be transitional, somewhere in the range between 10 and 21.88 µg/L; 2) nutrient criteria developers caution the use of reference conditions alone to derive criteria. A weight of evidence approach which addresses all key elements should be pursued; 3) the data base from which EPA's suggested nutrient criteria was developed contains annual medians for some water bodies, and is made from all data available and is not randomly sampled. Random sampling is needed in order to remove bias prior to application of statistics; 4) the data base also contains zeros which EPA assumed is an accurate measurement, and were included in the statistics. Laboratories do not report zero for these types of analysis. Western mountain III aggregate ecoregion has not been peer reviewed and there has not been a determination of how many zero values are affecting statistical applications; 5) the data base contains many values below method detection limit (10.01.1g/L, EPA 365.1); 6) data were combined without regard to data quality objectives (accuracy, precision), or field quality assurance and quality control process; 7) peer review of EPA's suggested nutrient criteria concluded that defensible reference conditions could not be derived and that seasons should limit data analysis; 8) The data used to develop the 10 IRA water quality goal have not been tested for normality even though normal statistics (%tile) have been applied; 9) the frequency distribution approach used by EPA is arbitrary and results in inappropriate, stringent criteria that do not focus on environmental outcomes. By definition 75% of all water will not meet resulting nutrient standards; 10) Ecology's application of oligotrophic lake criteria to a non-oligotrophic riverine assessment point is inappropriate.
Response: See summary responses to Part A and T related to use of riverine assessment point.
37. Are there fish down there? You will never meet the water quality standards of 8 to 9 milligrams per liter even without the dischargers.
Response: See summary response to Part T. The target and criterion for dissolved oxygen in the lake is 0.2 mg/L below the natural condition during peak stratification (critical period), not 8-9 mg/L. Dissolved oxygen is above 9.5 mg/L following lake turnover (see Table 7 in TMDL).
38. The population of salmonids that the Core Summer Salmonid Habitat beneficial use protects has not been described adequately to identify impairment based on dissolved oxygen concentration and DO depth profile. Baseline population data for this water has not been established to show when and how impairment might occur, and without this baseline data, it is not clear how Ecology will determine when the beneficial use is restored. The TMDL focuses
Spokane River / Lake Spokane Dissolved Oxygen Water Quality Improvement Report Page C-151
on compliance with criteria and bears no documented relationship with the beneficial use of Core Summer Salmonid Habitat.
Response: See summary response to Part T. The water quality criteria provide full protection for the designated uses, and as such function in part to define the level of use that makes up a fully attained designated use. When criteria are not met the fully protected level of use is also assumed not to be met. The local use in an area does not have to be fully described to determine whether the water quality in the area is adequate to fully protect the designated use at the criterion level.
39. It is not reasonable to model Lake Spokane Reservoir as though it were a natural lake for the purposes of TMDL beneficial use impairment, or TMDL load allocation.
Response: See response to comment number 32, Part T and Appendix I.
40. The designated beneficial uses and associated criteria for the Lake Spokane Reservoir are incorrect. In addition, it is unclear in the TMDL how phosphorus load reductions will ultimately benefit the beneficial uses that are identified in the TMDL as having recurring impairments. The beneficial use of Core Summer Salmonid Habitat and the fish that the Core Summer Salmonid Habitat designation protects have never been attained, nor are they likely to be attained through any pollution reduction effort.
Response: The designated uses and criteria for Lake Spokane are part of the water quality standards, have been adopted into rule formally, and have received USEPA CWA approval.
41. Another point that has never been discussed is the basis for the delta 0.2 mg/L. What beneficial use is being protected if that delta is met that would not be if the delta were say 1 mg/L? What would make sense for a salmonid and zooplankton refuge is for DO to be 5 or 6 mg/L in the cooler metalimnion (– 8 – 15 m). … Has the ecological basis of a delta DO of 0.2 mg/L been presented? What would doubling the no source SOD, as suggested above, mean in terms of no source hypolimnetic DO and the delta DOs in Table 12 (PSU, 9/09)?
Response: This comment is unclear as written, especially the term “delta 0.2 mg/L.” If this is a reference to the water quality standards for Lake Spokane, the dissolved oxygen criteria for lakes were adopted as part of a formal rule-making process with opportunity for public review. The criteria applicable to Lake Spokane are part of the water quality standards, were adopted into rule formally, and received USEPA CWA approval. See summary response to Part T related to UAA. Dischargers or other interested parties are welcome to run additional modeling scenarios with different inputs during TMDL implementation to be considered between permit cycles and as part of the ten-year assessment.
42. In effect, Ecology is attempting to make the "target" into a water quality standard, but exceeds its authority in doing so. The 1987 WDOE document titled "The Spokane River Basin: Allowable Phosphorus Loading" (Patmont et al, contract C0087074), reported that WDOE "determined that the 25 pg/L seasonal mean EZ-TP value is an appropriate water quality standard for Long Lake, since it best represents mesotrophic conditions with the lake (L. Singleton, Ecology, personal communication)."
Spokane River / Lake Spokane Dissolved Oxygen Water Quality Improvement Report Page C-152
Response: The TMDL is for dissolved oxygen, not total phosphorus. The previous TMDL developed for total phosphorus has been shown to be inadequate in protecting the designated uses in Lake Spokane. As such the chemicals that lead to impaired dissolved oxygen levels are examined to determine sources and allocations. The P criterion is above the concentration that would result in compliance with the dissolved oxygen criteria. The dissolved oxygen criterion must be complied with, as well as the P criterion, thus the secondary analysis of nutrients and their impacts on dissolved oxygen require controls more stringent than those associated with the P criterion alone. See summary response to Part T related to use of riverine assessment point.
43. For over two decades, Washington has managed Long Lake as a mesotrophic water body; however, it now appears that the classification of the reservoir, and hence the management consequences, is being changed through this TMDL process. This appears to be, in effect, a revision of the designated beneficial use but without the requisite technical basis to do so. If that is Ecology's intent, a Use Attainability Analysis should be conducted before making this change.
Response: The TMDL does not revise Washington’s water quality standards. See summary response to Part T related to use of riverine assessment point and UAA.
44. As provided in UAA Petitioners' February 22, 2005, letter to David Peeler, Ecology Water Quality Manager, in which a conditional offer to withdraw the UAA Petition was made, we continue to retain the right to resubmit the UAA Petition. Further, the burdens imposed may force Post Falls and HARSB to apply for variances from the applicable water quality standards.
Response: Comment noted.
45. The appropriateness of the 10 mg/L [µg/L] level of phosphorus to this point in the river is also arbitrary and capricious. …What is missing is a justification for why this one of many possible limits is appropriate for that particular spot in the Spokane River.
Response: See summary responses to Part A and T related to use of riverine assessment point.
46. If Long Lake Dam did not exist and so the land under Long Lake was a river segment of the Spokane River, this river segment would have a 25-mg/L limit.
Response: The appropriate standard to protect the beneficial uses in Lake Spokane is for dissolved oxygen, not the 25 µg/L (note the units are micrograms, not milligrams as stated in this comment) total phosphorus concentration which has been shown to not be protective (see Cusimano 2004). See summary response for Part T.
47. WDFW has concluded that spawning and rearing habitat exist in the river and shallower part of the upper reservoir and tributaries, and that the lower reservoir provides refuge and forage habitat. Summary of Ecology Information Regarding Aquatic Life Uses in Lake Spokane (undated) at 2. This is consistent with the fact that the dominant aquatic habitat of a stratified water body is the area above the thermocline. In such water bodies, the area below the thermocline typically has reduced DO due to natural processes. Wetzel, R.G., 1975, Limnology at 127. Therefore, these areas cannot serve as the dominant aquatic habitat.
Spokane River / Lake Spokane Dissolved Oxygen Water Quality Improvement Report Page C-153
Response: See response to comment number 1, Part T.
48. By establishing compliance points in the areas identified by WDFW, Ecology would provide reasonable assurance that numeric criteria will be met where the other essential habitat conditions exist. Such an approach would also avoid an expensive and futile effort to achieve compliance with numeric criteria in those portions of the lake where spawning and rearing would not naturally occur even under the most favorable DO levels. The DO TMDL should acknowledge that protection of dominant aquatic habitat will be an important consideration in evaluating Avista’s compliance with its DO responsibility.
Response: See response to comment number 1, Part T.
49. The draft DO TMDL… modeling excludes the top 8 meters of the lake, over 40 percent of the lake’s volume, much of which is part of the dominant aquatic habitat. The draft DO TMDL states that the top 8 meters have “amplified algal activity which increases daytime dissolved oxygen levels.” Draft DO TMDL at 36. However, the draft DO TMDL neglects to mention that amplified algal activity (i.e., respiration) reduces DO levels at nighttime. Thornton et al., 1990, Reservoir Limnology: Ecological Perspectives at 75. Because the draft DO TMDL measures compliance with the numeric DO criteria on the basis of a daily minimum (i.e., the minimum over a 24 hour period), the fact that algal activity may increase the daytime DO levels is not a reason to exclude the upper 8 meters from the analysis.
Response: Ecology will consider alternative modeling analyses that average the upper 8 meters of Lake Spokane in consideration of Avista’s water quality attainment plan.
50. As to the bottom 60 percent of the lake, the draft DO TMDL makes no distinctions between portions of the lake that may constitute dominant aquatic habitat and those that do not. Instead, it requires compliance with the numeric criteria in all 35 segments of the lake.
Response: See response to comment number 1, Part T.
51. The draft DO TMDL addresses five water body segments that Ecology included in its 303(d) list for dissolved oxygen. Of these five, only one (Listing 11400) is based on data collected after 2001. Draft DO TMDL, Table 1; 2008 303(d) Listings 40939, 15188, 17523, 15187, and 11400.
Response: See response to comment number 14, part A.
52. The draft DO TMDL’s characterization of the water quality of Lake Spokane is based on information that is incomplete and outdated. This characterization [history of studies related to dissolved oxygen in Lake Spokane] ignores the improvements in water quality that have occurred since the late 1970s. Among other things, the City of Spokane constructed a new advanced wastewater treatment plant in 1977, with secondary treatment that removed 85 percent of the phosphorus. Cusimano 2004 at 31. By 1987, a study prepared for Ecology based on data collected from 1966 to 1985 concluded that: “All four trophic status indicators [(i.e., chlorophyll-a concentrations, phytoplankton biovolume, Secchi disk transparency and hypolimnetic DO levels)] have exhibited significant (P<.05) improvements following the implementation of AWT [Advanced Water Treatment] at Spokane.” Patmont et al. 1987, The Spokane River Basin: Allowable Phosphorus Loading at 46.
Spokane River / Lake Spokane Dissolved Oxygen Water Quality Improvement Report Page C-154
Response: This comment claims outdated data is used but then cites reports that are over 20 years old. The previous, court ordered, TMDL has been shown to not be protective of dissolved oxygen in Lake Spokane, primarily by Cusimano (2004), which includes the most current in-depth assessment of water quality in Lake Spokane (in addition to numerous PSU modeling reports) and was the basis for this TMDL.
53. The draft DO TMDL cites no evidence that fish and other aquatic species in Lake Spokane are being harmed by low levels of DO.
Response: See summary response to Part T. The draft TMDL addresses dissolved oxygen criterion exceedances. The criterion helps define the fully-protected designated use. If the criterion is not met then the use is assumed to be protected at a level that is less than full protection.
54. The use of eco-region criteria in the TMDL is arbitrary and capricious.
Response: See summary response to Part T related to use of riverine assessment point. Ecology has not used the EPA documentation as a criterion in the river. Instead the 10 µg/L concentration is an estimate of typically occurring natural concentrations that are used in the TMDL to help determine a reasonable division of responsibility for dissolved oxygen impairments in Long Lake.
55. Ecology has relied on so-called eco-region criteria from EPA that have never been adopted by Ecology as part of the state water quality standards or approved by EPA. In response to these comments Ecology should acknowledge that the eco-region criteria are not part of the state water quality standards and that Ecology specifically declined to adopt the EPA eco-region criteria as part of the state standards when they were last updated.
Response: See summary response to Part T related to use of riverine assessment point.
56. Ecology should also acknowledge in response to these comments that it has not followed any of the procedures set forth in WAC 173-201A-230 for developing nutrient criteria. In particular, Ecology should acknowledge that it did not conduct a specific study or consider “stakeholder input as part of a public involvement process equivalent to the Administrative Procedure Act ” as required under WAC 173-201A-230(3)(b). Ecology should also disclose if it considers this TMDL review process to be the equivalent to a public involvement process equivalent to the Administrative Procedures Act.
Response: See summary response to Part T related to use of riverine assessment point. Ecology has not used the EPA documentation as a criterion in the river.
57. Ecology should also acknowledge in response to these comments that it derived the ecoregion criteria for the TMDL simply by determining the boundary between two ecoregions. The Idaho Department of Environmental Quality (DEQ) was highly critical of the arbitrary and capricious manner in which the EPA criteria are being applied in the TMDL [Exhibit 9 of City of Coeur d’Alene letter]. In your response to comments please specifically reply to each and every comment made by DEQ in Exhibit 9. To the extent Ecology does not respond to concerns raised by DEQ, Coeur d’Alene will assume that Ecology admits to the concerns and conclusions made by DEQ in Exhibit 9.
Spokane River / Lake Spokane Dissolved Oxygen Water Quality Improvement Report Page C-155
Response: See summary response to Part T related to use of riverine assessment point. Ecology has not used the EPA criteria as a water quality standard in the river.
58. Lake Spokane is not an oligiotrophic water body.
Response: See summary response to Part T related to use of riverine assessment point.
59. Ecology should acknowledge in response to these comments that the Spokane River and Lake Spokane are not oligiotrophic water bodies. Lake Spokane, as a man-made reservoir, has probably always been a mesotrophic water body, as it supports a warm-water fishery. There is no evidence of salmonid spawning.
Response: See summary response to Part T related to use of riverine assessment point.
60. The TMDL does not include any analysis of beneficial uses in Lake Spokane and throughout this process Ecology has been unwilling to consider the actual beneficial uses in the lake. Absent that information, Ecology should acknowledge that it is arbitrary and capricious to impose the EPA eco-region criteria as part of the TMDL analysis.
Response: See summary response to Part T. Ecology has not used the EPA criteria as a water quality standard in the river.
61. Does Ecology agree that IEP and the dam operator are entitled to the same interpretation and application of DO water quality criteria? If not, please explain any difference in how the dam operator and IEP are treated and the basis for that difference?
Response: The TMDL uses the same interpretation of water quality criteria for both the discharger and Avista. The modeling for this system-wide analysis addresses both Avista and the dischargers. This modeling is different than the decision to reasonably allocate responsibility for the exceedances in the lake based on the typical natural background concentrations of phosphorus in the Spokane area. In both cases (compliance with criteria and reasonable allocation of responsibility for dissolved oxygen exceedances) the dischargers and Avista are equally subject to meeting the state regulations and CWA requirements to protect uses and meet water quality criteria in Lake Spokane. Also, see summary responses to Parts A and T.

Spokane River / Lake Spokane Dissolved Oxygen Water Quality Improvement Report Page C-156
This page is purposely left blank
Spokane River / Lake Spokane Dissolved Oxygen Water Quality Improvement Report Page D-1
Appendix D: 2007 Memorandum of Agreement and Foundational Concepts

Spokane River / Lake Spokane Dissolved Oxygen Water Quality Improvement Report Page D-2
This page is purposely left blank
Spokane River / Lake Spokane Dissolved Oxygen Water Quality Improvement Report Page D-3
Spokane River / Lake Spokane Dissolved Oxygen Water Quality Improvement Report Page D-4
Spokane River / Lake Spokane Dissolved Oxygen Water Quality Improvement Report Page D-5
Spokane River / Lake Spokane Dissolved Oxygen Water Quality Improvement Report Page D-6
Foundational Concepts for the Spokane River TMDL Managed Implementation Plan
June 30, 2006
The Spokane River does not have enough dissolved oxygen (DO) during the months of April through October to meet current Water Quality Standards. The best available science shows that excess phosphorus is the main cause of this problem. There is agreement among those who petitioned Ecology in 2004, other interested parties and Ecology that actions are needed as soon as possible to improve the River’s condition, and, by assuring treatment capacity for septic tank discharges, further protect the quality of the Spokane Valley – Rathdrum Prairie Aquifer. Low dissolved oxygen also results from carbonaceous biochemical oxygen demand (CBOD) and ammonia. For the purpose of implementing the Spokane River Dissolved Oxygen TMDL, it is assumed that efforts to control phosphorus will also serve to control CBOD and ammonia. Reducing significant amounts of phosphorus in the River during the April-October season and achieving Water Quality Standards for dissolved oxygen are the goals of the Spokane River Dissolved Oxygen TMDL Managed Implementation Plan (MIP).
In the October 2004 Draft Total Maximum Daily Load to Restore and Maintain Dissolved Oxygen in the Spokane River and Lake Spokane (Long Lake), Ecology estimated a reduction target of approximately 208 pounds/day of phosphorus from point sources, nonpoint sources and other controllable sources. Most of this reduction is anticipated to come from improvements in point source wastewater treatment technology located between the Idaho state line and the Long Lake Dam.
The best available science conclusively demonstrates significant phosphorus reductions will improve DO in the River and Lake Spokane. How the River will respond to significant phosphorus reductions, the full extent of the reductions necessary to alleviate DO deficiencies, and the phosphorus reductions possible over the next 20 years are not precisely clear at this time. Hence, an aggressive, managed approach that removes phosphorus from a variety of sources through a variety of methods and monitors and assesses the impacts on DO over the next 20 years is a reasonable way to maximize the effectiveness of the sizable investments necessary to improve the River.
Capsule Summary of Approach Currently there is not well-established technology that can reliably treat a variety of wastewater discharges and achieve the River phosphorus levels required to improve DO sufficiently to meet Water Quality Standards. There is, however, technology that significantly reduces phosphorus from effluent and that can bring current discharges much closer to the levels required by Water Quality Standards. The Spokane River Collaboration refers to the difference between what technology improvements can achieve and the TMDL levels to meet Water Quality Standards as “the Delta.”
The MIP provides reasonable assurance that Water Quality Standards can be achieved during the first ten years of MIP effort by installing the most effective feasible phosphorus removal treatment technology and completing a planned and scheduled group of actions aimed at eliminating the Delta. The foundational concepts described here will begin guiding TMDL implementation when accepted by Ecology and affected National Pollutant Discharge Elimination System (NPDES) permit holders.
While phosphorus reductions from technology improvements and other actions can be estimated, their true impact on DO requires actual implementation experience and resultant measurement of DO levels in the River and Lake Spokane. The first ten years of MIP efforts need to be in place and operational prior to their
Spokane River / Lake Spokane Dissolved Oxygen Water Quality Improvement Report Page D-7
consequences being fully assessed. A thorough assessment after the 10th year of the MIP will provide the information necessary to guide actions for a second ten year MIP period. These second period actions will include continuation of successful actions conducted in the first 10 years, such as operation of the treatment technology and other permanent phosphorus reduction efforts, and they could include new actions such as consideration of river oxygenation and/or reconsideration of Water Quality Standards applied to the River and Lake Spokane. The MIP’s actions necessary to eliminate an NPDES permit holder’s Delta will be enforceable over the 20 year life of the MIP and the TMDL phosphorus waste load allocation will become enforceable requirements at the end of the 20 years covered by the MIP. During the MIP term, the NPDES permits applicable to individual Dischargers will include interim limits and other requirements as described below in the section titled “NPDES Permit Cycle.” Ecology Will Complete the Dissolved Oxygen TMDL Consistent with the Foundational Concepts The foundational concepts in this document are the result of substantial deliberation by the Spokane River Collaboration. This effort placed completion of the Draft TMDL “on hold” prior to its being made final and submitted to the Environmental Protection Agency for review. Ecology will re-draft the Draft Spokane River Dissolved Oxygen TMDL to include a MIP consistent with the principles described here. The re-draft will be subject to the same public review process and administrative procedures used for the earlier Draft TMDL. As well, Ecology will continue to work on a government-to-government basis with the Spokane Tribe of Indians to ensure compliance with downstream Tribal water quality standards. Waste Load Allocation Targets A TMDL requires waste load allocations (WLA) for the affected NPDES permit holders. These targets, expressed in concentrations in the draft TMDL, will be slightly revised in the re-drafted TMDL to reflect upstream permitting in Idaho and an April-October rather than June-October critical period (see the boxed table on page 24, Draft Total Maximum Daily Load to Restore and Maintain Dissolved Oxygen in the Spokane River and Lake Spokane, October 2004). The total phosphorus concentrations, as allocations in the TMDL rounded to the nearest microgram will remain 10µg/l.
In the MIP, however, the 10µg/l total phosphorus targets will be expressed as pounds of phosphorus discharge in the River based on the discharge volume estimates established through the Collaboration. The translation from concentration to pounds of phosphorus forms the basis for measuring success in meeting each phosphorus waste load allocation target under the MIP. Success in meeting the pounds of phosphorus target will be achieved by the installation of the most effective feasible phosphorus removal treatment technology and implementation of other phosphorus reduction actions that together result in the net pounds of phosphorus discharged to the River by the Dischargers being equal to or less than the target pounds. The following table shows the pounds per day phosphorus targets for each Washington State NPDES permit holder as they will be expressed in the MIP based on projected flows for 2017 and 2027 using estimates produced through the Spokane River TMDL Collaboration.
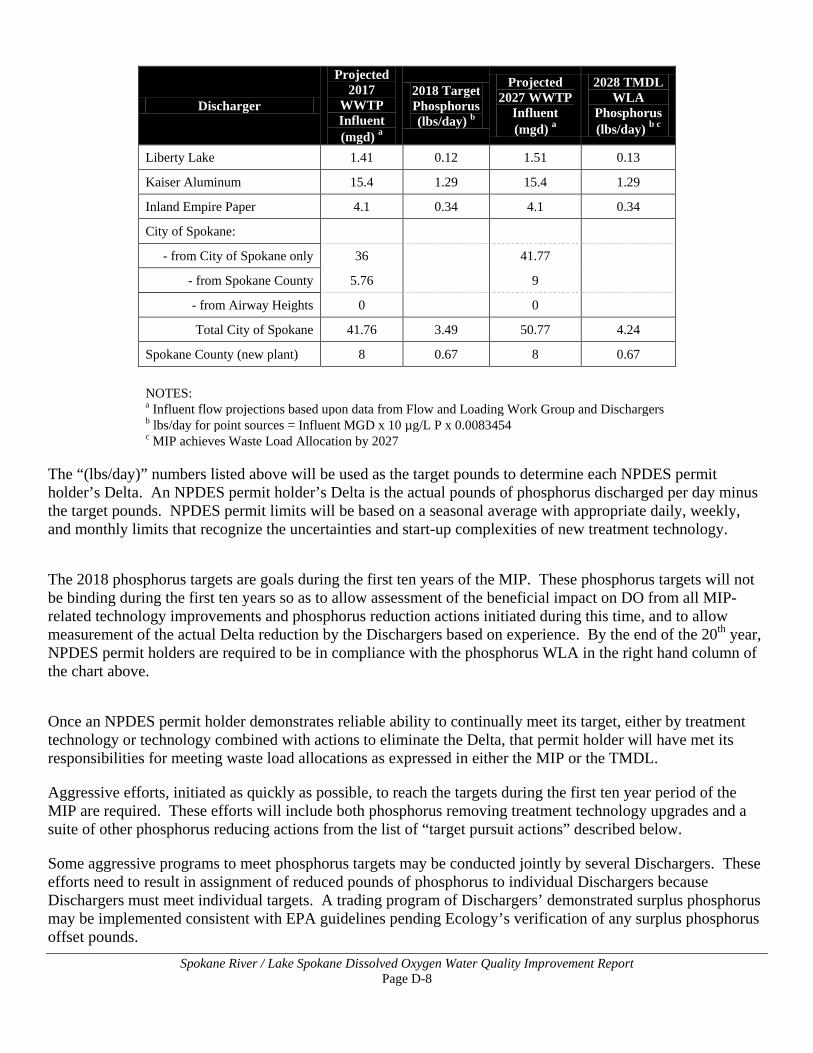
Spokane River / Lake Spokane Dissolved Oxygen Water Quality Improvement Report Page D-8
Discharger
Projected 2017
WWTP Influent (mgd) a
2018 Target Phosphorus (lbs/day) b
Projected 2027 WWTP
Influent (mgd) a
2028 TMDL WLA
Phosphorus (lbs/day) b c
Liberty Lake 1.41 0.12 1.51 0.13
Kaiser Aluminum 15.4 1.29 15.4 1.29
Inland Empire Paper 4.1 0.34 4.1 0.34
City of Spokane:
- from City of Spokane only 36 41.77
- from Spokane County 5.76 9
- from Airway Heights 0 0
Total City of Spokane 41.76 3.49 50.77 4.24
Spokane County (new plant) 8 0.67 8 0.67
NOTES: a Influent flow projections based upon data from Flow and Loading Work Group and Dischargers b lbs/day for point sources = Influent MGD x 10 µg/L P x 0.0083454 c MIP achieves Waste Load Allocation by 2027
The “(lbs/day)” numbers listed above will be used as the target pounds to determine each NPDES permit holder’s Delta. An NPDES permit holder’s Delta is the actual pounds of phosphorus discharged per day minus the target pounds. NPDES permit limits will be based on a seasonal average with appropriate daily, weekly, and monthly limits that recognize the uncertainties and start-up complexities of new treatment technology.
The 2018 phosphorus targets are goals during the first ten years of the MIP. These phosphorus targets will not be binding during the first ten years so as to allow assessment of the beneficial impact on DO from all MIP-related technology improvements and phosphorus reduction actions initiated during this time, and to allow measurement of the actual Delta reduction by the Dischargers based on experience. By the end of the 20th year, NPDES permit holders are required to be in compliance with the phosphorus WLA in the right hand column of the chart above.
Once an NPDES permit holder demonstrates reliable ability to continually meet its target, either by treatment technology or technology combined with actions to eliminate the Delta, that permit holder will have met its responsibilities for meeting waste load allocations as expressed in either the MIP or the TMDL.
Aggressive efforts, initiated as quickly as possible, to reach the targets during the first ten year period of the MIP are required. These efforts will include both phosphorus removing treatment technology upgrades and a suite of other phosphorus reducing actions from the list of “target pursuit actions” described below.
Some aggressive programs to meet phosphorus targets may be conducted jointly by several Dischargers. These efforts need to result in assignment of reduced pounds of phosphorus to individual Dischargers because Dischargers must meet individual targets. A trading program of Dischargers’ demonstrated surplus phosphorus may be implemented consistent with EPA guidelines pending Ecology’s verification of any surplus phosphorus offset pounds.
Spokane River / Lake Spokane Dissolved Oxygen Water Quality Improvement Report Page D-9
As part of the implementation of the MIP, each National Pollution Discharge Elimination System permit holder in Washington State covered by the Spokane River Dissolved Oxygen TMDL will, in accord with the section titled “Schedule of Activities,” prepare a technology selection protocol and an Engineering Report with construction schedule for the treatment technology improvements the permit holder intends to install. The permit holder will also prepare a Delta Elimination Plan with a schedule of target pursuit actions (see details below) that, in combination with the technology improvements, provide reasonable assurance the April-October phosphorus target will be achieved in the first 10 years of the MIP. The ways these targets and associated requirements will be reflected in each NPDES permit is explained in the section below titled “NPDES Permit Cycle.”
Target Pursuit Actions Target pursuit actions are the steps that are either required or available for NPDES permit holders to both upgrade their technology and eliminate their Delta within the first 10 years of the MIP in order to provide reasonable assurance of meeting targets. The target pursuit actions may be modified as a result of the 10th Year Assessment. Dischargers without a Delta do not need to perform target pursuit actions for Delta elimination.
Technology selection protocols and Delta-eliminating target pursuit actions will both be initiated as soon as possible, and Delta-eliminating actions will not be deferred until technology improvements are actually selected and installed.
Enforceable terms of each NPDES permit will include the obligation to meet the interim or final effluent limit and the obligation to complete implementation of the target pursuit actions, although the details of the target pursuit actions may be set forth in a separate administrative order.
After the 10th year of implementation, a thorough review (see the section titled “Tenth Year Assessment”) will be conducted to determine what, if any, additional phosphorus reduction actions are necessary, what actions should be continued or discontinued, and/or whether any changes to the phosphorus reduction goal in the TMDL or the Water Quality Standards for DO in the River and Lake Spokane are warranted. By the end of the 20th year of the MIP, NPDES permit holders are required to be in compliance with the then current TMDL phosphorus waste load allocations (the targets may have been modified as a result of the Tenth Year Assessment) to assure applicable Water Quality Standards are being met.
Required Actions: Required target pursuit actions for each NPDES permit holder with a Delta are as follows:
• Technology Selection Protocol: NPDES permit holders will prepare, and submit to Ecology for approval, a comprehensive technology selection protocol for choosing the most effective feasible technology for seasonally removing phosphorus from their effluent with an objective of achieving a discharge with seasonal average 50µg/l phosphorus or lower. If pilot testing is a part of the protocol, there will be appropriate provisions for quality assurance and control. The protocol will include a preliminary schedule for construction of the treatment technology.
• Delta Elimination Plan: In addition to the technology selection protocol, NPDES permit holders will also prepare and submit for Ecology’s approval a Delta Elimination Plan and schedule for other phosphorus removal actions such as conservation, effluent re-use, source control through support of regional phosphorus reduction efforts (such as limiting use of fertilizers and dishwasher detergents), and supporting regional nonpoint source control efforts to be established. The plan, in combination with the phosphorus reduction from technology, will provide reasonable assurance of meeting the permit holder’s target in ten years.
Spokane River / Lake Spokane Dissolved Oxygen Water Quality Improvement Report Page D-10
• Expeditious Decision: Ecology will expeditiously review and decide on the proposed technology selection protocol, preliminary construction schedule and Delta elimination actions.
• Engineering Report: After a permit holder implements the technology selection protocol, the permit holder will prepare, and submit to Ecology for approval, an Engineering Report concerning the chosen technology, including any updates to the construction schedule. The Engineering Report will (if necessary) be accompanied by amendments to the schedule and substance of the target pursuit actions so that in combination with the Engineering Report on expected technology performance, there is reasonable assurance of meeting the target in ten years. Ecology will expeditiously review and decide on these submittals.
• Interim Limits: When new treatment technology is installed, Ecology will set interim phosphorus permit limits based on the engineering reports. It is recognized that, because modern phosphorus removal technology is challenging, achieving normal, and routine operation may require two years, assuming average seasonal conditions (temperature and flow) during both years. During this period, Ecology will recognize these conditions and their effects on compliance with interim discharge limits.
• Final Limits: Final limits applicable during the remaining term of the MIP will be set based on the actual performance of the technology installed and operated at optimum reliable efficiency (see the section titled “NPDES Permit Cycle”).
• Investment Stability: The investment in phosphorus removal technology is recognized by Ecology as having a 20-year life, and no significant modifications or replacements of phosphorus removal facilities will be required during the term of the MIP. Modifications to installed technology that best available data indicate would enhance phosphorus removal performance and are efficient and cost-effective may be required.
• Conservation: Public NPDES permit holders, in cooperation with water purveyors, will as soon as possible develop individual and regional programs that reduce flows by funding “LOTT-style” indoor conservation efforts that target 20 percent water conservation per household in older urban areas and 10 percent water conservation per household in newer (post 1992) urban areas. These programs will have local ordinances, avoided cost investment principles and per connection expenditures similar to the LOTT program. To the extent these actions are demonstrated as reducing phosphorus loading to the river, they will be recognized as contributing toward achieving phosphorus waste load targets.
• Class A Effluent: Each publicly owned treatment plant covered by the Spokane DO TMDL will, through their technology updates, produce effluent meeting the State of Washington Class A reclaimed water quality standards in place when the MIP takes effect.
Available Actions: The following target pursuit actions are not required of every NPDES permit holder with a Delta. The nonpoint source program, however, needs to have sufficient participation to achieve the TMDL-required phosphorus reduction.
• Reclaimed Water: Publicly owned Dischargers may seek to re-use the Class A reclaimed water they produce as result of technology improvements. All reasonable efforts to re-use and/or recharge the aquifer rather than directly discharging it to the River, particularly in the April-October timeframe, are strongly encouraged consistent with circumstances and opportunities. Ecology will work with each NPDES permit holder and the Washington State Department of Health to prepare approvable permits
Spokane River / Lake Spokane Dissolved Oxygen Water Quality Improvement Report Page D-11
that enable timely and successful implementation of these opportunities. Specifically, Ecology commits to the following:
Ecology will assist in permitting re-use efforts by actively coordinating state permitting with the Washington State Department of Health.
Ecology will assist Dischargers proposing re-use target pursuit actions in assessing whether any water rights/quality impairments might occur and how any impairment might be addressed.
Any revisions of Washington State in Class A reclaimed water guidelines or standards in place when the MIP takes effect will serve as a basis for requesting Ecology’s reconsideration of an NPDES permit holder’s approved target pursuit action plan that relies on re-use target pursuit actions envisioned prior to the revisions.
To the extent these water re-use actions are demonstrated as reducing phosphorus loading to the river, they will be recognized as contributing toward achieving phosphorus waste load targets.
• Regional Phosphorus Reduction Programs: Privately owned treatment plants may participate with other NPDES permit holders in regional phosphorus reduction programs, such as conservation (see above) and nonpoint source control (see below). To the extent these actions are demonstrated as reducing phosphorus loading to the river, they will be recognized as contributing toward achieving phosphorus waste load targets.
• Bio-available Phosphorus: NPDES permit holders may seek to prove to Ecology that a certain stable fraction of their phosphorus discharge is not bio-available in the River environment for a time sufficient to consider it not reactive and not a nutrient source. If Ecology agrees, the pounds of phosphorus that are not bio-available will be recognized as contributing toward achieving the total phosphorus waste load target.
• Source Control Programs: To the extent that source control actions to limit phosphorus inputs through regulation of phosphorus-containing products and through enforced phosphorus-limiting pre-treatment ordinances are demonstrated as reducing phosphorus loading to the river, they will be recognized as contributing toward achieving Dischargers’ phosphorus waste load targets.
• Regional Nonpoint Source Reduction Program: Participating NPDES permit holders and Ecology will jointly fund and implement a regional nonpoint source (NPS) phosphorus reduction program at $2 million/year. The program will begin in the second year of the MIP following completion of an initial study (50 percent funded by Ecology) to determine the best opportunities for nonpoint phosphorus reductions.
The regional nonpoint source program will be designed to achieve the NPS phosphorus reduction identified in the TMDL and to contribute to the Delta reduction efforts of the participants, as necessary. If sufficient reduction in NPS phosphorus as determined by the 10th Year Assessment has not yet been achieved, the jointly funded and implemented regional NPS program will continue for the second 10 years of the MIP. The program will be closely managed by the oversight and coordination group described below, and it will be monitored to routinely identify cost-effective strategies and verify actual phosphorus reductions. Resources could be shifted to other more effective actions for phosphorus reduction by mutual agreement with Ecology.
Spokane River / Lake Spokane Dissolved Oxygen Water Quality Improvement Report Page D-12
Successful phosphorus-reducing actions funded by the NPDES permit holders through the NPS program will be recognized as contributing toward achieving Dischargers’ phosphorus waste load targets.
• Septic Tank Elimination Program: Spokane County may submit to Ecology information and calculations demonstrating the phosphorus removal impact on the Spokane River and Lake Spokane of its Septic Tank Elimination Program. Pending Ecology’s expeditious review and decision regarding the information and calculations, the County may, if Ecology approves, use the pounds of phosphorus prevented from reaching the River and Lake Spokane through septic tank elimination as part of any needed offsets for the County’s new treatment plant (see the section titled “New County Treatment Plant”).
Oversight and Coordination: The above target pursuit actions require careful monitoring and accounting to assure genuine phosphorus reductions and proper Delta reduction recognition. The following will occur:
• Ecology and the Dischargers will immediately collaborate to develop an oversight and coordination group. The intent is to form a collaborative group to oversee and coordinate the required regional actions including, but not limited to, the NPS, monitoring, modeling, reporting and public outreach programs, however the participating entities retain their individual authorities. Ecology and the Dischargers will share in the administrative cost of this group.
• The oversight and coordination group, in cooperation with Ecology, will manage the nonpoint source program described above.
• The oversight and coordination group will implement a monitoring and research program for the River to routinely track and evaluate the amount of phosphorus removal, the impact of phosphorus reductions and associated improvements on dissolved oxygen levels. Also, there will be additional studies such as those concerning sediment oxygen demand, the efficacy of river aeration/oxygenation, and bio-availability of phosphorus in discharges and other areas that advance the understanding of and refine the science concerning the River’s health. Modeling capabilities for the River will also be enhanced by gathering and including sediment oxygen demand data, noting and examining episodic events that contribute to increased phosphorus loading, and other relevant data and by considering current measurement of minimum river flow as adjusted by regulation. Ecology and the Dischargers will share in the cost of implementing and operating this monitoring and research program.
• Dischargers will prepare and submit annual reports to Ecology, describing each discharger’s performance of the target pursuit actions and any measurable successes. For joint actions (such as the NPS Program), the Dischargers may provide a joint report.
• Ecology will prepare annual performance reviews concerning the status of agreed-upon, committed target pursuit actions described above. Every two years Ecology, using monitoring information, will prepare and present a report and, in collaboration with the oversight and coordination group, conduct other public engagement efforts regarding the River’s health and the performance and effects of the target pursuit actions described in the MIP.
• Ecology will address Avista Corporation’s DO responsibilities through the 401 Certification process.
New Spokane County Treatment Plant A new Spokane County treatment plant will be constructed to meet its phosphorus allocation target through a combination of advanced treatment and other offsets that are in place and accepted by Ecology as effective as
Spokane River / Lake Spokane Dissolved Oxygen Water Quality Improvement Report Page D-13
the plant begins routine, normal (i.e., beyond shakedown or start up) operations. As with the engineering reports and target pursuit action plans and schedules for NPDES permit holders, the County will submit to Ecology for approval the County’s engineering report for the plant showing how the most effective, feasible phosphorus removal technology has been selected, and how the offsets will be timely developed. At the time the plant begins normal, routine operations, it is expected the combination of offset actions and the plant’s treatment of water to be discharged in the River will together achieve compliance with 10µg/l phosphorus.
Consistent with NPDES requirements, the plant will be permitted by Ecology in order to enable rapid conversion of septic systems to sewers consistent with the approved septic tank elimination program prior to the completion of the County plant. The County will construct the plant within the first 6 years of the MIP as the County’s offsets from the target pursuit actions are being developed and made operative. It is recognized that any phosphorus reduction actions selected by the County that rely on the plant achieving normal, routine operation for their full implementation (such as completing septic tank hookups and/or water re-use) can still contribute to the County’s offsets. It is further recognized that, because modern phosphorus removal technology is challenging, achieving normal, and routine operation may require two years, assuming average seasonal conditions (temperature and flow) during both years. During this period, Ecology will recognize these conditions and their effects on compliance with interim discharge limits.
The County will also develop a comprehensive program for reclaimed water production, re-use and aquifer recharge of effluent. This re-use program will be subject to the same conditions described for other re-use target pursuit action plans described above. 10th Year Assessment Following the 10th year of the MIP there will be a major assessment of the plan’s impact. A collaborative process will be used to make determinations about the relevant actions appropriate for the second 10 years of the MIP. The assessment will be a data-based, objective review designed to assess:
• The amount of phosphorus removed from the River by the actions taken to date compared to phosphorus reduction targets.
• The River response to those reductions and associated changes in DO.
• The necessity, if any, for further reductions in phosphorus, CBOD and ammonia in order to achieve Water Quality Standards for DO.
• The likelihood of further phosphorus reductions occurring in the next 10 years of the MIP if the actions begun in the first 10 years were continued.
• The set of actions that could be initiated in the next 10 years of the MIP that would more likely than not result in further phosphorus reductions, if necessary, to achieve DO Water Quality Standards for Lake Spokane.
• The reasonableness of pursuing these actions and/or the reasonableness of pursuing other strategies such as Lake Spokane oxygenation and/or the appropriateness of modifying DO Water Quality Standards if continuing existing or implementing additional phosphorus removal strategies will more likely than not fail to improve DO sufficiently to meet existing DO Water Quality Standards.
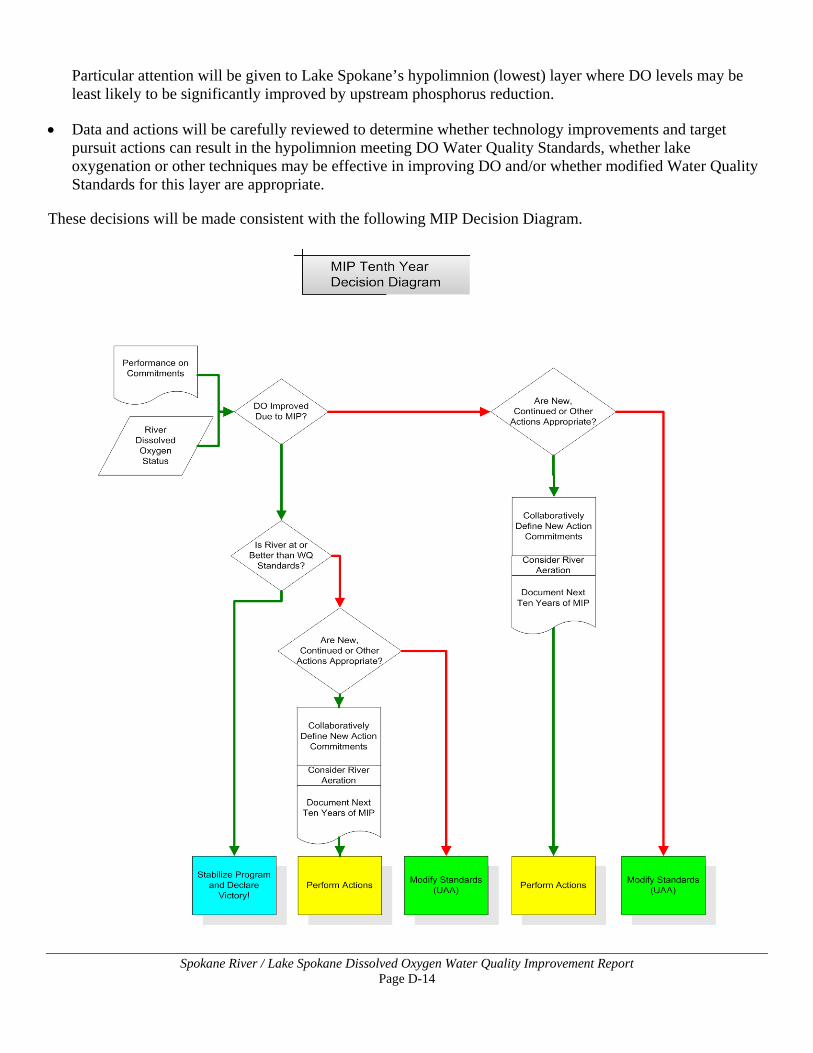
Spokane River / Lake Spokane Dissolved Oxygen Water Quality Improvement Report Page D-14
Particular attention will be given to Lake Spokane’s hypolimnion (lowest) layer where DO levels may be least likely to be significantly improved by upstream phosphorus reduction.
• Data and actions will be carefully reviewed to determine whether technology improvements and target pursuit actions can result in the hypolimnion meeting DO Water Quality Standards, whether lake oxygenation or other techniques may be effective in improving DO and/or whether modified Water Quality Standards for this layer are appropriate.
These decisions will be made consistent with the following MIP Decision Diagram.
Spokane River / Lake Spokane Dissolved Oxygen Water Quality Improvement Report Page D-15
This assessment will occur following the 10th year of the MIP. The assessment may need to be extended if the timing of the installation of treatment technology has not resulted in operation for a long enough time to
produce sufficient data about river conditions and DO response. If this occurs, the assessment would not be completed until there has been at least 3 years of operation of all treatment technology upgrades by all
dischargers.
NPDES Permit Cycle Four 5-year NPDES permit cycles are expected to be covered under the MIP. Currently, all four existing NPDES permits are under administrative extensions. Each of the existing NPDES permits will be handled somewhat differently due to varying conditions associated with each discharge.
In general, the NPDES permits will follow this sequence:
Cycle Term Permit Elements
I 2007 - 2011
The permit is issued with effluent limits adjusted based on performance history. The permit will state the goal of achieving an equivalent of an effluent phosphorus concentration of 10µg/l phosphorus by the end of the following permit cycle (i.e., in 10 years) through a combination of phosphorus treatment technology and target pursuit actions. Enforceable terms of each NPDES permit will include the obligation to meet the effluent limit and the obligation to start, continue, and/or complete the target pursuit actions. The details of the target pursuit actions may be set forth in a separate administrative order. The permit, depending on date of issue, may also specify dates for submitting a technology selection protocol and an Engineering Report with an estimated construction schedule, all as described in the section titled “Target Pursuit Actions.”
Spokane River / Lake Spokane Dissolved Oxygen Water Quality Improvement Report Page D-16
Cycle Term Permit Elements
II 2012 - 2016
The permit is issued with interim effluent limits taking effect with the completion of technology upgrades. Implementation of the phosphorus target pursuit actions to reduce the Delta is continued during this permit cycle. The permit will state the goal of achieving an equivalent of an effluent phosphorus concentration of 10µg/l phosphorus by the end of the permit cycle (i.e., in 5 years) through a combination of phosphorus treatment technology and target pursuit actions. As in the first Permit Cycle, enforceable terms of the NPDES permit will include the obligation to meet the effluent limit and the obligation to continue and/or complete the target pursuit actions. The details of the target pursuit actions may be set forth in a separate administrative order. The interim limits will be based on the Engineering Report that provides Ecology with reasonable assurance that an equivalent of an effluent phosphorus concentration of 10µg/l phosphorus will be achieved by the end of the permit cycle. It is recognized that, because modern phosphorus removal technology is challenging, achieving normal and routine operation may require two years, assuming average seasonal conditions (temperature and flow) during both years. During this period, Ecology will recognize these conditions and their effects on compliance with interim discharge limits. Operational characteristics for the newly installed technology will be assessed so that final limits can be established.
III 2017 - 2021
The permit is issued with final effluent limits based on observed operational characteristics. The permit will reflect results of the 10th Year Assessment. The permit will state the goal of achieving an equivalent of an effluent phosphorus concentration of 10µg/l phosphorus through a combination of phosphorus treatment technology and target pursuit actions. As in the first Permit Cycle, enforceable terms of the NPDES permit will include the obligation to meet the effluent limit and the obligation to continue and/or complete the target pursuit actions. The details of the target pursuit actions may be set forth in a separate administrative order.
IV 2022 - 2026 The permit is issued with established final effluent limits that, in combination with completed and continuing target pursuit actions, meet the final waste load allocations since they will be enforceable at the end of the MIP.
A Gantt chart version of the anticipated permit cycles for each existing NPDES permit holder plus the permit cycle for Spokane County is included for illustrative purposes as Attachment A.
Schedule of Activities to Initiate the MIP Based on and consistent with the principles and foundational concepts in this Agreement, several tasks need to be completed as the Spokane River TMDL and accompanying MIP are made final.
These actions include the following:
Spokane River / Lake Spokane Dissolved Oxygen Water Quality Improvement Report Page D-17
• Re-drafting of the TMDL, completion of the MIP by Ecology, and submittal of the final TMDL to EPA – target date 1/1/2007
• Submittal to Ecology of technology selection protocols, Delta Elimination Plans and treatment technology implementation schedule by each discharger – target date 1/1/2007
• Creation of the oversight and coordination structure necessary to implement the actions that will be conducted on a regional scale such as the operation of the NPS and monitoring programs – target date 1/1/2007
Assuming the Foundational Concepts in this paper become an Agreement in Principle that is endorsed by Ecology and the Dischargers this summer, and the TMDL is completed by Ecology and approved by EPA, it appears likely the first permitting sequence and the start of the MIP’s first ten year period could begin in early 2007. Ecology and the Dischargers agree that local elected officials in the Spokane area should share the lead with Ecology in developing the appropriate oversight and coordination structure for overseeing the implementation of the MIP and securing the necessary inter-agency agreements and funding commitments sufficient to support it.
Applying the Foundational Concepts, the Agreement in Principle does not require any party to engage in any future action or make any subsequent decision in violation of established rules and procedures for engaging in such actions or making such decisions. Nothing in this document changes any party’s authorities or responsibilities under law or regulation. The parties embracing this Agreement recognize and support that this path forward is the appropriate way to establish the legally sufficient framework for completing the Spokane River DO TMDL and to quickly begin the important work of improving the health of the Spokane River. All parties agree to conduct themselves over the next months and years consistent with these Foundational Concepts and resulting Agreement in Principle so that this can be successfully and efficiently accomplished.
Spokane River / Lake Spokane Dissolved Oxygen Water Quality Improvement Report Page D-18
Attachment A: Draft Wastewater Treatment Facility Permitting Schedule INCLUDED FOR ILLUSTRATIVE PURPOSES ONLY -
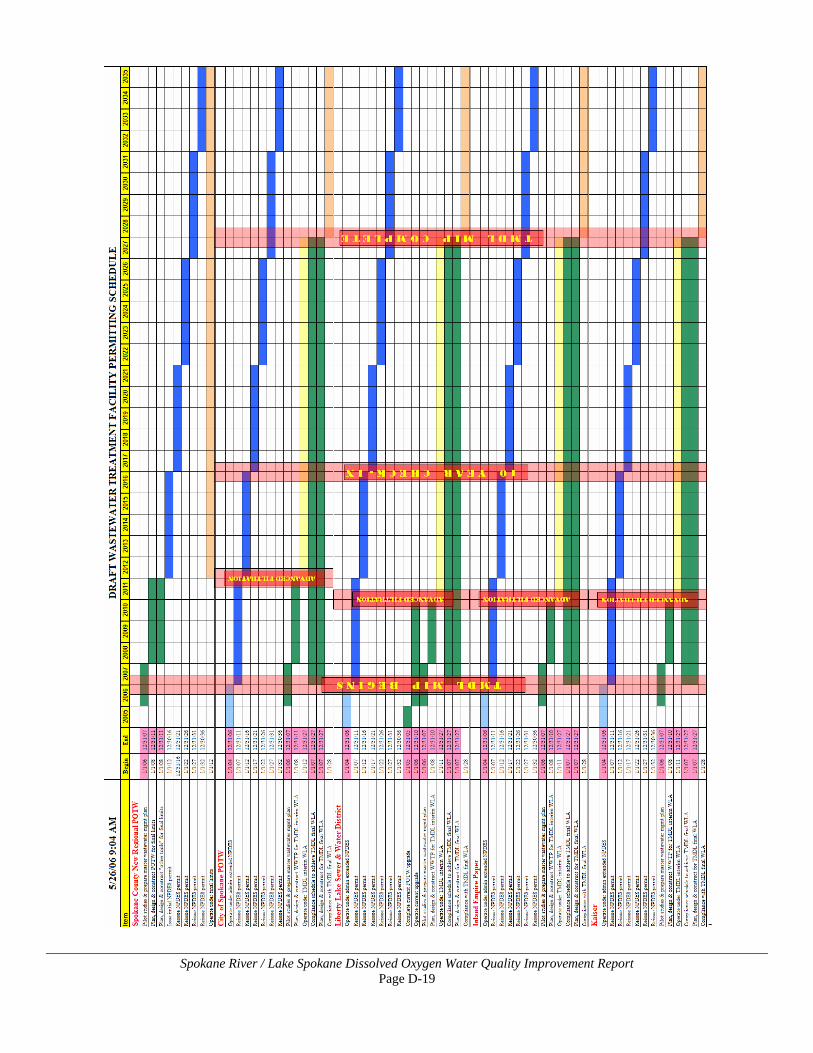
Spokane River / Lake Spokane Dissolved Oxygen Water Quality Improvement Report Page D-19
-
Spokane River / Lake Spokane Dissolved Oxygen Water Quality Improvement Report Page D-20
Spokane River TMDL Collaboration Members
• Tom Agnew, Liberty Lake Sewer and Water District • Pat Blau, Kaiser Aluminum • Chris Butler, Spokane Tribe of Indians • Tony Delgado, Stevens County Commissioner • Dick Denenny, City of Spokane Valley • Tom Eaton, US EPA-Region 10 • Rick Eichstaedt, Sierra Club • Wayne Frost, Inland Empire Paper • Gwen Fransen, ID Dept. of Environmental Quality • Sid Fredrickson, City of Coeur d’Alene • Lewis Griffin, City of Liberty Lake • Bruce Howard, Avista • Jim Kimball, Hayden Area Regional Sewer Board • Jack Lynch, City of Spokane (Dale Arnold, City of Spokane alternate) • Rene Marc-Mangin, Washington Dept. of Ecology-ERO • Todd Mielke, Spokane County Commissioner • Dave Peeler, Washington Dept. of Ecology-Olympia • Mike Peterson, Land Council • Albert Tripp, City of Airway Heights • Terry Werner, City of Post Falls
Consultants to the Collaboration:
• Bill Ross, Ross and Associates • Ryan Orth, Ross and Associates • Mike Sharar, Mike Sharar Consulting
John Spencer, CH2M Hill
Spokane River / Lake Spokane Dissolved Oxygen Water Quality Improvement Report Page E-1
Appendix E: Overview of Modeling Assessment for 2009 TMDL

Spokane River / Lake Spokane Dissolved Oxygen Water Quality Improvement Report Page E-2
This page is purposely left blank
Spokane River / Lake Spokane Dissolved Oxygen Water Quality Improvement Report Page E-3
Appendix E
Overview of Modeling Assessment for the Final TMDL
Introduction This appendix provides an overview of the modeling assessment that supports the final TMDL for dissolved oxygen in Lake Spokane. This appendix is organized by topic as follows: • Introduction • Previous Assessments • Review and Update of the Core Water Quality Model • Model Application for the TMDL
o Groundwater o Tributaries o Lake Watershed o Municipal and Industrial Facilities o Stormwater o Combined Sewer Overflows o Sediment Oxygen Demand o Riverine and Reservoir Analysis
• Model Uncertainty • Public Participation and Review • References The technical analysis was a collaborative effort by the states of Washington and Idaho, EPA, Spokane Tribe, and Portland State University (PSU). PSU’s modeling effort was funded by EPA. PSU’s role in the project was strictly technical in scope, with the agencies providing direction on all policy-related matters. In particular, the model assumptions and setups for the TMDL scenarios were defined by the agencies. The agency project team also considered input and data submitted by stakeholders in the watershed and their technical consultants. The involvement of many parties in the planning and review of the water quality modeling effort had a positive impact on the quality of the work. Previous Assessments This water quality assessment builds upon previous efforts to build the water quality model and analyze the dissolved oxygen problem in Lake Spokane. The water quality model developed by PSU has been subjected to significant peer review. In 2004, Ecology convened a meeting of agency and stakeholder modelers to review and discuss the model. At that time, a formal consensus was reached that Ecology’s general conclusion from the model simulations, that point
Spokane River / Lake Spokane Dissolved Oxygen Water Quality Improvement Report Page E-4
and nonpoint sources would need to be reduced to near-background levels to meet the dissolved oxygen standard in Long Lake, was scientifically sound. The change in the legal/policy foundation for the project in 2008 re-opened the public process for the TMDL. Based on concerns about the model raised by stakeholders, the agency project team decided to re-open the model to further analysis and review as part of the TMDL re-development process. This review has led to modest changes in the functionality, boundary conditions, kinetic parameters, and calibration of the model. Since many components of the 2007 model are unchanged, a number of reports documenting the original model by Ecology and PSU continue to be relevant to the current TMDL analysis. These reports are referenced in PSU’s reports on the 2009 core model update and calibration. Review and Update of the Core Water Quality Model The assessment for this TMDL was conducted in a different legal/policy landscape than previous work, particularly related to the analysis of the combined impact of Washington and Idaho sources and inclusion of a responsibility for Avista Corporation, owner/operator of Long Lake Dam, to improve dissolved oxygen conditions in Lake Spokane. PSU had previously developed two separate models, using the CE-QUAL-W2 model framework, for the system. One model extends from the outlet of Lake Coeur d’Alene to the Idaho/Washington border. The second model extends from the border to Long Lake Dam. Each model was separately calibrated to measurements of flow and water quality available for its respective reach of the Spokane River. To support the TMDL effort, a Quality Assurance Project Plan (QAPP) was developed for the work on the water quality model. A draft QAPP was shared with stakeholders for their input. The final QAPP (Wells and Berger, March 2009) included a listing of issues raised by stakeholders and PSU responses to each issue. The final QAPP included the following tasks: 1. Convert the Upper Spokane River CE-QUAL-W2 models (Washington and Idaho) from
version 3.1 to version 3.6 2. Combine the Washington and Idaho models 3. Review and update model boundary conditions 4. Check model calibration (year 2001 model) 5. Meet with stakeholders 6. Develop and Run Modeling Scenarios 7. Create reports on calibration and scenario runs Based on stakeholder input and initial calibration checks, the calibration task was broadened to include analysis of the year 2000 model in addition to 2001. PSU performed the model development tasks (tasks 1-4 above) and prepared a draft report for stakeholder review. After providing stakeholders with an opportunity to review the draft report,
Spokane River / Lake Spokane Dissolved Oxygen Water Quality Improvement Report Page E-5
PSU prepared a final report documenting all relevant information about the model (Wells and Berger, June 2009). This completed the technical work on the core model to be used for the TMDL. Model Application for the TMDL Total Maximum Daily Load (TMDL) scenarios were simulated using the updated core model. Three scenarios were required for the TMDL: 2001 or “existing” condition (core model), natural conditions (No Source scenario), and TMDL allocation conditions (TMDL scenario). For development of the draft TMDL, four scenarios were simulated, including the “no source” scenario and three TMDL alternatives (PSU 2009). In response to comments on the draft TMDL, changes were made in some of the model setup (PSU 2010), and the “no source” and final TMDL scenario were re-run. The agency project team defined all of the model inputs for the scenarios, while PSU was tasked with running the model, processing the output, documenting the results, and posting the model files on its ftp site. The following discussion describes the basis for the model inputs used for groundwater, tributaries, municipal and industrial facilities, stormwater, combined sewer overflows (CSOs), and sediment oxygen demand (SOD). At the end of this section, the method used to generate and analyze the model output for the reservoir is discussed. The modeling reports and specific model files prepared by PSU provide additional information (see References). Additional information is included in the response to comments document for the final TMDL. Groundwater Existing Conditions – 2001 The estimates of existing quality of groundwater entering the river are documented in PSU’s report describing the core model. Average pollutant concentrations measured in wells in the vicinity of known groundwater inflows were used in the model. The estimated 2001 phosphorus concentrations vary by location, ranging from 0.006 to 0.025 mg/l. CBOD has not been analyzed and is assumed to be negligible, and ammonia has not been detected. Natural Conditions For the No Source scenario, all groundwater was set to the median value (0.004 mg/l PO4) from wells located outside the influence of the river. Natural condition inflow/outflow of groundwater to the river is assumed equal to existing flows, plus the flow currently entering the river from point sources. Because municipal and industrial source water is pumped from the aquifer, municipal and industrial discharge flows for 2001 are re-routed to the nearest distributed groundwater location in the model for the No Source
Spokane River / Lake Spokane Dissolved Oxygen Water Quality Improvement Report Page E-6
scenario. This eliminates the point source discharges and slightly increases the groundwater inflow to the river. TMDL Scenario The final TMDL scenario allocates the existing loading from groundwater. Therefore, the TMDL scenario includes groundwater at 2001 flow and quality. Tributaries Existing Conditions – 2001 The estimates of 2001 flow and water quality for the three tributaries (Hangman Creek, Coulee Creek, and Little Spokane River) are documented in PSU’s report describing the core model. Coulee Creek is small relative to the other two tributaries. For the core model and all TMDL analyses, the pollutant concentrations for Coulee Creek are set equal to Hangman Creek concentrations. Natural Conditions Pollutant concentrations in the headwaters of Hangman Creek and Little Spokane River are used as estimates of the natural water quality of these streams. Year-round measurements are available for the Scotia monitoring location near the headwaters of the Little Spokane River. These values were input directly into the No Source model setup. For Hangman Creek, only limited data are available for the California Creek monitoring location near the headwaters of Hangman Creek (Jan to March, Oct to Dec). Nevertheless, these samples are the best available information. To fill the gaps in the total phosphorus data at California Creek, the monthly 2001 conditions were scaled down by 60 percent until the winter and fall concentrations approximated the concentrations measured at the California Creek site (under the assumption that human caused increases in phosphorus follow the same pattern as natural variation). This extrapolation provides a common seasonal pattern for phosphorus between the No Source and 2001 conditions, which also provides a consistent baseline for TMDL allocations below. TMDL Scenario The TMDL scenario requires a percent reduction in tributary concentrations, which are based on Ecology’s work on the draft Hangman sediment TMDLs and best professional judgment. To determine the average monthly concentration of human-caused pollution, the natural background concentrations are subtracted from the existing (2001) concentrations. The percent reductions are then applied to the human-caused portion of the pollution in order to identify the monthly average “allowable” human increase in pollution, expressed in units of concentration. The equation defining the TMDL condition is the following:
Spokane River / Lake Spokane Dissolved Oxygen Water Quality Improvement Report Page E-7
TMDL conc. = (2001 conc.) – {(% reduction)*(2001 conc. – No Source conc.)}
The % reductions proposed for each tributary are the following:
Hangman/Coulee: 20% (Mar-May) 40% (June) 50% (July -Oct)
Little Spokane:
36% (Mar-Oct) The final scenario report (PSU 2010) includes tables with month-by-month water quality estimates for existing, natural, and TMDL conditions for each tributary. Lake Watershed In contrast to the upstream river segments and tributaries, there is no information on groundwater and surface water flows into and out of the lake. Without flow estimates, one cannot directly estimate pollutant loads (load = flow X concentration). Instead, loads are conservatively estimated and allocated for Lake Spokane groundwater and surface water through use of the water balance correction flows in the reservoir portion of the model. The flows were identical for each scenario, but the assumed phosphorus concentration of the inflows was varied as follows. Existing Conditions – 2001 The average phosphorus concentrations measured in wells in the vicinity of the lake was used in the model (25 ug/l PO4). Natural Conditions Similar to upstream groundwater, the natural condition phosphorus concentration was set to the median value (0.004 mg/l PO4). TMDL Scenario The final TMDL scenario allocates the existing loading. Therefore, the TMDL scenario is identical to the 2001 condition (25 ug/l PO4).
Spokane River / Lake Spokane Dissolved Oxygen Water Quality Improvement Report Page E-8
Municipal and Industrial Facilities Existing Conditions – 2001 The core model includes time-varying, 2001 discharges from permitted point sources, based on flow and discharge quality data collected by the facilities. Natural Conditions Because municipal and industrial source water is pumped from the aquifer, municipal and industrial discharge flows for 2001 are re-routed to the nearest distributed groundwater location in the model for the No Source scenario. This eliminates the point source discharges and slightly increases the groundwater inflow to the river. TMDL Scenario The final TMDL model scenario includes the municipal discharges at 2027 design flows to account for predicted future growth, while industrial sources at current design flows. Effluent quality for the TMDL scenarios is set at the levels specified in Table 3 of the TMDL for each facility and each oxygen-demanding pollutant. All pollutant concentrations are set at a constant value for the entire March through October period. Stormwater Existing Conditions – 2001 The core model does not include explicit stormwater discharges, due to the lack of specific information for 2001. Based on the need to establish a quantified stormwater allocation in the TMDL, additional analysis has been conducted by Ecology since completion of the core model (described in Appendix K). Natural Conditions Stormwater flow is set to zero for the No Source scenario. TMDL Scenario The model scenario for the TMDL condition includes the addition of explicit stormwater discharges for both Idaho and Washington. It is not feasible to identify and include all outfall pipes in the model, so these discharges are simplified as a single pipe discharge at the downstream end of the cities of Spokane and Coeur d’Alene. The pollutant concentrations in stormwater are estimated using data supplied by the City of Spokane. The average total phosphorus concentration in this urban stormwater is estimated at 0.31 mg/l.
Spokane River / Lake Spokane Dissolved Oxygen Water Quality Improvement Report Page E-9
The TMDL allocates the existing loading from stormwater. Unlike groundwater and point sources, stormwater flow is highly variable and has a unique flow pattern each year. To develop a conservative and “generic” stormwater allocation (one not tied to low flows and random events of 2001), the daily mean flow (estimated from March to October mean precipitation) was used as a constant flow input in the model. The mean is used under the assumption that an average precipitation year could occur during a low base flow year like 2001. Combined Sewer Overflows (CSOs) Existing Conditions – 2001 CSOs, like stormwater, were not included in the core model, due to the lack of specific information for 2001 and a determination that stormwater loadings were not a significant factor in 2001 water quality conditions (compared to point sources, tributaries and groundwater). Nevertheless, during major storms in Spokane, combined sewers are expected to overflow and discharge to the river. Based on the need to establish a quantified CSOs allocation in the TMDL, additional analysis has been conducted by Ecology since completion of the core model. This analysis relies on City of Spokane estimates of the average discharge and pollutant concentrations from CSOs. Natural Conditions CSO flow is set to zero for the No Source scenario. TMDL Scenario The TMDL allocates the existing loading from CSOs. Like stormwater, CSO flow is highly variable and has a unique flow pattern each year, and the TMDL scenario includes the daily mean flow (scaled to the March to October period from the city’s annual estimates). The mean is used under the assumption that an average precipitation year could occur during a low base flow year like 2001. Sediment Oxygen Demand (SOD) Decomposition of organic matter on the bottom of a waterbody exerts a demand on oxygen in the overlying water (sediment oxygen demand, or SOD). Human-caused activities, including discharges of nutrients that increase algal biomass, can increase SOD over the long term. The long-term change in the background SOD due to changes in nutrient discharges cannot be simulated by the water quality model, which applies SOD as a constant, user-defined boundary condition for the simulation period. Existing Conditions - 2001
Spokane River / Lake Spokane Dissolved Oxygen Water Quality Improvement Report Page E-10
SOD values can range from 0.06 to 2 g/m2 per day (Chapra 1997). The calibration process for the core model (2001) of the Spokane River culminated in SOD estimates in Lake Spokane ranging from 0.1 to 0.6 g/m2 per day. Given that human-caused discharges of nutrients are increasing the algal biomass in Lake Spokane, the estimated 2001 SOD does not reflect the natural condition (i.e., hypothethical SOD under conditions of zero anthropogenic discharge of nutrients). Natural Conditions Consistent with Washington’s water quality standard, which calls for “near-natural” dissolved oxygen concentrations in Lake Spokane, Ecology and EPA believe it is appropriate to scale back the estimated 2001 SOD levels to lower levels for the TMDL scenarios. The precise SOD level associated with a 0.2 mg/l reduction in natural DO concentrations cannot be ascertained. Based on best professional judgment, Ecology decided to employ the value (0.25 g/m2 per day) used in its previous work to estimate the impact of reduced SOD levels on water column oxygen levels. For the scenarios, any segment SOD value in the 2001 model that is higher than 0.25 has been reduced to 0.25 (lower levels are unchanged). The higher SOD values were generally assigned to the deepest segments (corresponding to lower velocities and higher settling). TMDL Scenario Similar to the NO SOURCE scenario, the TMDL scenario is run with SOD set to 0.25 g/m2 per day. This SOD value has no effect on the TMDL allocations, because the TMDL is focused not on absolute DO values but rather the change to natural DO values. The “dial back” is simply a boundary condition adjustment to align the TMDL scenarios with the intent of the water quality standard and to provide more realistic estimates of future expected DO conditions (with reduced SOD) compared to current DO conditions. Riverine and Reservoir Analysis In addition to defining the model inputs for the scenarios, the agencies also specified the model outputs needed for TMDL development. The agencies specified the locations in the river where predictions for dissolved oxygen and other parameters were needed, as well as the frequency of outputs (hourly, daily) and any averaging over time and space of model results. Riverine Analysis The approach used to evaluate water quality conditions at a benchmark location in the riverine section of Lake Spokane, downstream of anthropogenic sources, but upstream of the lake conditions on Lake Spokane. Segments 157 (confluence of Spokane and Little Spokane Rivers within impoundment) and 154 (free-flowing outflow from Nine Mile Dam) were considered as potential benchmark locations.
Spokane River / Lake Spokane Dissolved Oxygen Water Quality Improvement Report Page E-11
Model simulations indicate that segment 157 is affected by elevated algal activity in the lake, however, so segment 154 was chosen as the riverine benchmark. Segment 154 is not affected by Long Lake productivity; it is, however, located upstream of the Little Spokane tributary. In order to evaluate the overall quality of the river inputs to the reservoir under TMDL conditions, model predictions for segment 154 were averaged (flow-weighted) with the boundary inflow from the Little Spokane River. Reservoir Analysis The predictions for the reservoir were a particular focus of concern, because the reservoir is the primary focus of the TMDL. Furthermore, the agencies needed to assign responsibility for water quality improvements to Avista Corporation. The analysis of water quality impacts associated with dams is an evolving area of water quality management. The agency team considered a variety of methods of analyzing and aggregating the model output for dissolved oxygen in Lake Spokane. One method considered was the “cumulative volume” approach that was used in the Lake Whatcom TMDL analysis (Pickett and Hood, 2008). The Lake Whatcom method includes complete spatial aggregation of the model output and aggregation of the data into dissolved oxygen concentration bins. For Lake Spokane, the agency team wanted to retain the information about longitudinal variation in dissolved oxygen levels and impacts, because the depth of the reservoir and the dynamics of the oxygen balance change substantially from the transition zone to the dam. The agencies also believe there are benefits to expressing the water quality impacts and goals in terms of dissolved oxygen concentration, which directly relates to the water quality standards and aquatic life support. The cumulative volume method leads to a target expressed as the mass of the oxygen deficit. The method of processing the model output for the reservoir required a balance between (1) averaging over time and space in order to provide a reasonably simple table of results for the reservoir, and (2) retaining enough resolution to avoid the masking of impacts through averaging. The project team worked together to determine a reasonable balance for this model application. The following specifications were provided to PSU for running of scenarios:
Core Model Output Parameter for the Reservoir
– Output time step – every 4 hours – Vertical cells included in output – two options – all cells - all cells in hypolimnion (greater than or equal to 8 meters) – Compute the volume weighted average in each segment, at each time step
– Daily minimum value is the core parameter from the model
The daily minimum concentration of dissolved oxygen was then aggregated into semi-monthly (twice a month) averages for each of the 31 segments of the reservoir.
Spokane River / Lake Spokane Dissolved Oxygen Water Quality Improvement Report Page E-12
Model Uncertainty As noted above, the CE-QUAL-W2 model of the Spokane River has been extensively peer- reviewed over the years by agency and stakeholder modelers. The recent work to update and refine the model builds on the previous reviews. All of the efforts on the core model have been directed toward reducing, to the extent feasible, the level of uncertainty in the model estimates of dissolved oxygen and other water quality parameters of interest. The uncertainties in the model predictions are a result of imperfect information about the watershed conditions that affect dissolved oxygen levels and necessary simplifications in the model setup and mathematics. Sources of uncertainty include:
o Measurement data gaps non-continuous data under-sampled locations or locations not sampled at all incomplete set of water quality parameter values for discharges, river,
reservoir
o Measurement data error instrument error non-representative samples (e.g., wind data from distant location)
o Model framework uncertainty
water balance algae properties (stoichiometry, growth, death, respiration, settling) bacterial decomposition rates sediment fluxes of nutrients boundary effects on dissolved oxygen (reaeration, SOD)
A fundamental part of the model development process is the consideration of all available observational data that can provide an insight into the setup and performance of the model. Once the data have been acquired, the model development process becomes an effort to incorporate the observations into the model to the extent feasible, and to estimate model parameters that cannot be measured directly through model calibration. Numerous calibration trials are conducted in an attempt to improve the agreement between model predictions and observed conditions. The testing process eventually reaches a point of diminishing returns in terms of improvement in model performance (and reduced uncertainty). The Spokane River model has been developed in the manner described above. The agency decision to accept the model for use in developing the TMDL is based on a determination that there is little to be gained, in terms of confidence in the model estimates, through additional analysis and refinement of the model. While no water quality model can provide perfect predictions, the agencies believe the current model provides a reasonable representation of the key processes affecting dissolved oxygen in this watershed.
Spokane River / Lake Spokane Dissolved Oxygen Water Quality Improvement Report Page E-13
Public Participation and Review The project team has strived to make the technical and policy work for this project as transparent to stakeholder groups as feasible. On the technical front, the project has benefited from informal peer review through the participation of several modeling consultants retained by stakeholders. The following meetings have been held to discuss different aspects of the technical work: Date Meeting Modeling Topics Covered 09/27/08 Stakeholder meeting in
Spokane Project kick-off; concerns raised about model
12/11/08 Stakeholder meeting in Spokane
Request for workshop, early ideas on scenarios
02/13/09 Modeling workshop in Spokane
Project planning, draft QAPP, stakeholder issues, new data, model calibration
02/27/09 Stakeholder meeting in Spokane
Draft scenarios
03/14/09 Conference call for stakeholder modeling consultants
Final QAPP, status of PSU model update, new information review
03/25/09 Stakeholder meeting in Spokane
Model update results, draft scenario inputs/outputs, riverine and reservoir assessment
05/14/09 Conference call for stakeholder modeling consultants
Model calibration for 2001 and 2000, steps to finalize work on core model
05/27/09 Conference call for stakeholder modeling consultants
Specific boundary inputs for TMDL scenarios
06/25/09 Stakeholder meeting in Spokane
Final core model, TMDL scenario results
The formal comment period in the fall of 2009 offered an opportunity to comment on all aspects of the water quality modeling that supports the draft TMDL. In addition to the written documentation of this work, the agencies made all of the computer files available to stakeholders. Ecology, in consultation with EPA, has developed written responses to all of the comments received on the modeling work. As noted above, public comments led to modification of some elements of the model scenarios (there were no changes made to the core model). References Documents (See References section of TMDL for complete list)
Spokane River / Lake Spokane Dissolved Oxygen Water Quality Improvement Report Page E-14
Pickett, P., and Hood, S. “Lake Whatcom Watershed Total Phosphorus and Bacteria TMDLs. Volume 1: Water Quality Study Findings”. Washington Department of Ecology. Publication Number 08-03-024. See page 64. November 2008. Portland State University. “Spokane River Modeling Final Scenarios Report 2010”. January, 2010. Portland State University. “Spokane River Modeling Scenarios Report 2009”. August, 2009. Wells, S. and Berger, C. “Spokane River in Idaho and Washington TMDL Water Quality and Hydrodynamic Modeling: Quality Assurance Project Plan”. Portland State University. Version 2, Final. March 10, 2009. Wells, S., Berger, C., and Wells, V. “Spokane River Modeling Report 2009: Model Update and Calibration Check”. Portland State University. June, 2009. Model Files All model files related to the Lake Spokane project can be downloaded from the Portland State FTP site: http://www.ce.pdx.edu/~cewq/ftp/Spokane/drall.cgi login: "Projects" and password: "a3waspk"
Spokane River / Lake Spokane Dissolved Oxygen Water Quality Improvement Report Page F-1
Appendix F: Spokane River TMDL Oversight Committee Organization
Spokane River / Lake Spokane Dissolved Oxygen Water Quality Improvement Report Page F-2
This page is purposely left blank
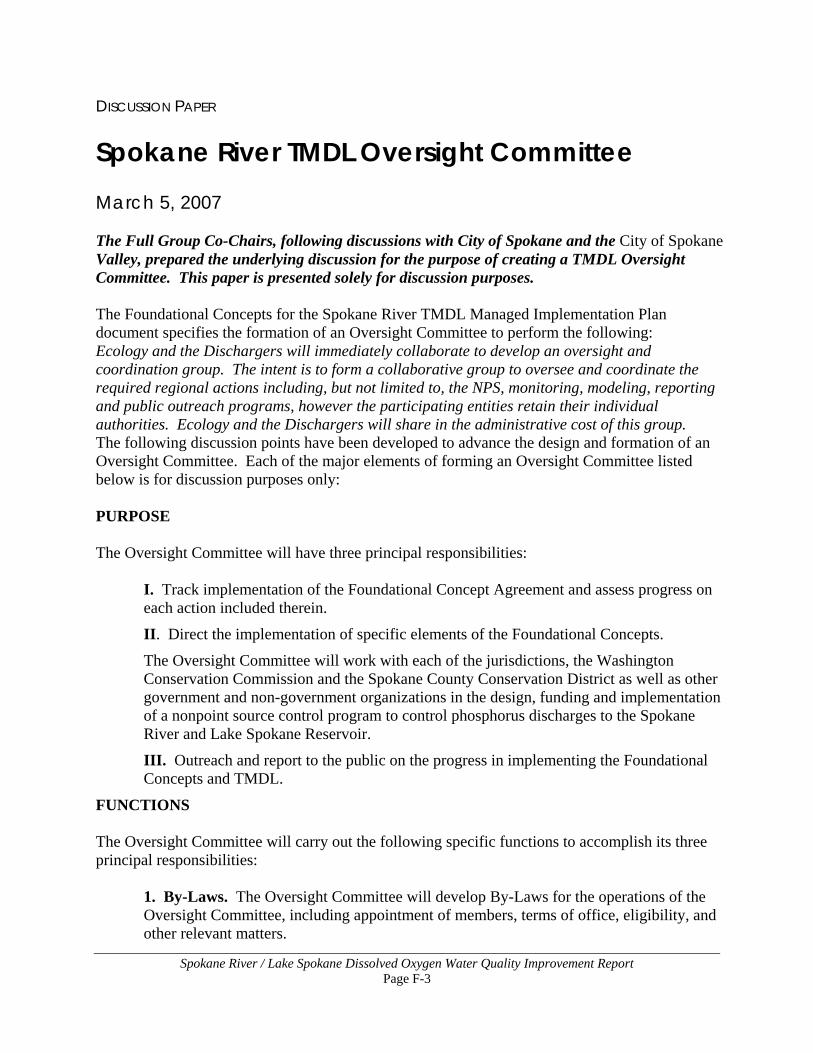
Spokane River / Lake Spokane Dissolved Oxygen Water Quality Improvement Report Page F-3
DISCUSSION PAPER
Spokane River TMDL Oversight Committee March 5, 2007 The Full Group Co-Chairs, following discussions with City of Spokane and the City of Spokane Valley, prepared the underlying discussion for the purpose of creating a TMDL Oversight Committee. This paper is presented solely for discussion purposes. The Foundational Concepts for the Spokane River TMDL Managed Implementation Plan document specifies the formation of an Oversight Committee to perform the following: Ecology and the Dischargers will immediately collaborate to develop an oversight and coordination group. The intent is to form a collaborative group to oversee and coordinate the required regional actions including, but not limited to, the NPS, monitoring, modeling, reporting and public outreach programs, however the participating entities retain their individual authorities. Ecology and the Dischargers will share in the administrative cost of this group. The following discussion points have been developed to advance the design and formation of an Oversight Committee. Each of the major elements of forming an Oversight Committee listed below is for discussion purposes only: PURPOSE The Oversight Committee will have three principal responsibilities:
I. Track implementation of the Foundational Concept Agreement and assess progress on each action included therein.
II. Direct the implementation of specific elements of the Foundational Concepts.
The Oversight Committee will work with each of the jurisdictions, the Washington Conservation Commission and the Spokane County Conservation District as well as other government and non-government organizations in the design, funding and implementation of a nonpoint source control program to control phosphorus discharges to the Spokane River and Lake Spokane Reservoir.
III. Outreach and report to the public on the progress in implementing the Foundational Concepts and TMDL.
FUNCTIONS The Oversight Committee will carry out the following specific functions to accomplish its three principal responsibilities:
1. By-Laws. The Oversight Committee will develop By-Laws for the operations of the Oversight Committee, including appointment of members, terms of office, eligibility, and other relevant matters.
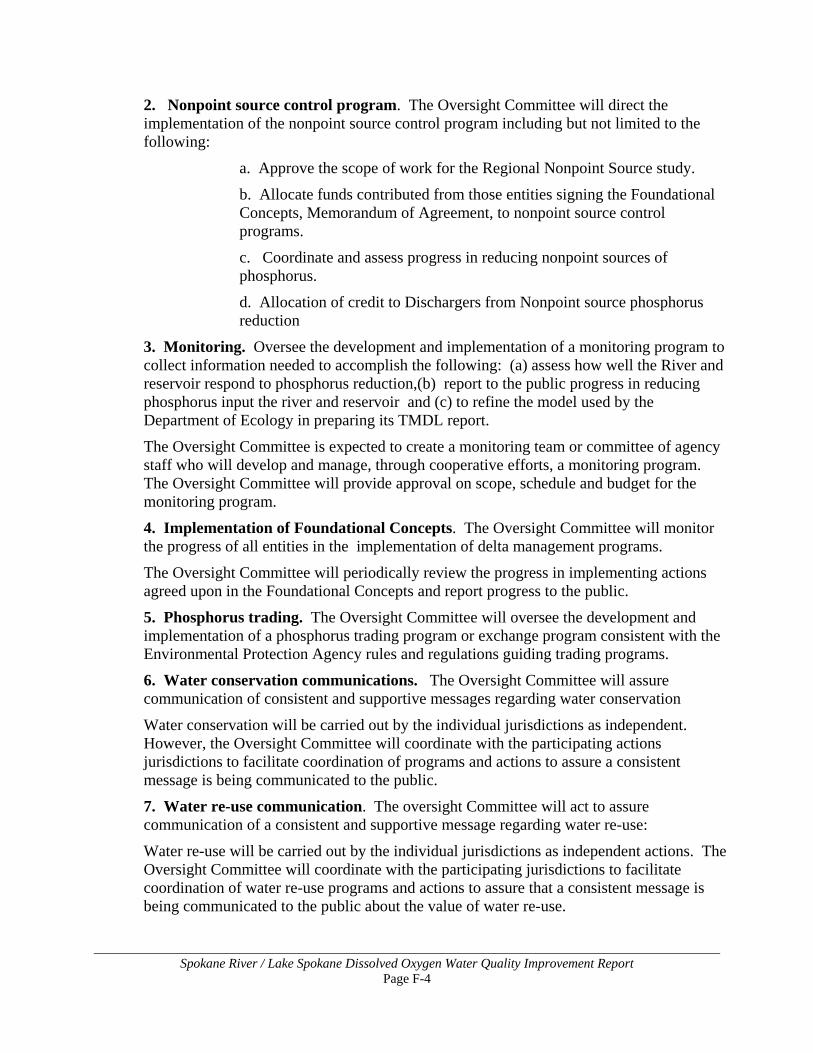
Spokane River / Lake Spokane Dissolved Oxygen Water Quality Improvement Report Page F-4
2. Nonpoint source control program. The Oversight Committee will direct the implementation of the nonpoint source control program including but not limited to the following:
a. Approve the scope of work for the Regional Nonpoint Source study.
b. Allocate funds contributed from those entities signing the Foundational Concepts, Memorandum of Agreement, to nonpoint source control programs.
c. Coordinate and assess progress in reducing nonpoint sources of phosphorus.
d. Allocation of credit to Dischargers from Nonpoint source phosphorus reduction
3. Monitoring. Oversee the development and implementation of a monitoring program to collect information needed to accomplish the following: (a) assess how well the River and reservoir respond to phosphorus reduction,(b) report to the public progress in reducing phosphorus input the river and reservoir and (c) to refine the model used by the Department of Ecology in preparing its TMDL report.
The Oversight Committee is expected to create a monitoring team or committee of agency staff who will develop and manage, through cooperative efforts, a monitoring program. The Oversight Committee will provide approval on scope, schedule and budget for the monitoring program.
4. Implementation of Foundational Concepts. The Oversight Committee will monitor the progress of all entities in the implementation of delta management programs.
The Oversight Committee will periodically review the progress in implementing actions agreed upon in the Foundational Concepts and report progress to the public.
5. Phosphorus trading. The Oversight Committee will oversee the development and implementation of a phosphorus trading program or exchange program consistent with the Environmental Protection Agency rules and regulations guiding trading programs.
6. Water conservation communications. The Oversight Committee will assure communication of consistent and supportive messages regarding water conservation
Water conservation will be carried out by the individual jurisdictions as independent. However, the Oversight Committee will coordinate with the participating actions jurisdictions to facilitate coordination of programs and actions to assure a consistent message is being communicated to the public.
7. Water re-use communication. The oversight Committee will act to assure communication of a consistent and supportive message regarding water re-use:
Water re-use will be carried out by the individual jurisdictions as independent actions. The Oversight Committee will coordinate with the participating jurisdictions to facilitate coordination of water re-use programs and actions to assure that a consistent message is being communicated to the public about the value of water re-use.
Spokane River / Lake Spokane Dissolved Oxygen Water Quality Improvement Report Page F-5
8. Report to the public. The Oversight Committee will report on a biennial basis, through a major public conference, actions taken and progress made in reducing the discharge of phosphorus and improving the dissolved oxygen in the Spokane River and Lake Spokane Reservoir.
FORMATION The Oversight Committee will be formed through an Interlocal Cooperation Act Agreement. The Interlocal Agreement will provide for the following operating bodies of the Oversight Committee:
1. An Executive Board will be formed from the municipal agencies with discharge permits to manage the affairs of the Oversight Committee. The Executive Board will be composed of Elected Officials from the City of Spokane, Spokane County and Liberty Lake Sewer and Water District, as well as an At-Large Member who may serve as the Chair.
2. Technical Committees will be used to advise the Oversight Committee on matters of a technical nature. Additional, short term, technical Committees will be formed as needed and serve the Oversight Committee.
3. A Standing Advisory committee will be formed for the purpose of advancing the goals of the Oversight Committee as described in the Foundational Concept.
4. Special Advisory Bodies will be created to provide advice and guidance to the Oversight Committee as needed on unique or special topics.
5. Oversight Committee staff will be independent employees of the Oversight Committee. Staff will report to the Executive Board.
COMPOSITION
The Oversight Committee will be composed of one member from each (names provided by each entity, except the At Large Member) of the following organizations:
1. City of Spokane 2. Spokane County 3. City of Spokane Valley 4. Liberty Lake Water and Sewer District 5. One at-large member (to be defined). An “At-large” member will be nominated by
the Executive Committee and approved by the Oversight Committee. The At-large member may serve as the Chair of the Oversight Board.
6. Washington State Department of Ecology The Standing Advisory committee shall consist of approximately 11 members, with nominees submitted by each group, and the appointment made by the Oversight Committee. It may be composed of representatives from the following organizations and/or interest groups:
1. Idaho Department of Environmental Quality
Spokane River / Lake Spokane Dissolved Oxygen Water Quality Improvement Report Page F-6
2. Spokane Tribe of Indians
3. Stevens County
4. City of Coeur d’Alene
5. Environmental interest groups
6. Conservation District(s)
7. Avista
8. Inland Empire Paper
9. Kaiser Aluminum
10. Others as may be recommended, and approved by the Oversight Committee
Representatives named by their respective organization and/or interest group to participate on the Advisory committee will be expected to participate fully in Advisory committee work on a timely basis. Technical committees will be formed by the Oversight Committee as needed to provide advice and guidance on special topics. The technical committees will be composed of individuals with expertise and/or special knowledge and experience in the topics to be addressed. Special advisory bodies will be formed for time limited and defined topics as needed by the Oversight Committee. Special advisory bodies will be composed of individuals who may represent special interests, knowledge and or experience regarding the topics to be addressed. FUNDING The Oversight Committee will be funded through contributions from the participating jurisdictions.
1. Development of an Interlocal Agreement (ILA) to form the Oversight Committee will be lead, jointly, by the City of Spokane, Spokane County and the Washington Department of Ecology.
2. Seed money to fund the initial work of the Oversight Committee will be contributed from each jurisdiction, including the Washington Department of Ecology.
3. The Executive Committee will develop an initial and an on-going funding mechanism for Oversight Committee responsibilities. Legal review of initial funding sources will be done, jointly, by City of Spokane and Spokane County.
Potential funding sources include:
a. Administrative charge to the nonpoint source control program grants.
b. Creation of a Watershed Protection Authority
c. Annual assessment to each wastewater utility
d. Other
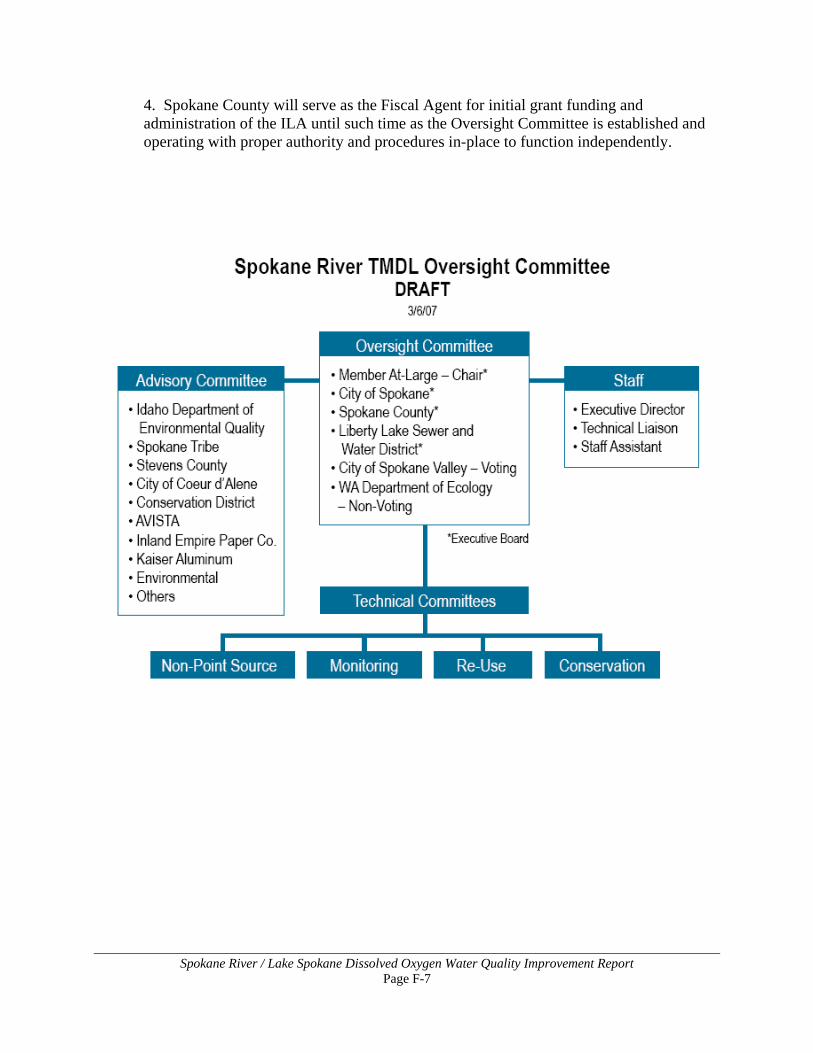
Spokane River / Lake Spokane Dissolved Oxygen Water Quality Improvement Report Page F-7
4. Spokane County will serve as the Fiscal Agent for initial grant funding and administration of the ILA until such time as the Oversight Committee is established and operating with proper authority and procedures in-place to function independently.
Spokane River / Lake Spokane Dissolved Oxygen Water Quality Improvement Report Page F-8
This page is purposely left blank
Spokane River / Lake Spokane Dissolved Oxygen Water Quality Improvement Report Page G-1
Appendix G: November 2004 Modelers Agreement
Spokane River / Lake Spokane Dissolved Oxygen Water Quality Improvement Report Page G-2
This page is purposely left blank
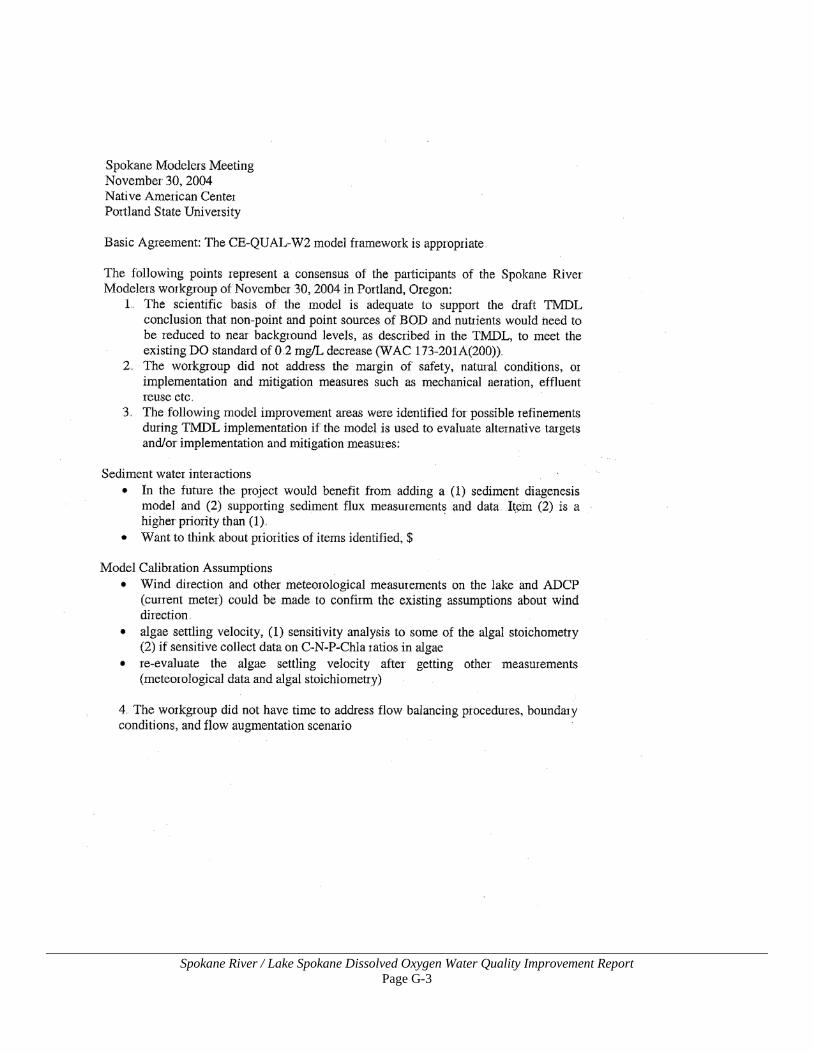
Spokane River / Lake Spokane Dissolved Oxygen Water Quality Improvement Report Page G-3
Spokane River / Lake Spokane Dissolved Oxygen Water Quality Improvement Report Page G-4
Spokane River / Lake Spokane Dissolved Oxygen Water Quality Improvement Report Page H-1
Appendix H: September 26, 2008 EPA Statement Announcing TMDL Reversal
Spokane River / Lake Spokane Dissolved Oxygen Water Quality Improvement Report Page H-2
This page is purposely left blank
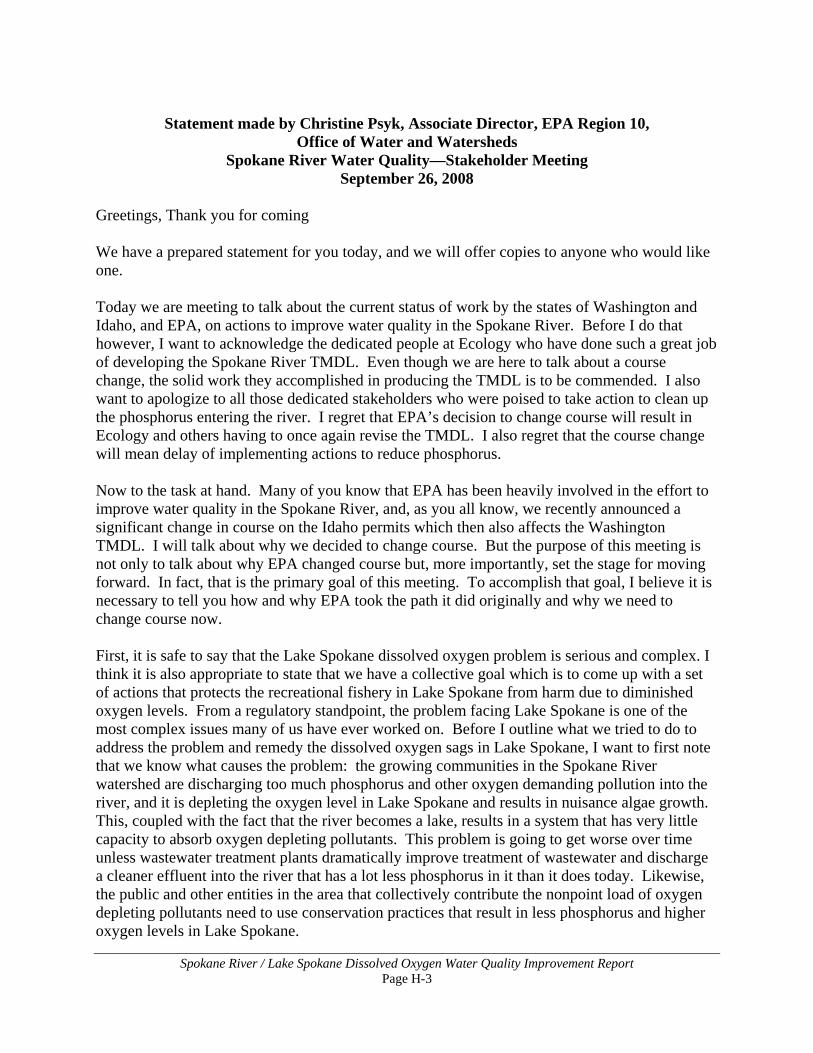
Spokane River / Lake Spokane Dissolved Oxygen Water Quality Improvement Report Page H-3
Statement made by Christine Psyk, Associate Director, EPA Region 10,
Office of Water and Watersheds Spokane River Water Quality—Stakeholder Meeting
September 26, 2008 Greetings, Thank you for coming We have a prepared statement for you today, and we will offer copies to anyone who would like one. Today we are meeting to talk about the current status of work by the states of Washington and Idaho, and EPA, on actions to improve water quality in the Spokane River. Before I do that however, I want to acknowledge the dedicated people at Ecology who have done such a great job of developing the Spokane River TMDL. Even though we are here to talk about a course change, the solid work they accomplished in producing the TMDL is to be commended. I also want to apologize to all those dedicated stakeholders who were poised to take action to clean up the phosphorus entering the river. I regret that EPA’s decision to change course will result in Ecology and others having to once again revise the TMDL. I also regret that the course change will mean delay of implementing actions to reduce phosphorus. Now to the task at hand. Many of you know that EPA has been heavily involved in the effort to improve water quality in the Spokane River, and, as you all know, we recently announced a significant change in course on the Idaho permits which then also affects the Washington TMDL. I will talk about why we decided to change course. But the purpose of this meeting is not only to talk about why EPA changed course but, more importantly, set the stage for moving forward. In fact, that is the primary goal of this meeting. To accomplish that goal, I believe it is necessary to tell you how and why EPA took the path it did originally and why we need to change course now. First, it is safe to say that the Lake Spokane dissolved oxygen problem is serious and complex. I think it is also appropriate to state that we have a collective goal which is to come up with a set of actions that protects the recreational fishery in Lake Spokane from harm due to diminished oxygen levels. From a regulatory standpoint, the problem facing Lake Spokane is one of the most complex issues many of us have ever worked on. Before I outline what we tried to do to address the problem and remedy the dissolved oxygen sags in Lake Spokane, I want to first note that we know what causes the problem: the growing communities in the Spokane River watershed are discharging too much phosphorus and other oxygen demanding pollution into the river, and it is depleting the oxygen level in Lake Spokane and results in nuisance algae growth. This, coupled with the fact that the river becomes a lake, results in a system that has very little capacity to absorb oxygen depleting pollutants. This problem is going to get worse over time unless wastewater treatment plants dramatically improve treatment of wastewater and discharge a cleaner effluent into the river that has a lot less phosphorus in it than it does today. Likewise, the public and other entities in the area that collectively contribute the nonpoint load of oxygen depleting pollutants need to use conservation practices that result in less phosphorus and higher oxygen levels in Lake Spokane.
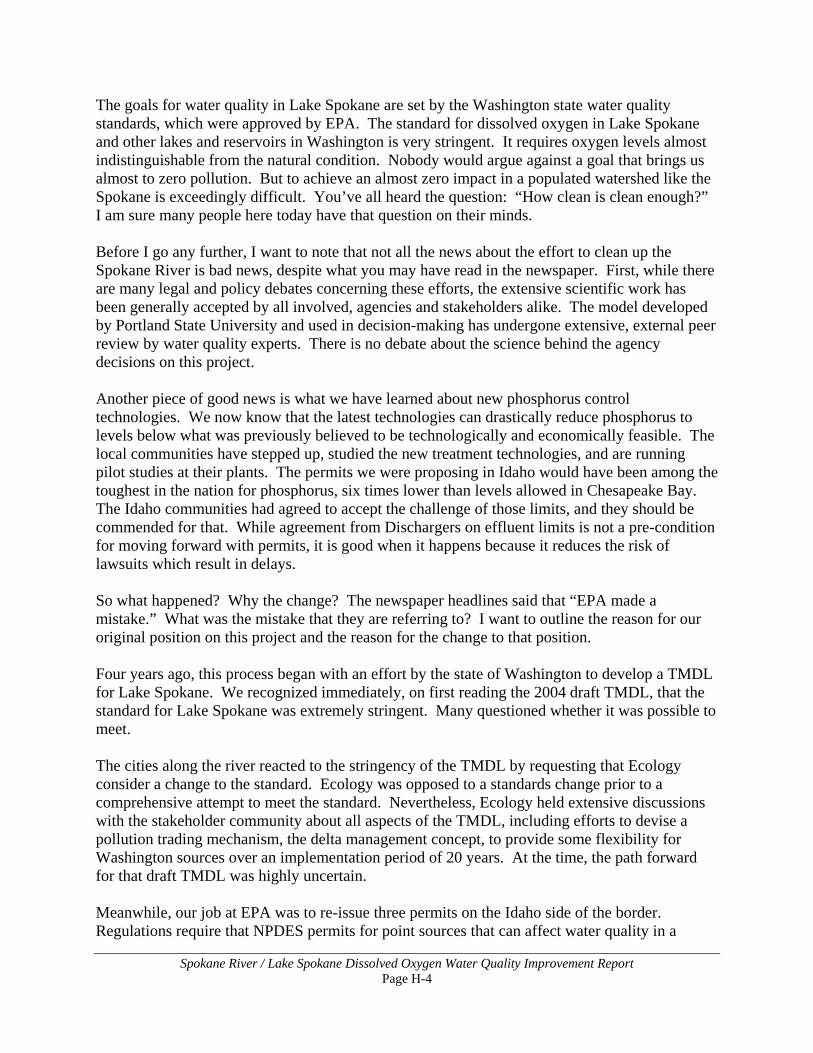
Spokane River / Lake Spokane Dissolved Oxygen Water Quality Improvement Report Page H-4
The goals for water quality in Lake Spokane are set by the Washington state water quality standards, which were approved by EPA. The standard for dissolved oxygen in Lake Spokane and other lakes and reservoirs in Washington is very stringent. It requires oxygen levels almost indistinguishable from the natural condition. Nobody would argue against a goal that brings us almost to zero pollution. But to achieve an almost zero impact in a populated watershed like the Spokane is exceedingly difficult. You’ve all heard the question: “How clean is clean enough?” I am sure many people here today have that question on their minds. Before I go any further, I want to note that not all the news about the effort to clean up the Spokane River is bad news, despite what you may have read in the newspaper. First, while there are many legal and policy debates concerning these efforts, the extensive scientific work has been generally accepted by all involved, agencies and stakeholders alike. The model developed by Portland State University and used in decision-making has undergone extensive, external peer review by water quality experts. There is no debate about the science behind the agency decisions on this project. Another piece of good news is what we have learned about new phosphorus control technologies. We now know that the latest technologies can drastically reduce phosphorus to levels below what was previously believed to be technologically and economically feasible. The local communities have stepped up, studied the new treatment technologies, and are running pilot studies at their plants. The permits we were proposing in Idaho would have been among the toughest in the nation for phosphorus, six times lower than levels allowed in Chesapeake Bay. The Idaho communities had agreed to accept the challenge of those limits, and they should be commended for that. While agreement from Dischargers on effluent limits is not a pre-condition for moving forward with permits, it is good when it happens because it reduces the risk of lawsuits which result in delays. So what happened? Why the change? The newspaper headlines said that “EPA made a mistake.” What was the mistake that they are referring to? I want to outline the reason for our original position on this project and the reason for the change to that position. Four years ago, this process began with an effort by the state of Washington to develop a TMDL for Lake Spokane. We recognized immediately, on first reading the 2004 draft TMDL, that the standard for Lake Spokane was extremely stringent. Many questioned whether it was possible to meet. The cities along the river reacted to the stringency of the TMDL by requesting that Ecology consider a change to the standard. Ecology was opposed to a standards change prior to a comprehensive attempt to meet the standard. Nevertheless, Ecology held extensive discussions with the stakeholder community about all aspects of the TMDL, including efforts to devise a pollution trading mechanism, the delta management concept, to provide some flexibility for Washington sources over an implementation period of 20 years. At the time, the path forward for that draft TMDL was highly uncertain. Meanwhile, our job at EPA was to re-issue three permits on the Idaho side of the border. Regulations require that NPDES permits for point sources that can affect water quality in a
Spokane River / Lake Spokane Dissolved Oxygen Water Quality Improvement Report Page H-5
downstream state have effluent limits that comply with the downstream state’s water quality standards. So, for the Idaho permits, this means that EPA has to write the permits to ensure that the effluent limits in the permits comply with both Idaho water quality standards and Washington water quality standards In attempting to comply with those regulations, we had a critical decision to make about the Idaho permits. Do we delay their issuance an unknown length of time until the Washington TMDL is complete, or do we find a way to set limits independent of the TMDL? We chose to detach the Idaho permits from the TMDL and develop a set of permit limits that we believed would be protective of water quality in both Idaho and Washington. Lake Spokane was chosen as the point of compliance for both the Idaho permits and the Washington TMDL because it is the location in the watershed that is most sensitive to nutrients. So, while on different paths, both the Idaho permits and the Washington TMDL would be protecting the same most sensitive resource, Lake Spokane. Why did we do this? Several reasons: First, we had a job to do, and it was and is to issue permits to the cities in Idaho. Second, our permits program was very unsure about the schedule of the TMDL, given the legitimate questions about whether it was possible to achieve the standard. Third, we came up with a set of limits that required installation of state-of-the-art technology. Fourth, they would be the lowest phosphorus limits in the country. Fifth, they would result in Idaho having no measureable effect on Lake Spokane dissolved oxygen; specifically, modeling showed the effect was approximately 0.15 mg/L. And sixth, remarkably, the three cities agreed to these limits. EPA set effluent limits for the Idaho permits that are so low that the effect on dissolved oxygen in Lake Spokane would be too small to measure. Concurrently, this enabled Washington in their draft TMDL to allow pollution sources in the State of Washington to decrease dissolved oxygen concentrations by the amount allowed under Washington’s water quality standard, which is 0.2 mg/L. When EPA issued the Idaho permits for public comment, we received numerous comments that took issue with the approach we used to interpret Washington’s water quality standard and the way we then set the effluents limits for the three point sources in Idaho. It was pointed out that we failed to fully take into account the cumulative contribution of both the Washington sources and the Idaho sources, as required by the revised Washington water quality standard. Taken together, the allocations for point sources and nonpoint sources in both states exceeded the .20 mg/L allowed by the standard. While the impact was predicted by the model to be too small to measure, the limits we proposed for the Idaho permits did have a mathematical impact on the DO of the lake based on the modeling. Again, that impact was around 0.15 mg/l (0.2 mg/l is considered immeasurable). We viewed that impact as being so small that Washington could consider it as virtually identical to natural background, which then allowed Ecology to develop its TMDL to reduce pollution in Washington and to give the 0.2 mg/l to the sources in Washington. While we thought this was acceptable on policy grounds, our approach left the door open to criticism that Idaho’s immeasureable impact of 0.15 mg/l, combined with an immeasureable
Spokane River / Lake Spokane Dissolved Oxygen Water Quality Improvement Report Page H-6
impact from Washington sources of 0.20 mg/l, would result in a combined impact that would be measureable. Simple addition would estimate the impact at 0.35 mg/l, but I would note here that we have never run the model with all the limits for point and nonpoint sources to estimate that precise, combined impact. So we don’t know the precise impact of the proposed Idaho permits and Washington TMDL, but clearly the number would be higher than 0.2 mg/l, and 0.2 mg/l is the allowable impact in Washington’s standard. We felt that our low phosphorus limits would satisfy the intent of the standard. For us, it met the test of “clean enough”. For others, it did not meet that test and they mounted strong opposition on legal grounds during the public comment period. Many people may think that comments they make to the government are not heard. This is not true. Public comments can really make a difference in what happens and does not happen in our environment. After a thorough review of public comment and extensive internal deliberation, we concluded that, from a legal perspective, we had erred in our interpretation of the Washington water quality standards by not considering the Idaho and Washington sources cumulatively in determining the effluent limits for the Idaho Dischargers. Therefore, under the current standards, both the TMDL and the Idaho NPDES permits need to be revised so that, taken together, all sources in Washington and Idaho are accounted for and appropriate limits set that do not exceed the .20 mg/l decrease in dissolved oxygen allowed under the Washington dissolved oxygen standard. At EPA, responding to public comments is an important job. In this case, the legal concerns about the cross-border pollution have led us to change course. What is the path forward? Frankly, we do not know what the final option will look like, but we still have three boxes to check off in our decision-making: the legal basis, the science, and the policy. Clearly, we need to change course on the legal basis for the Idaho permits and Washington TMDL. This part is straightforward: we must re-connect the Idaho and Washington sources in a single analysis that results in a combined impact less than 0.2 mg/l in Lake Spokane. The science is also straightforward: we have a good, peer-reviewed model of the system. Instead of splitting the analysis into Idaho and Washington impacts, we need to start running the model all the way from Lake Coeur d’Alene to Lake Spokane, and include all sources in those simulations. The main issue on the science side is the workload of running the model, and we will need to be efficient in going about this work. So, the legal and science aspects are fairly straightforward. The policy aspect, on the other hand, remains a complicated one. It is the same challenge we have all been dealing with for several years now. I would characterize that challenge as requiring us to grapple with tough questions on 6 topics:
1) Limits of technology: The standard pushes us beyond the capabilities of municipal treatment systems built to date.
2) Water quality trading: How can it be used to bridge the gap between what’s technologically achievable and what the standard requires?
3) Regulatory flexibility: The difficulties in making water quality standards revisions. 4) The role of FERC licensing in TMDL development.
Spokane River / Lake Spokane Dissolved Oxygen Water Quality Improvement Report Page H-7
5) Principles and considerations for allocating loads between Idaho and Washington. 6) Agency resources for modeling.
I listed the questions about the limits of technology first for a reason. At this point, the available data indicate that if all the cities along the river installed state-of-the-art treatment, the river would still exceed the 0.2 mg/l of oxygen depletion in Lake Spokane. This situation looms large over this project, and we need to find a path forward that addresses this challenge and enables us to move forward with the TMDL and the permits so that cleanup can commence and phosphorus inputs reduced. We are open to any ideas that move us forward and bring improvements on the ground as soon as possible. Thank you for your attention, and thank you for your efforts to bring cleaner water to Lake Spokane.

Spokane River / Lake Spokane Dissolved Oxygen Water Quality Improvement Report Page H-8
This page is purposely left blank
Spokane River / Lake Spokane Dissolved Oxygen Water Quality Improvement Report Page I-1
Appendix I: October 24, 2008 Ecology Interpretation of Water Quality Standards to EPA

Spokane River / Lake Spokane Dissolved Oxygen Water Quality Improvement Report Page I-2
This page is purposely left blank
Spokane River / Lake Spokane Dissolved Oxygen Water Quality Improvement Report Page I-3
Spokane River / Lake Spokane Dissolved Oxygen Water Quality Improvement Report Page I-4
Spokane River / Lake Spokane Dissolved Oxygen Water Quality Improvement Report Page I-5
Spokane River / Lake Spokane Dissolved Oxygen Water Quality Improvement Report Page I-6
Spokane River / Lake Spokane Dissolved Oxygen Water Quality Improvement Report Page J-1
Appendix J: March 24, 2009 Memo from EPA to Ecology Re: Summary of previous reports and discharge monitoring report data for wastewater treatment plants achieving low effluent phosphorus concentrations
Spokane River / Lake Spokane Dissolved Oxygen Water Quality Improvement Report Page J-2
This page is purposely left blank
Reply To: OWW – 130 March 24, 2009
Memorandum To: David Moore State of Washington, Department of Ecology Water Quality Program From: Brian Nickel Environmental Engineer US EPA Region 10, NPDES Permits Unit Subject: Summary of previous reports and discharge monitoring report data for
wastewater treatment plants achieving low effluent phosphorus concentrations
Introduction
Purpose As a member of the engineering group for the Spokane River TMDL technical team, I was tasked to provide a summary of previous reports and effluent data regarding existing wastewater treatment plants achieving low (≤ 50 µg/L) effluent phosphorus concentrations. This information is intended to be used to estimate the level of phosphorus removal that is currently being attained by processes in use at existing facilities, as a maximum monthly average concentration. I chose this measure of performance because, in general, effluent limitations for continuous discharges, whether from POTWs or other types of sources, must be expressed in terms of average monthly discharge limitations (40 CFR 122.45(d)).1 This information could be used as a factor in the development of wasteload allocations and/or a water quality trading program for point sources in the revised draft total maximum daily load (TMDL) for the Spokane River and Lake Spokane, where phosphorus loading, from all sources, must be reduced significantly from current levels in order to ensure compliance with water quality standards.
Scope This memorandum does not calculate a technology-based effluent limit for phosphorus. Rather, it is intended to inform (but not substitute for) a water quality-based analysis. Thus, this memorandum does not address the cost of attaining low effluent phosphorus concentrations, nor does it discuss the advantages, disadvantages, or design and operational considerations for the various treatment options that exist for achieving low
1 The term “average monthly discharge limitation” is defined in 40 CFR 122.2. For practical purposes, for a concentration limit, it means it is the highest allowable arithmetic average concentration measured over the course of a calendar month. The abbreviated terms “average monthly limit” or “AML” are equivalent.
2
effluent phosphorus concentrations.2 This memorandum is intended to address phosphorus removal in wastewater that is treated and discharged to surface water; wastewater re-use and land application are not addressed.
The final determination of wasteload allocations in a TMDL must ensure compliance with water quality standards, federal TMDL regulations (40 CFR Part 130), and any more stringent requirements of State law. This memorandum does not address the question of whether the levels of performance discussed herein are adequate to ensure compliance with these requirements.
This memorandum only discusses WWTPs that are, in my judgment, capable of consistently achieving an average monthly concentration of about 50 µg/L or less. I chose this threshold for several reasons. First, as discussed below, previous efforts to evaluate performance in support of the Spokane River and Lake Spokane dissolved oxygen TMDL have identified 50 µg/L as an effluent concentration that is “possibly attainable by municipal wastewater treatment plants on an average monthly basis.”3 Second, as discussed below, there are several operational full-scale WWTPs that can consistently achieve that level of performance. Third, it is well documented that nutrient loading capacity in the Spokane River is small. Finally, some companies now offer process guarantees of less than 50 µg/L.4
There are two main parts to this memorandum. The first is a summary of previous reports on this subject. The second is an analysis of effluent data for wastewater plants achieving low effluent phosphorus concentrations. This analysis was performed in order to provide a more detailed profile of performance than is generally provided by the previous works summarized in Part 1. Also, I was able to locate two additional WWTPs that produce high quality effluent, which were not discussed in the sources referenced in Part 1.
As I explain below, I am aware of three existing, full-scale wastewater treatment plants which, based on past performance and previous reports, consistently achieve an average monthly concentration of 25 µg/L, a total of five that consistently achieve an average monthly concentration of 35 µg/L and a total of eight that consistently achieve an average monthly concentration of 50 µg/L. There are isolated examples of even better performance.
Caveats The majority of the available information on this subject concerns advanced treatment at publicly owned treatment works treating primarily domestic wastewater. Therefore, this memorandum is primarily relevant to these kinds of sources.
2 EPA’s Municipal Nutrient Removal Technologies Reference Document (EPA 832-R-08-006, September 2008) provides some information about the costs of nutrient treatment and the available technologies. The Clean Water Act and its implementing requirements do not require a cost evaluation when establishing water quality-based effluent limits (CWA Section 301(b)(1)(C), 40 CFR 122.4(d), 122.44(d)). 3 See memorandum dated September 14, 2005 from Ryan Orth of Ross and Associates to Len Bramble of the Washington Department of Ecology and Lars Hendron of the City of Spokane. 4 See letter from Sean Haghighi, Vice President for Business Development, Veolia Water North America, to the Spokane County Board of County Commissioners, November 18, 2008. The letter refers to a process guarantee of 25 µg/L; no averaging period is given.
3
The data gathered specifically for this memorandum and analyzed in Part 2, as well as most of the data summarized in other sources referenced herein, are from discharge monitoring reports (DMRs) submitted by NPDES permittees as required by their respective permits. DMRs have the advantage of being public information that is readily available for review. Also, one can be reasonably certain that data summarized on DMRs reflects the results of EPA-approved analytical methods and good quality assurance and quality control procedures. Furthermore, there are severe penalties for knowingly reporting false effluent data.
However, DMRs provide only a summary of the effluent data collected during a reporting period (typically a calendar month). Typically, a DMR will provide only the average and either the maximum daily or weekly concentration and loading for the month. This makes it difficult to determine the variability (e.g. standard deviation) of the effluent data. Different permitting authorities may have different policies regarding the inclusion of “non-detect” effluent data in monthly averages. This makes it difficult to quantify performance for facilities that discharge at concentrations near or below typical laboratory detection or quantification limits. Differences in sampling frequency among different facilities may also influence the DMR data.
As stated in other sources, some WWTPs are achieving effluent phosphorus concentrations that are far below their NPDES effluent limits. These facilities may be able to achieve better performance if their permits required it. The fact that effluent limits for many facilities are significantly higher than their performance contributes to the problem of insensitive analytical methods and “non-detect,” results, because the permit provides no incentive for the discharger to use sensitive analytical methods if an analytical method providing a detection or quantification limit equal to or marginally less than the discharger’s phosphorus effluent limit can be used to demonstrate compliance.
As has been noted elsewhere (see Reynolds and Clark, 2005) the facilities achieving the lowest effluent phosphorus concentrations tend to be relatively small. The largest facility discussed in this memorandum has a design flow of 4 million gallons per day (mgd). The technologies used to attain low effluent phosphorus concentrations at these small facilities (e.g. biological phosphorus removal, chemical addition, tertiary clarification, and filtration) can be scaled to larger facilities. However, larger facilities may face unique challenges. For example, the physical footprint of the scaled-up unit operations may be large. Also, it may be more difficult to maintain optimal operational parameters (e.g. volatile fatty acids, alkalinity, aeration/dissolved oxygen, chemical dosing, management of return streams from solids handling, etc.) at larger facilities. However, this does not necessarily mean that the level of performance demonstrated by these smaller facilities could not be achieved at larger facilities. Furthermore, with the exception of Spokane County and the City of Spokane, the POTWs discharging to the Spokane River have design flows no greater than 6 mgd (only 50% larger than the largest plant described herein).
The state of nutrient removal technology is changing and improving over time. This memorandum presents information regarding the performance of currently-operating facilities, with up to ten years of effluent data available, using proven technologies. Emerging or future technologies may provide better performance.
4
Part 1: Summary of Previous Reports This is not an exhaustive review of available literature on this subject. This section does, however, summarize the findings of several recent and relevant reports on the subject of phosphorus removal.
EPA Publications
Municipal Nutrient Removal Technologies Reference Document (Office of Wastewater Management, September 2008) The stated goal of the reference document is to “provide information that will assist local decision makers and regional and state regulators plan cost-effective nutrient removal projects for municipal wastewater treatment facilities.”5 The reference document addresses both phosphorus and nitrogen removal.
The overall conclusion of the reference document is that “(t)echnologies are available to reliably attain an annual average of 0.1 milligram per liter (mg/L) or less for (total phosphorus)….” See the reference document at Page ES-3. However, for watersheds such as the Spokane, which are very sensitive to phosphorus loading, it’s necessary to know how much “less” than 0.1 mg/L (100 µg/L) is, in fact, attainable.
The reference document provides some refinement of the attainable level of phosphorus removal in Section 2.6.3, where it states that “(s)pecial filters have proved effective in achieving low concentrations below 30 µg/L. They include the Trident filter from U.S. Filter, the Dynasand D2 advanced filtration system from Parkson, and membrane filtration processes from various manufacturers.”
The reference document mentions one facility (Brighton, Michigan) which meets a total phosphorus (TP) effluent concentration of 10 µg/L consistently. The Brighton facility uses a treatment system that combines tertiary treatment with land application and which ultimately collects and discharges the land-applied wastewater through an underdrain system. Because this system uses soil for treatment and requires a large amount of land, (25 acres per mgd treated in Brighton’s case) as a practical matter, it is very similar to wastewater land application or re-use. Therefore, the performance of the Brighton facility will not be further evaluated or discussed in this memorandum.
With the exception of the Brighton facility, the general finding of the reference document is that the best-performing technologies are capable of producing an annual average phosphorus concentration less than 30 µg/L. Specific facilities achieving an annual average (50th percentile) concentration of about 30 µg/L or less include the Pinery WWTP in Parker, Colorado (2 mgd design flow), the Lone Tree Creek WWTP in Centennial, Colorado (2.4 mgd design flow), and the Iowa Hill WWTP in Breckenridge, Colorado (1.5 mgd design flow). Based on a statistical analysis described in the reference document, these facilities had “maximum month” (92nd percentile) phosphorus concentrations of 61 ppb, 38 ppb, and 20 ppb, respectively. See the reference document at Table 2-5.
5 The reference document can be downloaded from EPA’s website at this address: http://www.epa.gov/owm/mtb/publications.htm
5
Advanced Wastewater Treatment to Achieve Low Concentration of Phosphorus (Region 10, April 2007) The advanced wastewater treatment (AWT) report presents observations of advanced wastewater treatment at 23 facilities in the United States.6 The overall finding of the AWT report is that “(c)hemical addition to wastewater with aluminum- or iron-based coagulants followed by tertiary filtration can reduce total phosphorus concentrations in the final effluent to very low levels. The total phosphorus concentrations achieved by some of these WWTPs are consistently near or below 0.01 mg/l” (see the AWT report at Page 3).
It is clear from the “Summary of Observations” table in the AWT report (Pages 7-8) that the 0.01 mg/L (10 µg/L) figure stated on Page 3 is a reference to long-term average concentrations, not to maximum monthly average concentrations. The AWT report provides only the minimum, average, and maximum of the monthly averages observed; no other statistics are reported.
NPDES effluent limits are generally expressed as average monthly discharge limitations (meaning the maximum allowable arithmetic average concentration or loading measured during a calendar month). Thus, it is more consistent with the way effluent limits are generally expressed to quantify performance using a maximum monthly average value. The facilities described in the report that have maximum monthly average phosphorus concentrations of roughly 50 µg/L or less are listed in Table 1, below.
Table 1: Best-performing WWTPs from Advanced Wastewater Treatment to Achieve Low Concentration of Phosphorus
Facility Name Capacity (mgd)
Average of Monthly Average Phosphorus Concentrations (µg/L)
Maximum Monthly Average Phosphorus Concentration (µg/L)
Breckenridge S.D., Farmers Korner WWTP, Breckenridge, CO
3 7 36
Summit County Snake River WWTP, Dillon, CO
2.6 15 40
NYC DEP-Grand Gorge STP, Roxbury, NY
0.5 <40 50
Walton WWTP, NY 1.55 <10 <60 Stamford WWTP, NY 0.5 <11 <60
For this memorandum, I have used the AWT report as a screening tool to identify wastewater treatment plants for further data collection and analysis in Part 2.
6 The report can be downloaded from EPA Region 10’s website at this address: http://yosemite.epa.gov/r10/water.nsf/Water+Quality+Standards/AWT-Phosphorus
6
Non-EPA Publications
Achieving Low Effluent Total Phosphorus Concentrations: How Low Can We Go? (Stantec, Inc.) Stantec is a large (10,000 employees) design and consulting firm headquartered in Edmonton, Alberta, Canada and founded in 1954.7,8
This white paper provides a review of the phosphorus removal capability of four WWTPs in the United States to assess the capability of full scale WWTPs to consistently achieve very low effluent TP concentrations, in response to proposals of effluent phosphorus limits less than 100 µg/L in Ontario, Canada.
The four facilities described in the white paper were also included in EPA Region 10’s AWT report, discussed above. These were the Breckenridge Sanitation District’s Iowa Hill and Farmer’s Korner WWTPs, the Summit Count Snake River WWTP (all in Colorado) and the Noman M. Cole Pollution Control Plant in Fairfax, Virginia. For each plant, the white paper provides a process description and a summary of effluent data. For the three Colorado facilities, the effluent data summary covers calendar years 2002, 2003, and 2004 in graphical form. In some cases the narrative discusses only a portion of the period of record shown on the graphs. The Noman M. Cole facility does not appear to be capable of achieving a monthly average phosphorus concentration of 50 µg/L, therefore, I have not summarized its performance here. The performance of the other three facilities, as presented in the white paper, is summarized in Table 2, below.
Table 2: Summary of Performance Data Provided in Achieving Low Effluent Total Phosphorus Concentrations: How Low Can We Go?
Facility Design Rated Capacity
Ratio of Actual Flow to Capacity
Average P Concentration and Period of Record
Maximum Month P Concentration and Period of Record
Iowa Hill WWTP 3 mgd 30% 8 µg/L (2003-2004) 13 µg/L (2003-2004)a Farmer’s Korner WWTP
3 mgd 45% 7 µg/L (2003-2004) 12 µg/L (2003-2004)b
Snake River WWTP 2.6 mgd 27% 18 µg/L (2002-2004) 40 µg/L (2002-2004) Notes: a. Figure 2 of the white paper shows a maximum monthly average P concentration of about 32 µg/L in 2002. b. Figure 4 of the white paper shows a maximum monthly average P concentration of about 32 µg/L in 2002.
According to the white paper, all three of these facilities are operating at less than half of their design capacities. This may be a factor in these facilities’ good performance.
Evaluation of Exemplary WWTPs Practicing High Removal of Phosphorus (Dave Reynolds, CH2MHILL and Dave Clark, HDR, November 21, 2005) Ten facilities were included in this technical memorandum, including some of the facilities mentioned above. The technical memo includes data for the Stamford and
7 Source: http://en.wikipedia.org/wiki/Stantec_Inc. (Accessed 3/3/09) 8 Source: http://www.stantec.com/AboutUs.html (Accessed 3/3/09)
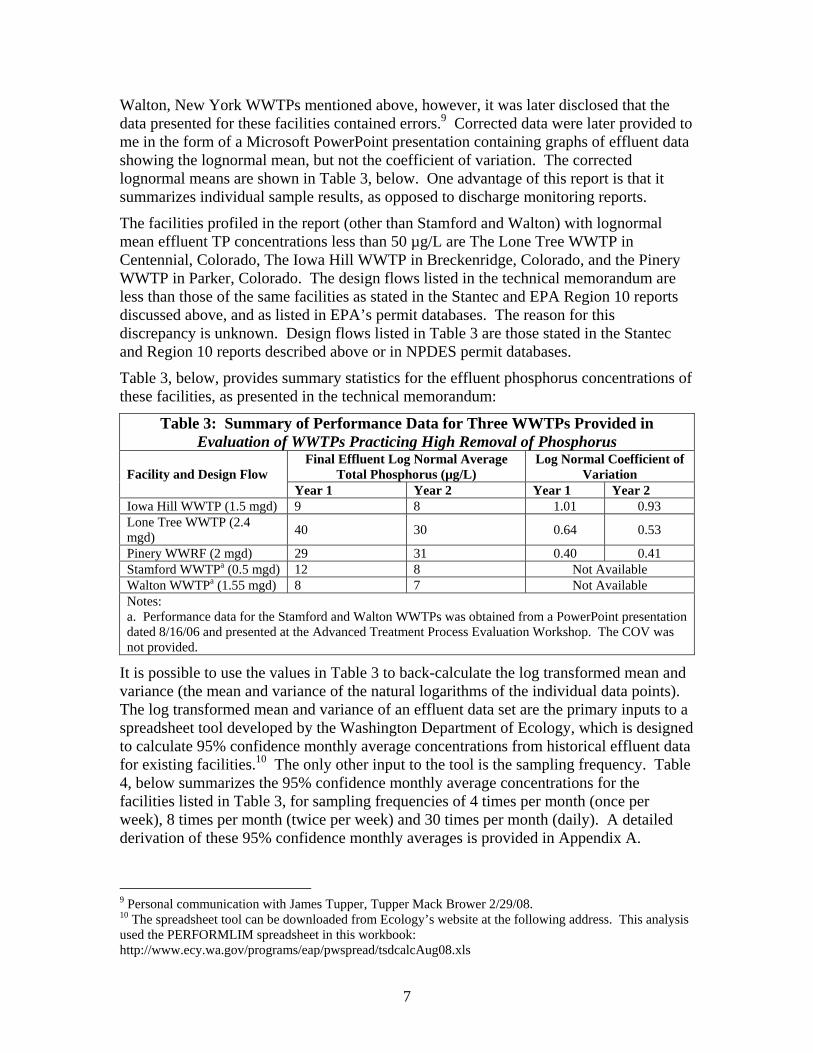
7
Walton, New York WWTPs mentioned above, however, it was later disclosed that the data presented for these facilities contained errors.9 Corrected data were later provided to me in the form of a Microsoft PowerPoint presentation containing graphs of effluent data showing the lognormal mean, but not the coefficient of variation. The corrected lognormal means are shown in Table 3, below. One advantage of this report is that it summarizes individual sample results, as opposed to discharge monitoring reports.
The facilities profiled in the report (other than Stamford and Walton) with lognormal mean effluent TP concentrations less than 50 µg/L are The Lone Tree WWTP in Centennial, Colorado, The Iowa Hill WWTP in Breckenridge, Colorado, and the Pinery WWTP in Parker, Colorado. The design flows listed in the technical memorandum are less than those of the same facilities as stated in the Stantec and EPA Region 10 reports discussed above, and as listed in EPA’s permit databases. The reason for this discrepancy is unknown. Design flows listed in Table 3 are those stated in the Stantec and Region 10 reports described above or in NPDES permit databases.
Table 3, below, provides summary statistics for the effluent phosphorus concentrations of these facilities, as presented in the technical memorandum:
Table 3: Summary of Performance Data for Three WWTPs Provided in Evaluation of WWTPs Practicing High Removal of Phosphorus
Final Effluent Log Normal Average Total Phosphorus (µg/L)
Log Normal Coefficient of Variation Facility and Design Flow
Year 1 Year 2 Year 1 Year 2 Iowa Hill WWTP (1.5 mgd) 9 8 1.01 0.93 Lone Tree WWTP (2.4 mgd)
40 30 0.64 0.53
Pinery WWRF (2 mgd) 29 31 0.40 0.41 Stamford WWTPa (0.5 mgd) 12 8 Not Available Walton WWTPa (1.55 mgd) 8 7 Not Available Notes: a. Performance data for the Stamford and Walton WWTPs was obtained from a PowerPoint presentation dated 8/16/06 and presented at the Advanced Treatment Process Evaluation Workshop. The COV was not provided.
It is possible to use the values in Table 3 to back-calculate the log transformed mean and variance (the mean and variance of the natural logarithms of the individual data points). The log transformed mean and variance of an effluent data set are the primary inputs to a spreadsheet tool developed by the Washington Department of Ecology, which is designed to calculate 95% confidence monthly average concentrations from historical effluent data for existing facilities.10 The only other input to the tool is the sampling frequency. Table 4, below summarizes the 95% confidence monthly average concentrations for the facilities listed in Table 3, for sampling frequencies of 4 times per month (once per week), 8 times per month (twice per week) and 30 times per month (daily). A detailed derivation of these 95% confidence monthly averages is provided in Appendix A.
9 Personal communication with James Tupper, Tupper Mack Brower 2/29/08. 10 The spreadsheet tool can be downloaded from Ecology’s website at the following address. This analysis used the PERFORMLIM spreadsheet in this workbook: http://www.ecy.wa.gov/programs/eap/pwspread/tsdcalcAug08.xls
8
Table 4: 95% Confidence Monthly Average Concentrations for the Iowa Hill, Lone Tree, and Pinery WWTPs
95% Confidence Monthly Average Concentrations (µg/L)
Facility COV
Log Normal Mean (µg/L)
Variance of Natural Logs
Mean of Natural Logs
Daily Sampling
2x/week Sampling
1x/week Sampling
Iowa Hill WWTP year 1 1.01 9 0.70 1.8 12 15 18 Iowa Hill WWTP year 2 0.93 8 0.62 1.8 10 13 15 Iowa Hill WWTP Average 11 14 16 Lone Tree WWTP year 1 0.64 40 0.34 3.5 48 56 64 Lone Tree WWTP year 2 0.53 30 0.25 3.3 35 40 45 Lone Tree WWTP Average 41 48 54 Pinery WWRF year 1 0.4 29 0.15 3.3 32 36 39 Pinery WWRF year 2 0.41 31 0.16 3.4 35 39 42 Pinery WWRF Average 34 38 41
Spokane River TMDL Collaboration There was a considerable data collection effort undertaken as part of the collaboration. A summary of the findings is provided in a memorandum dated September 14, 2005 from Ryan Orth of Ross and Associates to Len Bramble of the Washington Department of Ecology and Lars Hendron of the City of Spokane (the Orth memo).11
The Orth memo states that “(t)he (Technology Work Group) suggests at this time the Full Work Group consider utilizing 50 µg/L (micrograms per liter) as an average monthly effluent concentration for total phosphorus possibly attainable by municipal wastewater treatment plants on an average monthly basis….”
The Orth memo includes a graphical summary of performance data for various WWTPs across the country. The graphs are box-and-whisker plots showing the minimum, 25th percentile, median, 75th percentile, 95th percentile and maximum monthly average effluent concentrations for 43 wastewater treatment plants. Table 5, below, shows the maximum and 95th percentile monthly average phosphorus concentrations for those facilities with a 95th percentile monthly average phosphorus concentration less than 50 µg/L. These values are estimated from the box-and-whisker plot.
Table 5: WWTPs in the Orth Memo with a 95th Percentile Monthly Average Phosphorus Concentration Less Than 50 µg/L
Facility Name Capacity (mgd)
Approximate 95th Percentile Monthly Average Phosphorus Concentration (µg/L)
Approximate Maximum Monthly Average Phosphorus Concentration (µg/L)
Stamford 0.5 17 21 Stonegate Village 1.1 35 Not Available Walton 1.55 21 25 Pinery 2 42 47 Lone Tree Creek 2.4 48 51
I have used Mr. Orth’s memorandum as a screening tool to identify wastewater treatment plants for further data collection and analysis in Part 2.
11 The memorandum can be downloaded from the Spokane River TMDL Collaboration website at this address: http://www.client-ross.com/spokane-river/docs/Appendix%20B_Technology.pdf
9
Summary and Discussion of Part 1 The reports described above identify nine facilities that can consistently achieve low monthly average effluent phosphorus concentrations. These facilities are currently operating, full-scale wastewater treatment plants. Table 6, below, summarizes the maximum (or, in some cases, 95th percentile) monthly average phosphorus concentrations for all of the facilities mentioned above, as reported in or calculated from the references above:
Table 6: Summary of Maximum or 95th Percentile Monthly Average Phosphorus Concentrations
Facility Design Flow (mgd)
Maximum Monthly Average Phosphorus Concentrations (in µg/L) and reference(s)
Iowa Hill WWTPa 1.5
20 (EPA OWM, 2008) 32 (Stantec) 16 (Reynolds and Clark, 2005 and Appendix A) Average: 23
Farmer’s Korner WWTP 3 36 (EPA Region 10, 2007) 32 (Stantec) Average: 34
Lone Tree Creek WWTP 2.4
38 (EPA OWM, 2008) 54 (Reynolds and Clark, 2005 and Appendix A) 51 (Orth, 2005) Average: 48
Snake River WWTP 2.6 40 (EPA Region 10, 2007) 40 (Stantec) Average: 40
Pinery WWTP 2
61 (EPA OWM, 2008) 74 (EPA Region 10, 2007) 41 (Reynolds and Clark 2005 and Appendix A) 42 (Orth, 2005) Average : 55
Stamford WWTPb 0.5 21 (Orth, 2005) Walton WWTPb 1.55 25 (Orth, 2005) NYC DEP Grand Gorge STP 0.5 50 (EPA Region 10, 2007) Stonegate Village WWTP 1.1 35c (Orth, 2005) Median for Above Facilities N/A 35 Notes: a. The EPA Region 10 AWT report lists the maximum monthly average concentration for the Iowa Hill WWTP as 130 µg/L. Since three other references state that the maximum monthly average for this is an order of magnitude lower, the Region 10 value was not considered in the average. The discrepancy is likely due to the fact that the Iowa hill facility is not required to report monthly average phosphorus concentrations on DMRs; it is only required to report the maximum daily phosphorus concentration. It appears from a review of DMR data for the Iowa Hill facility that the values in the AWT report represent daily maximum values, not average monthly values. b. The Stamford and Walton facilities are also mentioned in the EPA Region 10 (2007) and Orth documents, but the maximum monthly average concentration is given as a “less than” value (see Table 1). c. 95th Percentile
These values may, in some cases, represent pessimistic estimates of the levels of phosphorus removal that are consistently achieved. For example, while I have used 32 µg/L as the maximum monthly average phosphorus concentration from the Stantec white paper for the Iowa Hill and Farmer’s Korner WWTPs in Table 6, these facilities were
10
able to consistently achieve maximum monthly average phosphorus concentrations less than 15 µg/L for a two year period (see Table 2, above).
Table 6 shows that the nine high-performing facilities described above consistently achieve monthly average phosphorus concentrations between about 21 and 55 µg/L, with a median of 35 µg/L. In other words, of these nine facilities, it appears from the information provided in the documents referenced above that five consistently achieve a concentration of 35 µg/L (Stonegate Village, Stamford, Walton, Farmer’s Korner, and Iowa Hill).
Part 2: Analysis of Effluent Data For each of the nine facilities listed in Table 6, above, I attempted to obtain effluent (DMR) data from EPA’s computer databases, the Permits Compliance System (PCS) and the Integrated Compliance Information System (ICIS). These data are available to the public through EPA’s web-based Envirofacts Warehouse.12 I was able to obtain meaningful effluent data for all but the Iowa Hill facility, which only reports a maximum daily concentration for the month, and the total annual phosphorus load (pounds per year). However, I was also able to obtain effluent data for two additional WWTPs exhibiting performance similar to those listed in Table 6 (the Indian River County Utilities West Regional WWTF in Vero Beach, Florida and the Parker Water and Sanitation District WWTP in Parker, Colorado). Design flows of these facilities range from 0.5 to 4.0 mgd.
Table 7 provides summary statistics (percentiles, averages) and the percentage of the time the average monthly concentrations are less than or equal to certain concentrations, as well as the required sampling frequency (if known), for each facility.
Discussion
Changes in Effluent Limits and Outlying Values If a stringent phosphorus effluent limit took effect in a facility’s permit at a certain time, in some cases, I restricted the data that I included in the analysis to the period of time during which stringent effluent limits were applicable. If the effluent quality did not appear to change as a result of the new effluent limit, I did not exclude data collected when stringent limits did not apply.
Prior to any further analysis, a plot of the monthly average data over time was prepared for each facility. Data points that appeared to be outlying values were subjected to a Grubb’s extreme value test.13 Data points that were determined to be statistical outliers at a 99% confidence level were discarded prior to any further analysis.
If there was a long period of time during which performance appeared to be significantly better than at other times, I performed a t-test to determine if the performance during that time was statistically distinct from that at other times. If the performance was statistically distinct, I included only the data for the time when better performance was
12 The URL for the Envirofacts Warehouse is http://www.epa.gov/enviro/. 13 For a description of the Grubb’s test, see http://www.graphpad.com/quickcalcs/GrubbsHowTo.cfm.
11
observed in the analysis. In every case except Stonegate Village Metro District, the data summarized below nonetheless represent a period of record of at least 36 consecutive months.
Exclusion of certain data from analysis is discussed in detail in Appendix B. Results of the statistical tests justifying the exclusion of certain data are available upon request.
“Less Than” and Zero Substitutions Monthly average data for certain facilities were sometimes reported as “less than” a certain value. Also, I assumed that a reported monthly average of zero meant that all values measured during the month were less than the analytical detection or quantification limit.
For monthly averages reported as “less than” a certain value, I assumed that these values were equal to the reported “less than” value. For example, if the value reported for a given month was “< 30 µg/L,” I assumed the monthly average concentration was actually 30 µg/L, even though it is known to be less than that. For monthly averages reported as zero, I substituted the lowest nonzero value reported for that facility.
Both of these assumptions will make the average performance of a given facility appear to be poorer than it actually is. However, these assumptions will have little to no effect on the upper percentile (75th, 90th and 95th percentile) monthly average phosphorus concentrations for a given facility, unless nearly all of the values were reported as “less than” or zero (which was the case for Walton facility). A discussion of the treatment of “less than” and zero data for each facility is provided in Appendix B.
Quantifying Performance I have identified the 95th percentile monthly average phosphorus concentration as the concentration that is consistently achieved by each facility. By definition, this means that the monthly averages were greater than this value 5% of the time. Since any violation of an effluent limit in an NPDES permit is a violation of the Clean Water Act, an argument could be made for using the maximum monthly average value instead of the 95th percentile, however, I believe the use of the 95th percentile is appropriate for the following reasons:
• A facility that achieves compliance with an effluent limit 95% of the time would likely be a low priority for an enforcement action, particularly for a stringent effluent limit for a non-toxic chemical. Repeated violations and violations of effluent limits for toxic chemicals would generally have a higher enforcement priority.
• In general, these facilities are achieving a level of performance that is much lower than the effluent limits in their permits (which are often greater than 100 µg/L). Facilities with permitted effluent limits that are large relative to their average performance have no incentive to consistently achieve the best possible performance. If a facility’s effluent limits were more stringent (e.g. if the limit were close to the facility’s 95th percentile discharge) the facility may be able to find and correct the cause of infrequent excursions significantly above the facility’s average performance. Using the maximum monthly average concentration to quantify performance instead
12
of the 95th percentile would mask the fact that performance is much better than the maximum monthly average, the vast majority of the time.
• In the context of determining whether a POTW is eligible for “treatment equivalent to secondary” technology-based effluent limits for BOD5 and TSS, NPDES regulations define the 95th percentile as the “effluent concentration consistently achievable through proper operation and maintenance” (40 CFR 133.101(f)).
Other measures of performance, including maximum monthly average values, are provided for information purposes in Table 7. A discussion of each facility’s data is provided in Appendix B.
Results of Part 2 The effluent data analysis in Part 2 is in general agreement with the previous reports summarized in Part 1. Two exceptions are the Stonegate Village Metro District WWTP and the Lone Tree Creek WWTP; Table 7 shows somewhat poorer performance than that estimated by previous reports for those two facilities (50 µg/L as opposed to 35 µg/L for Stonegate Village and 60 µg/L as opposed to 48 µg/L for Lone Tree). Conversely, Table 7 shows the performance of the Pinery WWTP may be somewhat better than that estimated by previous reports (47 µg/L as opposed to 55 µg/L). The phosphorus concentrations consistently achieved by the facilities listed in Table 7 (as quantified by the 95th percentile values) range from 22 – 60 µg/L.
With the exception of the Grand Gorge facility, long term average performance for all facilities is 32 µg/L or less. The Grand Gorge average is skewed upward by insensitive analytical methods and conservative handling of “less than” and zero values. The overall average performance of these exemplary facilities is 26 µg/L. This shows that, in order to consistently achieve low effluent phosphorus limits, the long term average discharge must be considerably less than the monthly average effluent limit.
Four of the ten facilities listed in Table 7 (Stamford, Walton, Farmer’s Korner, and Parker W&S) achieve a monthly average effluent concentration of 35 µg/L more than 95% of the time, based on past performance. An additional facility (Indian River County Utilities) may be able to achieve a concentration of about 35 µg/L, if effluent variability was reduced (the 90th percentile discharge for this facility was 30 µg/L).
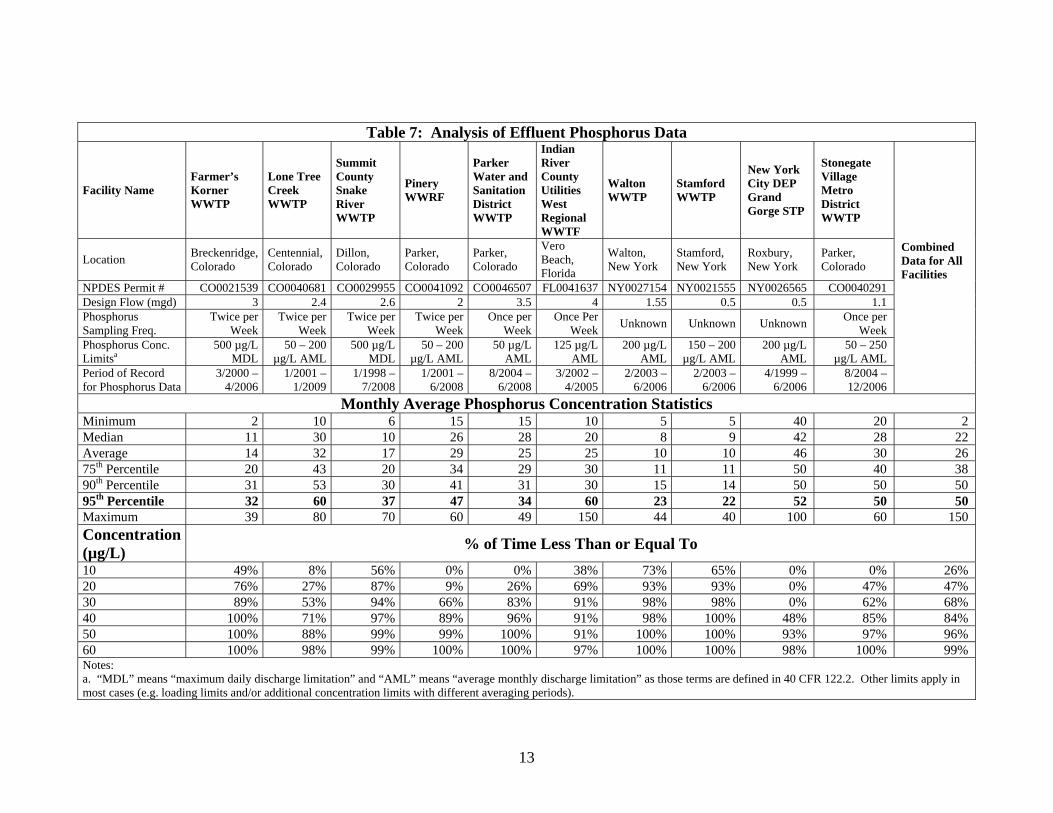
13
Table 7: Analysis of Effluent Phosphorus Data
Facility Name Farmer’s Korner WWTP
Lone Tree Creek WWTP
Summit County Snake River WWTP
Pinery WWRF
Parker Water and Sanitation District WWTP
Indian River County Utilities West Regional WWTF
Walton WWTP
Stamford WWTP
New York City DEP Grand Gorge STP
Stonegate Village Metro District WWTP
Location Breckenridge, Colorado
Centennial, Colorado
Dillon, Colorado
Parker, Colorado
Parker, Colorado
Vero Beach, Florida
Walton, New York
Stamford, New York
Roxbury, New York
Parker, Colorado
NPDES Permit # CO0021539 CO0040681 CO0029955 CO0041092 CO0046507 FL0041637 NY0027154 NY0021555 NY0026565 CO0040291 Design Flow (mgd) 3 2.4 2.6 2 3.5 4 1.55 0.5 0.5 1.1 Phosphorus Sampling Freq.
Twice per Week
Twice per Week
Twice per Week
Twice per Week
Once per Week
Once Per Week
Unknown Unknown Unknown Once per
Week Phosphorus Conc. Limitsa
500 µg/L MDL
50 – 200 µg/L AML
500 µg/L MDL
50 – 200 µg/L AML
50 µg/L AML
125 µg/L AML
200 µg/L AML
150 – 200 µg/L AML
200 µg/L AML
50 – 250 µg/L AML
Period of Record for Phosphorus Data
3/2000 – 4/2006
1/2001 – 1/2009
1/1998 – 7/2008
1/2001 – 6/2008
8/2004 – 6/2008
3/2002 – 4/2005
2/2003 – 6/2006
2/2003 – 6/2006
4/1999 – 6/2006
8/2004 – 12/2006
Combined Data for All Facilities
Monthly Average Phosphorus Concentration Statistics Minimum 2 10 6 15 15 10 5 5 40 20 2 Median 11 30 10 26 28 20 8 9 42 28 22 Average 14 32 17 29 25 25 10 10 46 30 26 75th Percentile 20 43 20 34 29 30 11 11 50 40 38 90th Percentile 31 53 30 41 31 30 15 14 50 50 50 95th Percentile 32 60 37 47 34 60 23 22 52 50 50 Maximum 39 80 70 60 49 150 44 40 100 60 150
Concentration (µg/L) % of Time Less Than or Equal To 10 49% 8% 56% 0% 0% 38% 73% 65% 0% 0% 26% 20 76% 27% 87% 9% 26% 69% 93% 93% 0% 47% 47% 30 89% 53% 94% 66% 83% 91% 98% 98% 0% 62% 68% 40 100% 71% 97% 89% 96% 91% 98% 100% 48% 85% 84% 50 100% 88% 99% 99% 100% 91% 100% 100% 93% 97% 96% 60 100% 98% 99% 100% 100% 97% 100% 100% 98% 100% 99% Notes: a. “MDL” means “maximum daily discharge limitation” and “AML” means “average monthly discharge limitation” as those terms are defined in 40 CFR 122.2. Other limits apply in most cases (e.g. loading limits and/or additional concentration limits with different averaging periods).
14
Overall Results It appears from the information presented above that a concentration of 50 µg/L is more than “possibly attainable by municipal wastewater treatment plants,” which was the conclusion of the Spokane River TMDL Collaboration Technology Workgroup in 2005. There are at least eight operating, full scale facilities that consistently produce effluent of this quality and better (see Figures 1 and 2, below). Furthermore, some facilities have a currently effective AML of 50 µg/L in their NPDES permits (Lone Tree, Parker W&S District, Pinery, and Stonegate Village).
Considered together, Parts 1 and 2 show that existing WWTPs are consistently achieving monthly average phosphorus concentrations in the range of 21 to 60 ppb. There are a few examples of even better performance (e.g. the 2003 – 2004 time frame for Iowa Hill and Farmer’s Korner, see Table 2), but it is unclear whether that level of performance would generalize to other facilities or longer time frames.
Based on past performance, three of the eleven WWTPs evaluated could consistently achieve a monthly average phosphorus concentration of 25 µg/L. These are: Stamford, Walton, and Iowa Hill (see Figure 2, below). Two additional facilities (Farmer’s Korner and Parker Water and Sanitation District, a total of five) could consistently achieve a concentration of 35 µg/L, and an additional facility (Indian River County Utilities) may be able to achieve a concentration of 35 µg/L if its effluent were less variable. Three additional facilities could consistently achieve a phosphorus concentration of 50 µg/L (Snake River, Pinery and Stonegate Village, a total of eight). The 95th percentile for all of the phosphorus data analyzed in Part 2 is 50 µg/L. Figures 1 and 2, below, provide graphical representations of the results presented in Tables 6 and 7.
Other facilities achieving low phosphorus levels may exist that were not included in this analysis. Since only four of the eleven facilities discussed have effluent limits of 50 µg/L, and none have effluent limits less than 50 µg/l, the results may not represent levels which could be achieved if attempts were made to further optimize phosphorus removal. Furthermore, phosphorus removal technology is likely to improve over time.
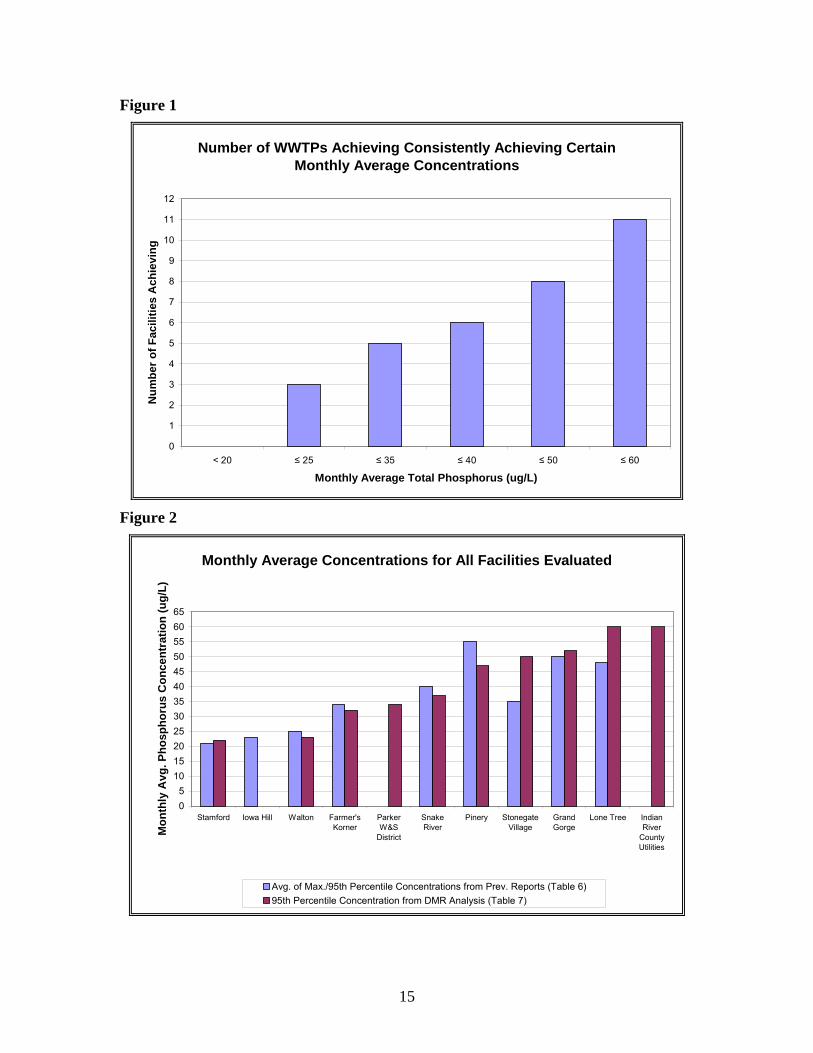
15
Figure 1
Number of WWTPs Achieving Consistently Achieving Certain Monthly Average Concentrations
0
1
2
3
4
5
6
7
8
9
10
11
12
< 20 ≤ 25 ≤ 35 ≤ 40 ≤ 50 ≤ 60
Monthly Average Total Phosphorus (ug/L)
Nu
mb
er o
f F
acil
itie
s A
chie
vin
g
Figure 2
Monthly Average Concentrations for All Facilities Evaluated
05
101520253035404550556065
Stamford Iowa Hill Walton Farmer'sKorner
ParkerW&S
District
SnakeRiver
Pinery StonegateVillage
GrandGorge
Lone Tree IndianRiver
CountyUtilities
Mo
nth
ly A
vg. P
ho
sph
oru
s C
on
cen
trat
ion
(u
g/L
)
Avg. of Max./95th Percentile Concentrations from Prev. Reports (Table 6)95th Percentile Concentration from DMR Analysis (Table 7)
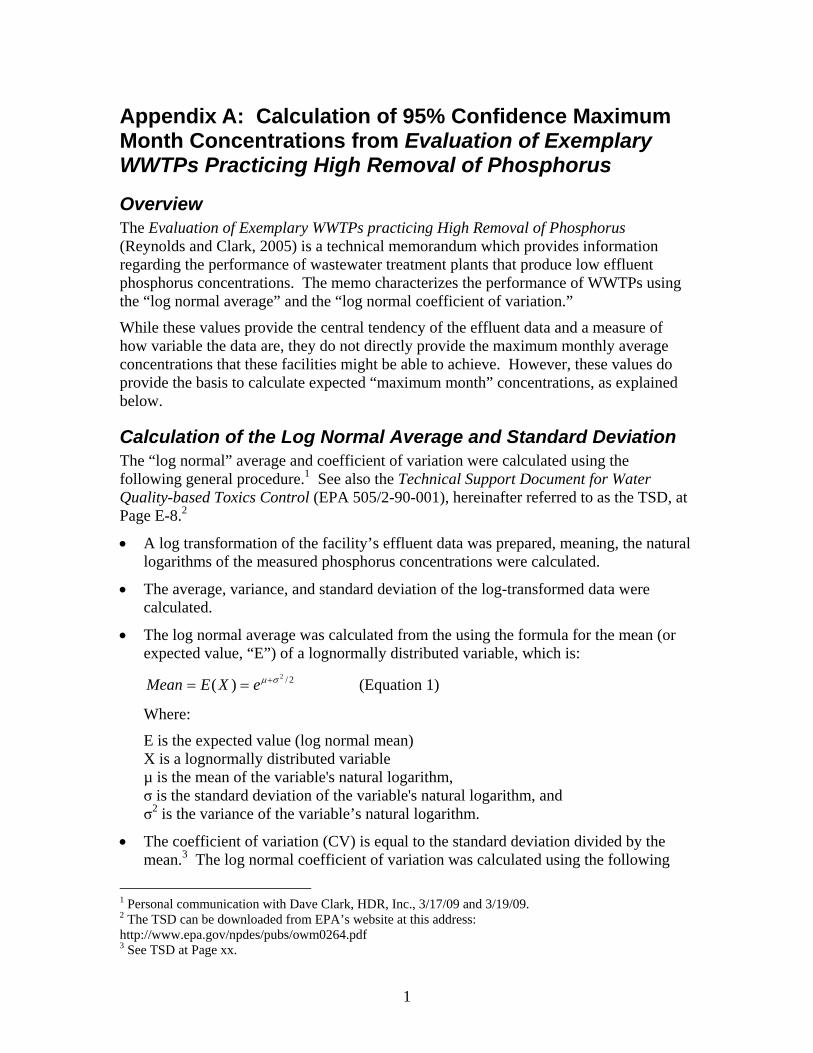
1
Appendix A: Calculation of 95% Confidence Maximum Month Concentrations from Evaluation of Exemplary WWTPs Practicing High Removal of Phosphorus
Overview The Evaluation of Exemplary WWTPs practicing High Removal of Phosphorus (Reynolds and Clark, 2005) is a technical memorandum which provides information regarding the performance of wastewater treatment plants that produce low effluent phosphorus concentrations. The memo characterizes the performance of WWTPs using the “log normal average” and the “log normal coefficient of variation.”
While these values provide the central tendency of the effluent data and a measure of how variable the data are, they do not directly provide the maximum monthly average concentrations that these facilities might be able to achieve. However, these values do provide the basis to calculate expected “maximum month” concentrations, as explained below.
Calculation of the Log Normal Average and Standard Deviation The “log normal” average and coefficient of variation were calculated using the following general procedure.1 See also the Technical Support Document for Water Quality-based Toxics Control (EPA 505/2-90-001), hereinafter referred to as the TSD, at Page E-8.2
• A log transformation of the facility’s effluent data was prepared, meaning, the natural logarithms of the measured phosphorus concentrations were calculated.
• The average, variance, and standard deviation of the log-transformed data were calculated.
• The log normal average was calculated from the using the formula for the mean (or expected value, “E”) of a lognormally distributed variable, which is:
2/2
)( σµ+== eXEMean (Equation 1)
Where:
E is the expected value (log normal mean) X is a lognormally distributed variable µ is the mean of the variable's natural logarithm, σ is the standard deviation of the variable's natural logarithm, and σ2 is the variance of the variable’s natural logarithm.
• The coefficient of variation (CV) is equal to the standard deviation divided by the mean.3 The log normal coefficient of variation was calculated using the following
1 Personal communication with Dave Clark, HDR, Inc., 3/17/09 and 3/19/09. 2 The TSD can be downloaded from EPA’s website at this address: http://www.epa.gov/npdes/pubs/owm0264.pdf 3 See TSD at Page xx.
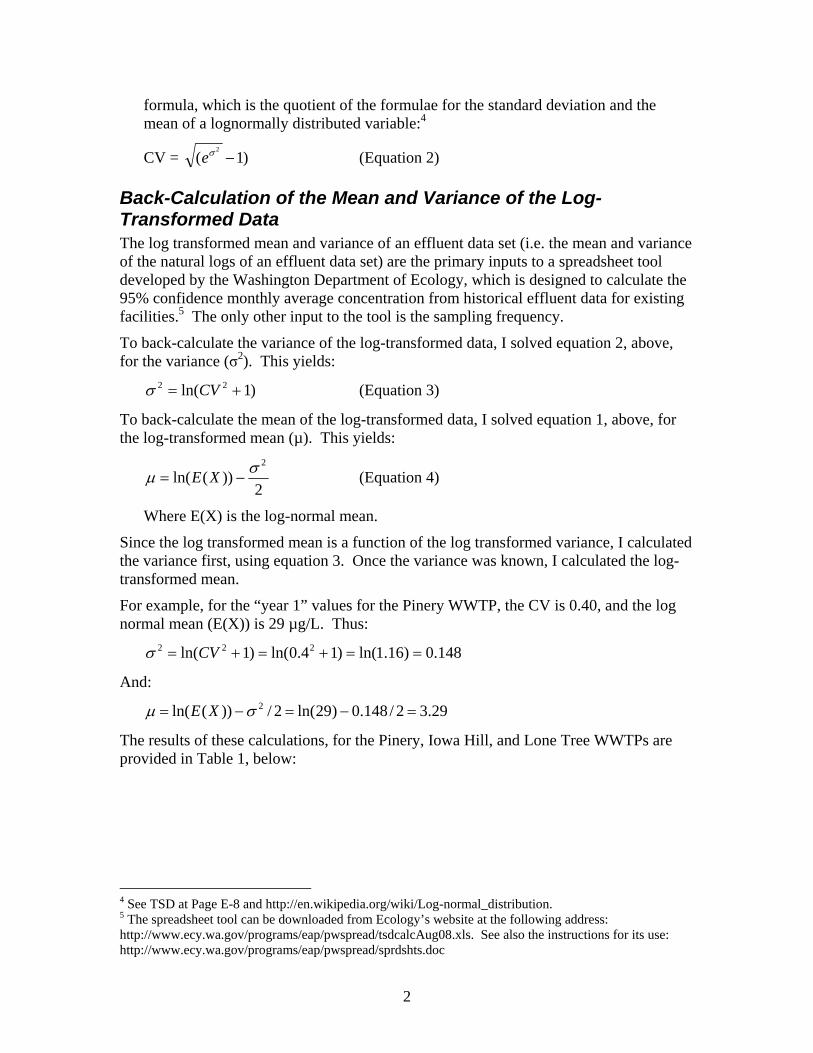
2
formula, which is the quotient of the formulae for the standard deviation and the mean of a lognormally distributed variable:4
CV = )1(2
−σe (Equation 2)
Back-Calculation of the Mean and Variance of the Log-Transformed Data The log transformed mean and variance of an effluent data set (i.e. the mean and variance of the natural logs of an effluent data set) are the primary inputs to a spreadsheet tool developed by the Washington Department of Ecology, which is designed to calculate the 95% confidence monthly average concentration from historical effluent data for existing facilities.5 The only other input to the tool is the sampling frequency.
To back-calculate the variance of the log-transformed data, I solved equation 2, above, for the variance (σ2). This yields:
)1ln( 22 += CVσ (Equation 3)
To back-calculate the mean of the log-transformed data, I solved equation 1, above, for the log-transformed mean (µ). This yields:
2))(ln(
2σµ −= XE (Equation 4)
Where E(X) is the log-normal mean.
Since the log transformed mean is a function of the log transformed variance, I calculated the variance first, using equation 3. Once the variance was known, I calculated the log-transformed mean.
For example, for the “year 1” values for the Pinery WWTP, the CV is 0.40, and the log normal mean (E(X)) is 29 µg/L. Thus:
148.0)16.1ln()14.0ln()1ln( 222 ==+=+= CVσ
And:
29.32/148.0)29ln(2/))(ln( 2 =−=−= σµ XE
The results of these calculations, for the Pinery, Iowa Hill, and Lone Tree WWTPs are provided in Table 1, below:
4 See TSD at Page E-8 and http://en.wikipedia.org/wiki/Log-normal_distribution. 5 The spreadsheet tool can be downloaded from Ecology’s website at the following address: http://www.ecy.wa.gov/programs/eap/pwspread/tsdcalcAug08.xls. See also the instructions for its use: http://www.ecy.wa.gov/programs/eap/pwspread/sprdshts.doc
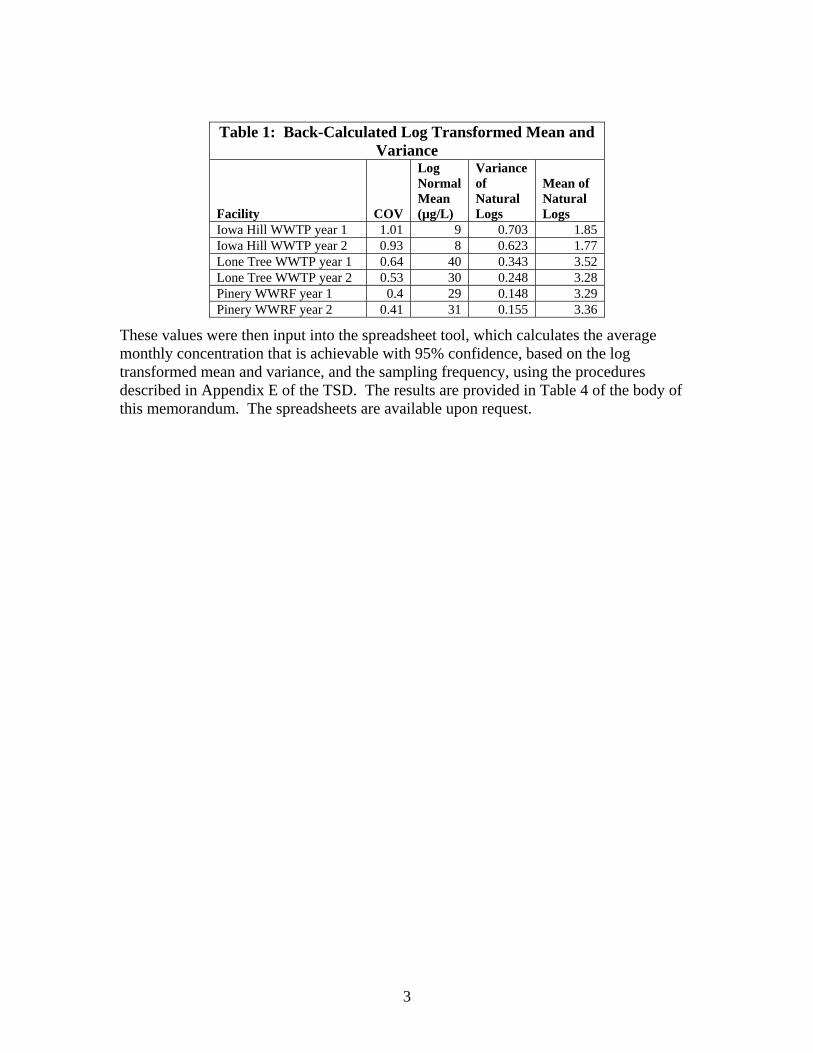
3
Table 1: Back-Calculated Log Transformed Mean and Variance
Facility COV
Log Normal Mean (µg/L)
Variance of Natural Logs
Mean of Natural Logs
Iowa Hill WWTP year 1 1.01 9 0.703 1.85 Iowa Hill WWTP year 2 0.93 8 0.623 1.77 Lone Tree WWTP year 1 0.64 40 0.343 3.52 Lone Tree WWTP year 2 0.53 30 0.248 3.28 Pinery WWRF year 1 0.4 29 0.148 3.29 Pinery WWRF year 2 0.41 31 0.155 3.36
These values were then input into the spreadsheet tool, which calculates the average monthly concentration that is achievable with 95% confidence, based on the log transformed mean and variance, and the sampling frequency, using the procedures described in Appendix E of the TSD. The results are provided in Table 4 of the body of this memorandum. The spreadsheets are available upon request.
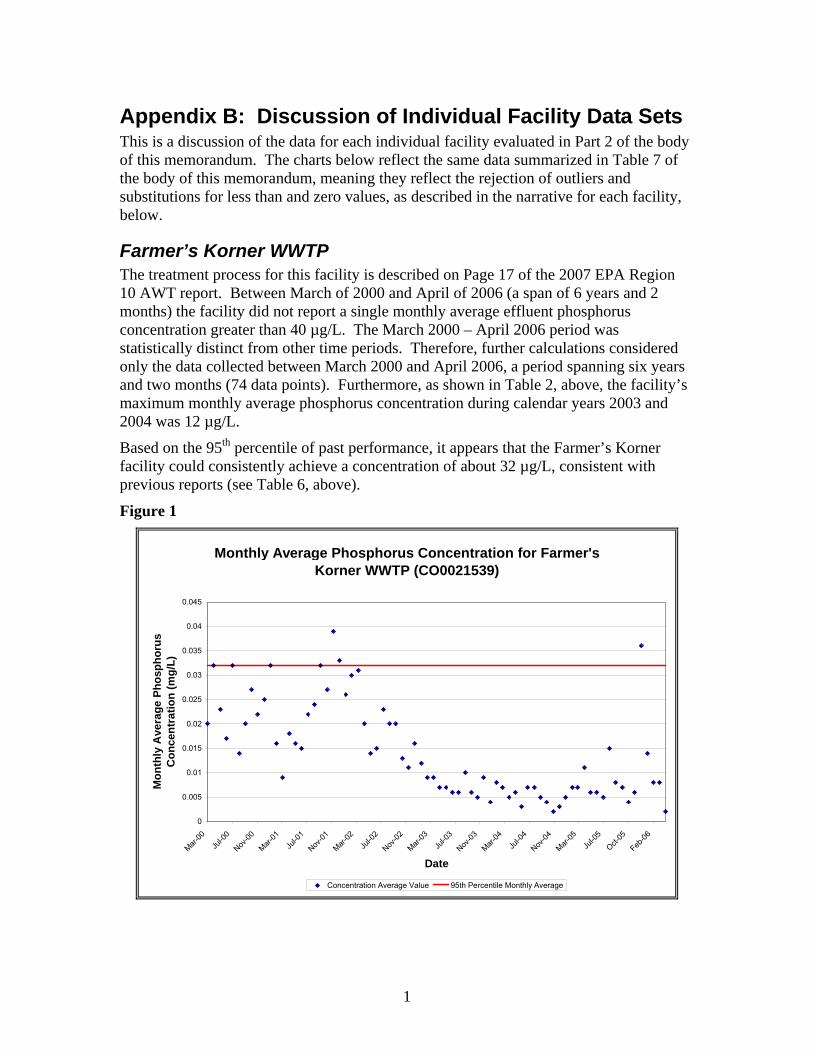
1
Appendix B: Discussion of Individual Facility Data Sets This is a discussion of the data for each individual facility evaluated in Part 2 of the body of this memorandum. The charts below reflect the same data summarized in Table 7 of the body of this memorandum, meaning they reflect the rejection of outliers and substitutions for less than and zero values, as described in the narrative for each facility, below.
Farmer’s Korner WWTP The treatment process for this facility is described on Page 17 of the 2007 EPA Region 10 AWT report. Between March of 2000 and April of 2006 (a span of 6 years and 2 months) the facility did not report a single monthly average effluent phosphorus concentration greater than 40 µg/L. The March 2000 – April 2006 period was statistically distinct from other time periods. Therefore, further calculations considered only the data collected between March 2000 and April 2006, a period spanning six years and two months (74 data points). Furthermore, as shown in Table 2, above, the facility’s maximum monthly average phosphorus concentration during calendar years 2003 and 2004 was 12 µg/L.
Based on the 95th percentile of past performance, it appears that the Farmer’s Korner facility could consistently achieve a concentration of about 32 µg/L, consistent with previous reports (see Table 6, above).
Figure 1
Monthly Average Phosphorus Concentration for Farmer's Korner WWTP (CO0021539)
0
0.005
0.01
0.015
0.02
0.025
0.03
0.035
0.04
0.045
Mar-00
Jul-0
0
Nov-00
Mar-01
Jul-0
1
Nov-01
Mar-02
Jul-0
2
Nov-02
Mar-03
Jul-0
3
Nov-03
Mar-04
Jul-0
4
Nov-04
Mar-05
Jul-0
5
Oct-05
Feb-06
Date
Mo
nth
ly A
vera
ge
Ph
osp
ho
rus
Co
nce
ntr
atio
n (
mg
/L)
Concentration Average Value 95th Percentile Monthly Average
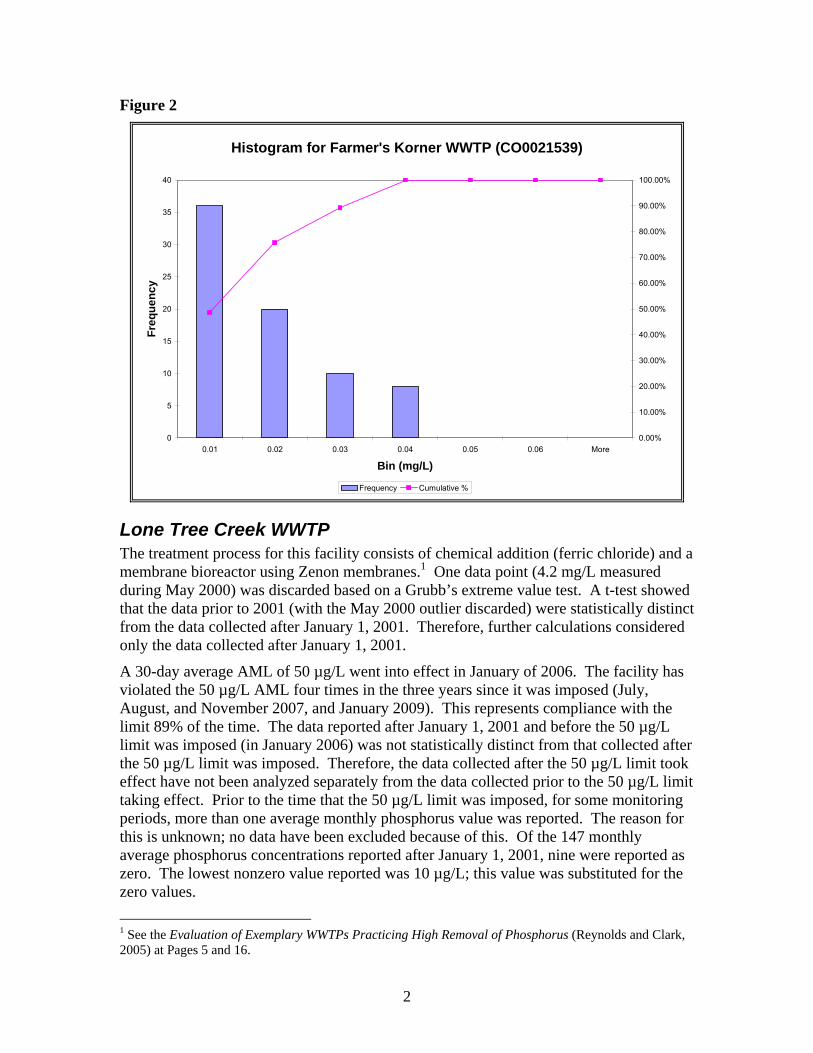
2
Figure 2
Histogram for Farmer's Korner WWTP (CO0021539)
0
5
10
15
20
25
30
35
40
0.01 0.02 0.03 0.04 0.05 0.06 More
Bin (mg/L)
Fre
qu
ency
0.00%
10.00%
20.00%
30.00%
40.00%
50.00%
60.00%
70.00%
80.00%
90.00%
100.00%
Frequency Cumulative %
Lone Tree Creek WWTP The treatment process for this facility consists of chemical addition (ferric chloride) and a membrane bioreactor using Zenon membranes.1 One data point (4.2 mg/L measured during May 2000) was discarded based on a Grubb’s extreme value test. A t-test showed that the data prior to 2001 (with the May 2000 outlier discarded) were statistically distinct from the data collected after January 1, 2001. Therefore, further calculations considered only the data collected after January 1, 2001.
A 30-day average AML of 50 µg/L went into effect in January of 2006. The facility has violated the 50 µg/L AML four times in the three years since it was imposed (July, August, and November 2007, and January 2009). This represents compliance with the limit 89% of the time. The data reported after January 1, 2001 and before the 50 µg/L limit was imposed (in January 2006) was not statistically distinct from that collected after the 50 µg/L limit was imposed. Therefore, the data collected after the 50 µg/L limit took effect have not been analyzed separately from the data collected prior to the 50 µg/L limit taking effect. Prior to the time that the 50 µg/L limit was imposed, for some monitoring periods, more than one average monthly phosphorus value was reported. The reason for this is unknown; no data have been excluded because of this. Of the 147 monthly average phosphorus concentrations reported after January 1, 2001, nine were reported as zero. The lowest nonzero value reported was 10 µg/L; this value was substituted for the zero values.
1 See the Evaluation of Exemplary WWTPs Practicing High Removal of Phosphorus (Reynolds and Clark, 2005) at Pages 5 and 16.
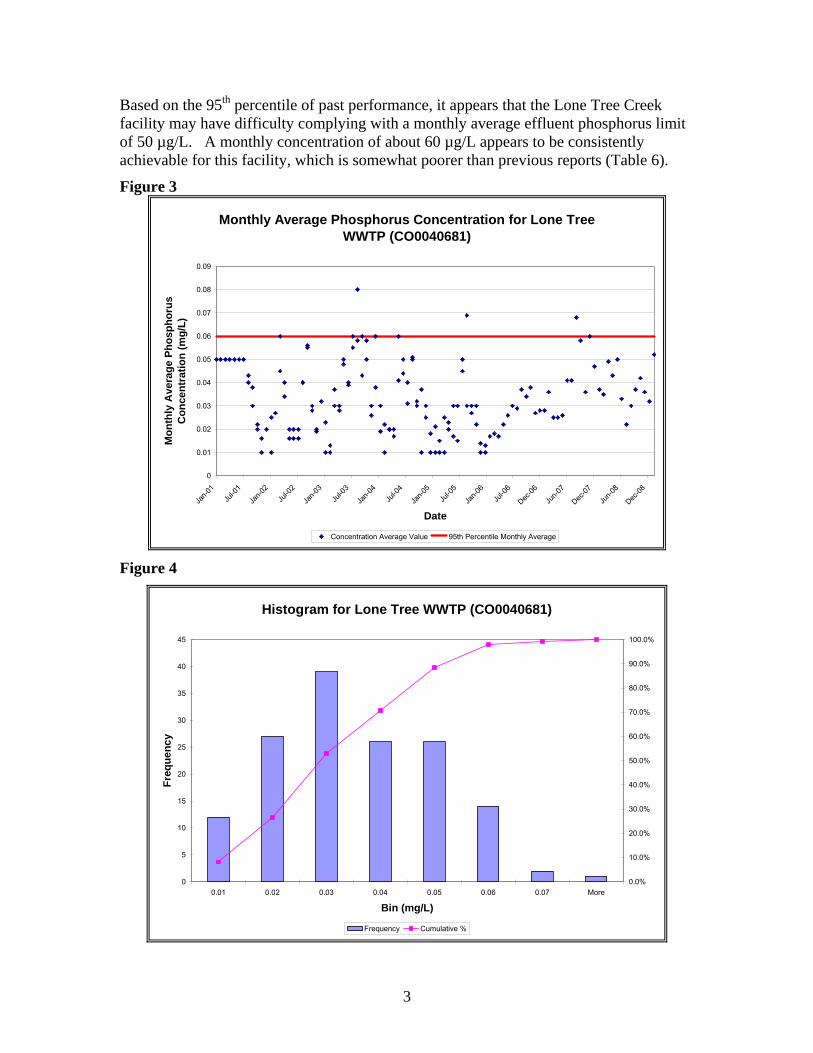
3
Based on the 95th percentile of past performance, it appears that the Lone Tree Creek facility may have difficulty complying with a monthly average effluent phosphorus limit of 50 µg/L. A monthly concentration of about 60 µg/L appears to be consistently achievable for this facility, which is somewhat poorer than previous reports (Table 6).
Figure 3
Monthly Average Phosphorus Concentration for Lone Tree WWTP (CO0040681)
0
0.01
0.02
0.03
0.04
0.05
0.06
0.07
0.08
0.09
Jan-0
1Ju
l-01
Jan-0
2Ju
l-02
Jan-0
3Ju
l-03
Jan-0
4Ju
l-04
Jan-0
5Ju
l-05
Jan-0
6Ju
l-06
Dec-06
Jun-0
7
Dec-07
Jun-0
8
Dec-08
Date
Mo
nth
ly A
vera
ge
Ph
osp
ho
rus
Co
nce
ntr
atio
n (
mg
/L)
Concentration Average Value 95th Percentile Monthly Average
Figure 4
Histogram for Lone Tree WWTP (CO0040681)
0
5
10
15
20
25
30
35
40
45
0.01 0.02 0.03 0.04 0.05 0.06 0.07 More
Bin (mg/L)
Fre
qu
en
cy
0.0%
10.0%
20.0%
30.0%
40.0%
50.0%
60.0%
70.0%
80.0%
90.0%
100.0%
Frequency Cumulative %
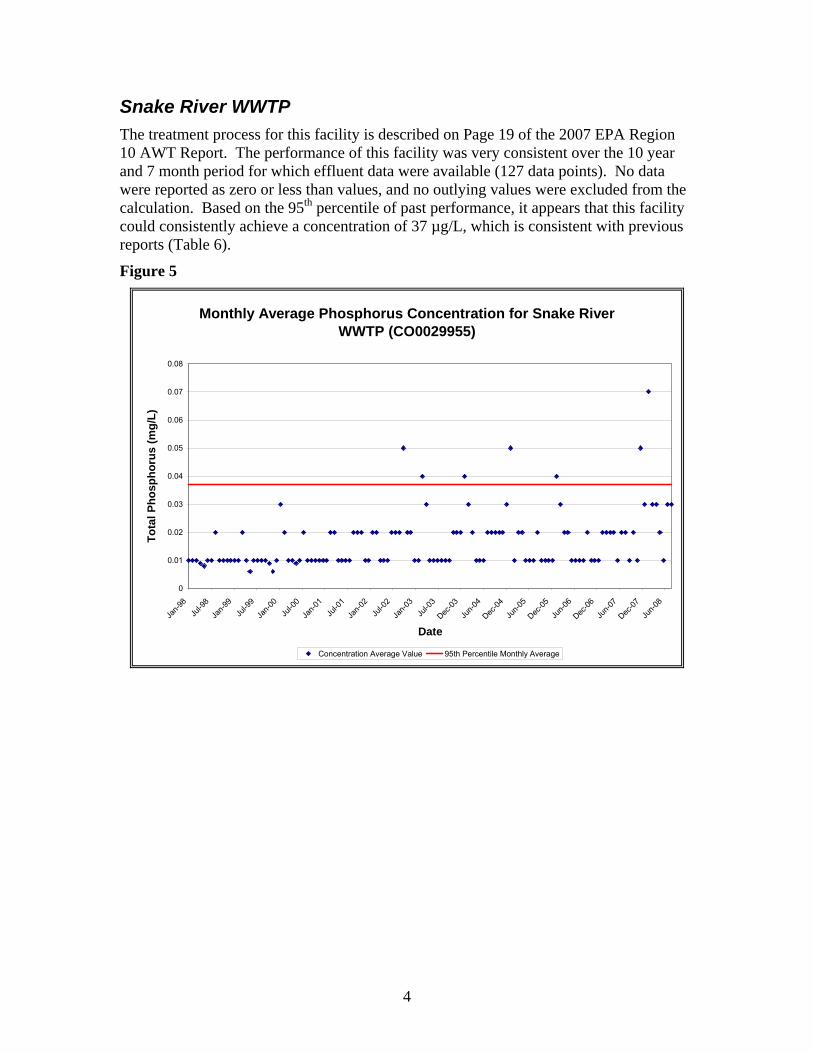
4
Snake River WWTP The treatment process for this facility is described on Page 19 of the 2007 EPA Region 10 AWT Report. The performance of this facility was very consistent over the 10 year and 7 month period for which effluent data were available (127 data points). No data were reported as zero or less than values, and no outlying values were excluded from the calculation. Based on the 95th percentile of past performance, it appears that this facility could consistently achieve a concentration of 37 µg/L, which is consistent with previous reports (Table 6).
Figure 5
Monthly Average Phosphorus Concentration for Snake River WWTP (CO0029955)
0
0.01
0.02
0.03
0.04
0.05
0.06
0.07
0.08
Jan-9
8Ju
l-98
Jan-9
9Ju
l-99
Jan-0
0Ju
l-00
Jan-0
1Ju
l-01
Jan-0
2Ju
l-02
Jan-0
3Ju
l-03
Dec-03
Jun-0
4
Dec-04
Jun-0
5
Dec-05
Jun-0
6
Dec-06
Jun-0
7
Dec-07
Jun-0
8
Date
To
tal
Ph
osp
ho
rus
(mg
/L)
Concentration Average Value 95th Percentile Monthly Average
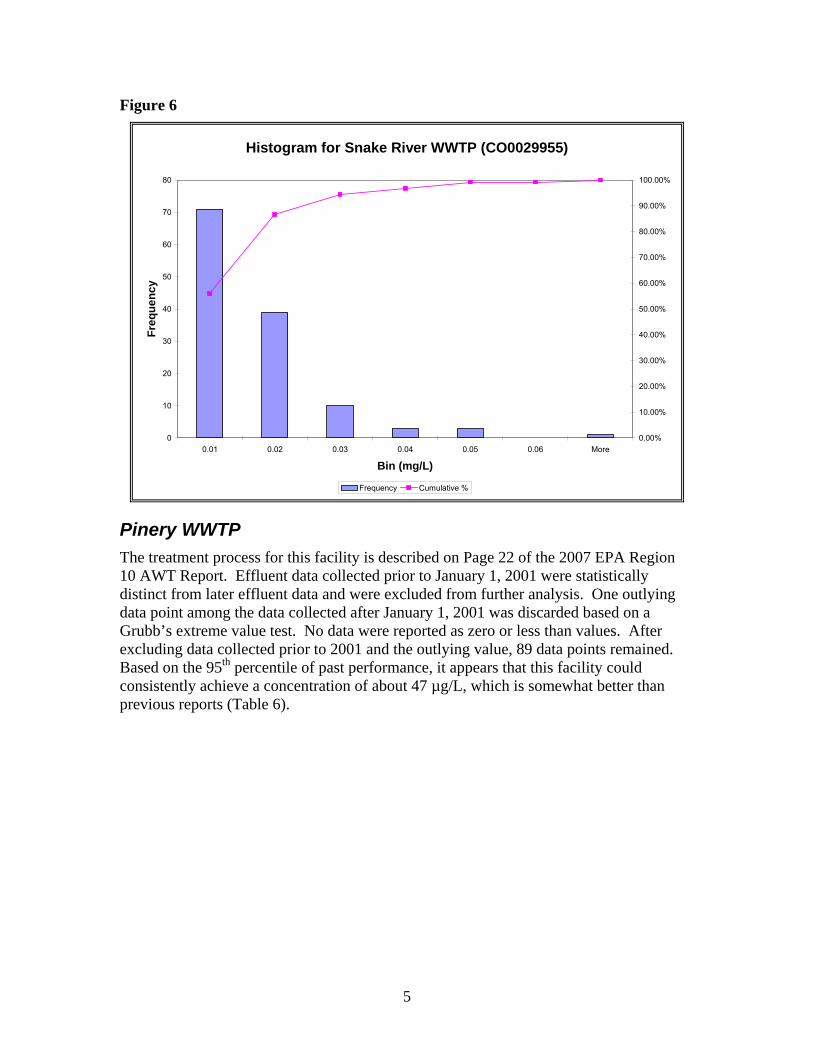
5
Figure 6
Histogram for Snake River WWTP (CO0029955)
0
10
20
30
40
50
60
70
80
0.01 0.02 0.03 0.04 0.05 0.06 More
Bin (mg/L)
Fre
qu
ency
0.00%
10.00%
20.00%
30.00%
40.00%
50.00%
60.00%
70.00%
80.00%
90.00%
100.00%
Frequency Cumulative %
Pinery WWTP The treatment process for this facility is described on Page 22 of the 2007 EPA Region 10 AWT Report. Effluent data collected prior to January 1, 2001 were statistically distinct from later effluent data and were excluded from further analysis. One outlying data point among the data collected after January 1, 2001 was discarded based on a Grubb’s extreme value test. No data were reported as zero or less than values. After excluding data collected prior to 2001 and the outlying value, 89 data points remained. Based on the 95th percentile of past performance, it appears that this facility could consistently achieve a concentration of about 47 µg/L, which is somewhat better than previous reports (Table 6).
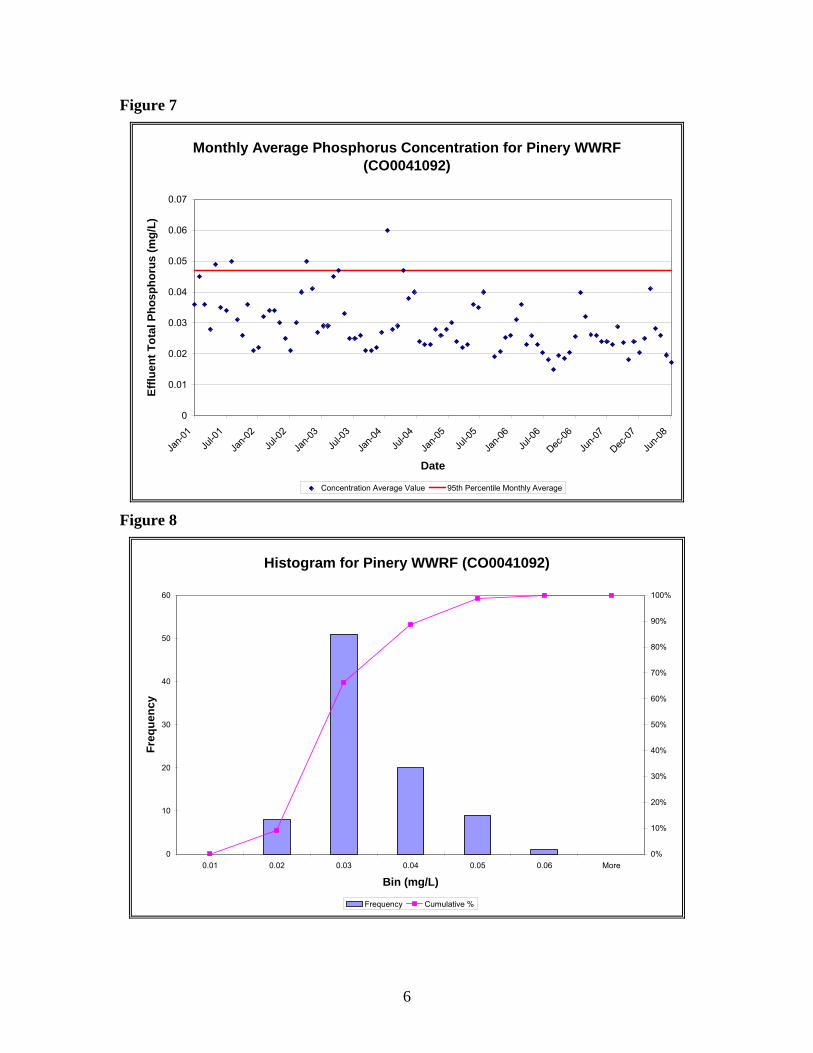
6
Figure 7
Monthly Average Phosphorus Concentration for Pinery WWRF (CO0041092)
0
0.01
0.02
0.03
0.04
0.05
0.06
0.07
Jan-0
1Ju
l-01
Jan-0
2Ju
l-02
Jan-0
3Ju
l-03
Jan-0
4Ju
l-04
Jan-0
5Ju
l-05
Jan-0
6Ju
l-06
Dec-06
Jun-0
7
Dec-07
Jun-0
8
Date
Eff
luen
t T
ota
l P
ho
sp
ho
rus
(mg
/L)
Concentration Average Value 95th Percentile Monthly Average
Figure 8
Histogram for Pinery WWRF (CO0041092)
0
10
20
30
40
50
60
0.01 0.02 0.03 0.04 0.05 0.06 More
Bin (mg/L)
Fre
qu
ency
0%
10%
20%
30%
40%
50%
60%
70%
80%
90%
100%
Frequency Cumulative %
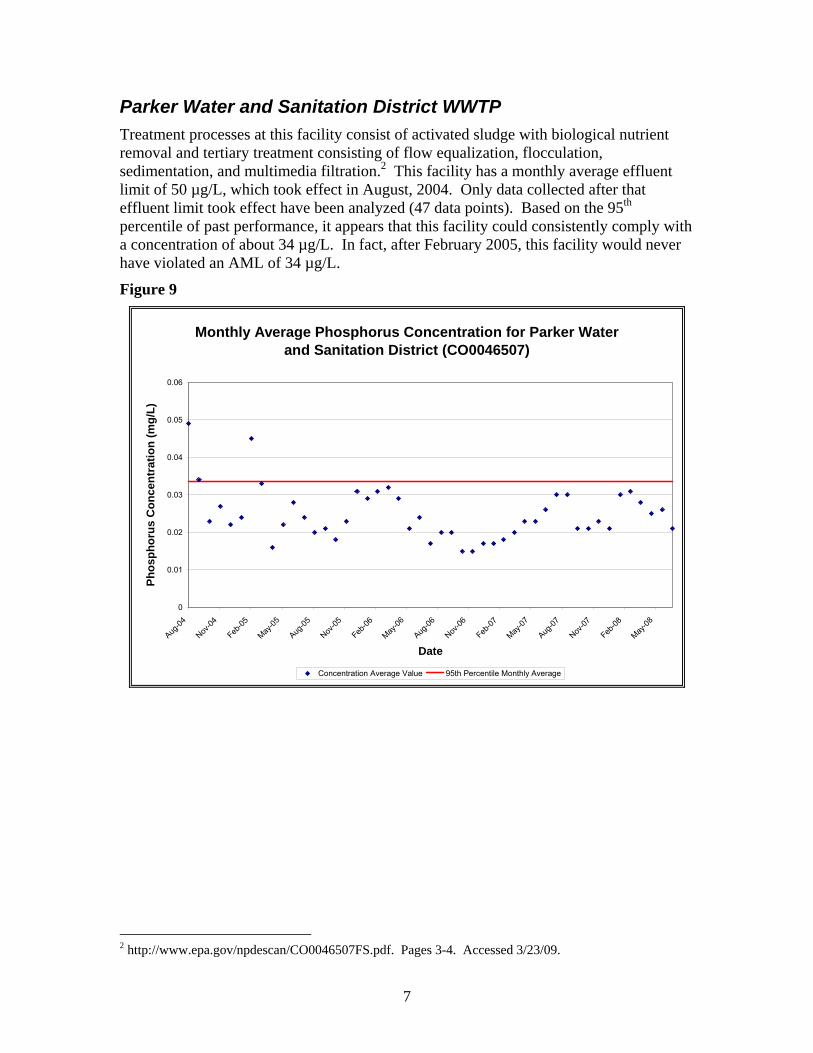
7
Parker Water and Sanitation District WWTP Treatment processes at this facility consist of activated sludge with biological nutrient removal and tertiary treatment consisting of flow equalization, flocculation, sedimentation, and multimedia filtration.2 This facility has a monthly average effluent limit of 50 µg/L, which took effect in August, 2004. Only data collected after that effluent limit took effect have been analyzed (47 data points). Based on the 95th percentile of past performance, it appears that this facility could consistently comply with a concentration of about 34 µg/L. In fact, after February 2005, this facility would never have violated an AML of 34 µg/L.
Figure 9
Monthly Average Phosphorus Concentration for Parker Water and Sanitation District (CO0046507)
0
0.01
0.02
0.03
0.04
0.05
0.06
Aug-04
Nov-04
Feb-05
May-05
Aug-05
Nov-05
Feb-06
May-06
Aug-06
Nov-06
Feb-07
May-07
Aug-07
Nov-07
Feb-08
May-08
Date
Ph
osp
ho
rus
Co
nce
ntr
atio
n (
mg
/L)
Concentration Average Value 95th Percentile Monthly Average
2 http://www.epa.gov/npdescan/CO0046507FS.pdf. Pages 3-4. Accessed 3/23/09.
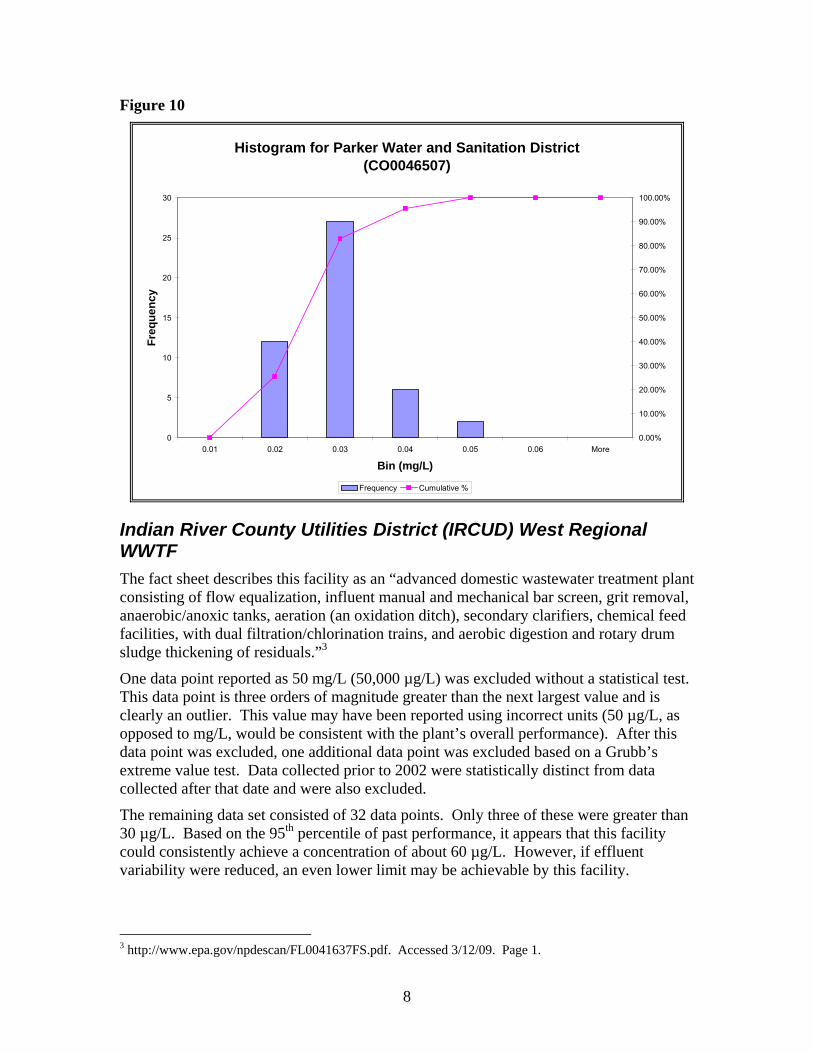
8
Figure 10
Histogram for Parker Water and Sanitation District (CO0046507)
0
5
10
15
20
25
30
0.01 0.02 0.03 0.04 0.05 0.06 More
Bin (mg/L)
Fre
qu
ency
0.00%
10.00%
20.00%
30.00%
40.00%
50.00%
60.00%
70.00%
80.00%
90.00%
100.00%
Frequency Cumulative %
Indian River County Utilities District (IRCUD) West Regional WWTF The fact sheet describes this facility as an “advanced domestic wastewater treatment plant consisting of flow equalization, influent manual and mechanical bar screen, grit removal, anaerobic/anoxic tanks, aeration (an oxidation ditch), secondary clarifiers, chemical feed facilities, with dual filtration/chlorination trains, and aerobic digestion and rotary drum sludge thickening of residuals.”3
One data point reported as 50 mg/L (50,000 µg/L) was excluded without a statistical test. This data point is three orders of magnitude greater than the next largest value and is clearly an outlier. This value may have been reported using incorrect units (50 µg/L, as opposed to mg/L, would be consistent with the plant’s overall performance). After this data point was excluded, one additional data point was excluded based on a Grubb’s extreme value test. Data collected prior to 2002 were statistically distinct from data collected after that date and were also excluded.
The remaining data set consisted of 32 data points. Only three of these were greater than 30 µg/L. Based on the 95th percentile of past performance, it appears that this facility could consistently achieve a concentration of about 60 µg/L. However, if effluent variability were reduced, an even lower limit may be achievable by this facility.
3 http://www.epa.gov/npdescan/FL0041637FS.pdf. Accessed 3/12/09. Page 1.
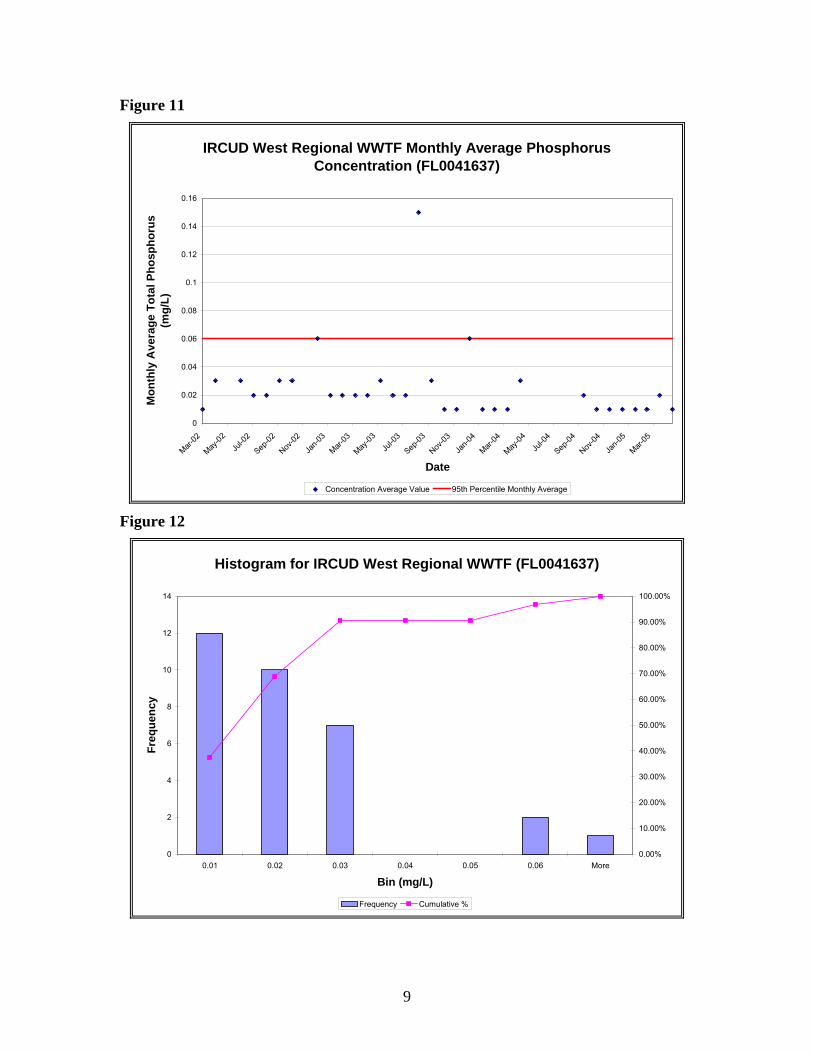
9
Figure 11
IRCUD West Regional WWTF Monthly Average Phosphorus Concentration (FL0041637)
0
0.02
0.04
0.06
0.08
0.1
0.12
0.14
0.16
Mar-02
May-02
Jul-0
2
Sep-02
Nov-02
Jan-0
3
Mar-03
May-03
Jul-0
3
Sep-03
Nov-03
Jan-0
4
Mar-04
May-04
Jul-0
4
Sep-04
Nov-04
Jan-0
5
Mar-05
Date
Mo
nth
ly A
vera
ge
To
tal
Ph
osp
ho
rus
(m
g/L
)
Concentration Average Value 95th Percentile Monthly Average
Figure 12
Histogram for IRCUD West Regional WWTF (FL0041637)
0
2
4
6
8
10
12
14
0.01 0.02 0.03 0.04 0.05 0.06 More
Bin (mg/L)
Fre
qu
ency
0.00%
10.00%
20.00%
30.00%
40.00%
50.00%
60.00%
70.00%
80.00%
90.00%
100.00%
Frequency Cumulative %
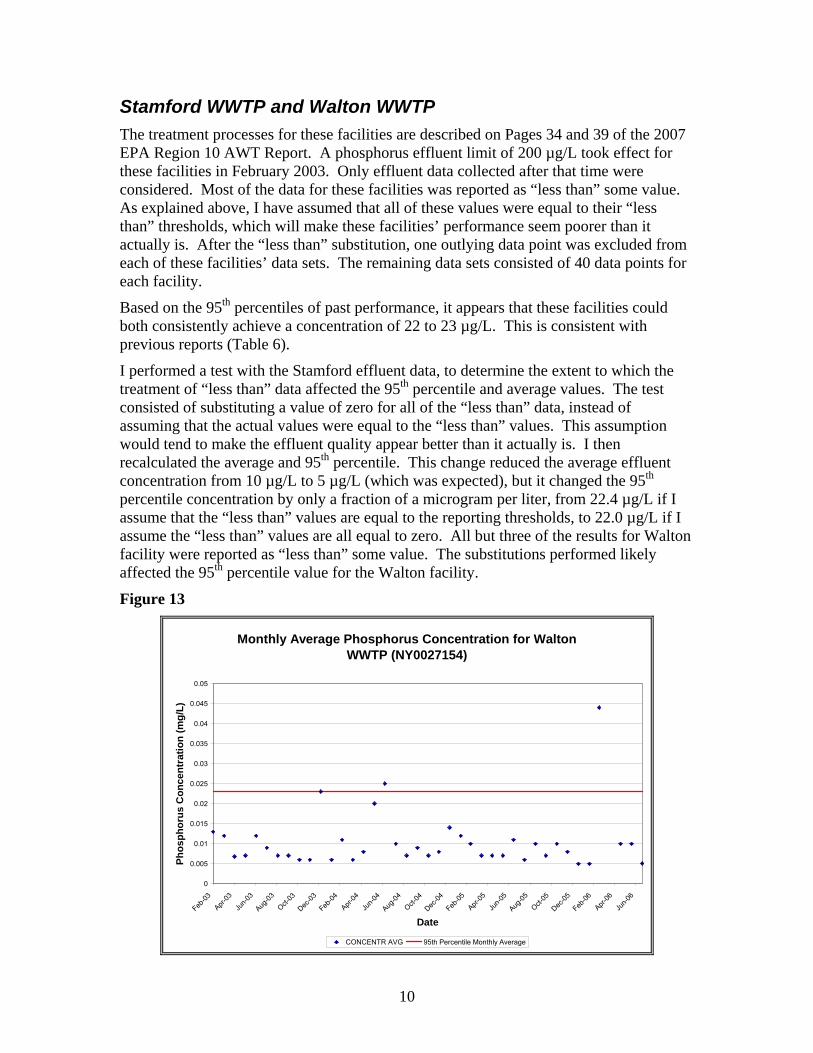
10
Stamford WWTP and Walton WWTP The treatment processes for these facilities are described on Pages 34 and 39 of the 2007 EPA Region 10 AWT Report. A phosphorus effluent limit of 200 µg/L took effect for these facilities in February 2003. Only effluent data collected after that time were considered. Most of the data for these facilities was reported as “less than” some value. As explained above, I have assumed that all of these values were equal to their “less than” thresholds, which will make these facilities’ performance seem poorer than it actually is. After the “less than” substitution, one outlying data point was excluded from each of these facilities’ data sets. The remaining data sets consisted of 40 data points for each facility.
Based on the 95th percentiles of past performance, it appears that these facilities could both consistently achieve a concentration of 22 to 23 µg/L. This is consistent with previous reports (Table 6).
I performed a test with the Stamford effluent data, to determine the extent to which the treatment of “less than” data affected the 95th percentile and average values. The test consisted of substituting a value of zero for all of the “less than” data, instead of assuming that the actual values were equal to the “less than” values. This assumption would tend to make the effluent quality appear better than it actually is. I then recalculated the average and 95th percentile. This change reduced the average effluent concentration from 10 µg/L to 5 µg/L (which was expected), but it changed the 95th percentile concentration by only a fraction of a microgram per liter, from 22.4 µg/L if I assume that the “less than” values are equal to the reporting thresholds, to 22.0 µg/L if I assume the “less than” values are all equal to zero. All but three of the results for Walton facility were reported as “less than” some value. The substitutions performed likely affected the 95th percentile value for the Walton facility.
Figure 13
Monthly Average Phosphorus Concentration for Walton WWTP (NY0027154)
0
0.005
0.01
0.015
0.02
0.025
0.03
0.035
0.04
0.045
0.05
Feb-03
Apr-03
Jun-0
3
Aug-03
Oct-03
Dec-03
Feb-04
Apr-04
Jun-0
4
Aug-04
Oct-04
Dec-04
Feb-05
Apr-05
Jun-0
5
Aug-05
Oct-05
Dec-05
Feb-06
Apr-06
Jun-0
6
Date
Ph
osp
ho
rus
Co
nce
ntr
atio
n (
mg
/L)
CONCENTR AVG 95th Percentile Monthly Average
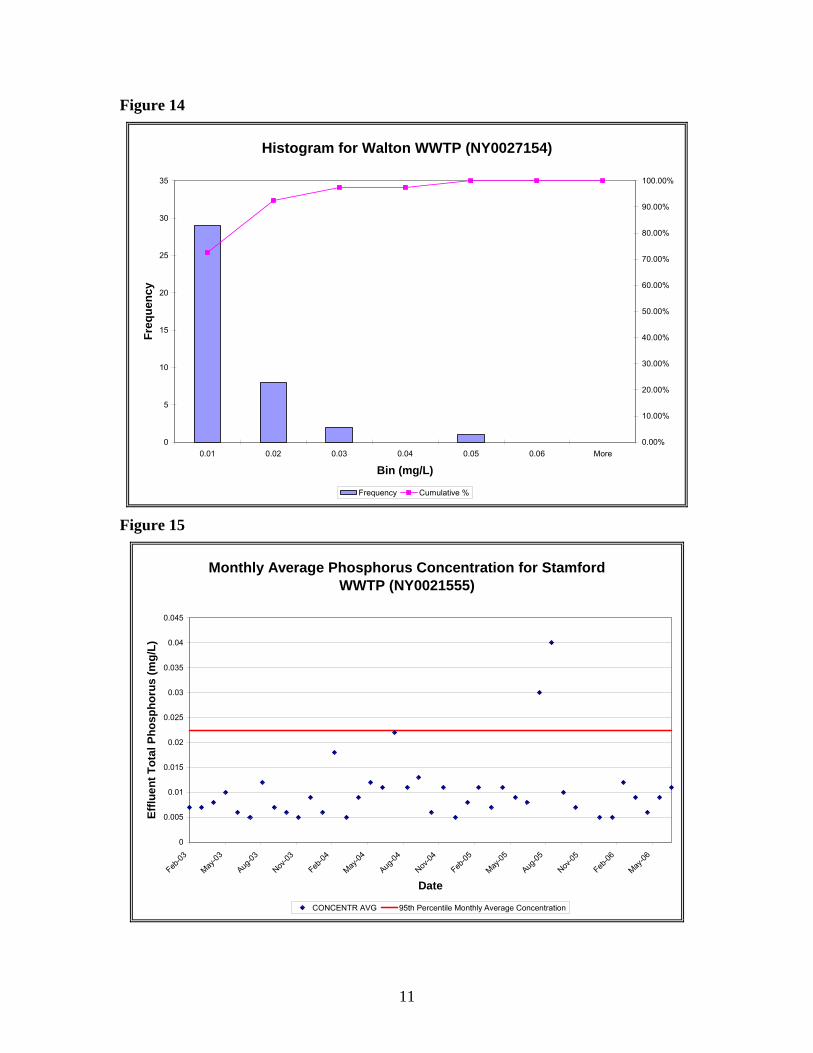
11
Figure 14
Histogram for Walton WWTP (NY0027154)
0
5
10
15
20
25
30
35
0.01 0.02 0.03 0.04 0.05 0.06 More
Bin (mg/L)
Fre
qu
ency
0.00%
10.00%
20.00%
30.00%
40.00%
50.00%
60.00%
70.00%
80.00%
90.00%
100.00%
Frequency Cumulative %
Figure 15
Monthly Average Phosphorus Concentration for Stamford WWTP (NY0021555)
0
0.005
0.01
0.015
0.02
0.025
0.03
0.035
0.04
0.045
Feb-03
May-03
Aug-03
Nov-03
Feb-04
May-04
Aug-04
Nov-04
Feb-05
May-05
Aug-05
Nov-05
Feb-06
May-06
Date
Eff
lue
nt
To
tal
Ph
osp
ho
rus
(m
g/L
)
CONCENTR AVG 95th Percentile Monthly Average Concentration
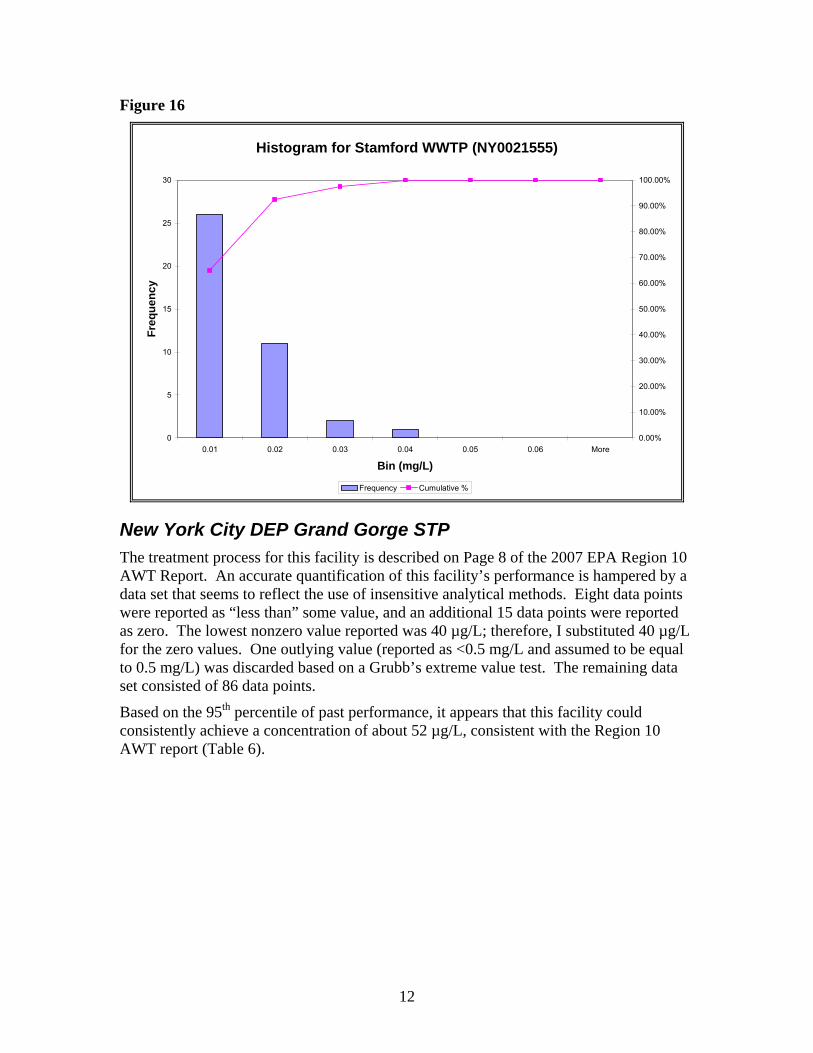
12
Figure 16
Histogram for Stamford WWTP (NY0021555)
0
5
10
15
20
25
30
0.01 0.02 0.03 0.04 0.05 0.06 More
Bin (mg/L)
Fre
qu
ency
0.00%
10.00%
20.00%
30.00%
40.00%
50.00%
60.00%
70.00%
80.00%
90.00%
100.00%
Frequency Cumulative %
New York City DEP Grand Gorge STP The treatment process for this facility is described on Page 8 of the 2007 EPA Region 10 AWT Report. An accurate quantification of this facility’s performance is hampered by a data set that seems to reflect the use of insensitive analytical methods. Eight data points were reported as “less than” some value, and an additional 15 data points were reported as zero. The lowest nonzero value reported was 40 µg/L; therefore, I substituted 40 µg/L for the zero values. One outlying value (reported as <0.5 mg/L and assumed to be equal to 0.5 mg/L) was discarded based on a Grubb’s extreme value test. The remaining data set consisted of 86 data points.
Based on the 95th percentile of past performance, it appears that this facility could consistently achieve a concentration of about 52 µg/L, consistent with the Region 10 AWT report (Table 6).
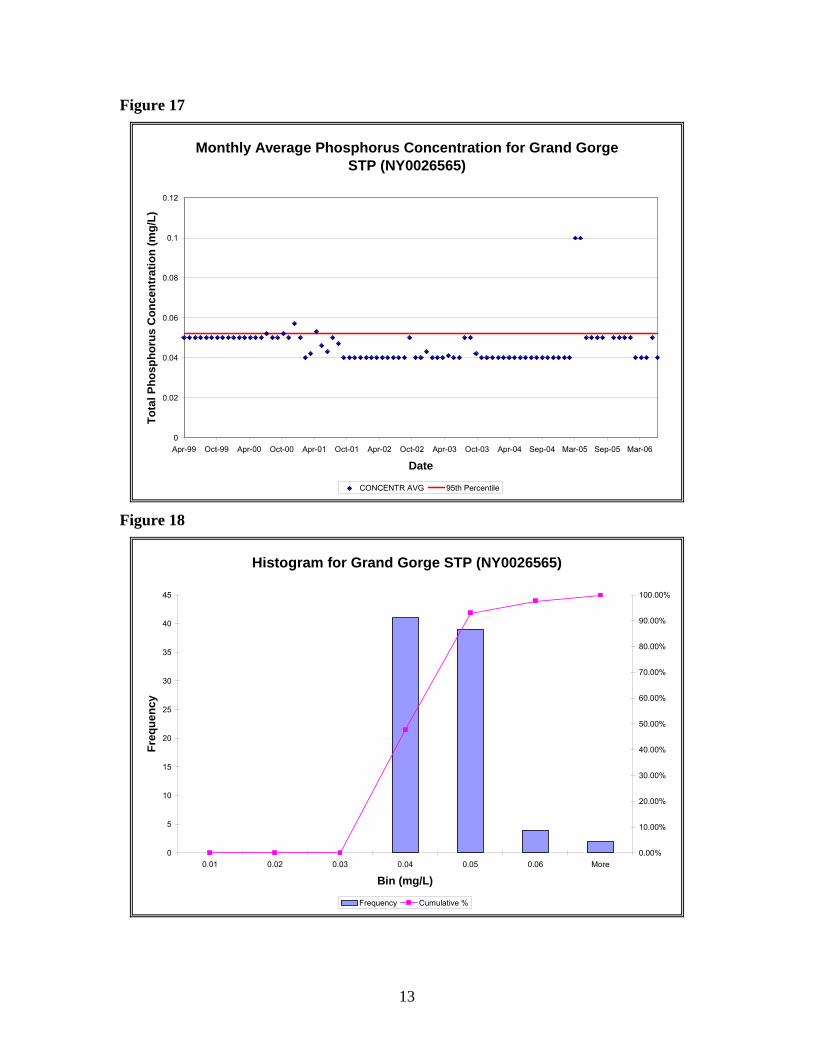
13
Figure 17
Monthly Average Phosphorus Concentration for Grand Gorge STP (NY0026565)
0
0.02
0.04
0.06
0.08
0.1
0.12
Apr-99 Oct-99 Apr-00 Oct-00 Apr-01 Oct-01 Apr-02 Oct-02 Apr-03 Oct-03 Apr-04 Sep-04 Mar-05 Sep-05 Mar-06
Date
To
tal
Ph
osp
ho
rus
Co
nce
ntr
atio
n (
mg
/L)
CONCENTR AVG 95th Percentile
Figure 18
Histogram for Grand Gorge STP (NY0026565)
0
5
10
15
20
25
30
35
40
45
0.01 0.02 0.03 0.04 0.05 0.06 More
Bin (mg/L)
Fre
qu
ency
0.00%
10.00%
20.00%
30.00%
40.00%
50.00%
60.00%
70.00%
80.00%
90.00%
100.00%
Frequency Cumulative %
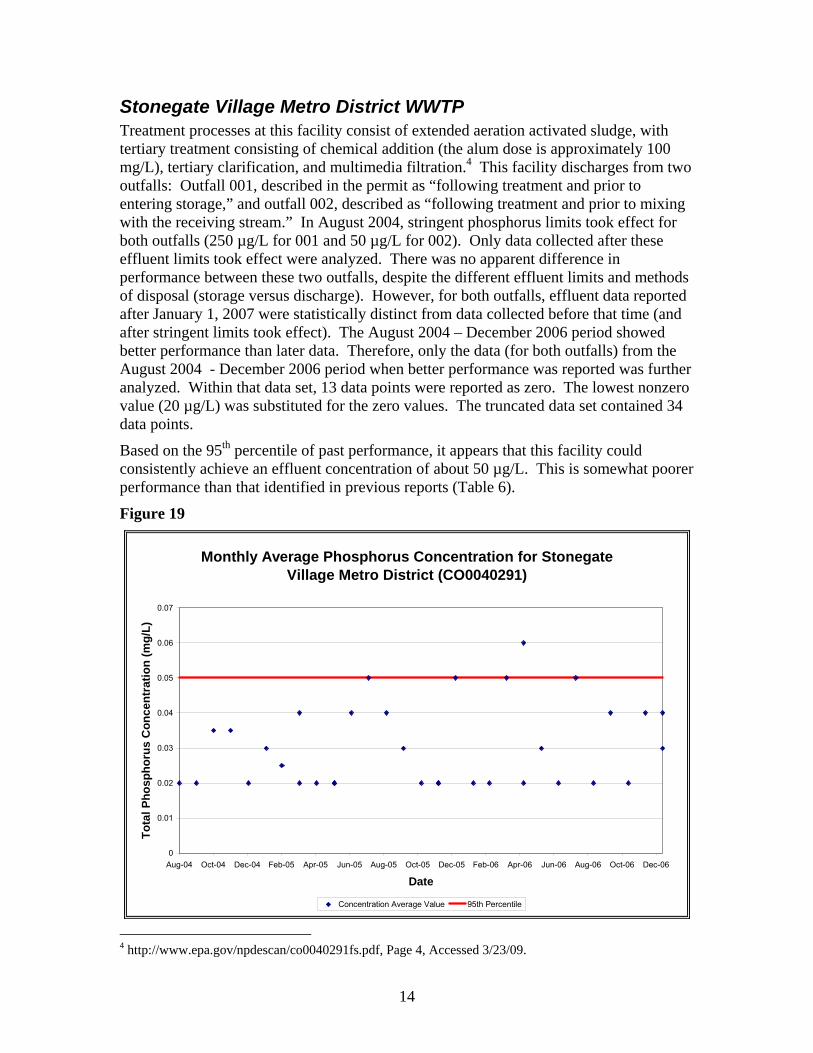
14
Stonegate Village Metro District WWTP Treatment processes at this facility consist of extended aeration activated sludge, with tertiary treatment consisting of chemical addition (the alum dose is approximately 100 mg/L), tertiary clarification, and multimedia filtration.4 This facility discharges from two outfalls: Outfall 001, described in the permit as “following treatment and prior to entering storage,” and outfall 002, described as “following treatment and prior to mixing with the receiving stream.” In August 2004, stringent phosphorus limits took effect for both outfalls (250 µg/L for 001 and 50 µg/L for 002). Only data collected after these effluent limits took effect were analyzed. There was no apparent difference in performance between these two outfalls, despite the different effluent limits and methods of disposal (storage versus discharge). However, for both outfalls, effluent data reported after January 1, 2007 were statistically distinct from data collected before that time (and after stringent limits took effect). The August 2004 – December 2006 period showed better performance than later data. Therefore, only the data (for both outfalls) from the August 2004 - December 2006 period when better performance was reported was further analyzed. Within that data set, 13 data points were reported as zero. The lowest nonzero value (20 µg/L) was substituted for the zero values. The truncated data set contained 34 data points.
Based on the 95th percentile of past performance, it appears that this facility could consistently achieve an effluent concentration of about 50 µg/L. This is somewhat poorer performance than that identified in previous reports (Table 6).
Figure 19
Monthly Average Phosphorus Concentration for Stonegate Village Metro District (CO0040291)
0
0.01
0.02
0.03
0.04
0.05
0.06
0.07
Aug-04 Oct-04 Dec-04 Feb-05 Apr-05 Jun-05 Aug-05 Oct-05 Dec-05 Feb-06 Apr-06 Jun-06 Aug-06 Oct-06 Dec-06
Date
To
tal
Ph
osp
ho
rus
Co
nce
ntr
atio
n (
mg
/L)
Concentration Average Value 95th Percentile
4 http://www.epa.gov/npdescan/co0040291fs.pdf, Page 4, Accessed 3/23/09.
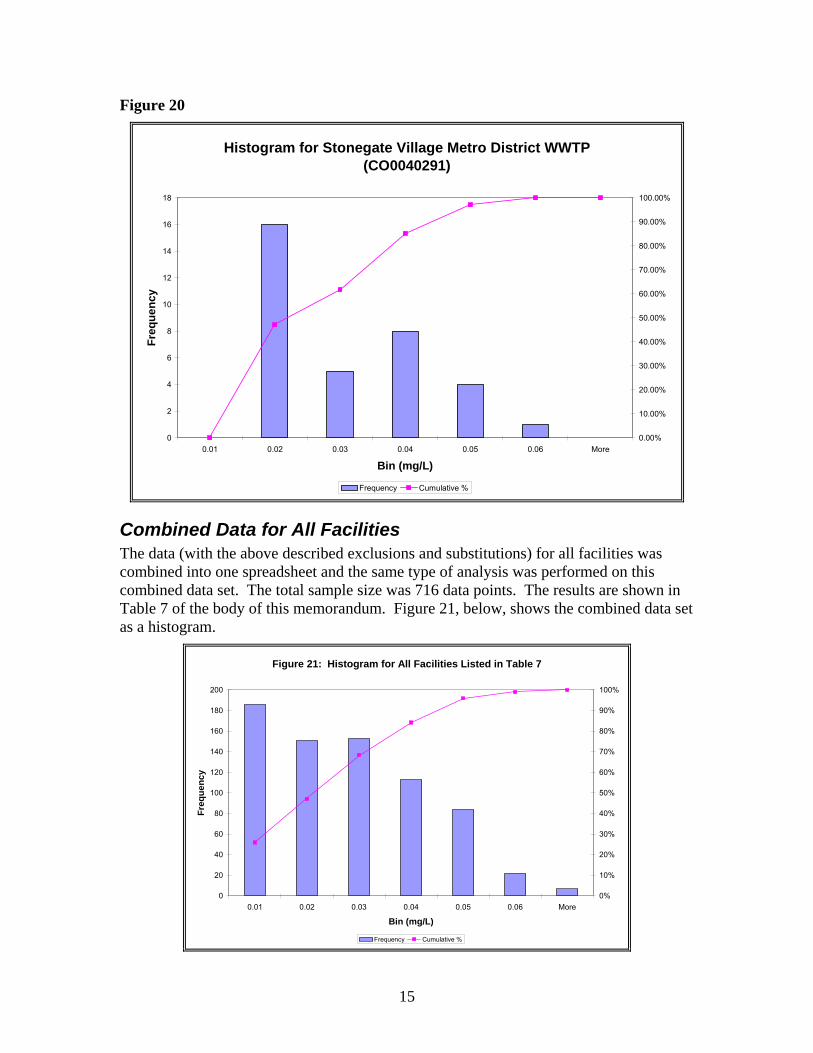
15
Figure 20
Histogram for Stonegate Village Metro District WWTP (CO0040291)
0
2
4
6
8
10
12
14
16
18
0.01 0.02 0.03 0.04 0.05 0.06 More
Bin (mg/L)
Fre
qu
ency
0.00%
10.00%
20.00%
30.00%
40.00%
50.00%
60.00%
70.00%
80.00%
90.00%
100.00%
Frequency Cumulative %
Combined Data for All Facilities The data (with the above described exclusions and substitutions) for all facilities was combined into one spreadsheet and the same type of analysis was performed on this combined data set. The total sample size was 716 data points. The results are shown in Table 7 of the body of this memorandum. Figure 21, below, shows the combined data set as a histogram.
Figure 21: Histogram for All Facilities Listed in Table 7
0
20
40
60
80
100
120
140
160
180
200
0.01 0.02 0.03 0.04 0.05 0.06 More
Bin (mg/L)
Fre
qu
en
cy
0%
10%
20%
30%
40%
50%
60%
70%
80%
90%
100%
Frequency Cumulative %

This page is purposely left blank
Spokane River / Lake Spokane Dissolved Oxygen Water Quality Improvement Report Page K-1
Appendix K: Spokane River Basin Stormwater Loading Analysis for 2009 TMDL

Spokane River / Lake Spokane Dissolved Oxygen Water Quality Improvement Report Page K-2
This page is purposely left blank
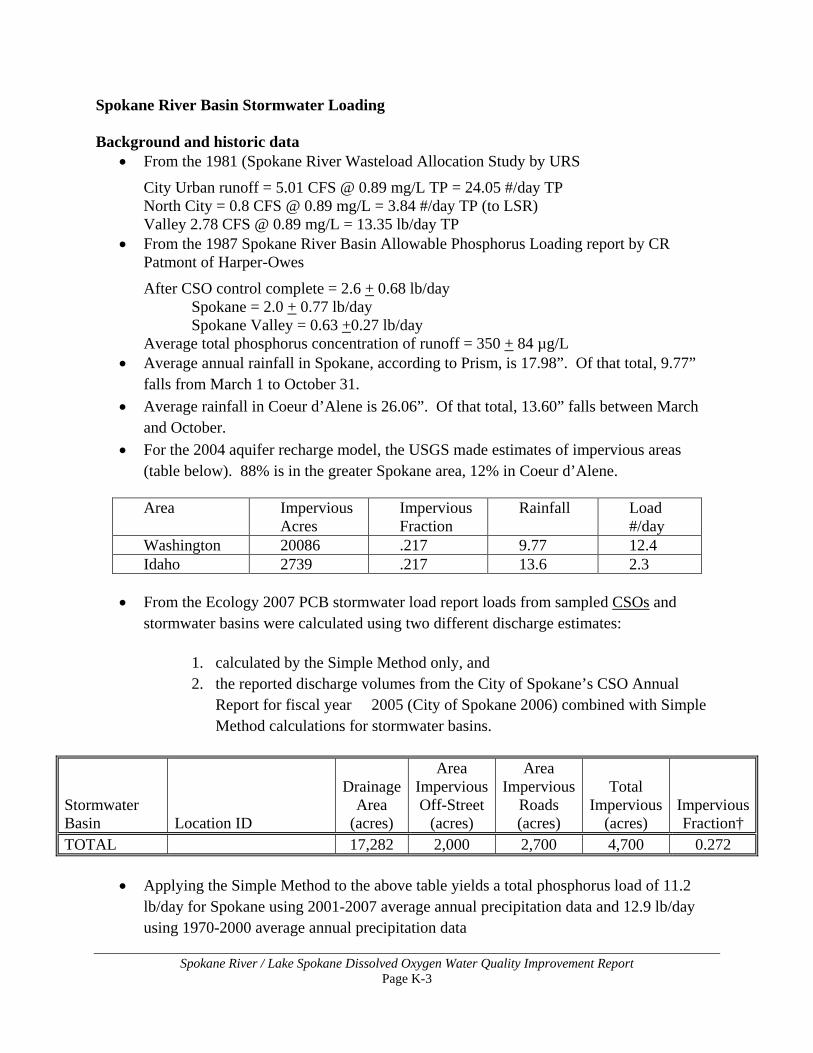
Spokane River / Lake Spokane Dissolved Oxygen Water Quality Improvement Report Page K-3
Spokane River Basin Stormwater Loading Background and historic data
• From the 1981 (Spokane River Wasteload Allocation Study by URS
City Urban runoff = 5.01 CFS @ 0.89 mg/L TP = 24.05 #/day TP North City = 0.8 CFS @ 0.89 mg/L = 3.84 #/day TP (to LSR) Valley 2.78 CFS @ 0.89 mg/L = 13.35 lb/day TP
• From the 1987 Spokane River Basin Allowable Phosphorus Loading report by CR Patmont of Harper-Owes
After CSO control complete = 2.6 + 0.68 lb/day Spokane = 2.0 + 0.77 lb/day Spokane Valley = 0.63 +0.27 lb/day
Average total phosphorus concentration of runoff = 350 + 84 µg/L • Average annual rainfall in Spokane, according to Prism, is 17.98”. Of that total, 9.77”
falls from March 1 to October 31. • Average rainfall in Coeur d’Alene is 26.06”. Of that total, 13.60” falls between March
and October. • For the 2004 aquifer recharge model, the USGS made estimates of impervious areas
(table below). 88% is in the greater Spokane area, 12% in Coeur d’Alene. Area Impervious
Acres Impervious Fraction
Rainfall Load #/day
Washington 20086 .217 9.77 12.4 Idaho 2739 .217 13.6 2.3
• From the Ecology 2007 PCB stormwater load report loads from sampled CSOs and
stormwater basins were calculated using two different discharge estimates: 1. calculated by the Simple Method only, and 2. the reported discharge volumes from the City of Spokane’s CSO Annual
Report for fiscal year 2005 (City of Spokane 2006) combined with Simple Method calculations for stormwater basins.
Stormwater Basin Location ID
Drainage Area
(acres)
Area Impervious Off-Street
(acres)
Area Impervious
Roads (acres)
Total Impervious
(acres) Impervious Fraction†
TOTAL 17,282 2,000 2,700 4,700 0.272
• Applying the Simple Method to the above table yields a total phosphorus load of 11.2 lb/day for Spokane using 2001-2007 average annual precipitation data and 12.9 lb/day using 1970-2000 average annual precipitation data
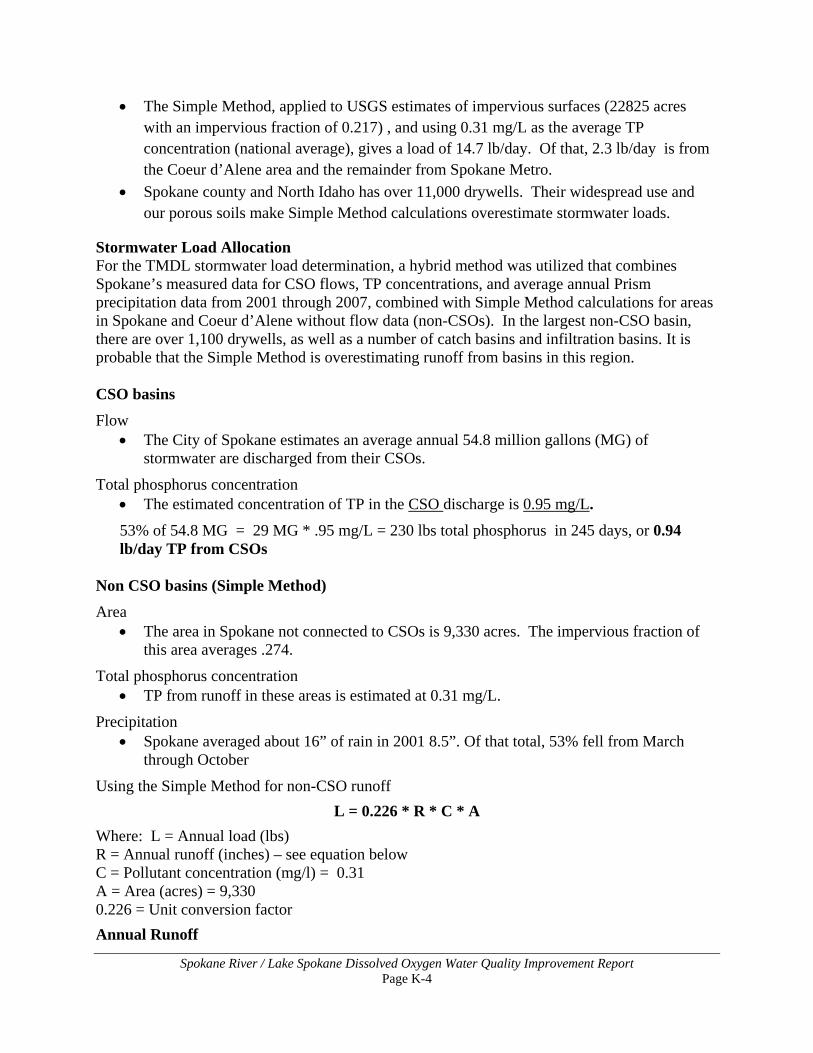
Spokane River / Lake Spokane Dissolved Oxygen Water Quality Improvement Report Page K-4
• The Simple Method, applied to USGS estimates of impervious surfaces (22825 acres with an impervious fraction of 0.217) , and using 0.31 mg/L as the average TP concentration (national average), gives a load of 14.7 lb/day. Of that, 2.3 lb/day is from the Coeur d’Alene area and the remainder from Spokane Metro.
• Spokane county and North Idaho has over 11,000 drywells. Their widespread use and our porous soils make Simple Method calculations overestimate stormwater loads.
Stormwater Load Allocation For the TMDL stormwater load determination, a hybrid method was utilized that combines Spokane’s measured data for CSO flows, TP concentrations, and average annual Prism precipitation data from 2001 through 2007, combined with Simple Method calculations for areas in Spokane and Coeur d’Alene without flow data (non-CSOs). In the largest non-CSO basin, there are over 1,100 drywells, as well as a number of catch basins and infiltration basins. It is probable that the Simple Method is overestimating runoff from basins in this region. CSO basins Flow
• The City of Spokane estimates an average annual 54.8 million gallons (MG) of stormwater are discharged from their CSOs.
Total phosphorus concentration • The estimated concentration of TP in the CSO discharge is 0.95 mg/L. 53% of 54.8 MG = 29 MG * .95 mg/L = 230 lbs total phosphorus in 245 days, or 0.94 lb/day TP from CSOs
Non CSO basins (Simple Method) Area
• The area in Spokane not connected to CSOs is 9,330 acres. The impervious fraction of this area averages .274.
Total phosphorus concentration • TP from runoff in these areas is estimated at 0.31 mg/L.
Precipitation • Spokane averaged about 16” of rain in 2001 8.5”. Of that total, 53% fell from March
through October
Using the Simple Method for non-CSO runoff L = 0.226 * R * C * A
Where: L = Annual load (lbs) R = Annual runoff (inches) – see equation below C = Pollutant concentration (mg/l) = 0.31 A = Area (acres) = 9,330 0.226 = Unit conversion factor Annual Runoff
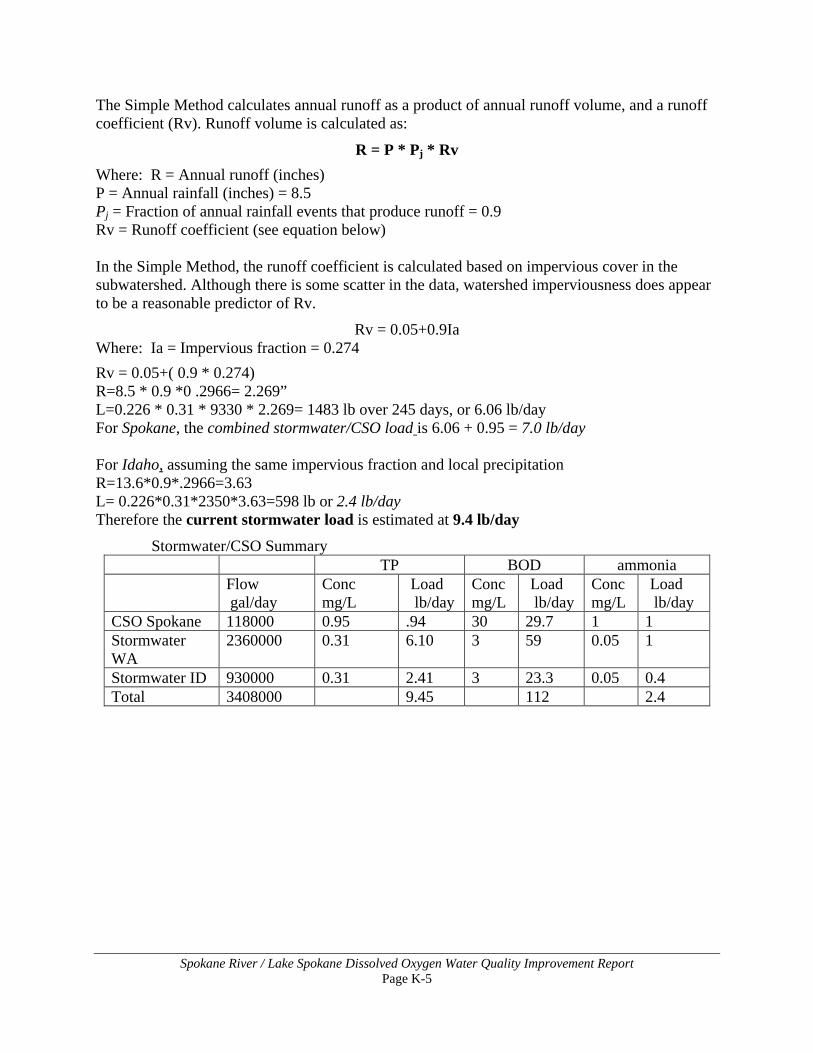
Spokane River / Lake Spokane Dissolved Oxygen Water Quality Improvement Report Page K-5
The Simple Method calculates annual runoff as a product of annual runoff volume, and a runoff coefficient (Rv). Runoff volume is calculated as:
R = P * Pj * Rv Where: R = Annual runoff (inches) P = Annual rainfall (inches) = 8.5 Pj = Fraction of annual rainfall events that produce runoff = 0.9 Rv = Runoff coefficient (see equation below) In the Simple Method, the runoff coefficient is calculated based on impervious cover in the subwatershed. Although there is some scatter in the data, watershed imperviousness does appear to be a reasonable predictor of Rv.
Rv = 0.05+0.9Ia Where: Ia = Impervious fraction = 0.274 Rv = 0.05+( 0.9 * 0.274) R=8.5 * 0.9 *0 .2966= 2.269” L=0.226 * 0.31 * 9330 * 2.269= 1483 lb over 245 days, or 6.06 lb/day For Spokane, the combined stormwater/CSO load is 6.06 + 0.95 = 7.0 lb/day For Idaho, assuming the same impervious fraction and local precipitation R=13.6*0.9*.2966=3.63 L= 0.226*0.31*2350*3.63=598 lb or 2.4 lb/day Therefore the current stormwater load is estimated at 9.4 lb/day
Stormwater/CSO Summary TP BOD ammonia Flow
gal/day Conc mg/L
Load lb/day
Conc mg/L
Load lb/day
Conc mg/L
Load lb/day
CSO Spokane 118000 0.95 .94 30 29.7 1 1 Stormwater WA
2360000 0.31 6.10 3 59 0.05 1
Stormwater ID 930000 0.31 2.41 3 23.3 0.05 0.4 Total 3408000 9.45 112 2.4
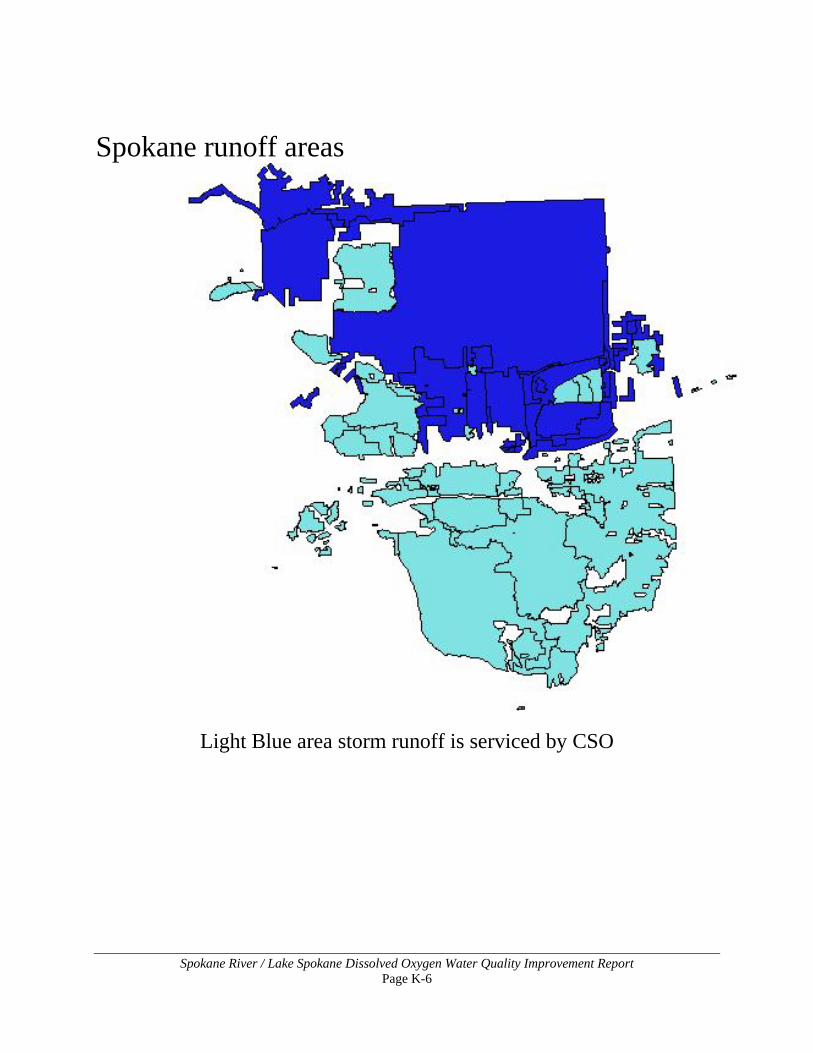
Spokane River / Lake Spokane Dissolved Oxygen Water Quality Improvement Report Page K-6
Spokane runoff areas
Light Blue area storm runoff is serviced by CSO
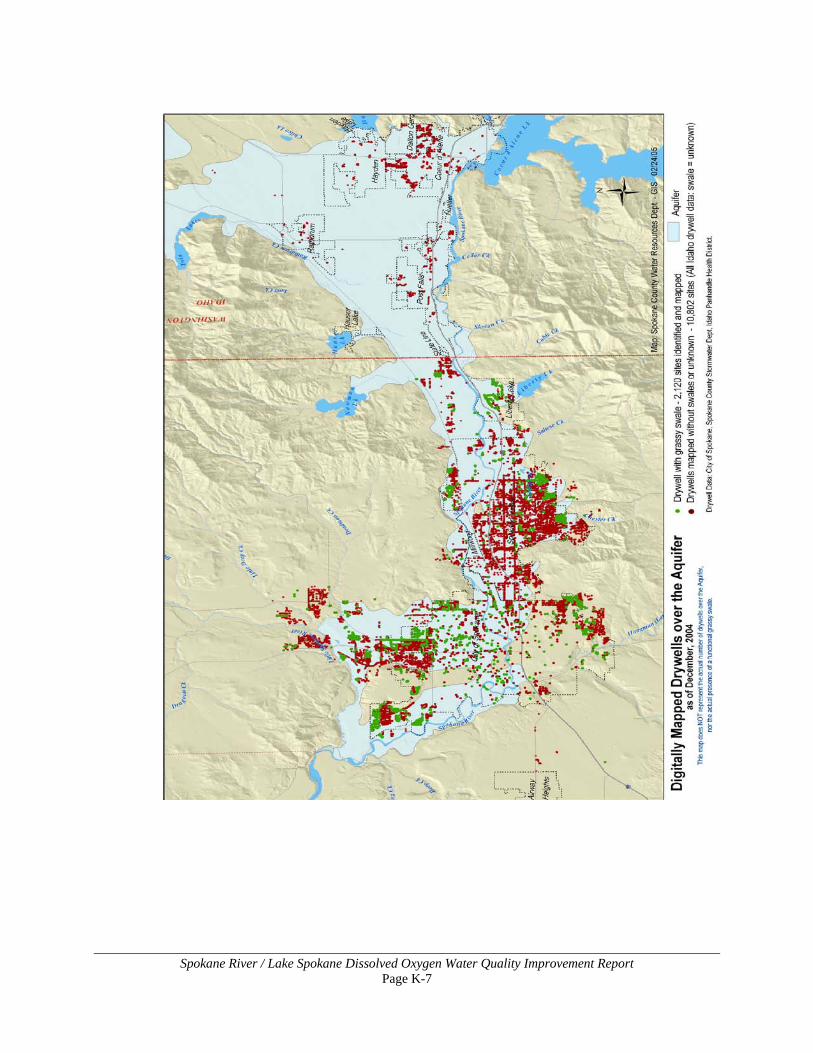
Spokane River / Lake Spokane Dissolved Oxygen Water Quality Improvement Report Page K-7

Spokane River / Lake Spokane Dissolved Oxygen Water Quality Improvement Report Page K-8
This page is purposely left blank
Spokane River / Lake Spokane Dissolved Oxygen Water Quality Improvement Report Page L-1
Appendix L: September 28, 2005 Spokane River TMDL Collaboration Technology Workgroup Memo on Wastewater Treatment Facilities Achieving Low Total Phosphorus Effluent
Spokane River / Lake Spokane Dissolved Oxygen Water Quality Improvement Report Page L-2
This page is purposely left blank
Spokane River TMDL Collaboration Full Group Meeting September 28, 2005
Appendix B
Workgroup Information Roll-Up: Technology Workgroup

Memorandum To: Ryan Orth, Ross & Associates From: Len Bramble, Technology Work Group Co-Chair Lars Hendron, Technology Work Group Co-Chair Subject: Submittal of Preliminary Information
Spokane River TMDL Collaboration Technology Work Group
Date: September 14, 2005 The Spokane River TMDL Collaboration Steering Work Group and Full Group have requested each Work Group (Wastewater Flows & Loading, Technology, Re-use & Conservation, and Non-Point Source) provide its findings, recommendations, etc as of September 14, 2005. Consistent with that request, within this communication you will find a suggestion from the Technology Work Group, along with certain specific conditions pertaining to the utilization of this suggestion. Graphics supporting this suggestion and made a part of this recommendation by reference are attached as well. The Spokane Collaboration Technology Work Group (TWG) has accumulated a variety of information and data for more than 115 wastewater treatment plants (WWTP) within the US and abroad. Of these 115+ WWTP’s, we have thus far been fairly successful at accumulating average monthly total phosphorus effluent data from 43 WWTP’s. The TWG stresses that this data accumulation and evaluation effort is an on-going effort, and points out that among needed future work relating to WWTP technology and phosphorus reduction efforts is the need to undertake a much more detailed and exhaustive effort at the WWTP’s or WWTP technologies of most interest, including but not limited to, analyses of daily effluent phosphorus data as opposed to average monthly effluent phosphorus data, taking into consideration the actual permit limits WWTP’s were working to achieve, and the seasonality aspects of permit limits and WWTP operations. The TWG suggests at this time the Full Work Group consider utilizing 50 ug/L (micro grams per liter) as an average monthly effluent concentration for total phosphorus possibly attainable by municipal wastewater treatment plants on an average monthly basis, conditioned upon the following: 1. LIMITATIONS OF THE DATA:
a. The data and information accumulated thus far for 43 of the 115+ WWTP’s under study indicates that there are 11 WWTP’s in the hydraulic operating range of 0.23-2.14 MGD and 3-4 WWTP’s in the range of 28.4-
42.8 MGD that are achieving, or are close to achieving, an average monthly final effluent concentration of total phosphorus of 50 ug/L or lower (see graphics).
b. Our data show that there are treatment plants performing phosphorus removal at levels significantly better than is currently achieved on the Spokane River. These levels approach, but do not reliably achieve on a sustained basis, the P removal levels necessary for the Spokane River (i.e., 10 micrograms per liter).
c. There is a difference between minimum performance levels used in writing NPDES permits and the environmentally better average performance operators like to achieve to assure they meet their permit’s minimum performance level. It is these better, average performance numbers that result in the actual pounds of phosphorus removed and discharged.
d. Almost all data is based upon monthly averages of total phosphorus effluent from a limited data set. Without more detailed data, the ability to accurately understand and gauge a WWTP’s efficiency of phosphorus removal is most difficult.
e. This data is based upon year-around (January through December) data, and not seasonal (April through October) data; thus seasonal aspects relating to a wastewater treatment plant’s hydraulic performance are “averaged” out.
f. The 50 ug/L value is simply a reasonably predictable concentration and “place holder” for TMDL evaluation at this time.
g. The testing frequency of the data was highly variable, especially for the smaller plants that don’t test every day and don’t provide daily monitoring reports (DMR’s) to the EPA. These variations may skew the data and make comparisons difficult.
h. The data considered thus far is generally geared to respective applicable in-place permit limits. If these permit limits are relatively high, there is no incentive to operate the WWTP to achieve a lower limit or to test at lower detection levels. Thus, some of the WWTP’s currently showing total phosphorus concentrations higher than 50 ug/L might be capable of achieving lower concentrations if required to do so, therefore merit further study. For example, Frisco Sanitation WWTP in Frisco, Colorado (our ID#5) has a permit limit for total phosphorus of 500 ug/L but is actually achieving 80 ug/L; one has to wonder what they might be able to achieve with a different and lower goal.
i. Some WWTP’s were not required to test for phosphorus, but were testing it anyway and getting low numbers and good results. These merit more study.
j. Many of the smaller plants appear to be getting much lower numbers but we lack information as to scalability.
k. It is important to point out that, given the data limitations, the information gathered, though useful, does not show what is attainable
but merely what is being attained at various locations under specific conditions. More information, more pilot studies, and more investigations are needed before conclusions can be drawn or recommendations made as to the appropriate phosphorus concentration for dischargers to this river.
l. This data and suggestion should be utilized to preliminarily estimate phosphorus loading (pounds) only, and not to establish permit limits. Permit limits for effluent total phosphorus should be based established only after completion of much more detailed and substantive study of applicable data and other considerations, including pilot testing.
2. ADDITIONAL EVALUATION OF THE DATA: a. Issues pertaining to uncertainty and reliability of analytical results,
variability, methods, and procedures need to be addressed. Lab analysis at low phosphorus levels is highly variable. In order to have confidence in the data, one needs information as to lab capabilities.
b. Additional study is needed to determine if local facilities with widely varying flow rates and other design and operational characteristics could expect to achieve similar or different phosphorous removal rates with respect to those included within this study.
c. Additional consideration should be conducted to determine if some of the wastewater treatment facilities with data reflecting a concentration of effluent total phosphorus higher than 50 ug/L should not be eliminated from consideration and may be worthy of additional investigation, particularly on a seasonal (April through October) basis.
d. “Sizing” of facilities to respective flow treatment needs should also be included as a factor that needs to be considered.
e. Additional pilot studies will be needed prior to more precisely determining final achievable total phosphorus concentrations and deciding upon applicable permit limits. The Technology Work Group is eagerly awaiting the pilot results for the testing that was recently concluded at Inland Empire Paper and has recently commenced at the City of Spokane WWTP. By the time these results are available we hope to be able to suggest effluent phosphorus concentrations that will more accurately and fully help reasonably estimate the total phosphorus discharged to the Spokane River from point sources.
f. Future studies and technology improvements will likely result in changes in predictable phosphorus removal.
g. How well a plant is operated and maintained can have a significant impact upon achieving phosphorus reduction, but this aspect is not included in our considerations.
Attachments (4 pdf files named): 1 Eff P by Flow Name 0-100.pdf 2 Eff P by Flow Name 0-300.pdf 3 Eff P by Flow 0-100.pdf 4 Eff P by Flow 0-300.pdf

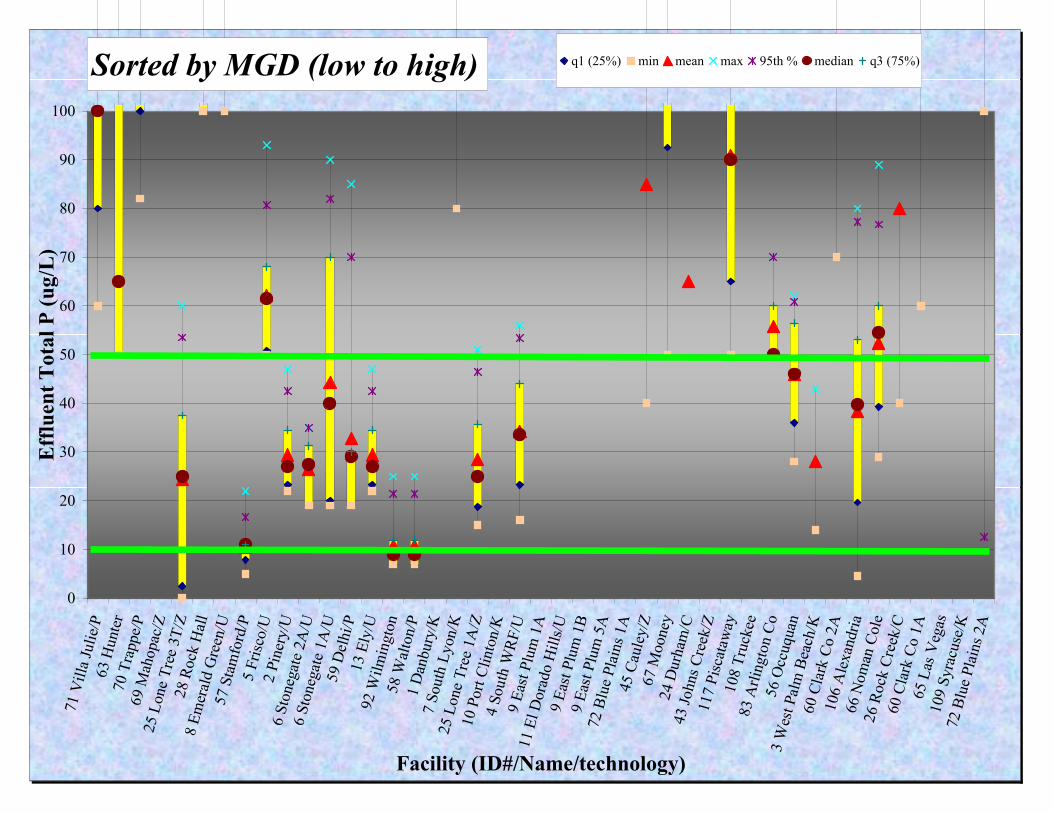
Sorted by MGD (low to high)
0
10
20
30
40
50
60
70
80
90
100
71 Villa Julie/P
63 Hunter
70 Trappe/P
69 Mahopac/Z
25 Lone Tree 3T/Z
28 Rock Hall
8 Emerald Green/U
57 Stamford/P
5 Frisco/U
2 Pinery/U
6 Stonegate 2A/U
6 Stonegate 1A/U
59 Delhi/P
13 Ely/U
92 Wilmington
58 Walton/P
1 Danbury/K
7 South Lyon/K
25 Lone Tree 1A/Z
10 Port Clinton/K
4 South WRF/U
9 East Plum 1A
11 El Dorado Hills/U
9 East Plum 1B
9 East Plum 5A
72 Blue Plains 1A
45 Cauley/Z
67 Mooney
24 Durham/C
43 Johns Creek/Z
117 Piscataway
108 Truckee
83 Arlington Co
56 Occuquan
3 West Palm Beach/K
60 Clark Co 2A
106 Alexandria
66 Noman Cole
26 Rock Creek/C
60 Clark Co 1A
65 Las Vegas
109 Syracuse/K
72 Blue Plains 2A
Facility (ID#/Name/technology)
Effluent Total P (ug/L)q1 (25%) min mean max 95th % median q3 (75%)
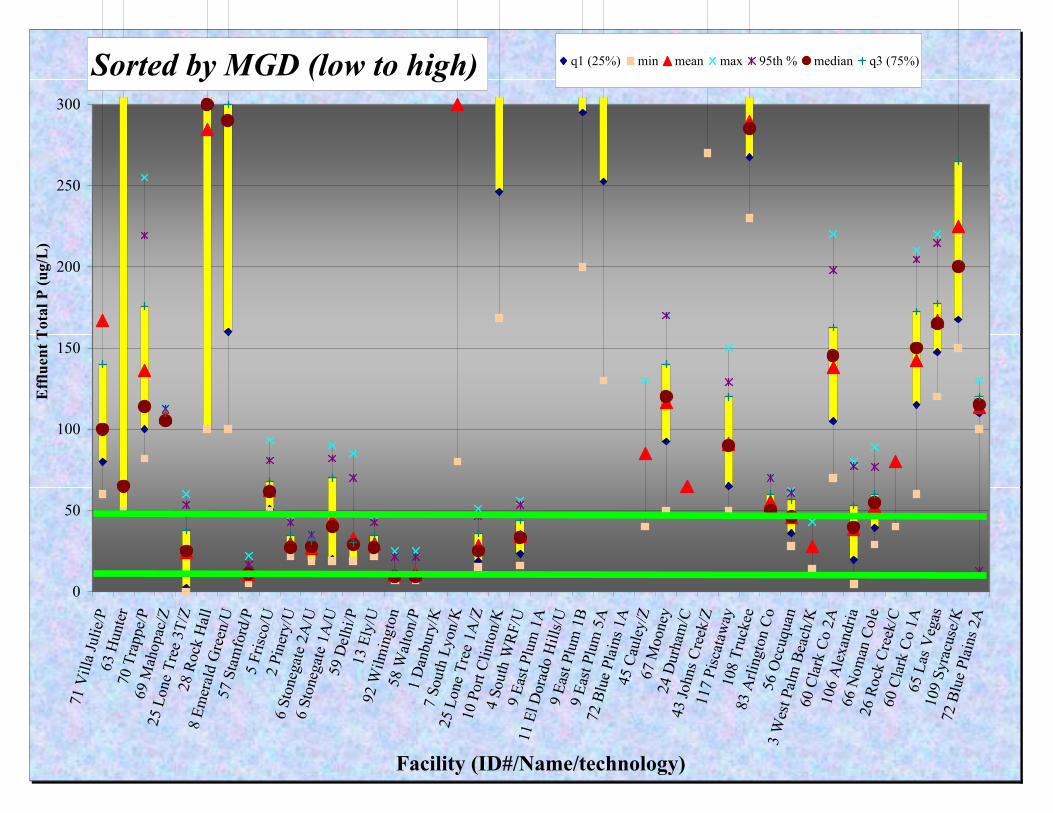
Sorted by MGD (low to high)
0
50
100
150
200
250
300
71 Villa Julie/P
63 Hunter
70 Trappe/P
69 Mahopac/Z
25 Lone Tree 3T/Z
28 Rock Hall
8 Emerald Green/U
57 Stamford/P
5 Frisco/U
2 Pinery/U
6 Stonegate 2A/U
6 Stonegate 1A/U
59 Delhi/P
13 Ely/U
92 Wilmington
58 Walton/P
1 Danbury/K
7 South Lyon/K
25 Lone Tree 1A/Z
10 Port Clinton/K
4 South WRF/U
9 East Plum 1A
11 El Dorado Hills/U
9 East Plum 1B
9 East Plum 5A
72 Blue Plains 1A
45 Cauley/Z
67 Mooney
24 Durham/C
43 Johns Creek/Z
117 Piscataway
108 Truckee
83 Arlington Co
56 Occuquan
3 West Palm Beach/K
60 Clark Co 2A
106 Alexandria
66 Noman Cole
26 Rock Creek/C
60 Clark Co 1A
65 Las Vegas
109 Syracuse/K
72 Blue Plains 2A
Facility (ID#/Name/technology)
Effluent Total P (ug/L)
q1 (25%) min mean max 95th % median q3 (75%)
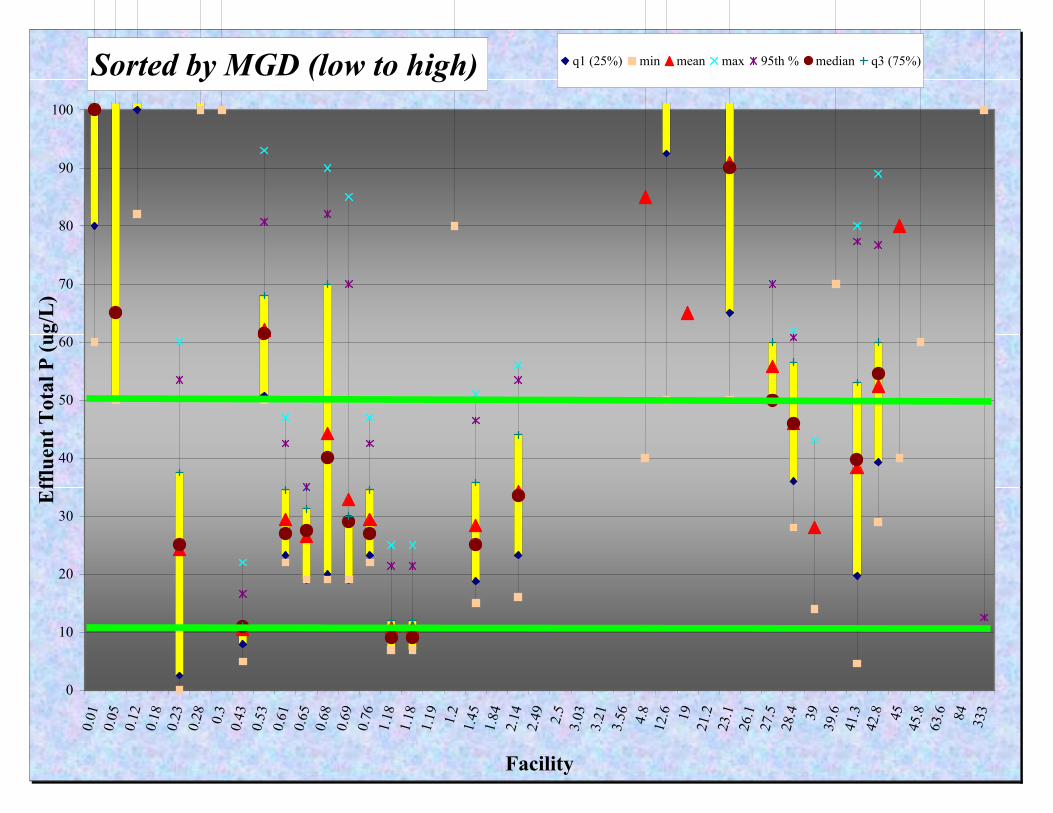
Sorted by MGD (low to high)
0
10
20
30
40
50
60
70
80
90
100
0.01
0.05
0.12
0.18
0.23
0.28
0.3
0.43
0.53
0.61
0.65
0.68
0.69
0.76
1.18
1.18
1.19
1.2
1.45
1.84
2.14
2.49
2.5
3.03
3.21
3.56
4.8
12.6 19
21.2
23.1
26.1
27.5
28.4 39
39.6
41.3
42.8 45
45.8
63.6 84
333
Facility
Effluent Total P (ug/L)
q1 (25%) min mean max 95th % median q3 (75%)
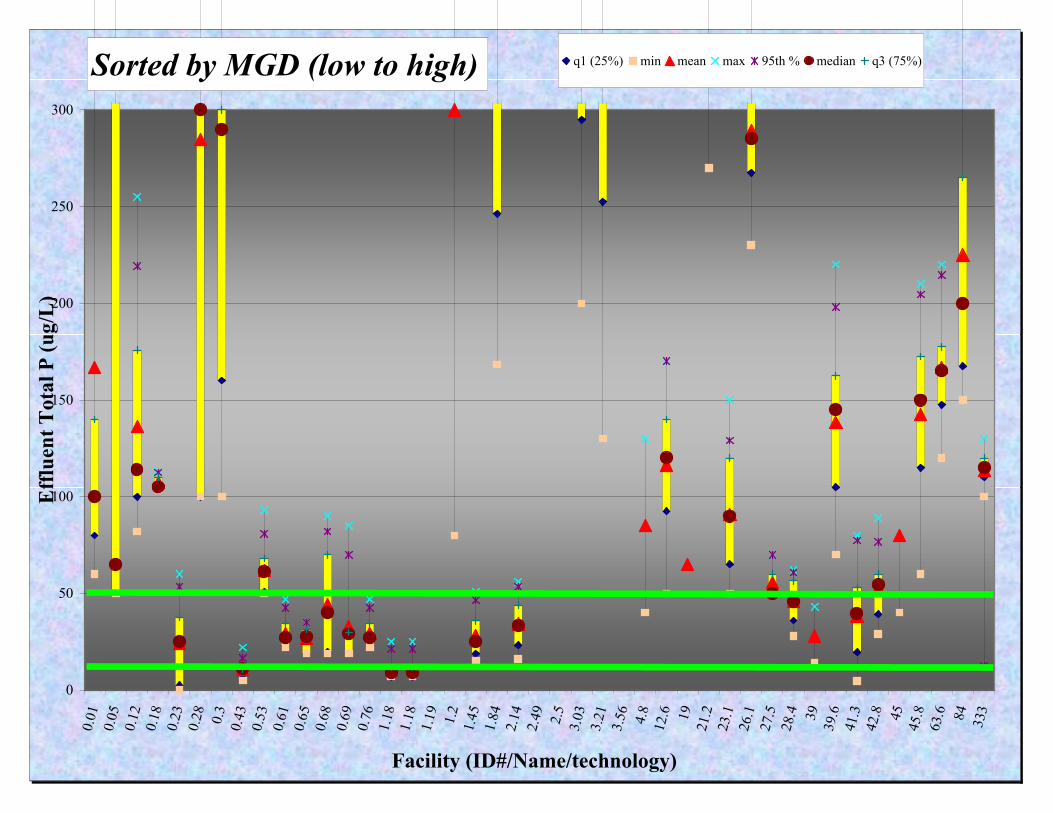
Sorted by MGD (low to high)
0
50
100
150
200
250
300
0.01
0.05
0.12
0.18
0.23
0.28
0.3
0.43
0.53
0.61
0.65
0.68
0.69
0.76
1.18
1.18
1.19
1.2
1.45
1.84
2.14
2.49
2.5
3.03
3.21
3.56
4.8
12.6 19
21.2
23.1
26.1
27.5
28.4 39
39.6
41.3
42.8 45
45.8
63.6 84
333
Facility (ID#/Name/technology)
Effluent Total P (ug/L)
q1 (25%) min mean max 95th % median q3 (75%)
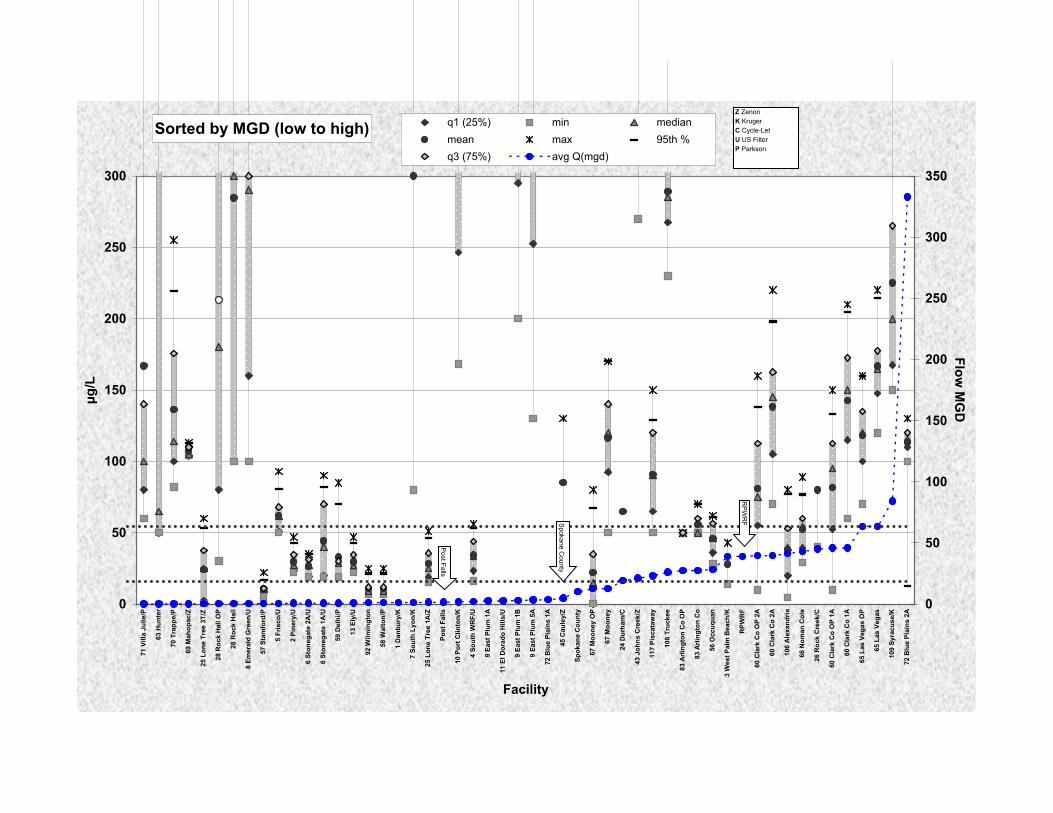
Sorted by MGD (low to high)
0
50
100
150
200
250
300
71 V
illa
Julie
/P
63 H
unte
r
70 T
rapp
e/P
69 M
ahop
ac/Z
25 L
one
Tree
3T/
Z
28 R
ock
Hal
l OP
28 R
ock
Hal
l
8 Em
eral
d G
reen
/U
57 S
tam
ford
/P
5 Fr
isco
/U
2 Pi
nery
/U
6 St
oneg
ate
2A/U
6 St
oneg
ate
1A/U
59 D
elhi
/P
13 E
ly/U
92 W
ilmin
gton
58 W
alto
n/P
1 D
anbu
ry/K
7 So
uth
Lyon
/K
25 L
one
Tree
1A
/Z
Post
Fal
ls
10 P
ort C
linto
n/K
4 So
uth
WR
F/U
9 Ea
st P
lum
1A
11 E
l Dor
ado
Hill
s/U
9 Ea
st P
lum
1B
9 Ea
st P
lum
5A
72 B
lue
Plai
ns 1
A
45 C
aule
y/Z
Spok
ane
Cou
nty
67 M
oone
y O
P
67 M
oone
y
24 D
urha
m/C
43 J
ohns
Cre
ek/Z
117
Pisc
ataw
ay
108
Truc
kee
83 A
rling
ton
Co
OP
83 A
rling
ton
Co
56 O
ccuq
uan
3 W
est P
alm
Bea
ch/K
RPW
RF
60 C
lark
Co
OP
2A
60 C
lark
Co
2A
106
Ale
xand
ria
66 N
oman
Col
e
26 R
ock
Cre
ek/C
60 C
lark
Co
OP
1A
60 C
lark
Co
1A
65 L
as V
egas
OP
65 L
as V
egas
109
Syra
cuse
/K
72 B
lue
Plai
ns 2
A
Facility
µg/L
0
50
100
150
200
250
300
350
Flow M
GD
q1 (25%) min medianmean max 95th %q3 (75%) avg Q(mgd)
Z ZenonK KrugerC Cycle-LetU US FilterP Parkson
Post Falls
RP
WR
FSpokane C
ounty
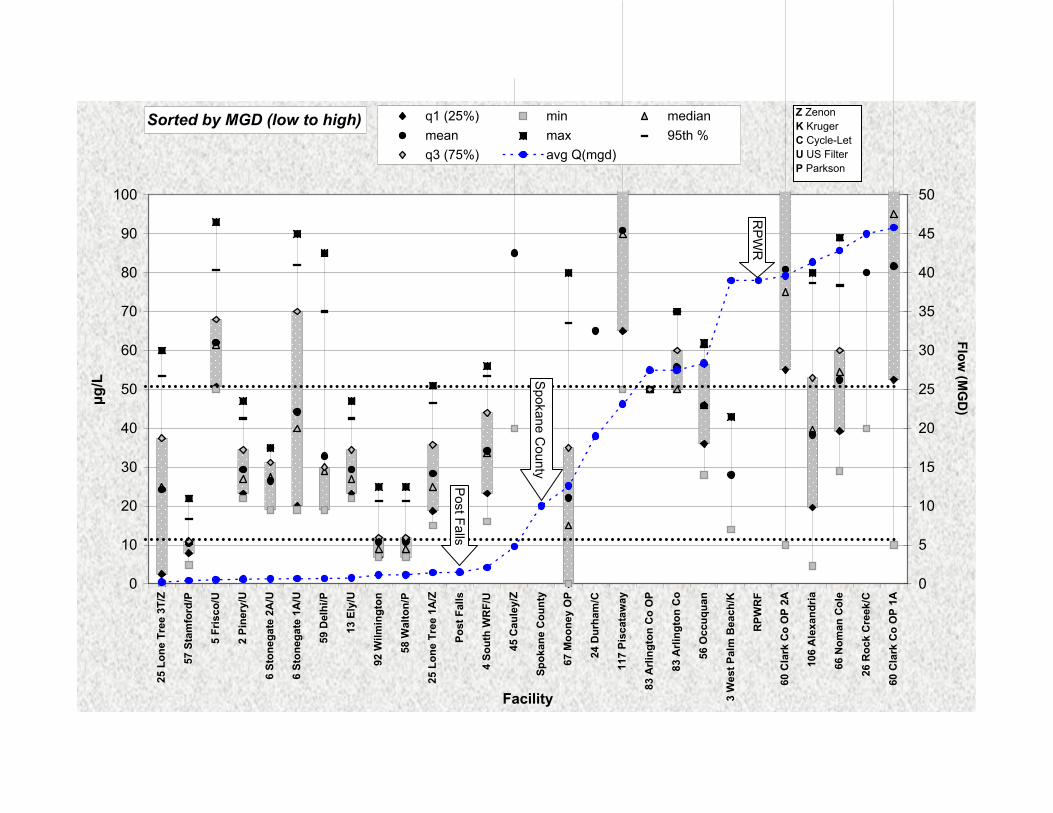
Sorted by MGD (low to high)
0
10
20
30
40
50
60
70
80
90
100
25 L
one
Tree
3T/
Z
57 S
tam
ford
/P
5 Fr
isco
/U
2 Pi
nery
/U
6 St
oneg
ate
2A/U
6 St
oneg
ate
1A/U
59 D
elhi
/P
13 E
ly/U
92 W
ilmin
gton
58 W
alto
n/P
25 L
one
Tree
1A
/Z
Post
Fal
ls
4 So
uth
WR
F/U
45 C
aule
y/Z
Spok
ane
Cou
nty
67 M
oone
y O
P
24 D
urha
m/C
117
Pisc
ataw
ay
83 A
rling
ton
Co
OP
83 A
rling
ton
Co
56 O
ccuq
uan
3 W
est P
alm
Bea
ch/K
RPW
RF
60 C
lark
Co
OP
2A
106
Ale
xand
ria
66 N
oman
Col
e
26 R
ock
Cre
ek/C
60 C
lark
Co
OP
1A
Facility
µg/L
0
5
10
15
20
25
30
35
40
45
50
Flow (M
GD
)
q1 (25%) min medianmean max 95th %q3 (75%) avg Q(mgd)
Post Falls
Spokane County
RPW
R
Z ZenonK KrugerC Cycle-LetU US FilterP Parkson
Spokane River / Lake Spokane Dissolved Oxygen Water Quality Improvement Report Page M-1
Appendix M: Tributary and groundwater nutrient load summary
Spokane River / Lake Spokane Dissolved Oxygen Water Quality Improvement Report Page M-2
This page is purposely left blank
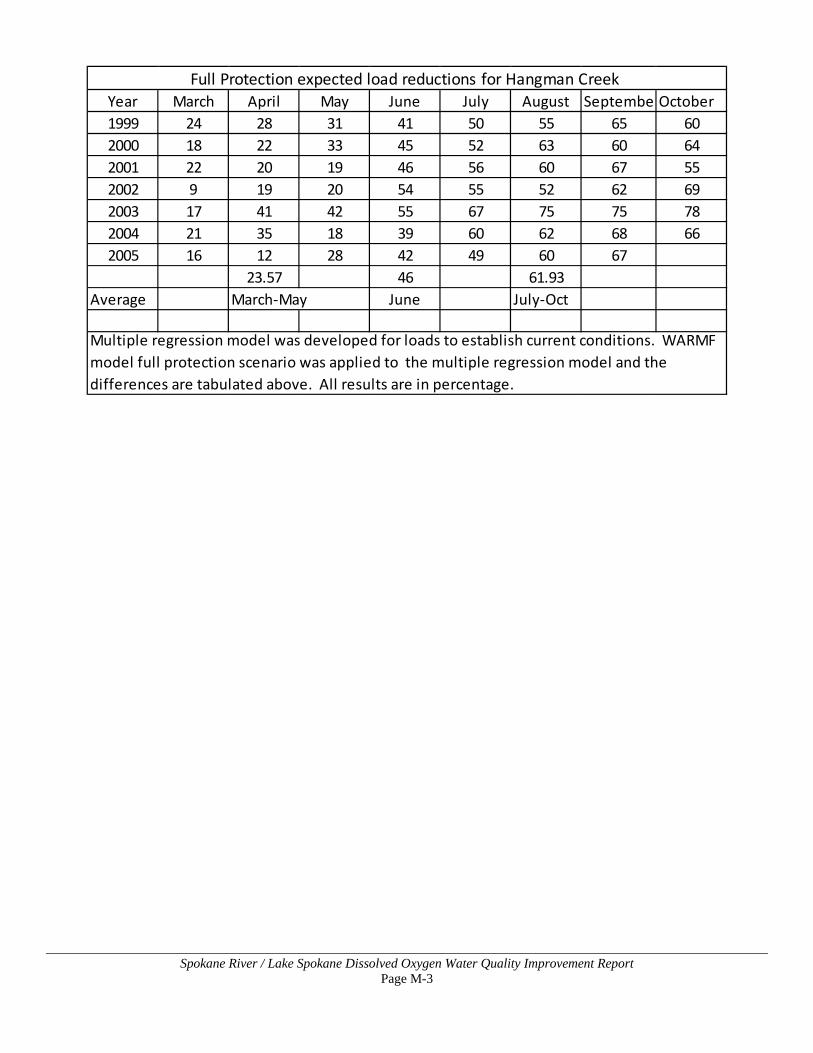
Spokane River / Lake Spokane Dissolved Oxygen Water Quality Improvement Report Page M-3
Year March April May June July August Septembe October1999 24 28 31 41 50 55 65 602000 18 22 33 45 52 63 60 642001 22 20 19 46 56 60 67 552002 9 19 20 54 55 52 62 692003 17 41 42 55 67 75 75 782004 21 35 18 39 60 62 68 662005 16 12 28 42 49 60 67
23.57 46 61.93Average March-May June July-Oct
Full Protection expected load reductions for Hangman Creek
Multiple regression model was developed for loads to establish current conditions. WARMF model full protection scenario was applied to the multiple regression model and the differences are tabulated above. All results are in percentage.
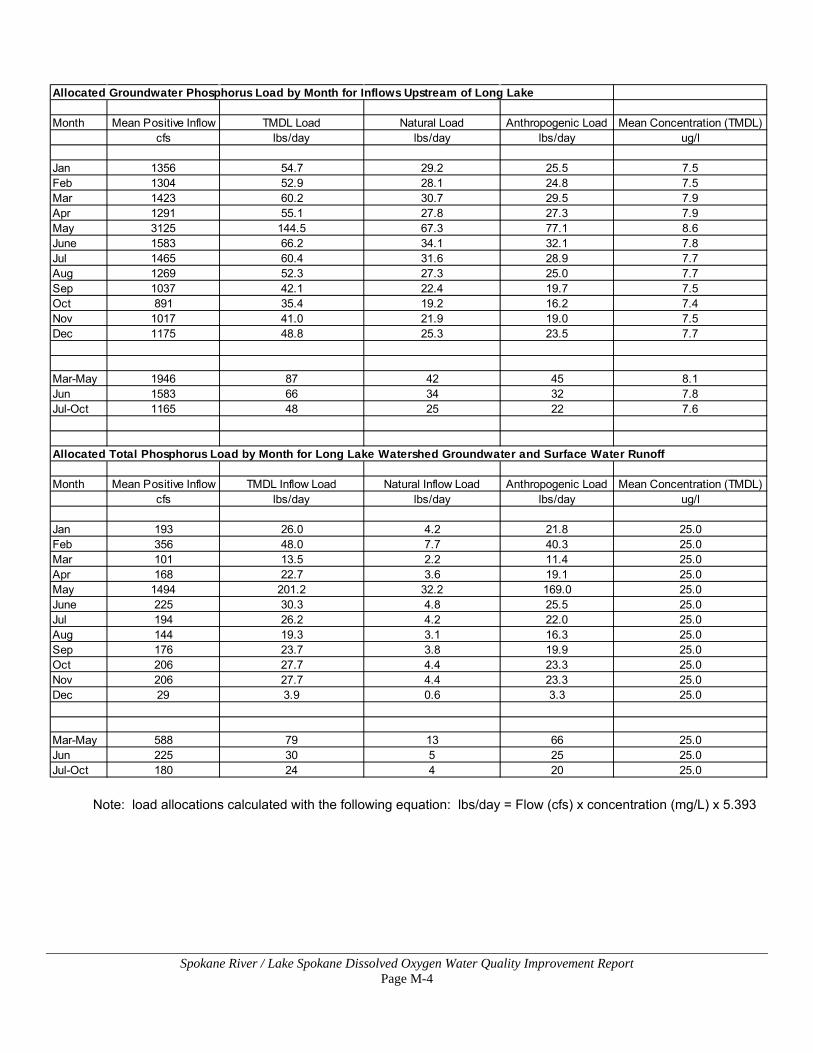
Spokane River / Lake Spokane Dissolved Oxygen Water Quality Improvement Report Page M-4
Note: load allocations calculated with the following equation: lbs/day = Flow (cfs) x concentration (mg/L) x 5.393
Allocated Groundwater Phosphorus Load by Month for Inflows Upstream of Long Lake
Month Mean Positive Inflow TMDL Load Natural Load Anthropogenic Load Mean Concentration (TMDL)cfs lbs/day lbs/day lbs/day ug/l
Jan 1356 54.7 29.2 25.5 7.5Feb 1304 52.9 28.1 24.8 7.5Mar 1423 60.2 30.7 29.5 7.9Apr 1291 55.1 27.8 27.3 7.9May 3125 144.5 67.3 77.1 8.6June 1583 66.2 34.1 32.1 7.8Jul 1465 60.4 31.6 28.9 7.7Aug 1269 52.3 27.3 25.0 7.7Sep 1037 42.1 22.4 19.7 7.5Oct 891 35.4 19.2 16.2 7.4Nov 1017 41.0 21.9 19.0 7.5Dec 1175 48.8 25.3 23.5 7.7
Mar-May 1946 87 42 45 8.1Jun 1583 66 34 32 7.8Jul-Oct 1165 48 25 22 7.6
Allocated Total Phosphorus Load by Month for Long Lake Watershed Groundwater and Surface Water Runoff
Month Mean Positive Inflow TMDL Inflow Load Natural Inflow Load Anthropogenic Load Mean Concentration (TMDL)cfs lbs/day lbs/day lbs/day ug/l
Jan 193 26.0 4.2 21.8 25.0Feb 356 48.0 7.7 40.3 25.0Mar 101 13.5 2.2 11.4 25.0Apr 168 22.7 3.6 19.1 25.0May 1494 201.2 32.2 169.0 25.0June 225 30.3 4.8 25.5 25.0Jul 194 26.2 4.2 22.0 25.0Aug 144 19.3 3.1 16.3 25.0Sep 176 23.7 3.8 19.9 25.0Oct 206 27.7 4.4 23.3 25.0Nov 206 27.7 4.4 23.3 25.0Dec 29 3.9 0.6 3.3 25.0
Mar-May 588 79 13 66 25.0Jun 225 30 5 25 25.0Jul-Oct 180 24 4 20 25.0
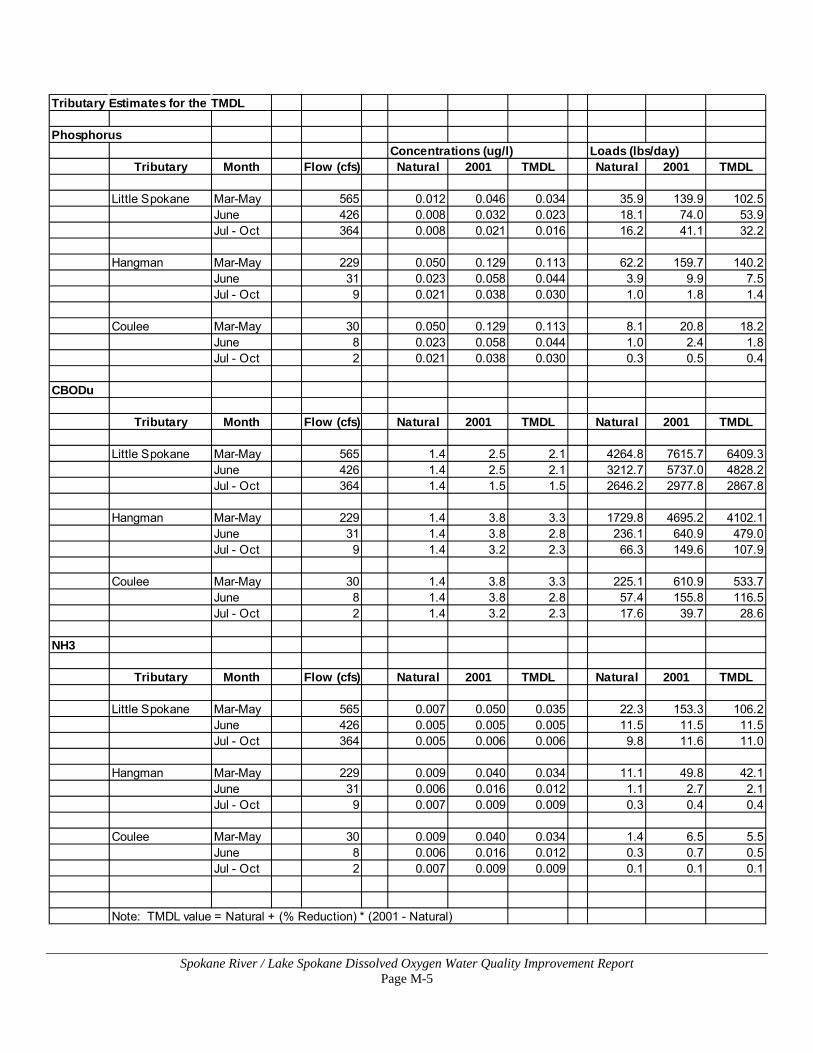
Spokane River / Lake Spokane Dissolved Oxygen Water Quality Improvement Report Page M-5
Tributary Estimates for the TMDL
PhosphorusConcentrations (ug/l) Loads (lbs/day)
Tributary Month Flow (cfs) Natural 2001 TMDL Natural 2001 TMDL
Little Spokane Mar-May 565 0.012 0.046 0.034 35.9 139.9 102.5June 426 0.008 0.032 0.023 18.1 74.0 53.9Jul - Oct 364 0.008 0.021 0.016 16.2 41.1 32.2
Hangman Mar-May 229 0.050 0.129 0.113 62.2 159.7 140.2June 31 0.023 0.058 0.044 3.9 9.9 7.5Jul - Oct 9 0.021 0.038 0.030 1.0 1.8 1.4
Coulee Mar-May 30 0.050 0.129 0.113 8.1 20.8 18.2June 8 0.023 0.058 0.044 1.0 2.4 1.8Jul - Oct 2 0.021 0.038 0.030 0.3 0.5 0.4
CBODu
Tributary Month Flow (cfs) Natural 2001 TMDL Natural 2001 TMDL
Little Spokane Mar-May 565 1.4 2.5 2.1 4264.8 7615.7 6409.3June 426 1.4 2.5 2.1 3212.7 5737.0 4828.2Jul - Oct 364 1.4 1.5 1.5 2646.2 2977.8 2867.8
Hangman Mar-May 229 1.4 3.8 3.3 1729.8 4695.2 4102.1June 31 1.4 3.8 2.8 236.1 640.9 479.0Jul - Oct 9 1.4 3.2 2.3 66.3 149.6 107.9
Coulee Mar-May 30 1.4 3.8 3.3 225.1 610.9 533.7June 8 1.4 3.8 2.8 57.4 155.8 116.5Jul - Oct 2 1.4 3.2 2.3 17.6 39.7 28.6
NH3
Tributary Month Flow (cfs) Natural 2001 TMDL Natural 2001 TMDL
Little Spokane Mar-May 565 0.007 0.050 0.035 22.3 153.3 106.2June 426 0.005 0.005 0.005 11.5 11.5 11.5Jul - Oct 364 0.005 0.006 0.006 9.8 11.6 11.0
Hangman Mar-May 229 0.009 0.040 0.034 11.1 49.8 42.1June 31 0.006 0.016 0.012 1.1 2.7 2.1Jul - Oct 9 0.007 0.009 0.009 0.3 0.4 0.4
Coulee Mar-May 30 0.009 0.040 0.034 1.4 6.5 5.5June 8 0.006 0.016 0.012 0.3 0.7 0.5Jul - Oct 2 0.007 0.009 0.009 0.1 0.1 0.1
Note: TMDL value = Natural + (% Reduction) * (2001 - Natural)