SPME Fiber Comparison
9
For more information visit: www.palsystem.com PAL is a registered trademark of CTC Analytics AG, Switzerland P r i n t e d 0 2 / 2 0 1 4 Comparison of PAL SPME Fibers with established Fibers Abstract The performance of SPME fibers is an essential aspect of an analytical method. This study shows the comparison of three different SPME fibers of a conventional brand (referred to in the following as ‘Brand X‘) and the new PAL SPME Fibers. The tests involve the E PA Method 8310 for PAH standards using three dedicated Brand X fibers, and the PAL SPM E Fibers PDMS 7 µm, PDMS 30 µm, and Acrylate 85 µm. Furthermore the EPA Method 502.2 was tested for a mixture of 64 VOCs (Mega Mix 502.2) using two dedicated Brand X fibers, and the PAL SPME Fibers PDMS 100 µm and Carbon WR 95 µm. The new PAL fibers (PDMS fibers 7 µm, 30 µm, and 100 µm and the Acrylate fibers) yield identical results when compared with the corresponding Brand X fibers. For medium and high boiling compounds the PAL Carbon WR Fibers show a signifi- cantly better performance than the respective Brand X fibers.
-
Upload
salvaleuven -
Category
Documents
-
view
231 -
download
0
Transcript of SPME Fiber Comparison

8/11/2019 SPME Fiber Comparison
http://slidepdf.com/reader/full/spme-fiber-comparison 1/8
For more information visit:
www.palsystem.com
PAL is a registered trademark of CTC Analytics AG, Switzerland
P r
i n t e d
0 2 / 2 0 1 4
Comparison of PAL SPME Fiberswith established Fibers
Abstract
The performance of SPME fibers is an essential aspect of an analytical method. This study shows the comparison of threedifferent SPME fibers of a conventional brand (referred to in the following as ‘Brand X‘) and the new PAL SPME Fibers.The tests involve the EPA Method 8310 for PAH standards using three dedicated Brand X fibers, and the PAL SPME Fibers
PDMS 7 µm, PDMS 30 µm, and Acrylate 85 µm. Furthermore the EPA Method 502.2 was tested for a mixture of 64 VOCs(Mega Mix 502.2) using two dedicated Brand X fibers, and the PAL SPME Fibers PDMS 100 µm and Carbon WR 95 µm.The new PAL fibers (PDMS fibers 7 µm, 30 µm, and 100 µm and the Acrylate fibers) yield identical results when comparedwith the corresponding Brand X fibers. For medium and high boiling compounds the PAL Carbon WR Fibers show a signifi-cantly better performance than the respective Brand X fibers.

8/11/2019 SPME Fiber Comparison
http://slidepdf.com/reader/full/spme-fiber-comparison 2/8
2 Comparison of PAL SPME Fibers with coventional Fibers
Performance of different SPME Fibers for PAH-Samples (EPA Method 8310)
7 µm PDMS Fiber
Test Procedure
Sample: 10 mL Water + PAH Standard (20 ng/Compound)(EPA Method 8310, PAH Mixture)
Extraction: 30 min Immersion at 40 °C, Agitating at 250 rpm
Thermal Desorption: 1 min. at 250 °C in SPI Liner Directly Connected to the Column
Column: Inertcap 5MS/Sil (GL-Science)15 m x 0.25 mm ID, Film Thickness 0.25 µm
Temp. Progr. GC Oven: 90 °C hold 1 min, 5 °C/min up to 320 °C
Autosampler: Combi PAL
GC MS: Varian 3400 with Varian Saturn Ion Trap
Chromatographic Comparison
Measurements with the PAL 7 µm PDMS fiber were compared to the corresponding Brand X fiber. For each type of fiber aseries of 12 analytical runs were performed. Figure 1 shows the overlay of a chromatogram from the PAL 7 µm PDMS Fiber(blue), and a corresponding Brand X fiber (red).
1 Naphthalene
2 Acenaphthylene
3 Acenaphthene
4 Fluorene
5 Phenanthrene
6 Anthracene
7 Fluoranthene
8 Pyrene
9 Benzo(a)anthracene
10 Chrysene
11 Benzo(a)pyrene
Figure 1: Chromatographic Comparison of PAL Fiber PDMS 7 µm (blue) and Brand X Fiber (red).

8/11/2019 SPME Fiber Comparison
http://slidepdf.com/reader/full/spme-fiber-comparison 3/8
3Comparison of PAL SPME Fibers with coventional Fibers
Quantitative Comparison
The diagram shows the signal areas of three analytical runs for five selected target molecules with the same fiber compared tothe corresponding Brand X fiber. No significant difference between the Brand X and the PAL PDMS 7 µm fibers is observable.The two brands of fibers show identical results.
0
500
1000
1500
2000
7 m PDMS Fibers
Brand X Lot 57291
PAL Fiber 1
PAL Fiber 2
PAL Fiber 3
A r e a
C o u n t s x 1 0 0 0
Figure 2: Quantitative Comparison of PAL 7 µm PDMS Fiber and Brand X Fiber for Five selected Target Molecules.
30 µm PDMS Fiber
Test Procedure
Sample: 10 mL Water + PAH Standard (20 ng/Compound)(EPA Method 8310, PAH Mixture)
Extraction: 30 min Immersion at 40 °C, Agitating at 250 rpm
Thermal Desorption: 1 min. at 250 °C in SPI Liner Directly Connected to the Column
Column: Inertcap 5MS/Sil (GL-Science)15 m x 0.25 mm ID, Film Thickness 0.25 µm
Temp. Progr. GC Oven: 90 °C hold 1 min, 5 °C/min up to 320 °C
Autosampler: Combi PAL
GC MS: Varian 3400 with Varian Saturn Ion Trap
Quantitative Comparison
The diagram shows the signal areas of three analytical runs for five selected target molecules with the same fiber compared tothe corresponding Brand X fiber. No significant difference between the Brand X and the PAL PDMS 30 µm fibers is observable.
The two brands of fibers show identical results.
0
500
1000
1500
2000
2500
30 m PDMS Fibers
Brand X Lot 30151
PAL Fiber 1
PAL Fiber 2
PAL Fiber 3 A r e a C o u n t s x 1 0 0 0
Figure 3: Quantitative Comparison of PAL 30 µm PDMS Fiber and Brand X Fiber for Five selected Target Molecules.
8/11/2019 SPME Fiber Comparison
http://slidepdf.com/reader/full/spme-fiber-comparison 4/8
4 Comparison of PAL SPME Fibers with coventional Fibers
85 µm Acrylate Fiber
Test Procedure
Sample: 10 mL Water + PAH Standard (20 ng/Compound)(EPA Method 8310, PAH Mixture)
Extraction: 30 min Immersion at 40 °C, Agitating at 250 rpm
Thermal Desorption: 1 min. at 250 °C in SPI Liner Directly Connected to the Column
Column: Inertcap 5MS/Sil (GL-Science) 15 m x 0.25 mm ID, Film Thickness 0.25 µm
Temp. Progr. GC Oven: 90 °C hold 1 min, 5 °C/min up to 320 °C
Autosampler: Combi PAL
GC MS: Varian 3400 with Varian Saturn Ion Trap
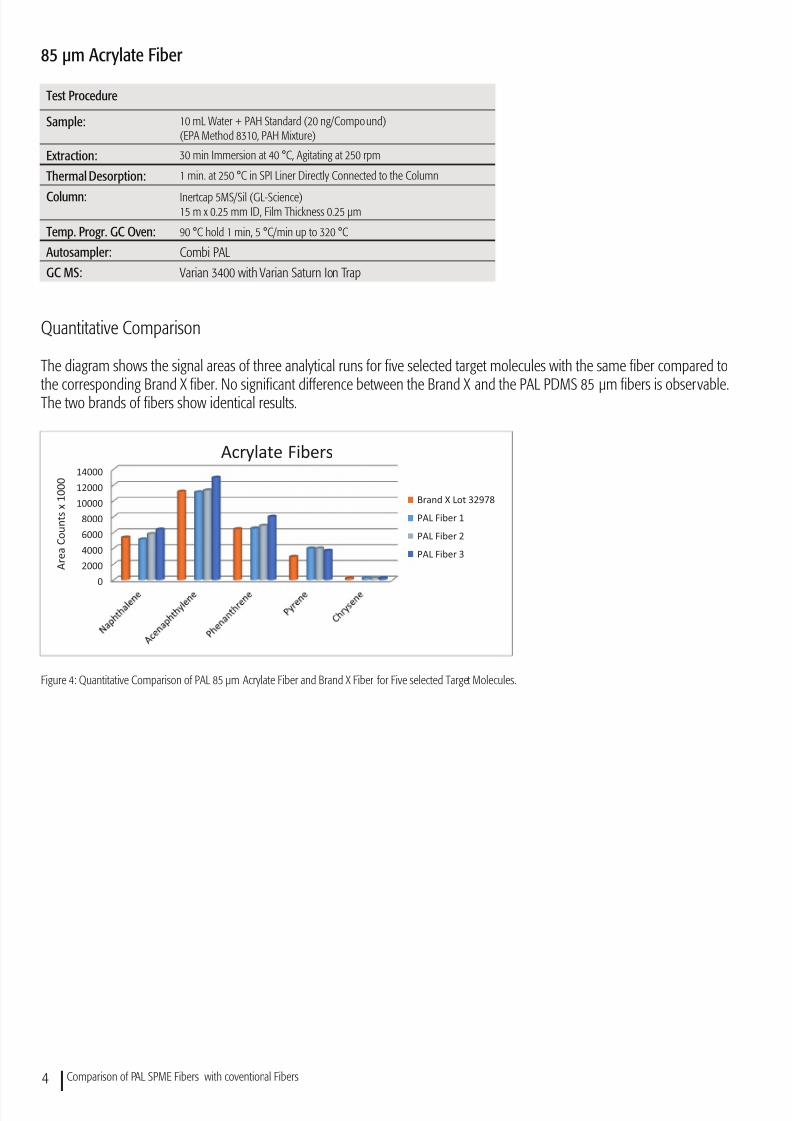
Quantitative Comparison
The diagram shows the signal areas of three analytical runs for five selected target molecules with the same fiber compared to
the corresponding Brand X fiber. No significant difference between the Brand X and the PAL PDMS 85 µm fibers is observable.The two brands of fibers show identical results.
0
2000
4000
6000
8000
10000
12000
14000
Acrylate Fibers
Brand X Lot 32978
PAL Fiber 1
PAL Fiber 2
PAL Fiber 3
A r e a
C o u n t s x 1 0 0 0
Figure 4: Quantitative Comparison of PAL 85 µm Acrylate Fiber and Brand X Fiber for Five selected Target Molecules.

8/11/2019 SPME Fiber Comparison
http://slidepdf.com/reader/full/spme-fiber-comparison 5/8
5Comparison of PAL SPME Fibers with coventional Fibers
Performance of different SPME Fibers for VOC-Samples (EPA Method 502.2)
100 µm PDMS Fiber
Test Procedure
Sample: 10 mL Water + 3 g NaCl + 502.2 MegaMix (20 ng/Compound)(EPA Method 502.2 MegaMix Mixture Restek PNo 30431)
Extraction: 15 min Equilibration Time in Headspace at 50 °C, Agitating at 250 rpmThermal Desorption: 1 min at 250 °C in SPI Liner directly connected to the Column
Column: BGB-624; 30 m x 0.32 mm, Film Thickness 1.8 µm
Temp. Progr. GC Oven: 50 °C hold 1 min; Afterwards 5 °C/min up to 220 °C
Autosampler: Combi PAL
GC MS: Varian 3400 with Varian Saturn Ion Trap
Quantitative Comparison
The diagram shows the signal areas of three analytical runs for six selected target molecules using PDMS 100 µm fibers. Nosignificant difference between the Brand X and the PAL fibers is observable.
0
2000
4000
6000
8000
10000
100 m PDMS Fibers
Brand X Lot 32606
PAL Fiber 1
PAL Fiber 2
PAL Fiber 3
0 0 0 1 x s t n u o C a e r A
Figure 5: Quantitative Comparison of PAL 100 µm PDMS Fiber and Brand X Fiber for Six selected Target Molecules.

8/11/2019 SPME Fiber Comparison
http://slidepdf.com/reader/full/spme-fiber-comparison 6/8
6 Comparison of PAL SPME Fibers with coventional Fibers
95 µm Carbon WR
Test Procedure
Sample: 10 mL Water + 3g NaCl + 502.2 MegaMix (20 ng/Compound)(EPA Method 502.2 MegaMix Mixture Restek PNo 30431)
Extraction: 15 min Equilibration Time in Headspace at 50 °C, Agitating at 250 rpm
Thermal Desorption: 1 min 250 °C in SPI Liner directly connected to the Column
Column: BGB-624; 30 m x 0.32 mm ID, Film Thickness 1.8 µm
Temp. Progr. GC Oven: 50 °C hold 1 min; Afterwards 5 °C/min up to 220 °C
Autosampler: Combi PAL
GC MS: Varian 3400 with Varian Saturn Ion Trap
Chromatographic Comparison
Measurements with the PAL 95 µm Carbon WR fiber were compared to the corresponding Brand X fiber. For each type offiber a series of 12 analytical runs was performed. Figure 1 shows the overlay of a chromatogram from a PAL 95 µm Carbon
WR Fiber (blue), and a Brand X Carboxen®
fiber (red).
1 1,1-Dichloroethene
2 cis-1,2-Dichloroethene
3 Benzene
4 Trichloroethylene
5 Toluene
6 Ethylbenzene
7 m-,p- Xylene
8 o-Xylene
9 Bromobenzene
10 2-Chlorotoluene
11 1,3,5-Trimethylbenzene
12 4 Chlorotoluene
13 tert-Butylbenzene
14 1,2,4-Trimethylbenzene
15 sec-Butylbenzene
16 n-Butylbenzene
17 1,2,4-Trichlorobenzene
18 Naphthalene
19 1,2,3-Trichlorobenzene
Figure 6: Chromatographic Comparison of PAL 95 µm Carbon WR Fiber (blue) and Brand X Carboxen® fiber (red).

8/11/2019 SPME Fiber Comparison
http://slidepdf.com/reader/full/spme-fiber-comparison 7/8
7Comparison of PAL SPME Fibers with coventional Fibers
Quantitative Comparison
The diagram shows the signal areas of three analytical runs for six selected target molecules with the same fiber comparedto the Brand X fiber. The Brand X Carboxen® and the PAL Carbon WR fibers show similar results for low boiling compounds.However, signal areas of higher boiling-point compounds such as Naphthalene show significantly higher performance withthe PAL Carbon WR fibers (Figure 7).
0
200
400
600
800
95 m Carbon WR / Carboxen Fibers
Brand X CX
PAL Fiber 1
PAL Fiber 2
PAL Fiber 3 A r e a C o u n t s x 1 0 0 0
Figure 7: Quantitative Comparison of PAL 95 µm Carbon WR Fiber and Brand X Fiber for Six selected Target Molecules.
Fiber to Fiber Reproducibility
30 µm PDMS Fiber
Test Procedure
Sample: 7.5 mL Water + Performance Mix (Nitrobenzene,2-Nitrotoluene 10 µg,each in 100 µL Methanol) in 10 mL Vial
Extraction: 10 min Immersion at 25 °C
Thermal Desorption: 1 min 280 °C in SPME Liner 0.8 mm ID
Carrier Gas: Hydrogen 70 kPa
Column: ZB-5 15 m x 0.25 mm ID, Film Thickness 0.25 µm
Temp. Progr. GC Oven: 40 °C hold 1 min; Afterwards 5 °C/min up to 80 °C
Autosampler: Combi PAL
GC-FID: Thermo Trace 2000, with FID at 250 °C
GC MS: Varian 3400 with Varian Saturn Ion Trap
Performance Test
In order to ensure consistent quality of the fibers, tests according to the performance test of a well-established brand wereperformed. The absolute values obtained are of minor importance for the analyst, as quantification of SPME analysis alwaysrequires an internal standard method. Nevertheless, those values are interesting for fiber production, as any change in theperformance e.g. variations of the film thickness or changes of the physical properties of the phase can be detected. Thediagram shows the peak areas for two selected molecules obtained from eight different fibers (30 µm PDMS) that had beensubjected to the SPME performance test.

8/11/2019 SPME Fiber Comparison
http://slidepdf.com/reader/full/spme-fiber-comparison 8/8
8 Comparison of PAL SPME Fibers with coventional Fibers
A r e a
C o u n t s x 1 0 0 0
A r e a C o u n
t s x 1 0 0 0
Figure 8: Fiber to Fiber Reproducibility Test.
Parameters of PAL SPME Fibers
Coating Film Thickness(µm)
OperatingTemperature (°C)
MaximumTemperatur (°C)
Hub Color Code P/N
PDMS 7 200-340 340 Green FIB-P-7/10
PDMS 30 200-280 280 Gold FIB-P-30/10
PDMS 100 200-280 280 Red FIB-P-100/10
Polyacrylate 85 200-280 300 Grey FIB-A-85/10
Carbon WR 95 220-300 300 blue FIB-CWR-95/10
Compatibility
PAL SPME Fibers are compatible with all holders currently in use for automated applications.
Conclusion
The new PAL fibers (PDMS fibers 7 µm, 30 µm, and 100 µm and the Acrylate fibers) yield identical results when comparedwith the corresponding Brand X fibers.For medium and high boiling compounds the PAL Carbon WR Fibers show a significantly better performance than the respec-tive Brand X fibers.
The reproducibility of the fiber production is very high. Nevertheless the use of an internal standard for quantification is rec-ommended, as it is common practice for quantitative SPME.
Data Sheet
A detailed data sheet is provided with informations on (pre-) conditioning, operating temperaturesand cleaning in order to gain full performance and an extended lifespan of PAL SPME Fibers.