spm.docx · Web viewproject A might appear to give a better return than B but could be riskier....
167
MODULE-I Synergy Institute of engg. & technology, Dhenkanal
Transcript of spm.docx · Web viewproject A might appear to give a better return than B but could be riskier....

MODULE-I
Synergy Institute of engg. & technology, DhenkanalLecture Notes
Subject-Software Project Management(7thsem.,CSE)Faculty-Nirjharinee Parida
Lecture #1

Introduction to software project management
In this introduction the main questions to be addressed will be:
– What is software project management? Is it really different from ‘ordinary’ project management?
– How do you know when a project has been successful? For example, do the expectations of the customer/client match those of the developers?
What is a project?
Some dictionary definitions:
“A specific plan or design”
“A planned undertaking”
“A large undertaking e.g. a public works scheme”
Key points above are planning and size of task
Jobs versus projects
Jobs’ – repetition of very well-defined and well understood tasks with very little uncertainty
‘Exploration’ – e.g. finding a cure for cancer: the outcome is very uncertain
‘Projects’ – in the middle!
Characteristics of projects
A task is more ‘project-like’ if it is:
• Non-routine

• Planned
• Aiming at a specific target
• Work carried out for a customer
• Involving several specialisms
• Made up of several different phases
• Constrained by time and resources
• Large and/or complex
Are software projects really different from other projects?
Not really! …but…
• Invisibility
• Complexity
• Conformity
• Flexibility
make software more problematic to build than other engineered artefacts.
Lecture #2
Contract management
Contract management is a perspective, discipline and systems approach which looks to actively manage the contracting process end-to-end for the benefit of the organization. In particular, it is intended to:° reduce the fragmentation that characterizes the contracting process in so many organizations;° increase and improve

- quality control,- consistency,- compliance with law and organization policy, and- efficiency (reducing cycle time and transaction overhead); and° enable better collection of information for improved strategic decision making, including better customer-supplier relationship management and increased responsiveness to the market.Selection of an appropriate project approach
• In-house development: most of these issues resolved by IS planning and standards
• Software houses: more applicable as different customers have different needs
• Selection of approach governed by:
– uncertainties of the project
– properties of application to be built
General approach
• Look at risks and uncertainties e.g.
– are requirement well understood?
– are technologies to be used well understood?
• Look at the type of application being built e.g.
– information system? embedded system?
– criticality? differences between target and development environments?
• Clients’ own requirements
– need to use a particular method
Software process
Software Process : Process defines a framework for a set of Key Process Areas (KPAs) that must be established for effective delivery of software engineering technology. This establishes the context in which technical methods are applied, work products such as models, documents, data, reports, forms, etc. are produced, milestones are established, quality is ensured, and change is properly managed.

Software Process Framework : A process framework establishes the foundation for a complete software process by identifying a small number of framework activities that are applicable to all software projects, regardless of size or complexity. It also includes a set of umbrella activities that are applicable across the entire software process. Some most applicable framework activities are described below.
Process models
Choice of process models
• waterfall’ also known as ‘one-shot’, ‘once-through’
• incremental delivery
• evolutionary development
Also use of ‘agile methods’ e.g. extreme programming
Waterfall Model
• the ‘classical’ model
• imposes structure on the project
• every stage needs to be checked and signed off
• BUT

– limited scope for iteration
V-process model
Another way of looking at the waterfall model
Evolutionary delivery: prototyping
An iterative process of creating quickly and inexpensively live and working models to test out requirements and assumptions’
main types
• ‘throw away’ prototypes
• evolutionary prototypes
what is being prototyped?
• human-computer interface
• functionality
Reasons for prototyping
communicationQuickplan
ModelingQuick design
Constructionof prototype
Deploymentdelivery &feedback

• learning by doing
• improved communication
• improved user involvement
• a feedback loop is established
• reduces the need for documentation
• reduces maintenance costs i.e. changes after the application goes live
• prototype can be used for producing expected results
Prototyping: some dangers
• users may misunderstand the role of the prototype
• lack of project control and standards possible
• additional expense of building prototype
• focus on user-friendly interface could be at expense of machine efficiency
Other ways of categorizing prototyping
• what is being learnt?
– organizational prototype
– hardware/software prototype (‘experimental’)
– application prototype (‘exploratory’)
• to what extent
– mock-ups
– simulated interaction
– partial working models: vertical versus horizontal
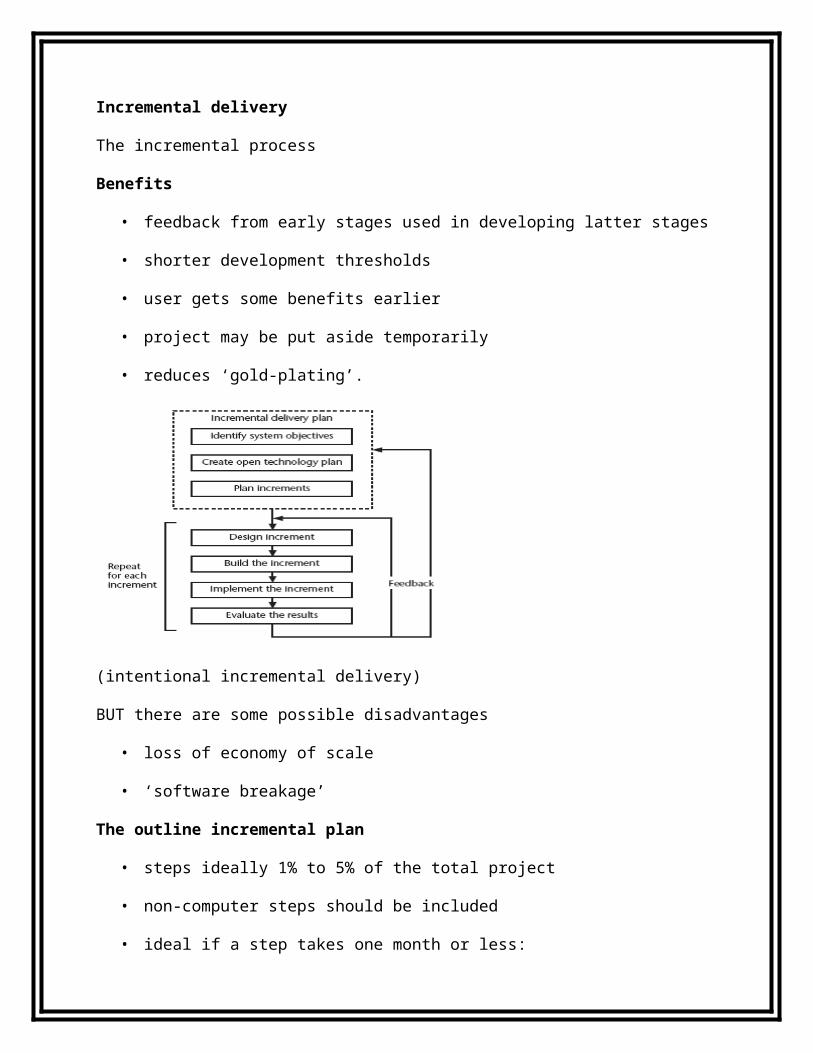
Incremental delivery
The incremental process
Benefits
• feedback from early stages used in developing latter stages

• shorter development thresholds
• user gets some benefits earlier
• project may be put aside temporarily
• reduces ‘gold-plating’.
(intentional incremental delivery)
BUT there are some possible disadvantages
• loss of economy of scale
• ‘software breakage’
The outline incremental plan
• steps ideally 1% to 5% of the total project
• non-computer steps should be included
• ideal if a step takes one month or less:
– not more than three months
• each step should deliver some benefit to the user
• some steps will be physically dependent on others
The Unified process
‘Agile’ methods
structured development methods have some perceived advantages
– produce large amounts of documentation which can be largely unread
– documentation has to be kept up to date
– division into specialist groups and need to follow procedures stifles communication
– users can be excluded from decision process
– long lead times to deliver anything etc. etc
Dynamic system development method
• UK-based consortium
• arguably DSDM can be seen as replacement for SSADM
• DSDM is more a project management approach than a development approach
• Can still use DFDs, LDSs etc!
Nine core DSDM principles
1. Active user involvement
2. Teams empowered to make decisions
3. Frequent delivery of products
inceptionelaboration

4. Fitness for business purpose
5. Iterative and incremental delivery
6. Changes are reversible
7. Requirements base-lined at a high level
8. Testing integrated with development
9. Collaborative and co-operative approach
DSDM framework
DSDM: time-boxing
• time-box fixed deadline by which something has to be delivered
• typically two to six weeks
• MOSCOW priorities
– Must have - essential
– Should have - very important, but system could operate without
– Could have
– Want - but probably won’t get!
Extreme programming
• increments of one to three weeks

– customer can suggest improvement at any point
• argued that distinction between design and building of software are artificial
• code to be developed to meet current needs only
• frequent re-factoring to keep code structured
• developers work in pairs
• test cases and expected results devised before software design
• after testing of increment, test cases added to a consolidated set of test cases
Macro and micro processes
A macro process containing three iterative micro processes.
‘rules of thumb’ about approach to be used
IF uncertainty is high
THEN use evolutionary approach
IF complexity is high but uncertainty is not
THEN use incremental approach
IF uncertainty and complexity both low
THEN use one-shot
IF schedule is tight
THEN use evolutionary or incremental
Lecture #3
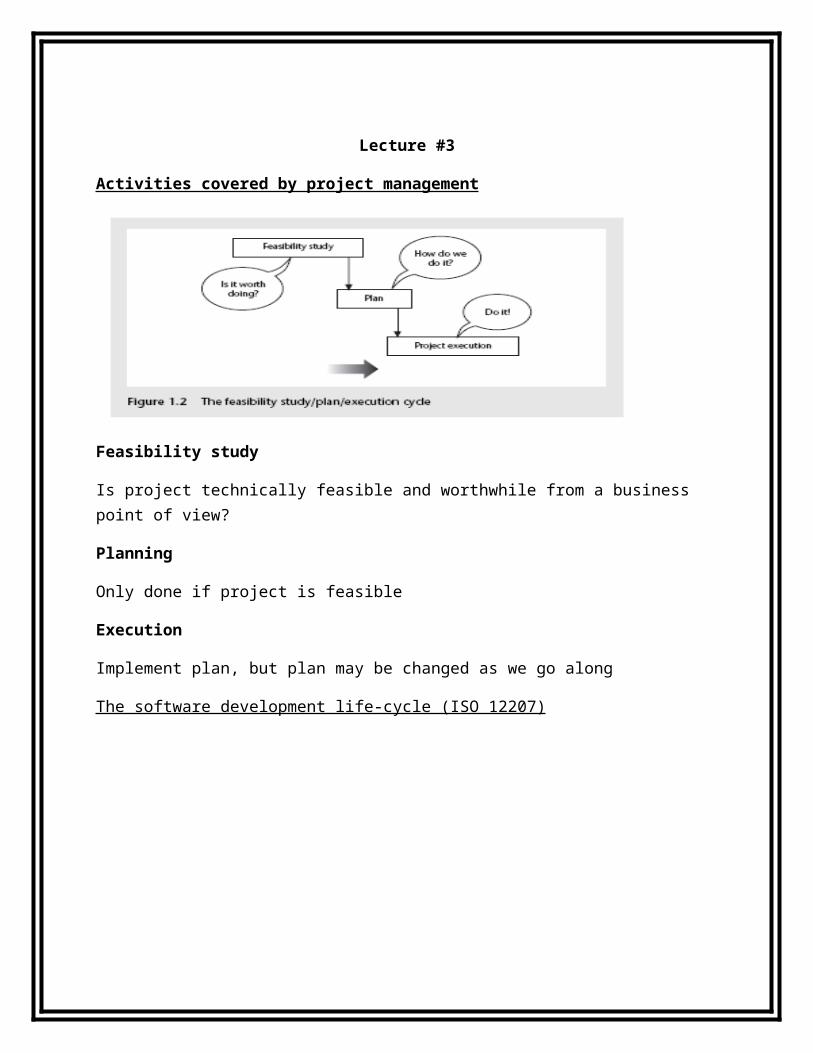
Activities covered by project management
Feasibility study
Is project technically feasible and worthwhile from a business point of view?
Planning
Only done if project is feasible
Execution
Implement plan, but plan may be changed as we go along
The software development life-cycle (ISO 12207)

ISO 12207 life-cycle
Requirements analysis
– Requirements elicitation: what does the client need?
– Analysis: converting ‘customer-facing’ requirements into equivalents that developers can understand
– Requirements will cover
• Functions
• Quality
• Resource constraints i.e. costs
– Architecture design
– Based on system requirements
– Defines components of system: hardware, software, organizational
– Software requirements will come out of this
– Code and test
– Of individual components
– Integration
– Putting the components together
– Qualification testing
– Testing the system (not just the software)
– Installation
– The process of making the system operational
– Includes setting up standing data, setting system parameters, installing on operational hardware platforms, user training etc
– Acceptance support
– Including maintenance and enhancement
Some ways of categorizing projects
Distinguishing different types of project is important as different types of task need different project approaches e.g.
• Information systems versus embedded systems
• Objective-based versus product-based
Lecture #4
What is management?
This involves the following activities:
• Planning – deciding what is to be done
• Organizing – making arrangements
• Staffing – selecting the right people for the job
• Directing – giving instruction
• Monitoring – checking on progress
• Controlling – taking action to remedy hold-ups
• Innovating – coming up with solutions when problems emerge
• Representing – liaising with clients, users, developers and other stakeholders
Setting objectives

• Answering the question ‘What do we have to do to have a success?’
• Need for a project authority
– Sets the project scope
– Allocates/approves costs
• Could be one person - or a group
– Project Board
– Project Management Board
– Steering committee
Objectives
Informally, the objective of a project can be defined by completing the statement:
The project will be regarded as a success if………………………………..
Rather like post-conditions for the project
Focus on what will be put in place, rather than how activities will be carried out
Objectives should be SMART
S – specific, that is, concrete and well-defined
M – Measurable, that is, satisfaction of the objective can be objectively judged
A – Achievable, that is, it is within the power of the individual or group concerned to meet the target
R – Relevant, the objective must relevant to the true purpose of the project
T – Time constrained: there is defined point in time by which the objective should be achieved
Goals/sub-objectives
These are steps along the way to achieving the objective. Informally, these can be defined by completing the sentence…
Objective X will be achieved
IF the following goals are all achieved
A……………
B……………
C…………… etc
Often a goal can be allocated to an individual.
Individual may have the capability of achieving goal, but not the objective on their own e.g.
Objective – user satisfaction with software product
Analyst goal – accurate requirements
Developer goal – software that is reliable
Measures of effectiveness
How do we know that the goal or objective has been achieved?
By a practical test, that can be objectively assessed.
e.g. for user satisfaction with software product:
• Repeat business – they buy further products from us
• Number of complaints – if low etc etc
Stakeholders
These are people who have a stake or interest in the project
In general, they could be users/clients or developers/implementers
They could be:
• Within the project team
• Outside the project team, but within the same organization
• Outside both the project team and the organization
The business case
Benefits of delivered project must outweigh costs
Costs include:
- Development
- Operation
Benefits
- Quantifiable
- Non-quantifiable
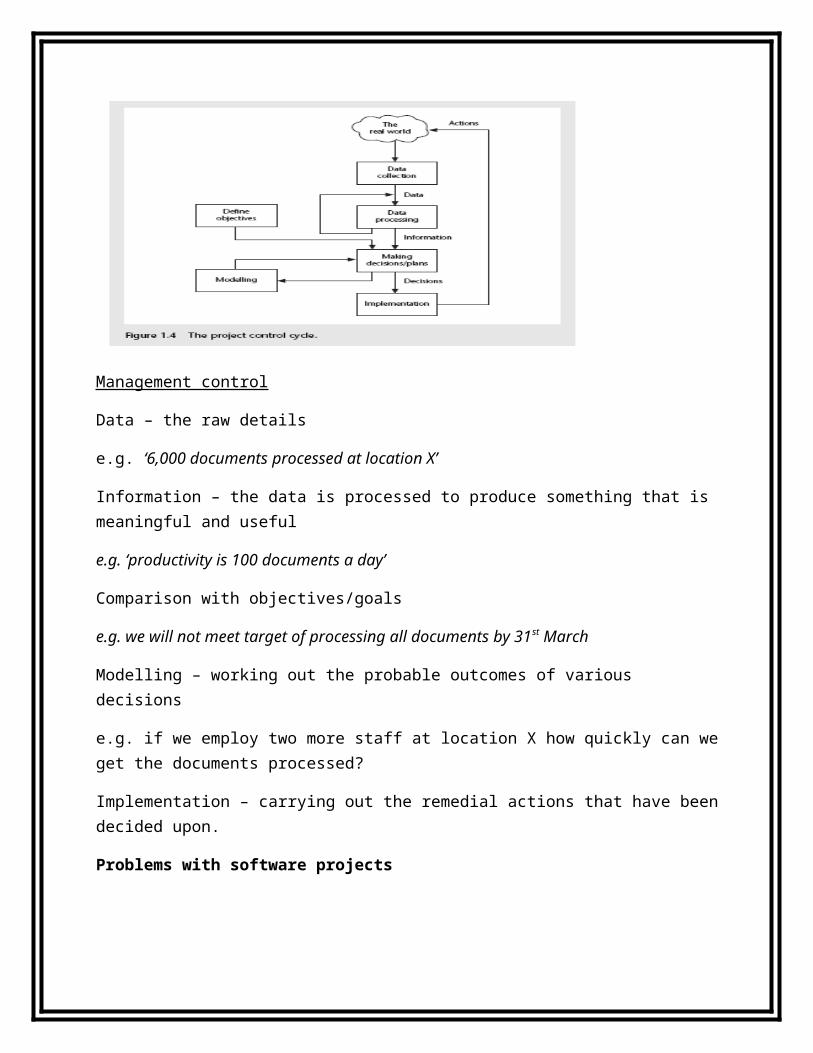
Management control
Management control
Data – the raw details
e.g. ‘6,000 documents processed at location X’
Information – the data is processed to produce something that is meaningful and useful
e.g. ‘productivity is 100 documents a day’
Comparison with objectives/goals
e.g. we will not meet target of processing all documents by 31st March
Modelling – working out the probable outcomes of various decisions
e.g. if we employ two more staff at location X how quickly can we get the documents processed?
Implementation – carrying out the remedial actions that have been decided upon.
Problems with software projects
Lecture #5
Overview of Project planning
Step Wise: An approach to planning software projects
‘Step Wise’ – aspirations
• Practicality
– tries to answer the question ‘what do I do now?’
• Scalability
– useful for small project as well as large
• Range of application
• Accepted techniques
– e.g. borrowed from PRINCE etc
‘Step Wise’ - an overview
A project scenario
• Hardware/software engineering company (C++ language of choice)
• teams are selected for individual projects - some friction has been found between team members
HR manager suggests psychometric testing to select team
• Software package to be used to test staff
• Visual basic suggested as a vehicle for implementation
• usability is important - decision to carry out usability tests
Step 1 establish project scope and objectives
• 1.1 Identify objectives and measures of effectiveness
– ‘how do we know if we have succeeded?’
• 1.2 Establish a project authority
– ‘who is the boss?’
• 1.3 Identify all stakeholders in the project and their interests
– ‘who will be affected/involved in the project?’
• 1.4 Modify objectives in the light of stakeholder analysis
– ‘do we need to do things to win over stakeholders?’
• 1.5 Establish methods of communication with all parties
– ‘how do we keep in contact?’
Project authority
– should be a project manager rather than HR manager?
Stakeholders
– project team members to complete on-line questionnaires: concern about results.
Step 2 Establish project infrastructure
• 2.1 Establish link between project and any strategic plan
– ‘why did they want the project?’
• 2.2 Identify installation standards and procedures
– ‘what standards do we have to follow?’
• 2.3. Identify project team organization
– ‘where do I fit in?’
Step 3 Analysis of project characteristics
• 3.1 Distinguish the project as either objective or product-based.
– Is there more than one way of achieving success?
• 3.2 Analyse other project characteristics (including quality based ones)
– what is different about this project?
• Identify high level project risks
– ‘what could go wrong?’
– ‘what can we do to stop it?’
• Take into account user requirements concerning implementation
• Select general life cycle approach
– waterfall? Increments? Prototypes?
• Review overall resource estimates
‘does all this increase the cost?’
• Objectives vs. products
– use paper questionnaire then input results of the analysis?
• Some risks
– team members worried about implications and do no co-operate
– project managers unwilling to try out application
– Developer not familiar with features of VB
• Answer? - evolutionary prototype?
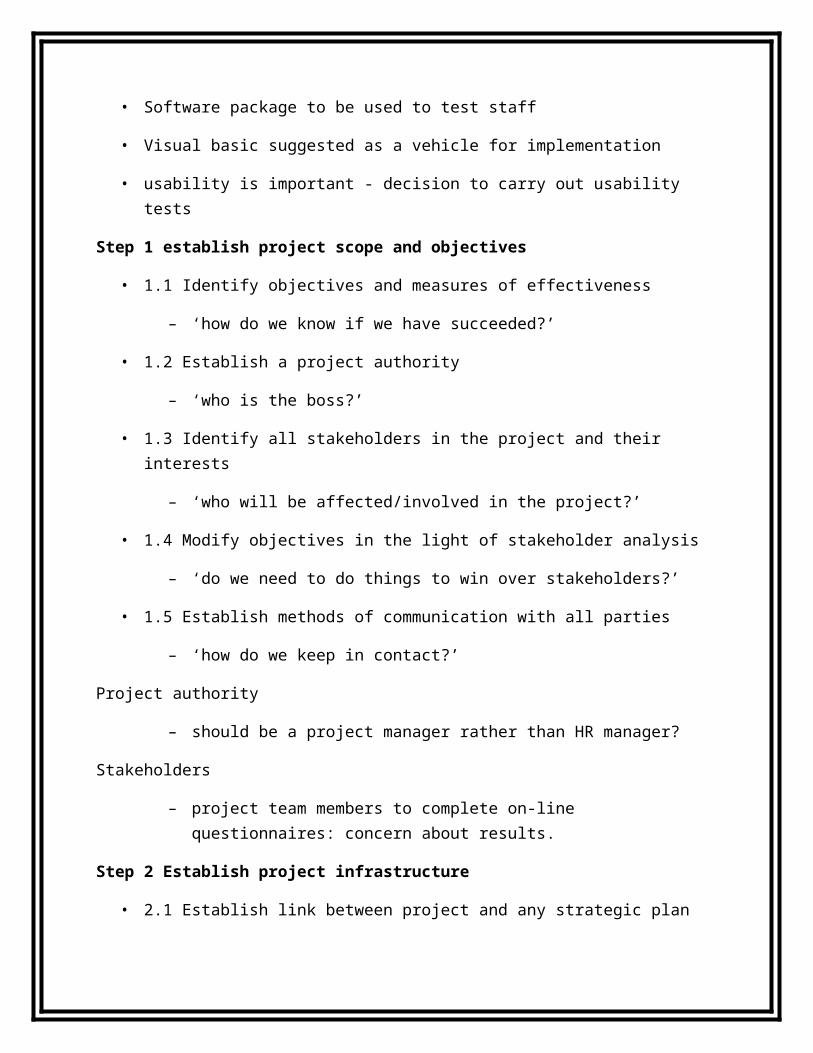
Step 4 Identify project products and activities
4.1 Identify and describe project products - ‘what do we have to produce?’
Usability testing

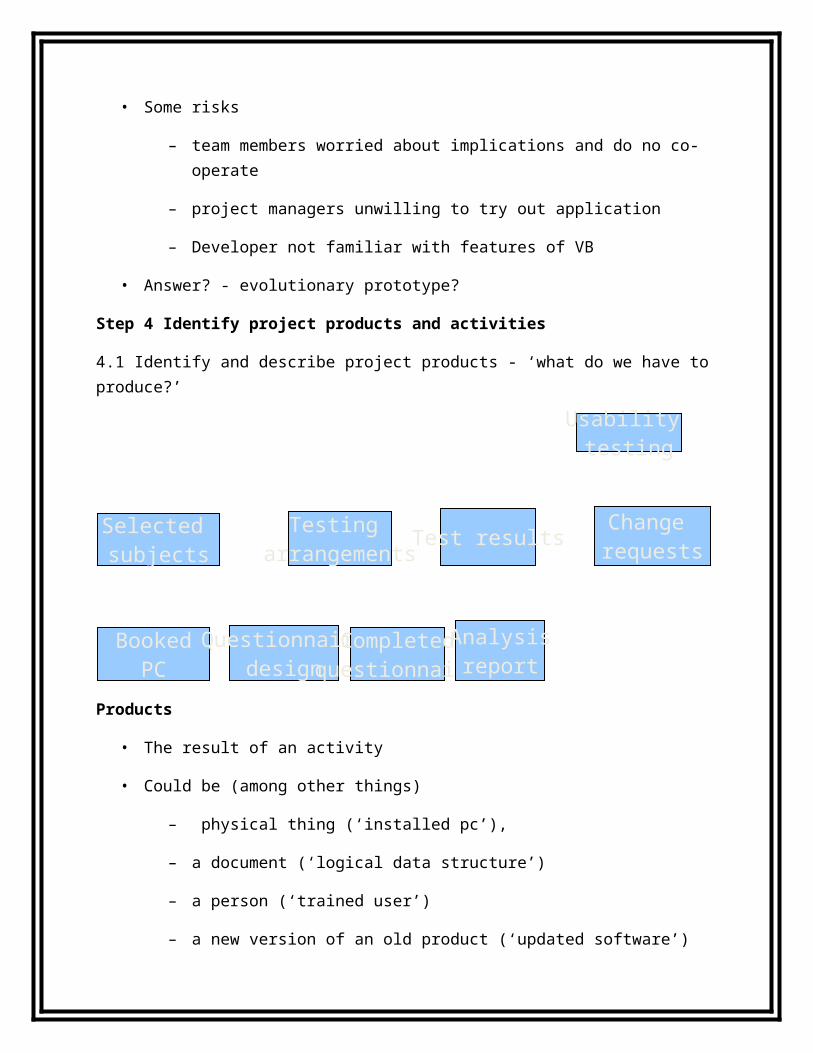
Products
• The result of an activity
• Could be (among other things)
– physical thing (‘installed pc’),
– a document (‘logical data structure’)
– a person (‘trained user’)
– a new version of an old product (‘updated software’)
• The following are NOT normally products:
– activities (e.g. ‘training’)
– events (e.g. ‘interviews completed’)
– resources and actors (e.g. ‘software developer’) - may be exceptions to this
• Products CAN BE deliverable or intermediate
Product description (PD)
• Product identity
• Description - what is it?
• Derivation - what is it based on?
• Composition - what does it contain?
• Format
• Relevant standards
• Quality criteria
Selected subjects
Testing arrangements
Test results Change requests
BookedPC
Questionnairedesign
Completedquestionnaire
Analysisreport
Create a PD for ‘test data’
4.2 document
Generic
product
flows
Step 4.3 Recognize product instances
• The PBS and PFD will probably have identified generic products e.g. ‘software modules’
• It might be possible to identify specific instances e.g. ‘module A’, ‘module B’ …
• But in many cases this will have to be left to later, more detailed, planning
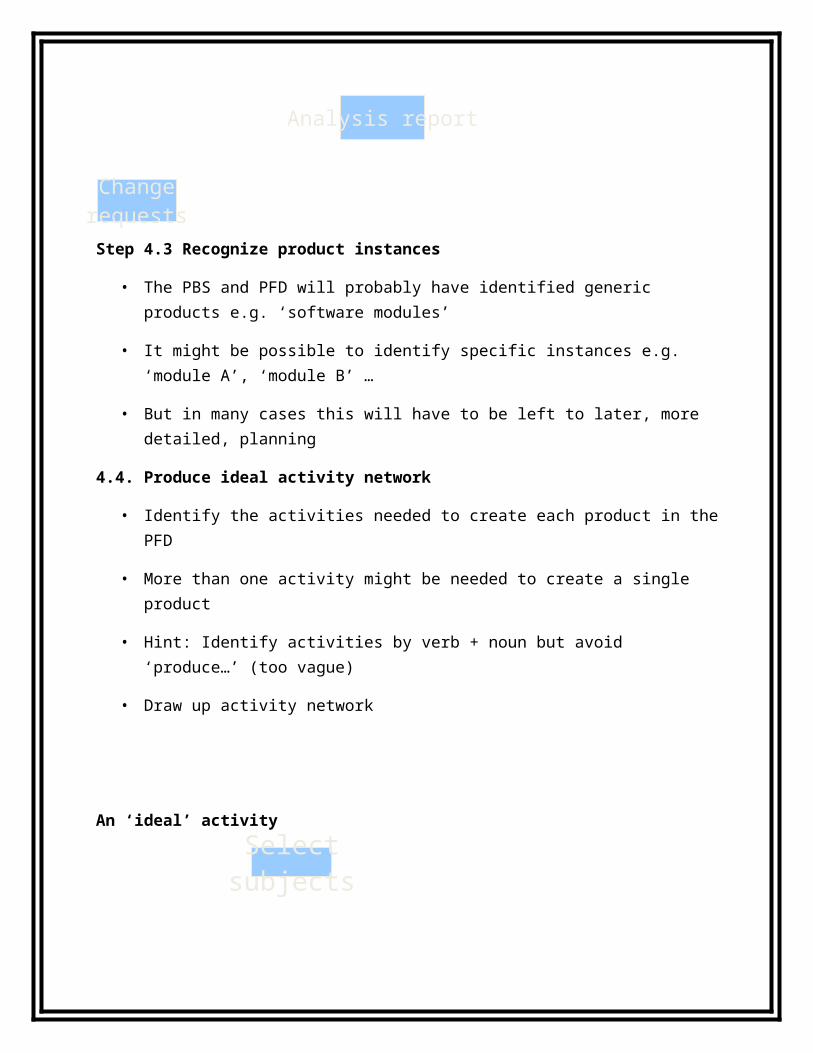
4.4. Produce ideal activity network
• Identify the activities needed to create each product in the PFD
• More than one activity might be needed to create a single product
• Hint: Identify activities by verb + noun but avoid ‘produce…’ (too vague)
• Draw up activity network
An ‘ideal’ activity
Testing plan
Selectedsubjects
Questionnairedesign
Bookedmachine
Completedquestionnaire Test results
Analysis report
Changerequests
Selectsubjects

Step 4.5 Add check-points if needed
Lecture #6
Step 5:Estimate effort for each activity
• 5.1 Carry out bottom-up estimates
– distinguish carefully between effort and elapsed time
• 5.2. Revise plan to create controllable activities
– break up very long activities into a series of smaller ones
– bundle up very short activities (create check lists?)
Step 6: Identify activity risks
• 6.1.Identify and quantify risks for activities
– damage if risk occurs (measure in time lost or money)
– likelihood if risk occurring
• 6.2. Plan risk reduction and contingency measures
– risk reduction: activity to stop risk occurring
– contingency: action if risk does occur
• 6.3 Adjust overall plans and estimates to take account of risks
– e.g. add new activities which reduce risks associated with other activities e.g. training, pilot trials, information gathering
Step 7: Allocate resources
Plantesting
Designquestionnaire
Conducttests
Analyse resultsDraft change
requests
Book machine
• 7.1 Identify and allocate resources to activities
• 7.2 Revise plans and estimates to take into account resource constraints
– e.g. staff not being available until a later date
– non-project activities
Visualizing Techniques
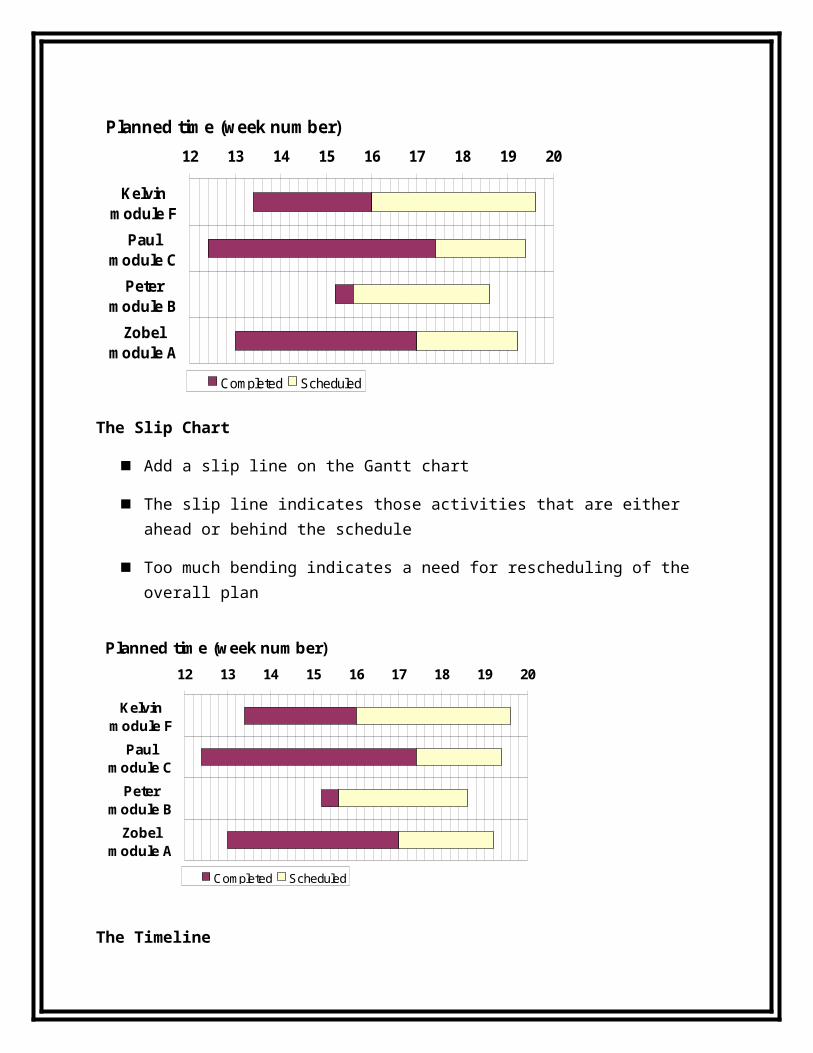
The Gantt chart
A static picture showing the current progress of the project
The Timeline
A dynamic picture showing the progress of the project and how the project has changed through time
Gantt charts
An activity bar chart showing
the activities, their scheduled dates and duration
the reported progress of the activities;
‘today cursor’
12 13 14 15 16 17 18 19 20
Zobelmodule A
Petermodule B
Paulmodule C
Kelvinmodule F
Planned time (week number)
Completed Scheduled
The Slip Chart

Add a slip line on the Gantt chart
The slip line indicates those activities that are either ahead or behind the schedule
Too much bending indicates a need for rescheduling of the overall plan
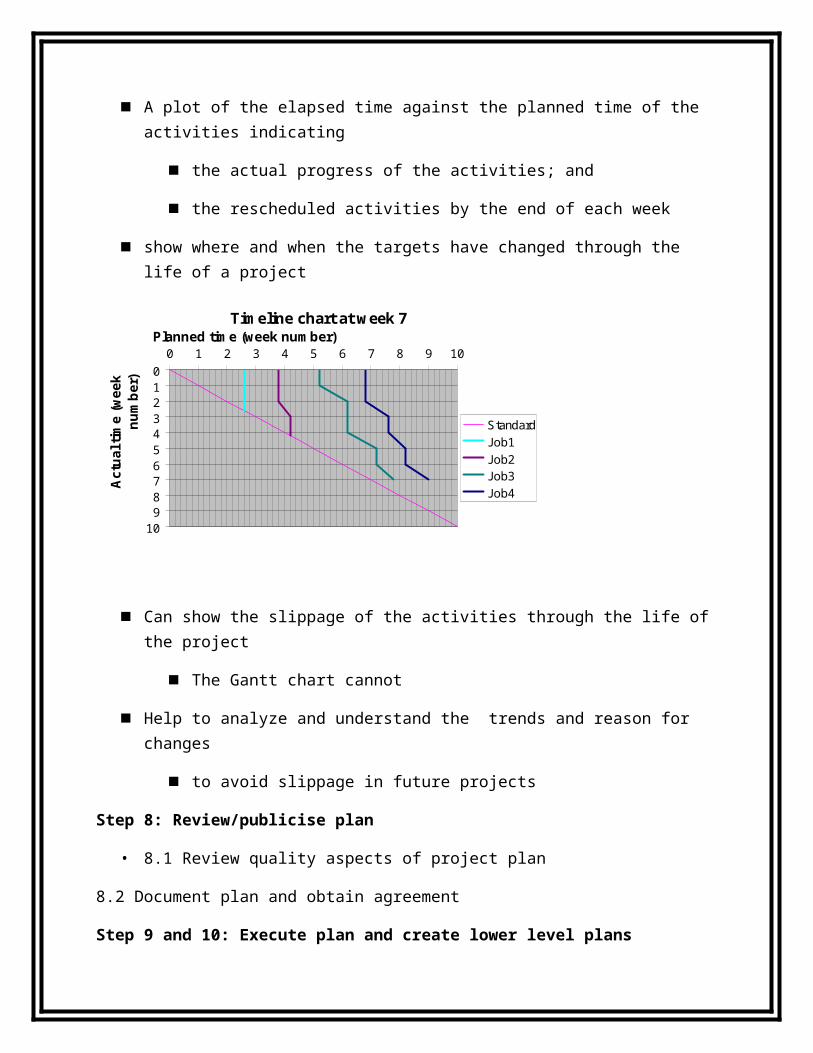
The Timeline
A plot of the elapsed time against the planned time of the activities indicating
the actual progress of the activities; and
the rescheduled activities by the end of each week
show where and when the targets have changed through the life of a project
Can show the slippage of the activities through the life of the project
12 13 14 15 16 17 18 19 20
Zobelmodule A
Petermodule B
Paulmodule C
Kelvinmodule F
Planned time (week number)
Completed Scheduled
Timeline chart at week 7
0123456789
10
0 1 2 3 4 5 6 7 8 9 10Planned time (week number)
Act
ual t
ime
(wee
k nu
mbe
r)
StandardJob1Job2Job3Job4
The Gantt chart cannot
Help to analyze and understand the trends and reason for changes
to avoid slippage in future projects
Step 8: Review/publicise plan
• 8.1 Review quality aspects of project plan
8.2 Document plan and obtain agreement
Step 9 and 10: Execute plan and create lower level plans
Lecture #7
Programme management and project evaluation
Programme management
• One definition:
‘a group of projects that are managed in a co-ordinated way to gain benefits that would not be possible were the projects to be managed independently’ Ferns
Programmes may be
• Strategic
• Business cycle programmes
• Infrastructure programmes
• Research and development programmes
• Innovative partnerships
Programme managers versus project managers
Programme manager
– Many simultaneous projects
– Personal relationship with skilled resources
– Optimization of resource use
– Projects tend to be seen as similar
Project manager
– One project at a time
– Impersonal relationship with resources
– Minimization of demand for resources
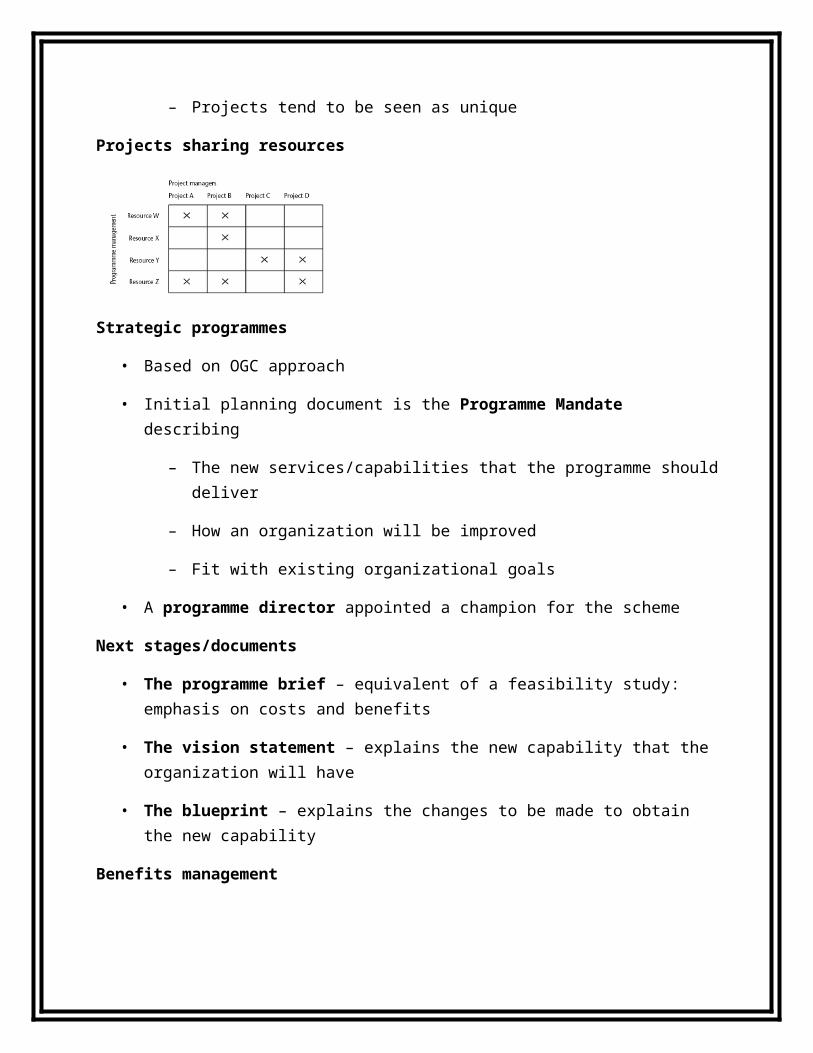
– Projects tend to be seen as unique
Projects sharing resources
Strategic programmes
• Based on OGC approach
• Initial planning document is the Programme Mandate describing
– The new services/capabilities that the programme should deliver
– How an organization will be improved
– Fit with existing organizational goals
• A programme director appointed a champion for the scheme
Next stages/documents
• The programme brief – equivalent of a feasibility study: emphasis on costs and benefits
• The vision statement – explains the new capability that the organization will have
• The blueprint – explains the changes to be made to obtain the new capability
Benefits management
• Providing an organization with a capability does not guarantee that this will provide benefits envisaged – need for benefits management

• This has to be outside the project – project will have been completed
Therefore done at programme level
To carry this out, you must:
• Define expected benefits
• Analyse balance between costs and benefits
• Plan how benefits will be achieved
• Allocate responsibilities for their achievement
• Monitor achievement of benefits
Benefits
These might include:
• Mandatory requirement
• Improved quality of service
• Increased productivity
• More motivated workforce
• Internal management benefits
• Risk reduction
• Economies
• Revenue enhancement/acceleration
• Strategic fit
Quantifying benefits
Benefits can be:
• Quantified and valued e.g. a reduction of x staff saving £y
• Quantified but not valued e.g. a decrease in customer complaints by x%
• Identified but not easily quantified – e.g. public approval for a organization in the locality where it is based.
Lecture #8
Cost benefit analysis (CBA)
You need to:
• Identify all the costs which could be:
– Development costs
– Set-up
– Operational costs
• Identify the value of benefits
• Check benefits are greater than costs
Net profit
‘Year 0’ represents all the costs before system is operation
‘Cash-flow’ is value of income less outgoing
Net profit value of all the cash-flows for the lifetime of the application
Pay back period
This is the time it takes to start generating a surplus of income over outgoings. What would it be below?
Year Cash-flow Accumulated
0 -100,000 -100,000
Year Cash-flow
0 -100,000
1 10,000
2 10,000
3 10,000
4 20,000
5 100,000
Net profit 50,000
1 10,000 -90,000
2 10,000 -80,000
3 10,000 -70,000
4 20,000 -50,000
5 100,000 50,000
Return on investment (ROI)
Average annual profit
ROI= -------------------------------- X 100
Total investment
In the previous example
• average annual profit = 50,000/5 = 10,000
• ROI = 10,000/100,000 X 100 = 10%
Net present value:
Would you rather I gave you £100 today or in 12 months time?
If I gave you £100 now you could put it in savings account and get interest on it.
If the interest rate was 10% how much would I have to invest now to get £100 in a year’s time?
This figure is the net present value of £100 in one year’s time
Discount factor
Discount factor = 1/(1+r)t
r is the interest rate (e.g. 10% is 0.10)
t is the number of years

In the case of 10% rate and one year
Discount factor = 1/(1+0.10) = 0.9091
In the case of 10% rate and two years
Discount factor = 1/(1.10 x 1.10) =0.8294
Applying discount factors
Year Cash-flow
Discount factor
Discounted cash flow
0 -100,000 1.0000 -100,000
1 10,000 0.9091 9,091
2 10,000 0.8264 8,264
3 10,000 0.7513 7,513
4 20,000 0.6830 13,660
5 100,000 0.6209 62,090
NPV 618
Internal rate of return
• Internal rate of return (IRR) is the discount rate that would produce an NPV of 0 for the project
• Can be used to compare different investment opportunities
• There is a Microsoft Excel function which can be used to calculate
Lecture #9
Dealing with uncertainty: Risk evaluation
• project A might appear to give a better return than B but could be riskier
• Could draw up draw a project risk matrix for each project to assess risks – see next overhead
• For riskier projects could use higher discount rates
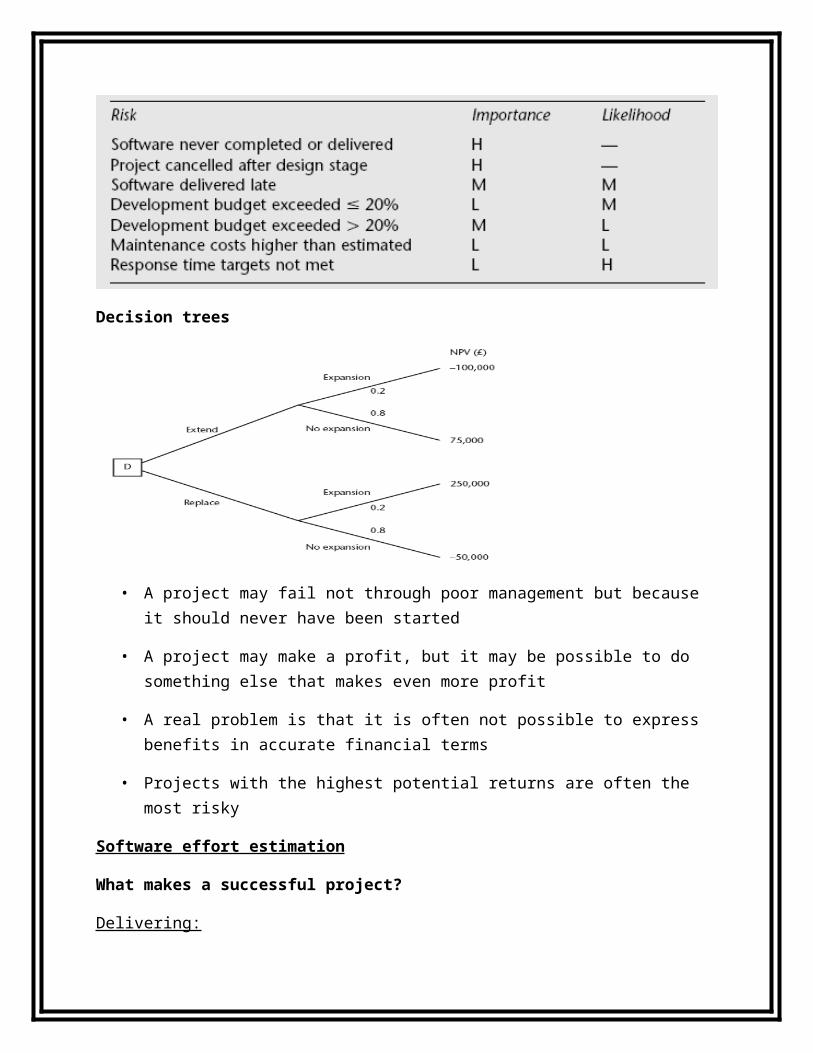
Example of a project risk matrix
Decision trees
• A project may fail not through poor management but because it should never have been started
• A project may make a profit, but it may be possible to do something else that makes even more profit
• A real problem is that it is often not possible to express benefits in accurate financial terms
• Projects with the highest potential returns are often the most risky
Software effort estimation
What makes a successful project?

Delivering:
->agreed functionality
->on time
->at the agreed cost
->with the required quality
Stages:
1. set targets
2. Attempt to achieve targets
Lecture #10
Software cost components
Hardware and software costs
Travel and Training costs
Effort costs (the dominant factor in most projects)
– Salaries of engineers involved in the project
– Social and insurance costs
Effort costs must take overheads into account
– costs of building, heating, lighting
– costs of networking and communications
– costs of shared facilities (e.g library, staff restaurant, etc.)
Project Costing
Costing and pricing
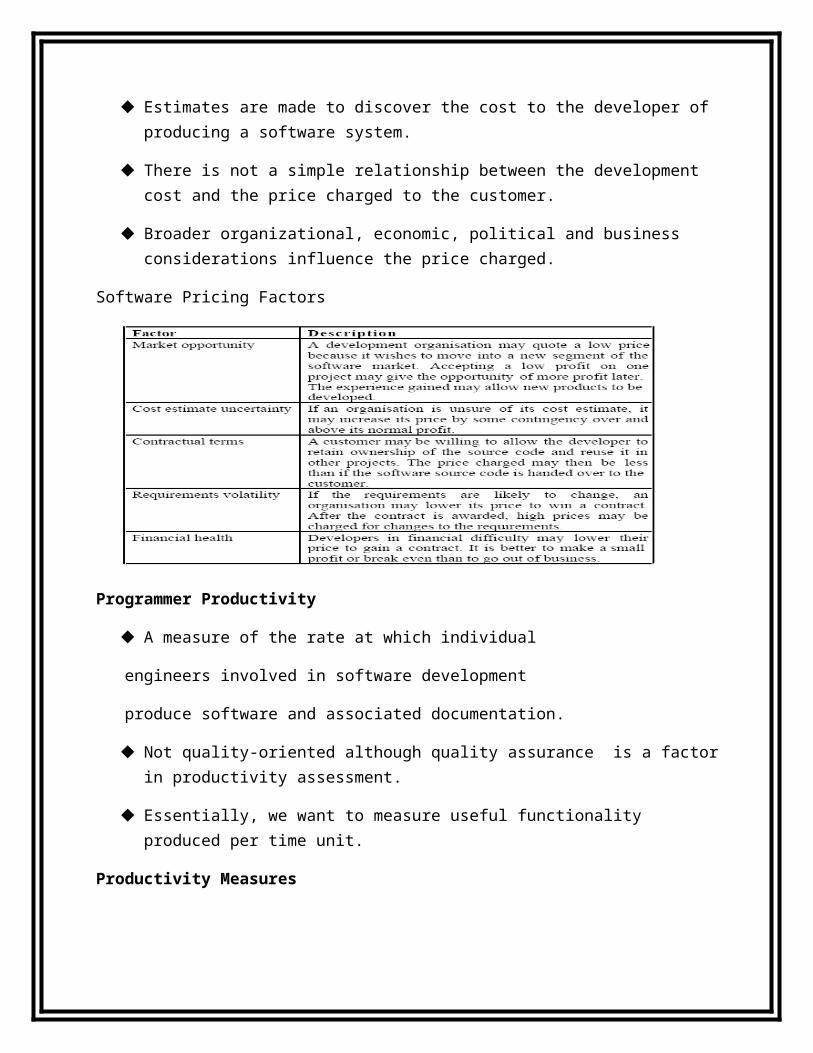
Estimates are made to discover the cost to the developer of producing a software system.
There is not a simple relationship between the development cost and the price charged to the customer.

Broader organizational, economic, political and business considerations influence the price charged.
Software Pricing Factors
Programmer Productivity
A measure of the rate at which individual
engineers involved in software development
produce software and associated documentation.
Not quality-oriented although quality assurance is a factor in productivity assessment.
Essentially, we want to measure useful functionality produced per time unit.
Productivity Measures
Size related measures based on some output from the software process. This may be lines of delivered source code, object code instructions, etc.
Function-related measures based on an estimate of the functionality of the delivered software.
Function-points are the best known of this type of measure
Lines Of Code
What's a line of code?
– The measure was first proposed when programs were typed on cards with one line per card

– How does this correspond to statements as in Java which can Span several lines or where there can be several statements on one line.
– What programs should be counted as part of the system?
Assumes linear relationship between system
size and volume of documentation
COCOMO Model
COnstructive COst MOdel.
COCOMO II is actually a hierarchy of estimation models that address the following areas.
Application composition model. Used during the early stages of software engineering, when prototyping of user interfaces, consideration of software and system interaction, assessment of performance, and evaluation of technology maturity are paramount.
Early design stage model. Used once requirements have been stabilized and basic software architecture has been established.
Post-architecture-stage model. Used during the construction of the software. Used to predict cost of a project from a measure of size (lines of code). The object point is an indirect software measure that is computed using counts of the
number of (1) Screens (at the user interface), (2) Reports, and (3) Components likely to be required to build the application.
Once complexity is determined, the number of screens, reports, and components are weighted.
Object point count is then determined by multiplying the original number of object instances by the weighting factor.
NOP = (object points) x [(100 %reuse)/100]
where NOP is defined as new object points.
Productivity Rate is given by

PROD = NOP/person-month
Productivity Rate for Object Points is given as follows:
an estimate of project effort can be derived as
Estimated effort = NOP/PROD
COCOMO2
Staffing pattern
Lecture #11
Activity planning
Scheduling
‘Time is nature’s way of stopping everything happening at once’
Having
– worked out a method of doing the project
– identified the tasks to be carried
– assessed the time needed to do each task
need to allocate dates/times for the start and end of each activity
Scheduling of a software project does not differ greatly from scheduling of any multitask engineering effort.
Therefore, generalized project scheduling tools and techniques can be applied with little modification to software projects.

Project scheduling
- Split project into tasks and estimate time and resources required to complete each task.- Organize tasks concurrently to make optimal use of workforce.- Minimize task dependencies to avoid delays caused by one task waiting for another to
complete.- Dependent on project managers intuition and experience.
The project scheduling process
Estimate resourcesfor activities
Identify activitydependencies
Identifyactivities
Allocate peopleto activities
Softwarerequirements
Activity chartsand bar charts
Create projectcharts
Objectives of project scheduling
• Produce an optimal project schedule in terms of cost, time, or risk.
• Usually, it is difficult to optimize the three variables at the same time. Thus,
• setting an acceptable limit for two of the three varaibles and optimizing the project in terms of the third variable.
Activity networks
start
T2
M3T6
Finish
T10
M7T5
T7
M2T4
M5
T8
4/7/03
8 days
14/7/03 15 days
4/8/03
15 days
25/8/03
7 days
5/9/03
10 days
19/9/03
15 days
11/8/03
25 days
10 days
20 days
5 days25/7/03
15 days
25/7/03
18/7/03
10 days
T1
M1 T3T9
M6
T11
M8
T12
M4
These help us to:
• Assess the feasibility of the planned project completion date
• Identify when resources will need to be deployed to activities
• Calculate when costs will be incurred
This helps the co-ordination and motivation of the project team
A task network, also called an activity network, is a graphic representation of the task flow for a project.
It is sometimes used as the mechanism through which task sequence and dependencies are input to an automated project scheduling tool.
The task network depicts major software engineering tasks.
The concurrent nature of software engineering activities leads to a number of important scheduling requirements. Because parallel tasks occur asynchronously, the planner must determine intertask dependencies to ensure continuous progress toward completion.
Network diagram splits up the decision making process into
- Method/logic - the order in which tasks have to be completed- Time – estimates for the time to completion can be added to each task- Resources – these can be added and then analysis carried out
Two Parts to the Analysis
Forward Pass:- Calculates the Duration of the Project
Backward Pass:- Calculates the slack/float for each task and shows the critical path
Identifying activities
• Work-based: draw-up a Work Breakdown Structure listing the work items needed
• Product-based approach

– list the deliverable and intermediate products of project – product breakdown structure (PBS)
– Identify the order in which products have to be created
– work out the activities needed to create the products
Hybrid approach
A Work Breakdown Structure based on deliverables
The final outcome of the planning process
A project plan as a bar chart
PERT vs CPM
Program evaluation and review technique (PERT) and critical path method (CPM) are two project scheduling methods that can be applied to software development.
Both techniques are driven by information already developed in earlier project planning activities:
• Estimates of effort
• A decomposition of the product function
• The selection of the appropriate process model and task set
• Decomposition of tasks
PERT
CPM
Both PERT and CPM provide quantitative tools that allow the software planner to
– (1) determine the critical path—the chain of tasks that determines the duration of the project;
– (2) establish “most likely” time estimates for individual tasks by applying statistical models; and
– (3) calculate “boundary times” that define a time "window" for a particular task.
Two models of PERT/CPM
• Activity-on-Arrow (AOA): Arrows are used to represent activities or tasks. Nodes represent starting and ending points of activities.
Do B
Do A Do DDo C

• Activity-on-Node (AON): Nodes are used to represent activities or tasks, while arrows represent precedence relationships.
PERT(Project Evaluation And Review Technique:
• PERT is an extension of CPM.
• In reality, activities are usually subjected to uncertainty which determine the actual durations of the activities.
• It incorporates variabilities in activity duration into project entwork analysis.
• The poetntial uncertainties in activity are accounted for by using three time estimates for each activity
Drawing up a PERT diagram
No looping back is allowed – deal with iterations by hiding them within single activities
• milestones – ‘activities’, such as the start and end of the project, which indicate transition points. They have zero duration.
Variation of Task Completion Time

--------------------------------------------
PERT Estimates & Formulas
• Expected activity time (t), Te = (a+4m+b)/6
• Variance = [ (b – a) / 6 ]2
• Standard deviation = SQRT(variance)
= (b – a)
6
Where, a = optimistic time estimate
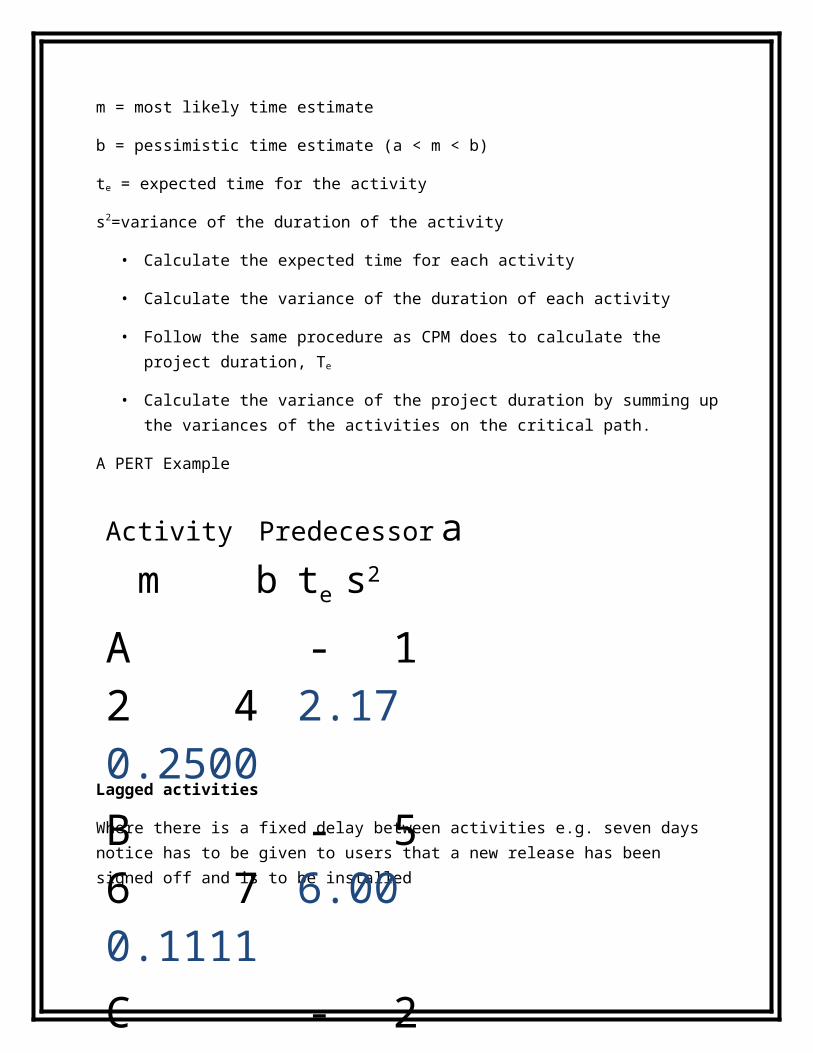
m = most likely time estimate
b = pessimistic time estimate (a < m < b)
te = expected time for the activity
s2=variance of the duration of the activity
Task B3454
Average 4 4
Task A2464

• Calculate the expected time for each activity
• Calculate the variance of the duration of each activity
• Follow the same procedure as CPM does to calculate the project duration, Te
• Calculate the variance of the project duration by summing up the variances of the activities on the critical path.
A PERT Example
Lagged activities
Where there is a fixed delay between activities e.g. seven days notice has to be given to users that a new release has been signed off and is to be installed
7days
Types of links between activities
Finish to start
Start to start/ Finish to finish
Activity Predecessor a m bte s2
A - 1 2 42.17 0.2500B - 5 6 76.00 0.1111C - 2 4 53.83 0.2500D A 1 3 42.83 0.2500E C 4 5 7 5.17 0.2500F A 3 4 5 4.00 0.1111G B, D, E 1 2 3 2.00 0.1111
Acceptancetesting
Install new release
Softwaredevelopment Acceptance testing

1day 2days
Types of links between activities
• Start to finish
purpose of CPM
• Critical path
• Earliest starting time ES
• Earliest completion time EC/EF
• Latest starting time LS
• Latest completion time LC/LF
• Activity Capital letter
• Duration t
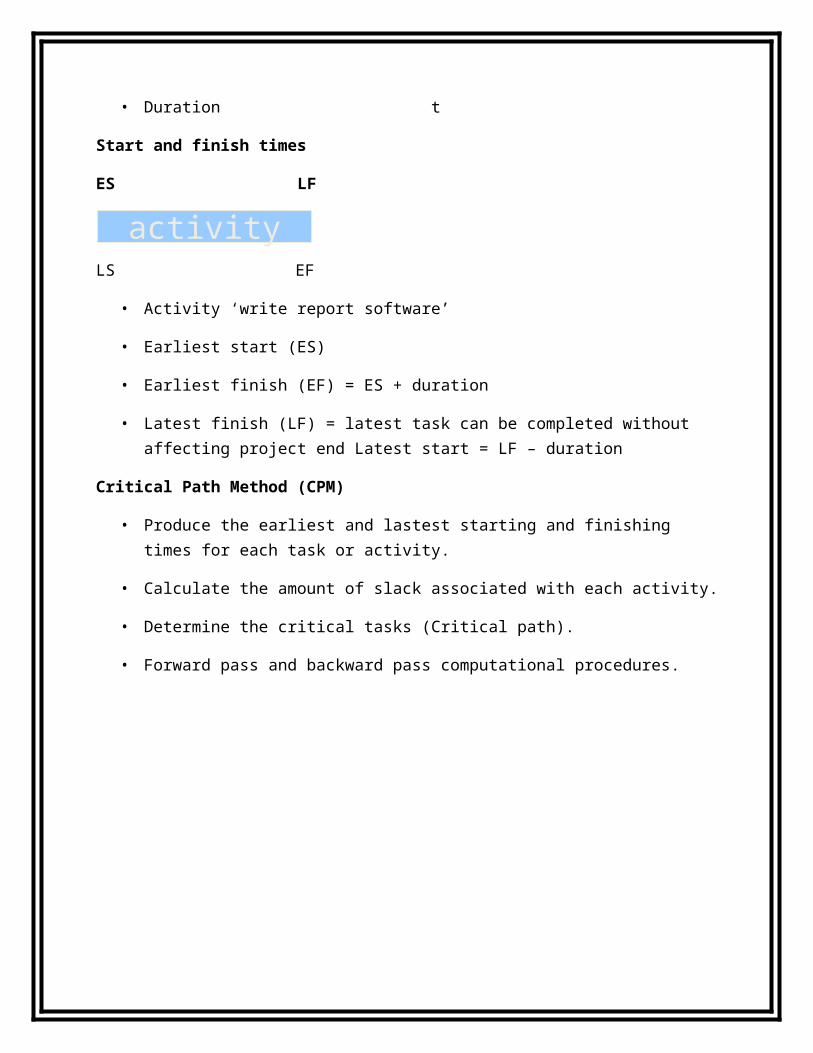
Start and finish times
ES LF
LS EF
• Activity ‘write report software’
• Earliest start (ES)
• Earliest finish (EF) = ES + duration
Test prototype
DocumentAmendments
Operate temporary system
Cutover to new system
activity
Acceptance test
of new system

• Latest finish (LF) = latest task can be completed without affecting project end Latest start = LF – duration
Critical Path Method (CPM)
• Produce the earliest and lastest starting and finishing times for each task or activity.
• Calculate the amount of slack associated with each activity.
• Determine the critical tasks (Critical path).
• Forward pass and backward pass computational procedures.
What is Dangle?
What about the float?
Float = LF – EF
Or Float = LS – ES
Float represents the amount of time that the task can be delayed without affecting the outcome of the project
A task with zero float cannot be delayed and is therefore critical to the timely completion of the project
A time optimised project will have a sequence of tasks from start to finish that have zero float
This sequence of tasks is called the critical path
Calculate slack time for each activity
• Slack time: the difference in time between the two dates at the beginning of a job or the two dates at the end of the job. Slack time represents the flexiblity of the job.
• Slack is the length of time an activity can be delayed without delaying the project
• Thus, slack time = LS - ES or LF - EF
Example
• earliest start = day 5
• latest finish = day 30
duration = 10 days
Float = LF - ES - duration
Earliest start date
• Earliest start date for the current activity = earliest finish date for the previous
• When there is more than one previous activity, take the latest earliest finish
• Note ‘day 7’ = end of work on day 7
EF = day 7

Example
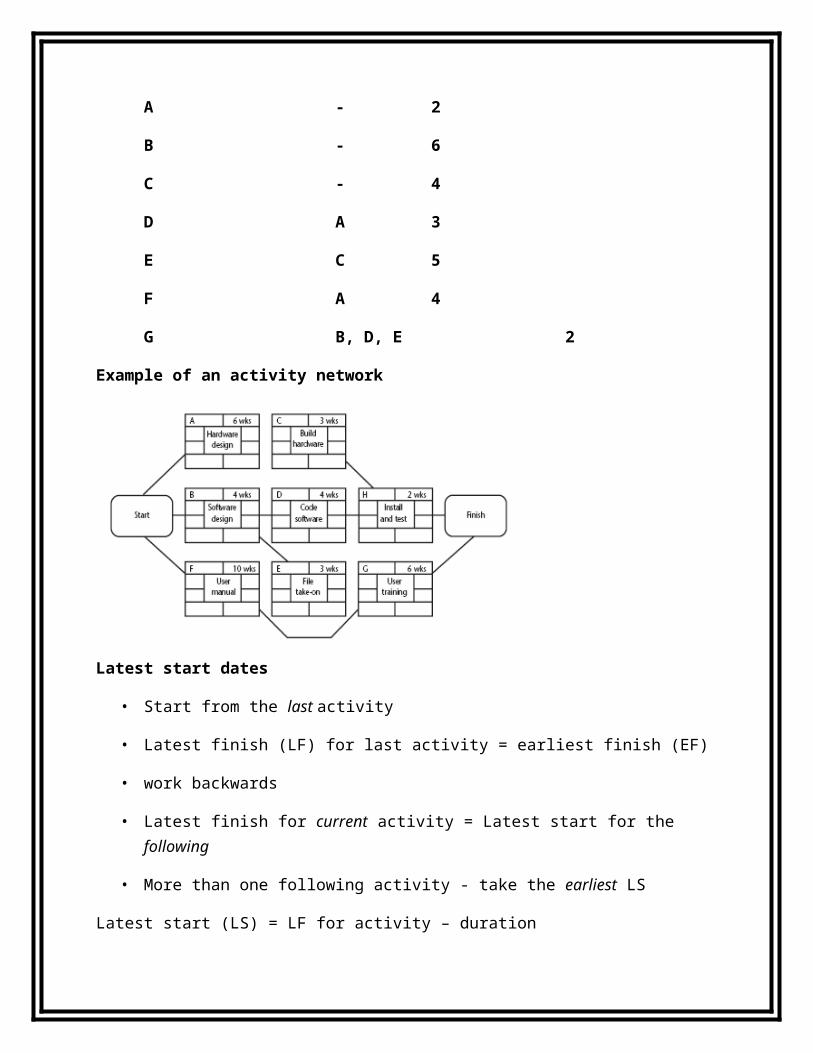
Activity Predecessor Duration
A - 2
B - 6
C - 4
D A 3
E C 5
F A 4
G B, D, E 2
Example of an activity network
Latest start dates
• Start from the last activity
• Latest finish (LF) for last activity = earliest finish (EF)
• work backwards
• Latest finish for current activity = Latest start for the following
ES = day10EF = day10

• More than one following activity - take the earliest LS
Latest start (LS) = LF for activity – duration
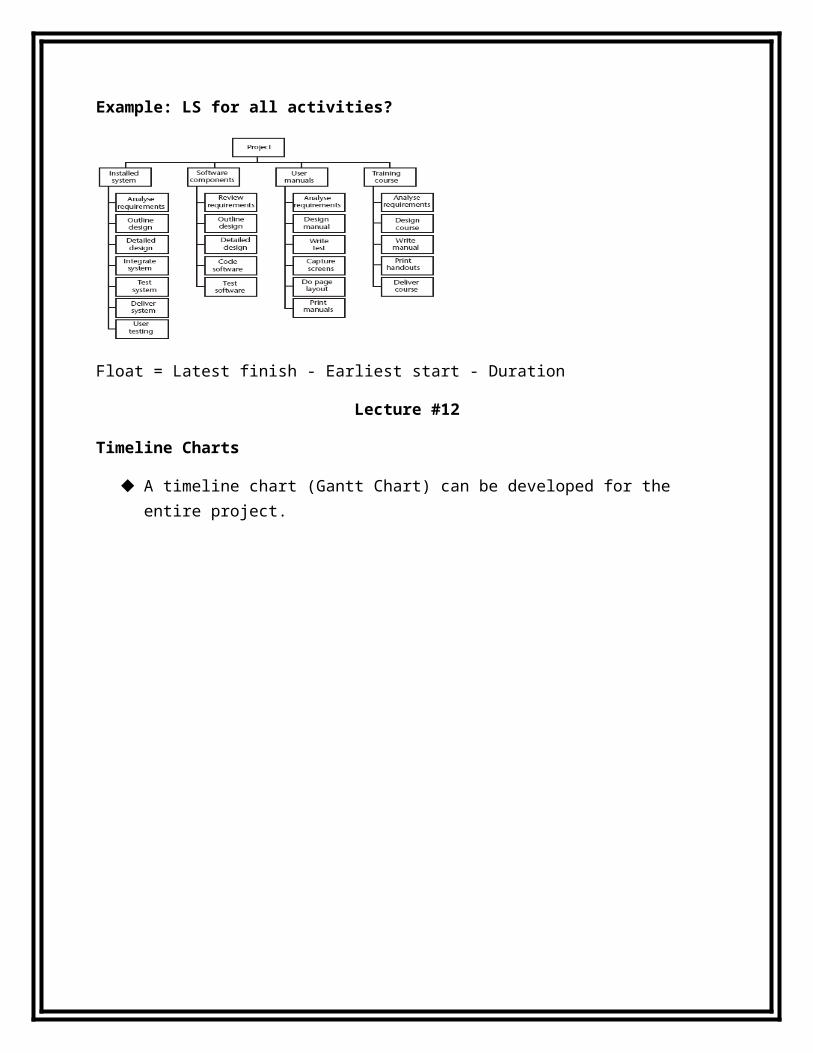
Example: LS for all activities?
Float = Latest finish - Earliest start - Duration
Lecture #12
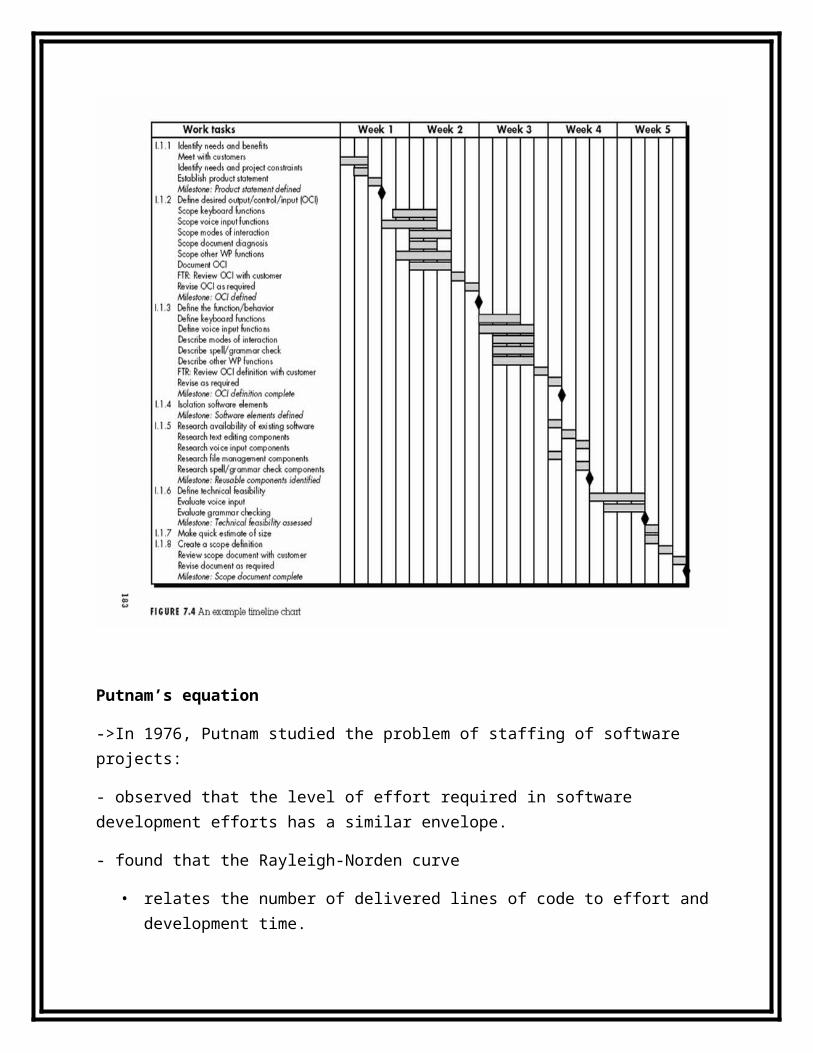
Timeline Charts
A timeline chart (Gantt Chart) can be developed for the entire project.

Putnam’s equation
->In 1976, Putnam studied the problem of staffing of software projects:
- observed that the level of effort required in software development efforts has a similar envelope.
- found that the Rayleigh-Norden curve
• relates the number of delivered lines of code to effort and development time.
->Putnam analyzed a large number of army projects, and derived the expression: L=CkK1/3td4/3
o K is the effort expended and L is the size in KLOC.

o td is the time to develop the software.
o Ck is the state of technology constant
reflects factors that affect programmer productivity.
• Ck=2 for poor development environment
o no methodology, poor documentation, and review, etc.
• Ck=8 for good software development environment
o software engineering principles used
• Ck=11 for an excellent environment
Rayleigh Curve
->Very small number of engineers are needed at the beginning of a project
- carry out planning and specification.
• As the project progresses:- more detailed work is required, - number of engineers slowly increases and reaches a peak.
->Putnam observed that:
- the time at which the Rayleigh curve reaches its maximum value
- corresponds to system testing and product release.
- After system testing,
- the number of project staff falls till product installation and delivery.
- From the Rayleigh curve observe that:
- approximately 40% of the area under the Rayleigh curve is to the left of td
and 60% to the right.
Effect of Schedule Change on Cost
->Using the Putnam's expression for L,K=L3/Ck3td4
Or, K=C1/td4
-> For the same product size, C1=L3/Ck3 is a constant.
-> Or, K1/K2 = td24/td14
-> Putnam model indicates extreme penalty for schedule compression
- and extreme reward for expanding the schedule.
-> Putnam estimation model works reasonably well for very large systems,
- but seriously overestimates the effort for medium and small systems.
Caper Jones estimating rules of thumb
Capers Jones describes 12 rulesRule 1 - Sizing source code volumes:One function point = 320 statements for basic assembly languageOne function point = 213 statements for macro assembly languageOne function point = 128 statements for the C programming languageOne function point = 107 statements for the COBOL languageOne function point = 107 statements for the FORTRAN languageOne function point = 80 statements for the PL/I languageOne function point = 71 statements for the ADA 83 languageOne function point = 53 statements for the C++ languageOne function point = 15 statements for the Smalltalk language
Rule 2 - Sizing Software Plans, Specifications, and Manuals:Function points raised to the 1.15 power predict approximate page counts for paper documents associated with software projects.
Rule 3 - Sizing Creeping User Requirements:Creeping user requirements will grow at an average rate of 2 percent per month from the design through coding phases.
Rule 4 - Sizing Test-Case Volumes:Function points raised to the 1.2 power predict the approximate number of test cases created.
Rule 5 - Sizing Software Defect Potentials:Function points raised to the 1.25 power predict the approximate defect potential for new software projects.
Rule 6 - Sizing Testing Defect-Removal Efficiency:Each software test step will find and remove 30 percent of the bugs that are present.
Rule 7 - Sizing Formal Inspection Defect Removal Efficiency:

Each formal design inspection will find and remove 65 percent of the bugs present. Each formal code inspection will find and remove 60 percent of the bugs present.Rule 8 - Postrelease Defect-Repair Rates:Maintenance programmers can repair 8 bugs per staff month.
Rule 9 - Estimating Software Schedules:Function points raised to the 0.4 power predict the approximate development schedule in calendar months.Example:MS Word = about 5000 FPRule 9: 5000 FP 0.4 = about 30 calendar months
Rule 10 - Estimating Software Development Staffing Levels:Function points divided by 150 predict the approximate number of personnel required for the application.
Rule 11 - Estimating Software Maintenance Staffing Levels:Function points divided by 750 predict the approximate number of maintenance personnel required to keep the application updated.Example:MS Word = about 5000 FPRule 9: 5000 FP 0.4 = about 30 calendar monthsRule 10: 5000 FP / 150 = 33,3 full-time personnel
Rule 12 - Estimating Software Effort:Multiply software development schedules by number of personnel to predict theapproximate number of staff months of effort.Example:MS Word = about 5000 FPRule 9: 5000 FP 0.4 = about 30 calendar monthsRule 10: 5000 FP / 150 = 33,3 full-time personnelRule 12: 30 months * 33,3 personnel = about 999 staff months
Project sequencing & scheduling activities
A project plan includes:
• A breakdown of the necessary work
• The time dependencies among the project tasks
• The assignment of personnel and other resources to each of the tasks
• A project schedule is a set of project artifacts or deliverables listed in the sequence in which they are to be produced.
• The units of work in a project schedule are tasks or activities.
• Milestones are marked by the completion of specified deliverables.
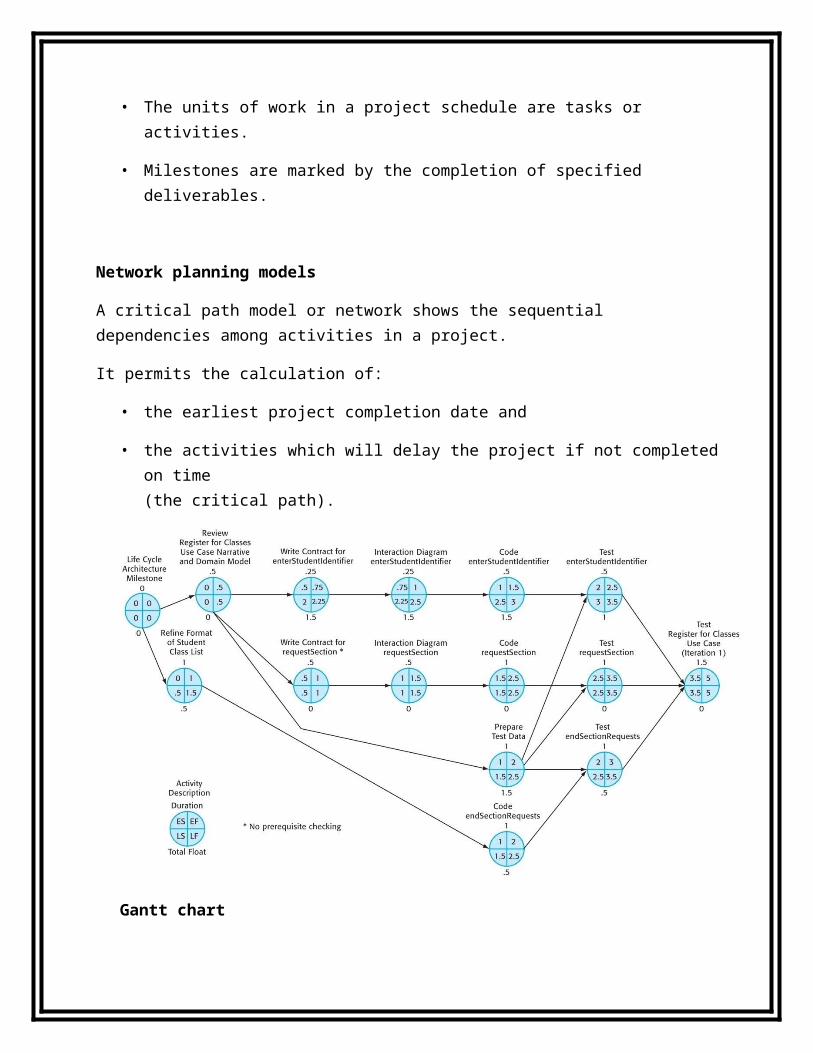
Network planning models
A critical path model or network shows the sequential dependencies among activities in a project.
It permits the calculation of:
• the earliest project completion date and
• the activities which will delay the project if not completed on time (the critical path).
Gantt chart
• Gantt chart is a matrix of rows and columns. The time scale is indicated along the horizontal axis. Activities are arranged along the vertical axis.
• Gantt charts are usually used to represent the project schedule. Gantt charts should be updated periodically.
• presents a project schedule as horizontal bars on a vertical time grid.

• It does not show dependencies among the project activities.
• It can help communicate the overall features of a project schedule.
• The main purpose of a Gantt chart is to display the schedule of activities
• They are easy to understand
• They are flexible in that you can also show other information on the chart, such as resources required, who is responsible, critical activities, percent complete, etc.
• All project management software packages will create Gantt charts
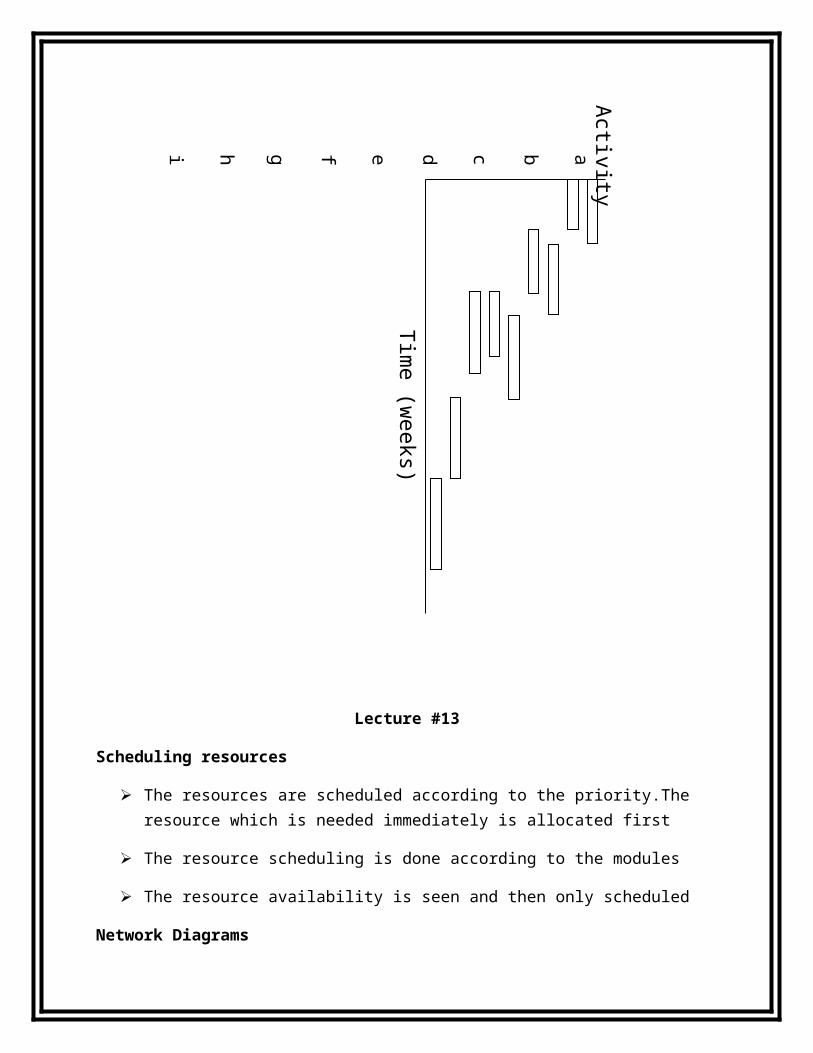
Lecture #13
Activity
abcdefghi
Time (w
e eks)

Scheduling resources
The resources are scheduled according to the priority.The resource which is needed immediately is allocated first
The resource scheduling is done according to the modules
The resource availability is seen and then only scheduled
Network Diagrams
• Network diagrams show the precedence relationships among activities
• It’s easier to understand these relationships graphically
• Network diagrams help to understand the flow of work in a project
• Network diagrams are a useful tool for project planning and control, as well as for scheduling
• One (perhaps exaggerated) claim is that the network represents ¾ of the planning process
2 Versions of Network Diagrams
Activity-on-Arrow (AOA) networks
– also called Arrow Diagramming Method (ADM)
– simpler for projects with many dependencies
– emphasizes events; milestones can be easily flagged
– sometimes requires dummy activities
Activity-on-Node (AON) networks
– also called Precedence Diagramming Method (PDM)
– easier to draw for simple projects
– emphasizes activities
– no dummy activities
Critical path
• Note the path through network with zero floats
• Critical path: any delay in an activity on this path will delay whole project
Free and interfering float
Critical Path Method (CPM)
• Produce the earliest and lastest starting and finishing times for each task or activity.
• Calculate the amount of slack associated with each activity.
• Determine the critical tasks (Critical path).
• Forward pass and backward pass computational procedures.
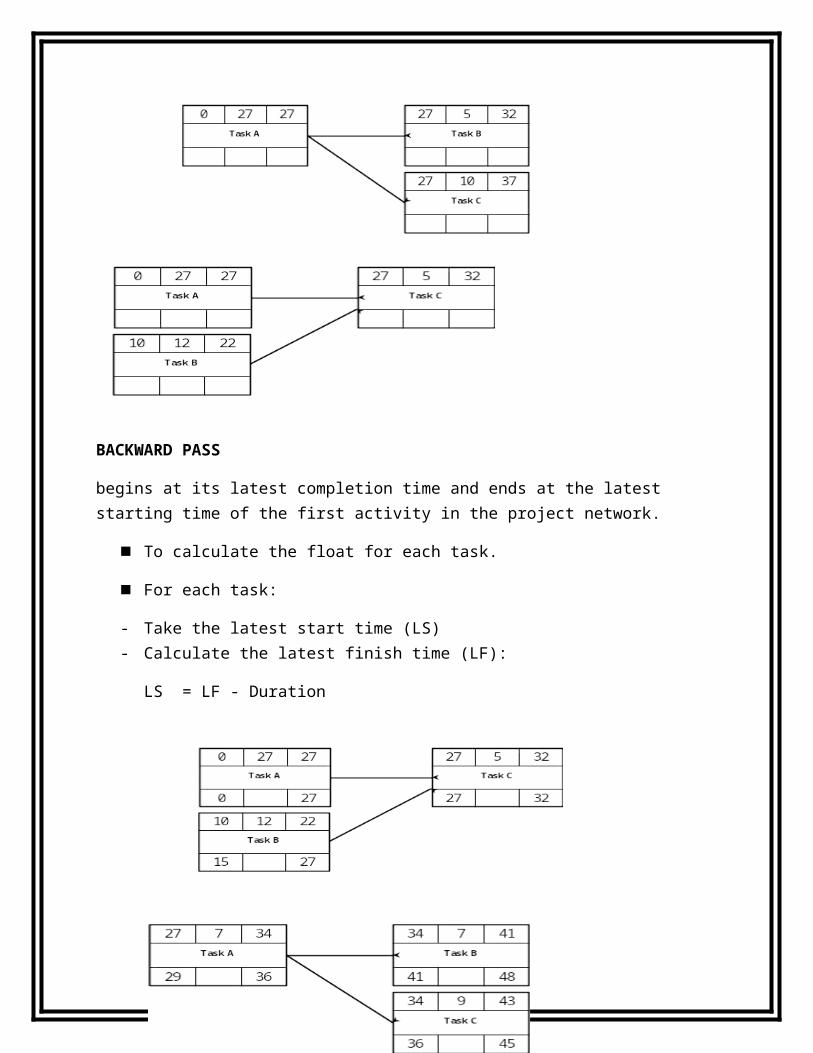
Forward Pass
each activity begins at its earliest time. An activity can begin as soon as the last of its predecessors is finished.
For each task:
Take the earliest start time (ES)
Calculate the Earliest finish time (EF):
EF = ES + Duration
Earliest Start
Estimated Duration
Earliest Finish
Activity NumberActivity Description
Latest Start
Float Latest Finish
BACKWARD PASS
begins at its latest completion time and ends at the latest starting time of the first activity in the project network.
To calculate the float for each task.
For each task:
- Take the latest start time (LS)- Calculate the latest finish time (LF):
LS = LF - Duration
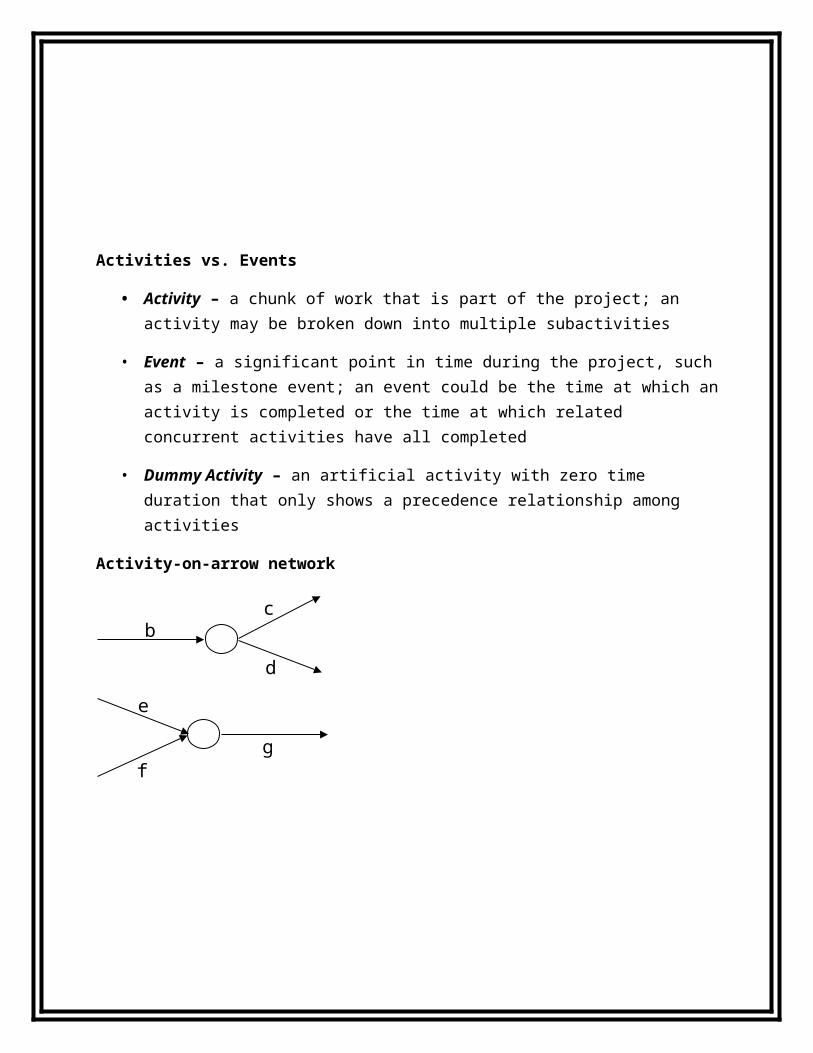
Activities vs. Events
• Activity – a chunk of work that is part of the project; an activity may be broken down into multiple subactivities
• Event – a significant point in time during the project, such as a milestone event; an event could be the time at which an activity is completed or the time at which related concurrent activities have all completed
• Dummy Activity – an artificial activity with zero time duration that only shows a precedence relationship among activities
Activity-on-arrow network
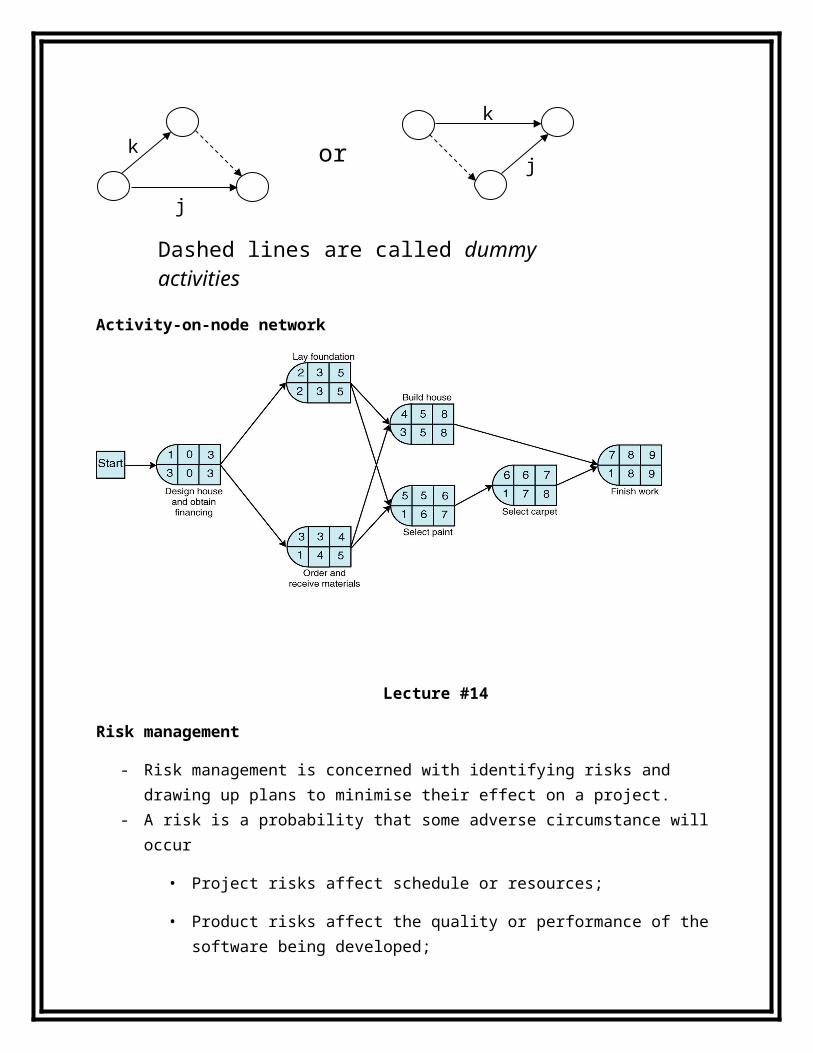
Activity-on-node network
bc
d
e
fg
k
jj
kor
Dashed lines are called dummy activities
Lecture #14
Risk management
- Risk management is concerned with identifying risks and drawing up plans to minimise their effect on a project.
- A risk is a probability that some adverse circumstance will occur
• Project risks affect schedule or resources;
• Product risks affect the quality or performance of the software being developed;
• Business risks affect the organisation developing or procuring the software.
Software risks
Staff turnover, Management change, hardware unavailability, Requirements change, specification delays, size underestimate, Technology change, Product competition
Risk management process
– Risk identification – what are the risks to a project? Identify project, product and business risks;
– Risk analysis – which ones are really serious? Assess the likelihood and consequences of these risks;
– Risk planning – what shall we do? Draw up plans to avoid or minimise the effects of the risk;
– Risk monitoring – has the planning worked? Monitor the risks throughout the project;
Risk avoidanceand contingency
plans
Risk planning
Prioritised risklist
Risk analysis
List of potentialrisks
Riskidentification
Riskassessment
Riskmonitoring
Some definitions of risk
the chance of exposure to the adverse consequences of future events’ PRINCE2
• Project plans have to be based on assumptions
• Risk is the possibility that an assumption is wrong
• When the risk happens it becomes a problem or an issue
Categories of risk
A framework for dealing with risk
The planning for risk includes these steps:
• Risk identification – what risks might there be?
• Risk analysis and prioritization – which are the most serious risks?
• Risk planning – what are we going to do about them?
Risk monitoring – what is the current state of the risk?
Risk identification
Approaches to identifying risks include:
• Use of checklists – usually based on the experience of past projects
• Brainstorming – getting knowledgeable stakeholders together to pool concerns
• Causal mapping – identifying possible chains of cause and effect
- Technology risks.- People risks.- Organisational risks.- Requirements risks.- Estimation risks.
Boehm’s top 10 development risks

Risk Risk reduction techniques
Personnel shortfalls
Staffing with top talent; job matching; teambuilding; training and career development; early scheduling of key personnel
Unrealistictime andcostestimates
Multiple estimation techniques; design to cost; incremental development; recording and
analysis of past projects; standardization of methods
Developing the wrong software functions
Improved software evaluation; formal specification methods; user surveys; prototyping; early user manuals
Developing the wrong user interface
Prototyping; task analysis; user involvement
Gold plating Requirements scrubbing, prototyping,design to cost
Late changes to requirements
Change control, incremental development
Shortfalls in externally supplied components
Benchmarking, inspections, formal specifications, contractual agreements, quality controls
Shortfalls in externally performed tasks
Quality assurance procedures, competitive design etc
Real time performance problems
Simulation, prototyping, tuning
Development technically too difficult
Technical analysis, cost-benefit analysis, prototyping , training
Causal mapping

Causal mapping - interventions
Risk analysis
- Assess probability and seriousness of each risk.- Probability may be very low, low, moderate, high or very high.- Risk effects might be catastrophic, serious, tolerable or insignificant.
Risk prioritization
Risk exposure (RE)
= (potential damage) x (probability of occurrence)
Ideally
Potential damage: a money value e.g. a flood would cause £0.5 millions of damage
Probability 0.00 (absolutely no chance) to 1.00 (absolutely certain) e.g. 0.01 (one in hundred chance)
RE = £0.5m x 0.01 = £5,000
Crudely analogous to the amount needed for an insurance premium
Risk probability: qualitative descriptors
Probability level Range
High Greater than 50% chance of happening
Significant 30-50% chance of happening
Moderate 10-29% chance of happening
Low Less than 10% chance of happening
Qualitative descriptors of impact on cost and associated range values
Impact level Range
High Greater than 30% above budgeted expenditure
Significant 20 to 29% above budgeted expenditure
Moderate 10 to 19% above budgeted expenditure
Low Within 10% of budgeted expenditure.
Probability impact matrix
Risk planning
- Consider each risk and develop a strategy to manage that risk.- Avoidance strategies- The probability that the risk will arise is reduced;- Minimisation strategies- The impact of the risk on the project or product will be reduced;- Contingency plans
• If the risk arises, contingency plans are plans to deal with that risk;
Risks can be dealt with by:
• Risk acceptance
• Risk avoidance
• Risk reduction
• Risk transfer
• Risk mitigation/contingency measures
Risk reduction leverage
Risk reduction leverage =
(REbefore- REafter)/ (cost of risk reduction)
REbeforeis risk exposure before risk reduction e.g. 1% chance of a fire causing £200k damage
REafter is risk exposure after risk reduction e.g. fire alarm costing £500 reduces probability of fire damage to 0.5%
RRL = (1% of £200k)-(0.5% of £200k)/£500 = 2
RRL > 1.00 therefore worth doing
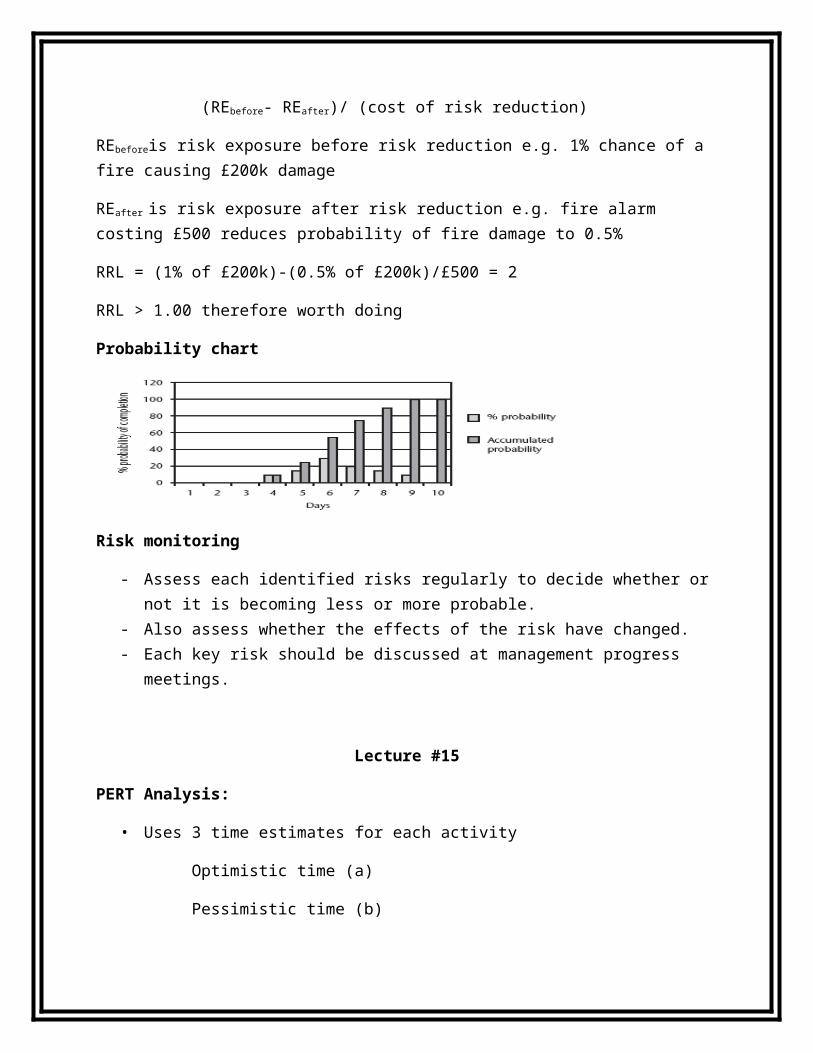
Probability chart
Risk monitoring
- Assess each identified risks regularly to decide whether or not it is becoming less or more probable.
- Also assess whether the effects of the risk have changed.- Each key risk should be discussed at management progress meetings.
Lecture #15
PERT Analysis:
• Uses 3 time estimates for each activity
Optimistic time (a)
Pessimistic time (b)
Most likely time (m)
• These estimates are used to calculate an expected value and variance for each activity (based on the Beta distribution)
Using PERT to evaluate the effects of uncertainty
Three estimates are produced for each activity
• Most likely time (m)
• Optimistic time (a)
• Pessimistic (b)
• ‘expected time’ te = (a + 4m +b) / 6
• ‘activity standard deviation’ S = (b-a)/6
Project Variance and Standard Deviation
• Project variance (σp2)
= ∑ (variances of all critical path activities)
σp2 = 0.11 + 0.11 + 1.0 + 1.78 + 0.11 = 3.11
• Project standard deviation (σp)
= SQRT (Project variance)
σp = SQRT ( 3.11) = 1.76
Probability of Project Completion
• What is the probability of finishing the project within 16 weeks?
• Assumptions:

– Project duration is normally distributed
– Activity times are independent
• Normal distribution parameters:
μp = expected completion time= 15 weeks
σp = proj standard deviation = 1.76 weeks
Normal Probability Calculations
Z = (Target time – expected time)
σp
Z = (16 - 15) = 0.57
1.76
This means 16 weeks is 0.57 standard deviations above the mean of 15 weeks
Probability Based on Standard Normal Table
Prob (proj completion < 16 weeks) = 0.7158
PERT Project Management Example Problem
Problem Statement and Data
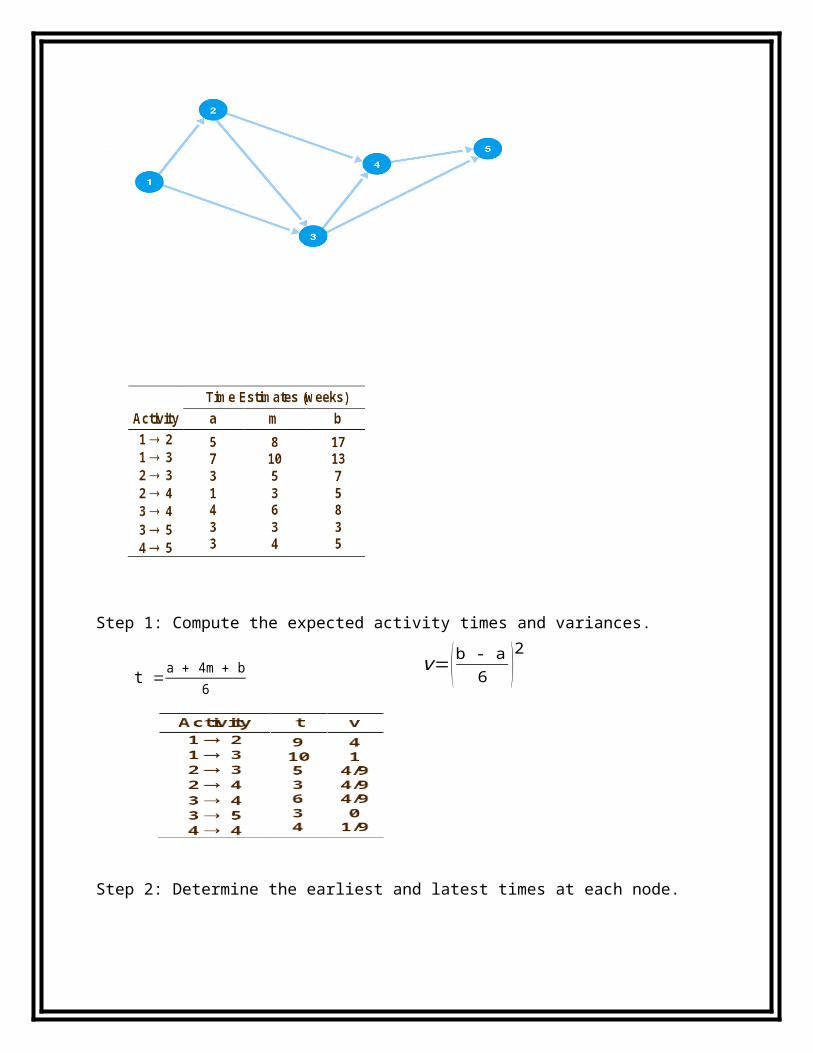
Given the following data determine the expected project completion time and variance, and the probability that the project will be completed in 28 days or less.

Step 1: Compute the expected activity times and variances.
Step 2: Determine the earliest and latest times at each node.
v=( b - a6 )2t = a + 4m + b
6
Step 3: Identify the critical path and compute expected completion time and variance.
Critical path (activities with no slack): 1 ® 2 ® 3 ® 4 ® 5
Expected project completion time (tp): 24 days
Variance: v = 4 + 4/9 + 4/9 + 1/9 = 5 days
Step 4: Determine the Probability That the Project will be Completed in 28 days or less.
Z = (x - m)/s = (28 -24)/Ö5 = 1.79
Corresponding probability from Table A.1, Appendix A, is .4633 and P(x £ 28) = .9633
A chain of activities
Task
a m b t
e
s
A 10
12
16
? ?
B 8 1 1 ? ?
Task A Task B Task C
0 4
C 20
24
38
? ?
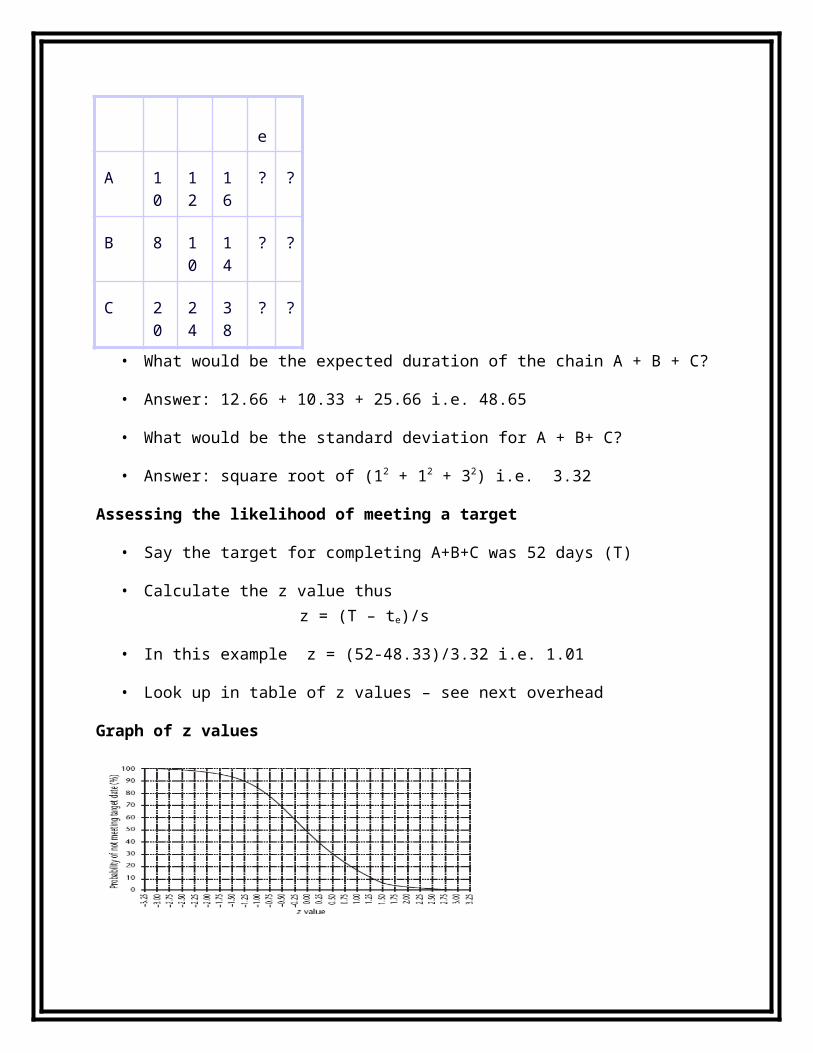
• What would be the expected duration of the chain A + B + C?
• Answer: 12.66 + 10.33 + 25.66 i.e. 48.65
• What would be the standard deviation for A + B+ C?
• Answer: square root of (12 + 12 + 32) i.e. 3.32
Assessing the likelihood of meeting a target
• Say the target for completing A+B+C was 52 days (T)
• Calculate the z value thusz = (T – te)/s
• In this example z = (52-48.33)/3.32 i.e. 1.01
• Look up in table of z values – see next overhead
Graph of z values
Critical chain approach
One problem with estimates of task duration:
• Estimators add a safety zone to estimate to take account of possible difficulties
• Developers work to the estimate + safety zone, so time is lost
• No advantage is taken of opportunities where tasks can finish early – and provide a buffer for later activities
One answer to this:
• Base targets on midpoints (i.e. te)
• Accumulate 50% of the safety zones (between te and b) into a buffer at the end of the project
• Work backwards and start all activities at their latest start dates
• During project execution use relay race model
Lecture #16
Hazard identification
Risk Identification
Identify the hazards that might affect the duration or resource costs of the project
Hazard à Problem à Risk
A hazard is an event that might occur and will create a problem for the successful completion of the project, if it does occur
Hazard is an implied threat or danger, a potential condition waiting to become a loss
Hazard, Problem, and Risk
Hazard: Mary’s baby may be born early
Problem: Modules P and Q will have no coder
Risk: Milestone 7 will be delayed, or extra budget will be needed to hire another coder
Risk: ”Chances or possibility of accidental losses or undesired consequences."
The probability of a dangerous event posed by a hazard, over a definite time period of exposure or
The frequency at which such events will occur and results in fatalities to certain number of people and
The consequence of such events in terms of expected number of fatalities per year.
Risk = (Probability) x (Consequences)
Type of risks
Generic risk (common to all projects)

Standard checklist can be modified based on the risk analysis of previous projects
Specific risk (only applies to individual projects)
More difficult to find
Need to involve project team members
Need an environment that encourages risk assessment
Risk identification use checklist that lists the potential hazards and their corresponding factors
Maintain an updated checklist for future projects
Common Risk Factors
1. Application Factors:-
Nature of the application:-A data processing application or a life-critical system (e.g. X-ray emission system)
Expected size of the application:-The larger is the size, the higher is the chance of errors, communication problems and management problems.
2. Staff Factors:-
Experience and skills
Appropriateness of experience
Staff satisfaction
Staff turn-over rates
3. Project Factors:-
Project objectives:
Ill defined
Unclear to every team member and user
Project methods:
Ill specified methods
Unstructured methods

4. Changeover Factors:-
‘All-in-one’ changeover:-The new system is put into operation
Incremental or gradual changeover:-Adding new components to the system by phases
Parallel changeover:-Both the existing system and the new system are used in parallel
5. Supplier Factors:-
Late delivery of hardware
Instability of hardware
Late completion of building sites
6. Environment Factors:-
Changes in environment such as hardware platforms
Changes in government policies
Changes in business rules
Restructuring of organizations
7. Health and Safety Factors:-
Health and safety of staff and environment
Staff sickness, death, pregnancy etc.
Any tragic accident to staff
Hazard Analysis
Fault Tree Analysis (FTA)
Detailed review of a specific undesirable event
Deductive in nature
Top-down effort
Normally reserved for critical failures or mishaps
May be qualitative or quantitative

Risk Estimation
Risk estimation is to assess the likelihood and impact of each hazard
Risk exposure (risk value)
It is the importance of the risk
Risk exposure = risk likelihood × risk impact
Risk likelihood
The probability that a hazard is going to occur
Risk impact
The effect of the problem caused by the hazard
Advantages
The only way to compare or rank the risks
To have a good quantitative estimate, the extra effort can provide a better understanding of the problem
Disadvantages
Estimation is difficult, subjective, time-consuming and costly
Hazard prevention
Prevent a hazard from occurring or reduce its likelihood to an insignificant level
Lack of skilled staff can be prevented by employing staff with appropriate skills
Unclear requirements specification can be prevented by using formal specification techniques
Lecture #17
Risk Planning and control
Risk Evaluation
Ranking the risks

Determining the corresponding risk reduction strategies
Ranking Risks
Ranking the risks based on their risk exposures
Ranking shows the order of importance
In practice, also consider factors like
Confidence of the risk assessment
Compound risk
The number of risks
Cost of action
Risk Reduction Leverage (RRL)
RRL is used to determine whether it is worthwhile to carry out the risk reduction plan.
The higher is the RRL value, the more worthwhile is to carry out the risk reduction plan.
Risk Planning
Making contingency plans
Where appropriate, adding these plans into the project’s overall task structure
Risk Control
Minimizing and reacting to problems arising from risks throughout the project
Risk Monitoring
It is an ongoing activity throughout the whole project to monitor
the likelihood of a hazard; and
the impact of the problem caused.
RRL=REbefore−REafter
risk reduction cost

Risk Directing and Staffing
These concerns with the day-to-day management of risk.
Risk aversion strategies and problem solving strategies frequently involve the use of additional staff and this must be planned for and should be considered.
Risk Reduction Strategies
5 different types in a generic sense
Hazard prevention
Likelihood reduction
Risk avoidance
Risk transfer
Contingency planning
Distinctions among them are fuzzy
Risk avoidance
Some hazards cannot be avoided but their risks may
A project can be protected from the risk of overrunning the schedule by increasing duration estimates.
Risk transfer
The impact of the risk can be transferred away from the project by contracting out or taking out insurance
The risk of shortfalls in external supplied components can be transferred away by quality assurance procedures and certification, and contractual agreements
Contingency planning
Contingency plans are needed to reduce the impact of those risks that cannot be avoided
The impact of any unplanned absence of programming staff can be minimized by using agency programmers
Simulation

Simulation uses a representation or model of a system to analyze the expected behavior or performance of the system
To use a Monte Carlo simulation, you must have three estimates (most likely, pessimistic, and optimistic) plus an estimate of the likelihood of the estimate being between the most likely and optimistic values
What is Monte Carlo Simulation?Monte Carlo simulation, or probability simulation, is a technique used to understand the impact of risk and uncertainty in financial, project management, cost, and other forecasting models.
Monte Carlo analysis simulates a model’s outcome many times to provide a statistical distribution of the calculated results
- Predicts the probability of finishing by a certain date or that the cost will be equal to or less than a certain value
- Monte Carlo simulation randomly generates values for uncertain variables over and over to simulate a model.
- It's used with the variables that have a known range of values but an uncertain value for any particular time or event.
- For each uncertain variable, you define the possible values with a probability distribution.- A simulation calculates multiple scenarios of a model by repeatedly sampling values
from the probability distributions- Computer software tools can perform as many trials (or scenarios) as you want and allow
to select the optimal strategy
Steps of a Monte Carlo Analysis
1. Assess the range for the variables being considered – gather most likely, optimistic and pessimistic time estimates for each task
2. Determine the probability distribution of each variable
- Optimistic 8 weeks, most likely 10 and pessimistic 15
3. For each variable, select a random value based on the probability distribution
- 20% chance between 8 and 10 weeks, 80% between 10 and 15
4. Run a deterministic analysis or one pass through the model
5. Repeat steps 3 and 4 many times to obtain the probability distribution of the model’s results – usually between 100 to 1,000 iterations.
Sample Monte Carlo Simulation Results for Project Schedule
Lecture #18
Conclusion and Review question
Resource allocation
Schedules
• Activity schedule - indicating start and completion dates for each activity
• Resource schedule - indicating dates when resources needed + level of resources
• Cost schedule showing accumulative expenditure
Resources
• These include
• labour
• equipment (e.g. workstations)
• materials
• space
• services
• Time: elapsed time can often be reduced by adding more staff
• Money: used to buy the other resources
Resource allocation

• Identify the resources needed for each activity
• Identify resource types - individuals are interchangeable within the group (e.g. ‘VB programmers’ as opposed to ‘software developers’)
• Allocate resource types to activities and examine the resource histogram
Resource histogram: systems analysts
Resource clashes
can be resolved by:
– delaying one of the activities
• taking advantage of float to change start date
• delaying start of one activity until finish of the other activity that resource is being used on - puts back project completion
– moving resource from a non-critical activity
bringing in additional resource - increases costs
Prioritizing activities
There are two main ways of doing this:
• Total float priority – those with the smallest float have the highest priority
• Ordered list priority – this takes account of the duration of the activity as well as the float – see next overhead
Burman’s priority list
Give priority to:
• Shortest critical activities
• Other critical activities
• Shortest non-critical activities
• Non-critical activities with least float
• Non-critical activities
Resource usage

• Need to maximise %usage of resources i.e. reduce idle periods between tasks
• Need to balance costs against early completion date
• Need to allow for contingency
Critical path
• Scheduling resources can create new dependencies between activities – recall critical chains
• It is best not to add dependencies to the activity network to reflect resource constraints
– Makes network very messy
– A resource constraint may disappear during the project, but link remains on network
• Amend dates on schedule to reflect resource constraints
Allocating individuals to activities
The initial ‘resource types’ for a task have to be replaced by actual individuals.
Factors to be considered:
• Availability
• Criticality
• Risk
• Training
• Team building – and motivation
Cost schedules
Cost schedules can now be produced:
Costs include:
• Staff costs
• Overheads
• Usage charges
Cost profile
Accumulative costs

MODULE-II
Lecture #19
Monitoring and control
To appreciate how project control works you must first understand that, despite all the effort devoted to developing and gaining commitment to a plan, there is little chance that the resulting project will run precisely according to that plan. This doesn’t mean that you will fail to achieve the objectives of the plan – on the contrary, you must have a very high level of confidence that you can achieve those objectives and deliver the full scope, fit for purpose, on time and to budget. The plan describes what you would like to do but it models just one of the infinite number of routes from where you are now to where you want to be. In practice your project will follow a different route to the one shown in your plan, you don’t know which one, but you will need control to make sure it is a route that takes you to where you need to be, when you need to be there, and at a cost you can afford. The power of the plan is that it gives you a baseline against which you can compare actual achievement, cost and time and determine the amount of deviation from plan and hence take corrective action if required.The essential requirement for control is to have a plan against which progress can be monitored to provide the basis for stimulating management action if the plan is not being followed. Control then becomes a regular, frequent iteration of: Creating the right environment for control.Project Monitoring and Control
Monitoring –collecting, recording, and reporting information concerning project performance that project manger and others wish to know
Controlling –uses data from monitor activity to bring actual performance to planned performance
Why do we monitor?What do we monitor?When to we monitor?How do we monitor?
Why do we monitor?
Simply because we know that things don’t always go according to plan (no matter how much we prepare)
To detect and react appropriately to deviations and changes to plansWhat do we monitor?
Men (human resources)MachinesMaterialsMoneySpaceTimeTasksQuality/Technical Performance
What do we monitor?Inputs
TimeMoneyResourcesMaterial UsageTasksQuality/Technical Performance
OutputsProgressCostsJob startsJob completionEngineering / Design changesVariation order (VO)
When do we monitor?End of the projectContinuouslyRegularlyLogicallyWhile there is still time to reactAs soon as possibleAt task completionAt pre-planned decision points (milestones)

Where do we monitor?At head office?At the site office?On the spot?Depends on situation and the ‘whats’
How do we monitor?Through meetings with clients, parties involved in project (Contractor, supplier,etc.)For schedule –Update CPA, PERT Charts, Update Gantt ChartsUsing Earned Value AnalysisCalculate Critical RatiosMilestonesReportsTests and inspectionsDelivery or staggered deliveryPMIS (Project Management Info Sys) Updating
Meetings –Some monitoring isWhat problems do you have and what is being done to correct them?What problems do you anticipate in the future?Do you need any resources you do not yet have?Do you need information you do not have yet?Do you know anything that will give you schedule difficulties?Any possibility your task will finish early/late?Will your task be completed under/over/on budget?
Project Control CycleThe basic requirements for control are:a plan that is:- realistic- credible- detailed enough to be executed- acceptable to those who must execute it (Project Manager and Project Teams)- approved by those who are accountable for its achievement (the SRO/ Project Board); a process for monitoring and managing progress and resource usage; a project management organisation of appropriately skilled people with sufficient authority and time to plan, monitor, report, take decisions and deal with exceptions; a process to make minor corrections and adjustments to deal with minor deviations and omissions from the plan; the commitment of those who will provide the resources indicated in the plan ( SRO, Project Board, Stakeholders and resource ‘owners’ in the parent organisation and its related agencies); explicit authority to proceed granted by those who are accountable for the project. In all but the smallest or shortest projects you should think about how to break your project into manageable ‘chunks’ called stages. Every project will have a minimum of two stages – the firstbeing Project Initiation. A large project may have a number of stages, each of which has its own stage plan. When designing your project’s stage structure look for points where the Project manager should: review achievements to date and assess project viability take key decisions outside the level of authority of the Project Manager

The Project Manager will also be able to identify stage boundaries by thinking about how far ahead is it sensible to plan in the fine detail needed for day to day control. In practice, thedetailed plan for a stage will be produced towards the end of the preceding stage, when the information needed for planning is available.
Project ControlControl –process and activities needed to correct deviations from planControl the triple constraints time (schedule)cost (budget, expenses, etc) performance (specifications, testing results, etc.)
Checkpoints:Checkpoint reports are produced by team managers /leaders for the Project Manager who needs to have early warning of deviations from plan and other problems affecting the project team. Checkpoints provide regular, frequent comparison of actual progress, resource usage and forecasts against plans. They provide information for the Project Manager to apply control, eg bycorrecting small deviations from the plan. The basic purpose of a checkpoint is to answer the questions: ‘What is going according to plan?’ ‘What is not going to plan?’ ‘What is likely not to go to plan?’Checkpoints are essential controls – missed checkpoints are usually an early sign of a failing project. The information gathered at checkpoints should be documented in Checkpoint Reports and used in the preparation of Highlight Reports.
Techniques for monitoring and controlEarned Value AnalysisCritical Ratio
Lecture #20
EARNED VALUE ANALYSIS
A way of measuring overall performance (not individual task) is using an aggregate performance measure -Earned Value
Earned value of work performed (value completed) for those tasks in progress found by multiplying the estimated percent physical completion of work for each task by the planned cost for those tasks. The result is amount that should be spent on the task so far. This can be compared with actual amount spent.Methods for estimating percent completionThe 50-50 estimate. 50% is assumed when task is begun, and remaining 50% when work completed.
0-100% rule. This rule allows no credit for work until task is complete, highly conservative rule, project always seem late until the very end of project when everything appears to suddenly catch up

Critical input rule. This rule assigns progress according to amount of critical input that has been used. Labor or skilled dependent, machine critical input –buy machine complete task –may be misinformation
Proportional rule. This rule divides planned (or actual) time-to-date by total scheduled time(or budgeted (or actual ) cost-to-date by total budgeted cast] to calculate percent complete. This is commonly used rule.
Refer to earned value chart –basis for evaluating cost and performance to dateIf total value of the work accomplished is in balance with the planned (baseline) cost, and actual cost then top mgmt has no particular need for a detailed analysis of individual tasks
Earned value concept –combines cost reporting & aggregate performance reporting into one comprehensive chart.
A technique for performing quantitative analysis of progress does exist called Earned Value Analysis(EVA)
To determine the earned value, the following steps are performed:
Baseline cost to completion –referred to as budget at completion (BAC)
Actual cost to date –referred to as estimated cost at completion (EAC)
Identify several variances according to two guidelines1.A negative variance is ‘bad’2.Cost and schedule variances are calculated as earned value minus some other measure
1. The budgeted cost of work scheduled (BCWS) is determined for each work task represented in the schedule.
2. The BCWS values for all work tasks are summed to derive the budget at completion, BAC. Hence,
– BAC = (BCWSk) for all tasks k
Next, the value for budgeted cost of work performed (BCWP) is computed.
Given values for BCWS, BAC, and BCWP, important progress indicators can be computed:
Schedule performance index, SPI = BCWP/BCWS
Schedule variance, SV = BCWP – BCWS
Details to be calculated
Percent scheduled for completion = BCWS/BAC
Percent complete = BCWP/BAC

Cost performance index, CPI = BCWP/ACWP
Cost Performance index, CPI
= Earned Value / Actual cost to date
CPI > 1 means “better than planned”
CPI < 1 means “slower than planned”
Earned Value Analysis -Variances4 types of variances;
Cost (spending)variance (CV)–difference between budgeted cost of work performed (earned value) (BCWP) and actual cost of that work (ACWP)
= Earned Value – Actual cost to dateIndicates how the planned cost differs from actual cost
Schedulevariance (SV)–difference between earned value (BCWP) and cost of work we scheduled to perform to date (BCWS)
Timevariance (TV)–difference between time scheduled for work performed (STWP) and actual time to perform it (ATWP)
Cost variance, CV = BCWP – ACWP
A CPI value close to 1.0 provides a strong indication that the project is within its defined budget. CV is an absolute indication of cost savings (against planned costs) or shortfall at a particular stage of a project.
Earned Value Variance –FormulaCV = BCWP –ACWP (negative value -cost overrun) SV = BCWP –BCWS (negative value -behind schedule)TV = STWP –ATWP (negative value -delay)Index (Ratios)Cost Performance Index (CPI) = BCWP/ACWPSchedule Performance Index (SPI) = BCWP/BCWS
Time Performance Index (TPI) = STWP/ATWP
EXAMPLEAssume that operations on a Work Package cost RM 1,500 to complete. They were originally scheduled to finish today. At this point, we actually spent RM1,350. And we estimate that we have completed two thirds (2/3) of the work. What are the cost and schedule variances?
CV = BCWP –ACWP = 1500 (2/3) –1350 = -350 SV = BCWP –BCWS = 1500 (2/3) –1500 = -500
CPI = BCWP/ACWP = 1500(2/3)/1350 = 0.74 SPI = BCWP/BCWS = 1500(2/3)/1500 = 0.67 Spending higher than budget, and given what we have spent, we are not as far along as
we should be (have not completed as much work as we should have)
Lecture #21
6 Possibilities Earned Value Analysis
EXAMPLE
A project to develop a country park has an actual cost in month 17 of $350,000, a planned cost of $475,000, and a value completed of $300,000. Find the cost and schedule variances and the three indexes.

SolutionBCWS = 475,000BCWP = 300,000ACWP = 350,000CV = 300,000 –350,000 = -50,000 (negative value -cost overrun) SV = 300,000 –475,000 = -175,000 (negative value -behind schedule)Cost Performance Index (CPI) = BCWP/ACWP = 300/350 = 0.86Schedule Performance Index (SPI) = BCWP/BCWS = 300/475 = 0.63Time Performance Index (TPI) = STWP/ATWPScheduled Time Work Performed (STWP) can be estimated Time t = Schedule Variance/Slope of Planned costs = -175,000/ (475,000/17) = -6.26 monthsTime Difference= 17-6.26 = 10.74TV = 10.74/17 = 0.63CV = BCWP –ACWPSV = BCWP –BCWS
Critical ratioSometimes, especially large projects, it may be worthwhile calculating a set of critical
ratios for all project activitiesThe critical ratio is
actual progress x budgeted costscheduled progress actual cost
If ratio is 1 everything is probably on targetThe further away form 1 the ratio is, the more we may need to investigate
Prioritizing monitoring
So far we have assumed that all aspects of a project will receive equal treatment in terms of the degree of monitoring applied. We must not forget, however, that monitoring takes time and uses resources that might sometimes be put to better use!
In this section we list the priorities we might apply in deciding levels of monitoring.
• Critical path activities Any delay in an activity on the critical path will cause a delay in the completion date for the project. Critical path activities are therefore likely to have a very high priority for close monitoring.
• Activities with no free float A delay in any activity with no free float will delay at least some subsequent activities even though, if the delay is less than the total float, it might not delay the project completion date. These subsequent delays can have serious effects on our resource schedule as a delay in a
Free float is the amount of time an activity may be delayed without affecting any subsequent activity.
PERT and the significance of activity duration variance was described in Chapter 7.

subsequent activity could mean that the resources for that activity will become unavailable before that activity is completed because they are committed elsewhere.
Activities with less than a specified float If any activity has very little float it might use up this float before the regular activity monitoring brings the problem to the project manager's attention. It is common practice to monitor closely those activities with less than, say, one week free float.
High risk activities A set of high risk activities should have been identified as part of the initial risk profiling exercise. If we are using the PERT three-estimate approach we will designate as high risk those activities that have a high estimated duration variance. These activities will be given close attention because they are most likely to overrun or overspend.
Activities using critical resources Activities can be critical because they are very expensive (as in the case of specialized contract programmers). Staff or other resources might be available only for a limited period, especially if they are controlled outside the project team. In any event, an activity that demands a critical resource requires a high level of monitoring.
Priority list of activity to monitor
Critical activities
Non-critical activities with no free float
Non-critical activities with less than a specified float
High risk activities
Activities with critical resources
Bringing the Project Back to Target
You are now behind the schedule
Possible actions:
Reschedule the target date
Reschedule other activities with shorter duration
Reorder the activities
Shorten the Critical Activities
Putting pressure on the personnel
Increasing the resources
Personnel work longer hours
Additional analysts to interview users
Competent programmer to code modules in the critical activity
Reorder the activities
Relax the constraints on the start of an activity before the completion of the previous one
Subdivide the components of an activity so that they can be done in parallel
Change control
Change control is method for implementing only changes that are worth pursuing, and for
preventing unnecessary or overly costly changes from derailing the project. Change control is
essentially an agreement between the project team and the managers that are responsible for
decision-making on the project to evaluate the impact of a change before implementing it. Many
changes that initially sound like good ideas will get thrown out once the true cost of the change is
known. The potential benefit of the change is written down, and the project manager works with
the team to estimate the potential impact that the change will have on the project. This gives the
organization all of the information necessary to do a real cost-benefit analysis. If the benefit of
the change is worth the cost, the project manager updates the plan to reflect the new estimates.
Otherwise, the change is thrown out and the team continues with the original plan.
Establish a Change Control Board
The most important part of change control is a change control board (CCB). There are certain
people in the organization who have the power to change the scope of the project. Usually there
is a senior manager or decision-maker who has the authority to make sweeping changes at will;
sometimes there are several people in this position. For change control to be effective, these
people must be part of the CCB.
In addition, the CCB should contain people from the project team:
The project manager
An important stakeholder or user (or someone who understands and advocates their
perspective)

Someone who understands the effort involved in making the change (usually, this is a
representative from the programming team)
Someone who understands the engineering decisions that the team makes over the course of
the project (a design team member, requirements analyst or, if neither is available, a
programmer who participated in the design of the software)
Someone who is familiar with the expected functionality of the software and with the
behavior being discussed for each individual change (typically a tester)
This last person fulfills a very important role in the change control process. Typically, she is
involved in the tracking of changes and defects in the product. When a bug is reported, part of
her job is to figure out whether it is a defect (meaning that the software does not behave the way
its specification requires it to behave) or a change (meaning that the software behaves as
designed, but that this behavior is not what the users or stakeholders need).
Lecture #22
Software configuration management
Definition: A set of management disciplines within the software engineering process to develop a baseline.
Software configuration management The results (also called as the deliverables) of a large software development effort typically consist of a large number of objects, e.g. source code, design document, SRS document, test document, user’s manual, etc. These objects are usually referred to and modified by a number of software engineers through out the life cycle of the software. The state of all these objects at any point of time is called the configuration of the software product. The state of each deliverable object changes as development progresses and also as bugs are detected and fixed. Software Configuration Management Activities: Configuration item identification Promotion management Release management Branch management Variant management Change managementConfiguration Management Activities Configuration item identificationmodeling of the system as a set of evolving components Promotion management is the creation of versions for other developers
Release management is the creation of versions for the clients and users Change management is the handling, approval and tracking of change requests Branch managementis the management of concurrent development Variant managementis the management of versions intended to coexist
Release vs. Version vs. Revision A new version of a software is created when there is a significant change in functionality, technology, or the hardware it runs on, etc. On the other hand a new revision of a software refers to minor bug fix in that software. A new release is created if there is only a bug fix, minor enhancements to the functionality, usability, etc.
For example, one version of a mathematical computation package might run on Unix-based machines, another on Microsoft Windows and so on. As a software is released and used by the customer, errors are discovered that need correction. Enhancements to the functionalities of the software may also be needed. A new release of software is an improved system intended to replace an old one. Often systems are described as version m, release n; or simple m.n. Formally, a history relation is version of can be defined between objects. This relation can be split into two sub relations is revision of and is variant of.
Necessity of software configuration management There are several reasons for putting an object under configuration management. But, possibly the most important reason for configuration management is to control the access to the different deliverable objects. Unless strict discipline is enforced regarding updation and storage of different objects, several problems appear. The following are some of the important problems that appear if configuration management is not used. Inconsistency problem when the objects are replicated. A scenario can be considered where every software engineer has a personal copy of an object (e.g. source code). As each engineer makes changes to his local copy, he is expected to intimate them to other engineers, so that the changes in interfaces are uniformly changed across all modules. However, many times an engineer makes changes to the interfaces in his local copies and forgets to intimate other teammates about the changes. This makes the different copies of the object inconsistent. Finally, when the product is integrated, it does not work. Therefore, when several team members work on developing an object, it is necessary for them to work on a single copy of the object, otherwise inconsistency may arise. Problems associated with concurrent access. Suppose there is a single copy of a problem module, and several engineers are working on it. Two engineers may simultaneously carry out changes to different portions of the same module, and while saving overwrite each other. Though the problem associated with concurrent access to program code has been explained, similar problems occur for any other deliverable object. Providing a stable development environment. When a project is underway, the team members need a stable environment to make progress. Suppose somebody is trying to integrate module A, with the modules B and C, he cannot make progress if developer of module C keeps changing C; this can be especially frustrating if a change to module C forces him to recompile A. When an
effective configuration management is in place, the manager freezes the objects to form a base line. When anyone needs any of the objects under configuration control, he is provided with a copy of the base line item. The requester makes changes to his private copy. Only after the requester is through with all modifications to his private copy, the configuration is updated and a new base line gets formed instantly. This establishes a baseline for others to use and depend on. Also, configuration may be frozen periodically. Freezing a configuration may involve archiving everything needed to rebuild it. (Archiving means copying to a safe place such as a magnetic tape). System accounting and maintaining status information. System accounting keeps track of who made a particular change and when the change was made. Handling variants. Existence of variants of a software product causes some peculiar problems. Suppose somebody has several variants of the same module, and finds a bug in one of them. Then, it has to be fixed in all versions and revisions. To do it efficiently, he should not have to fix it in each and every version and revision of the software separately. Software configuration management activities Normally, a project manager performs the configuration management activity by using an automated configuration management tool. A configuration management tool provides automated support for overcoming all the problems mentioned above. In addition, a configuration management tool helps to keep track of various deliverable objects, so that the project manager can quickly and unambiguously determine the current state of the project. The configuration management tool enables the engineers to change the various components in a controlled manner. Configuration management is carried out through two principal activities:
• Configuration identification involves deciding which parts of the system should be kept track of.
• Configuration control ensures that changes to a system happen smoothly.
Configuration identification The project manager normally classifies the objects associated with a software development effort into three main categories: controlled, precontrolled, and uncontrolled. Controlled objects are those which are already put under configuration control. One must follow some formal procedures to change them. Precontrolled objects are not yet under configuration control, but will eventually be under configuration control. Uncontrolled objects are not and will not be subjected to configuration control. Controllable objects include both controlled and precontrolled objects. Typical controllable objects include:
Requirements specification document Design documents
Tools used to build the system, such as compilers, linkers, lexical analyzers, parsers, etc. Source code for each module Test cases Problem reports The configuration management plan is written during the project planning phase and it lists all controlled objects. The managers who develop the plan must strike a balance between controlling too much, and controlling too little. If too much is controlled, overheads due to configuration management increase to unreasonably high levels. On the other hand, controlling too little might lead to confusion when something changes.
Configuration control Configuration control is the process of managing changes to controlled objects. Configuration control is the part of a configuration management system that most directly affects the day-to-day operations of developers. The configuration control system prevents unauthorized changes to any controlled objects. In order to change a controlled object such as a module, a developer can get a private copy of the module by a reserve operation as shown in fig. 12.5. Configuration management tools allow only one person to reserve a module at a time. Once an object is reserved, it does not allow any one else to reserve this module until the reserved module is restored as shown in fig. 12.5. Thus, by preventing more than one engineer to simultaneously reserve a module, the problems associated with concurrent access are solved.
Cancel reservation
restore reserve
Fig. 12.5: Reserve and restore operation in configuration control
It can be shown how the changes to any object that is under configuration control can be achieved. The engineer needing to change a module first obtains a private copy of the module through a reserve operation. Then, he carries out all necessary changes on this private copy. However, restoring the changed module to the system configuration requires the permission of a change control board (CCB). The CCB is usually constituted from among the development team members. For every change that needs to be carried out, the CCB reviews the changes made to the controlled object and certifies several things about the change:
1. Change is well-motivated. 2. Developer has considered and documented the effects of the change. 3. Changes interact well with the changes made by other developers. 4. Appropriate people (CCB) have validated the change, e.g. someone has tested the
changed code, and has verified that the change is consistent with the requirement.
The change control board (CCB) sounds like a group of people. However, except for very large projects, the functions of the change control board are normally discharged by the project manager himself or some senior member of the development team. Once the CCB reviews the changes to the module, the project manager updates the old base line through a restore operation (as shown in fig. 12.5). A configuration control tool does not allow a developer to replace an object he has reserved with his local copy unless he gets an authorization from the CCB. By

constraining the developers’ ability to replace reserved objects, a stable environment is achieved. Since a configuration management tool allows only one engineer to work on one module at any one time, problem of accidental overwriting is eliminated. Also, since only the manager can update the baseline after the CCB approval, unintentional changes are eliminated.
Lecture #23
Contract Management:-
During the life cycle of projects, various parties come together and work to fulfill objective of the project. We need to know how these parties are communicating to each other and what ways are they communicating among themselves. The first point is called delivery methods or contractual relations and the second issues are termed as type of contracts. The flow of information between various parties involved takes place in many ways. i.e . there are different approaches used to organize the project team to manage the entire design and construction process.
What is Contract Management?Contract management is a perspective, discipline and systems approach which looks to actively manage the contracting process end-to-end for the benefit of the organization. In particular, it is intended to:° reduce the fragmentation that characterizes the contracting process in so many organizations;° increase and improve- quality control,- consistency,- compliance with law and organization policy, and- efficiency (reducing cycle time and transaction overhead); and° enable better collection of information for improved strategic decision making, including better customer-supplier relationship management and increased responsiveness to the market.Acquiring software from external supplier
This could be:
• a bespoke system - created specially for the customer
• off-the-shelf - bought ‘as is’
• customised off-the-shelf (COTS) - a core system is customised to meet needs of a particular customer
Types of Contract

Contract is an agreement between two or than two parties in which one is agreed to provide goods and services to other for which he will get the return in the some form. The contract is legal document and binding on both the parties. The form in which return for providing goods and services is delivered, is called type of contracts. There are different types of contracts which can be employed in any of the delivery methods. Owner can pay the money to the contractor, in lump-sum, based on measured work with unit price, based on percentage plus quantity involved. In the following, we shall briefly discuss the different type of contract.
a. Lump-sum contract: This is a single fixed price contract. In this contract, contractor agrees to perform specified job for fixed sum. The owner provides the contractor exact specification of the work. In this contract both the parties try to fix the conditions of the work as precisely as possible. Following are the advantages of the fixed price contract.
a. Owner is aware of the cost of the project before the project construction starts. b. It avoids a lot of details and accounting by both owner and contractor. c. Contractor gets free hand to execute the work. d. If this contract is used with design-construct method of delivery, contractor gets
opportunity to use value engineering.
Types of Contract
b. fixed price contractsc. time and materials contractsd. fixed price per delivered unit
Note difference between goods and services
Often licence to use software is bought rather than the software itself
Fixed price contracts
Advantages to customer
• known expenditure• supplier motivated to be cost-effective
Disadvantages
• supplier will increase price to meet contingencies• difficult to modify requirements• cost of changes likely to be higher• threat to system quality
Time and materials
Advantages to customer

• easy to change requirements• lack of price pressure can assist product quality
Disadvantages
• Customer liability - the customer absorbs all the risk associated with poorly defined or changing requirements
• Lack of incentive for supplier to be cost-effective
Fixed price per unit delivered
Fixed price/unit
Advantages for customer
• customer understanding of how price is calculated
• comparability between different pricing schedules
• emerging functionality can be accounted for supplier incentive to be cost-effective
Disadvantages
• difficulties with software size measurement - may need independent FP counter
• changing (as opposed to new) requirements: how do you charge?
The tendering process
• Open tendering
– any supplier can bid in response to the invitation to tender
– all tenders must be evaluated in the same way
government bodies may have to do this by local/international law (including EU and WTO, World Trade Organization, requirement.
• Restricted tendering process
– bids only from those specifically invited
– can reduce suppliers being considered at any stage
• Negotiated procedure
– negotiate with one supplier e.g. for extensions to software already supplied.
Lecture #24
Stages in contract placement
Requirement analysis
Evaluation plan
Invitation to tender
Evaluation of proposals
Requirements document: sections
• introduction
• description of existing system and current environment
• future strategy or plans
• system requirements -
– mandatory/desirable features
• deadlines
• additional information required from bidders
Requirements:- These will include
– functions in software, with necessary inputs and outputs
– standards to be adhered to
– other applications with which software is to be compatible

– quality requirements e.g. response times
Evaluation plan:- How are proposals to be evaluated?
Methods could include:
– reading proposals
– interviews
– demonstrations
– site visits
– practical tests
• Need to assess value for money (VFM) for each desirable feature
• VFM approach an improvement on previous emphasis on accepting lowest bid
• Example:
– feeder file saves data input
– 4 hours work a month saved at £20 an hour
– system to be used for 4 years
– if cost of feature £1000, would it be worth it?
Invitation to tender (ITT):- Note that bidder is making an offer in response to ITT
• acceptance of offer creates a contract
• Customer may need further information
• Problem of different technical solutions to the same problem.
Memoranda of agreement (MoA):-
• Customer asks for technical proposals
• Technical proposals are examined and discussed
• Agreed technical solution in MoA
• Tenders are then requested from suppliers based in MoA
• Tenders judged on price

• Fee could be paid for technical proposals by customer
Contracts
• A project manager cannot be expected to be a legal expert – needs advice
• BUT must ensure contract reflect true requirements and expectations of supplier and client
Contract checklist:-
• Definitions – what words mean precisely e.g. ‘supplier’, ‘user’, ‘application’
• Form of agreement. For example, is this a contract for a sale or a lease, or a license to use a software application? Can the license be transferred?
• Goods and services to be supplied – this could include lengthy specifications
• Timetable of activities
• Payment arrangements – payments may be tied to completion of specific tasks
• Ownership of software
• Can client sell software to others?
• Can supplier sell software to others? Could specify that customer has ‘exclusive use’
• Does supplier retain the copyright?
• Where supplier retains source code, may be a problem if supplier goes out of business; to circumvent a copy of code could be deposited with an escrow service
• Environment – for example, where equipment is to be installed, who is responsible for various aspects of site preparation e.g. electricity supply?
• Customer commitments – for example providing access, supplying information.
• Standards to be met
Contract management
Some terms of contract will relate to management of contract, for example,
• Progress reporting
• Decision points – could be linked to release of payments to the contractor
• Variations to the contract, i.e. how are changes to requirements dealt with?
• Acceptance criteria
How would you evaluate the following?:- usability of an existing package
• usability of an application yet to be built
• maintenance costs of hardware
• time taken to respond to requests for software support
• training
Contract management: Contracts should include agreement about how customer/supplier relationship is to be managed e.g.
– decision points - could be linked to payment
– quality reviews
– changes to requirements
Lecture #25
Typical terms of a contract:Definition• Form of agreement• Goods & services to be supplied• Ownership of the software• Environment• Custmer commitments• Acceptance procedures• Standards• Project & quality management• Timetable• Price & payment methods• Miscellaneous legal requirements
Contract managementWe need to consider the communication between supplier & customer while contract work is being carried out• Decision point• Future direction of the project• Development cycleAcceptanceAcceptance testing• Time limit
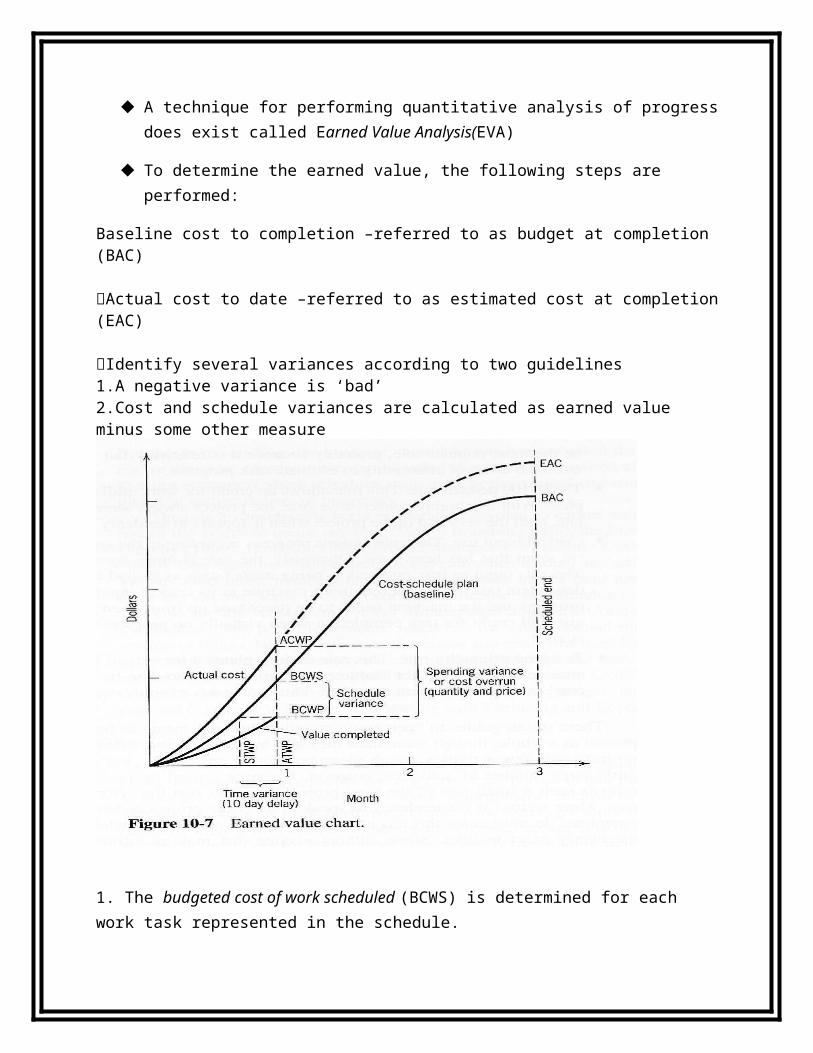
• Pre acceptance testing• Period of operational running• Period of warranty
Lecture #26
SWOT Analysis
SWOT analysis (strengths, weaknesses, opportunities, and threats) can also be used during risk identification
Project teams focus on the broad perspectives of potential risks for particular projects
What are the company’s strengths and weaknesses related to this project
What opportunities and threats exist
Helps identify the broad negative and positive risks that apply to a project
Decision Trees and Expected Monetary Value (EMV) A decision tree is a diagramming analysis technique used to help select the best course
of action in situations in which future outcomes are uncertain Estimated monetary value (EMV) is the product of a risk event probability and the risk
event’s monetary value
Expected Monetary Value (EMV)
What is Decision tree?
• A Visual Representation of Choices, Consequences, Probabilities, and Opportunities.
• A Way of Breaking Down Complicated Situations Down to Easier-to-Understand Scenarios.
Easy example
• A Decision Tree with two choices.

Notation Used in Decision Trees
• A box is used to show a choice that the manager has to make.
• A circle is used to show that a probability outcome will occur.
• Lines connect outcomes to their choice or probability outcome.
Decision Tree Example
PRODUCT LAUNCH WITH Decision Trees
A new consumer product has been developed by a company and preliminary marketing potential has been estimated as a chance of 0.4 for successful launch which would result in an annual profit with the present worth of Rs.2,000,000.Failure of product would mean a loss of Rs.300,000. The company can either drop the idea , or launch the product immediately , or try in a test market ( at a cost of Rs.40,000) before deciding to drop or launch.
The test market would classify the sample response in one of the following three categories:-(a) Less than 10% of the public try the new product ,
(b) More than 10% try the product , but less than 25% of those who try buy it on a second or subsequent occasion,
Go to Graduate School to get my MBA.
Go to Work “in the Real World”
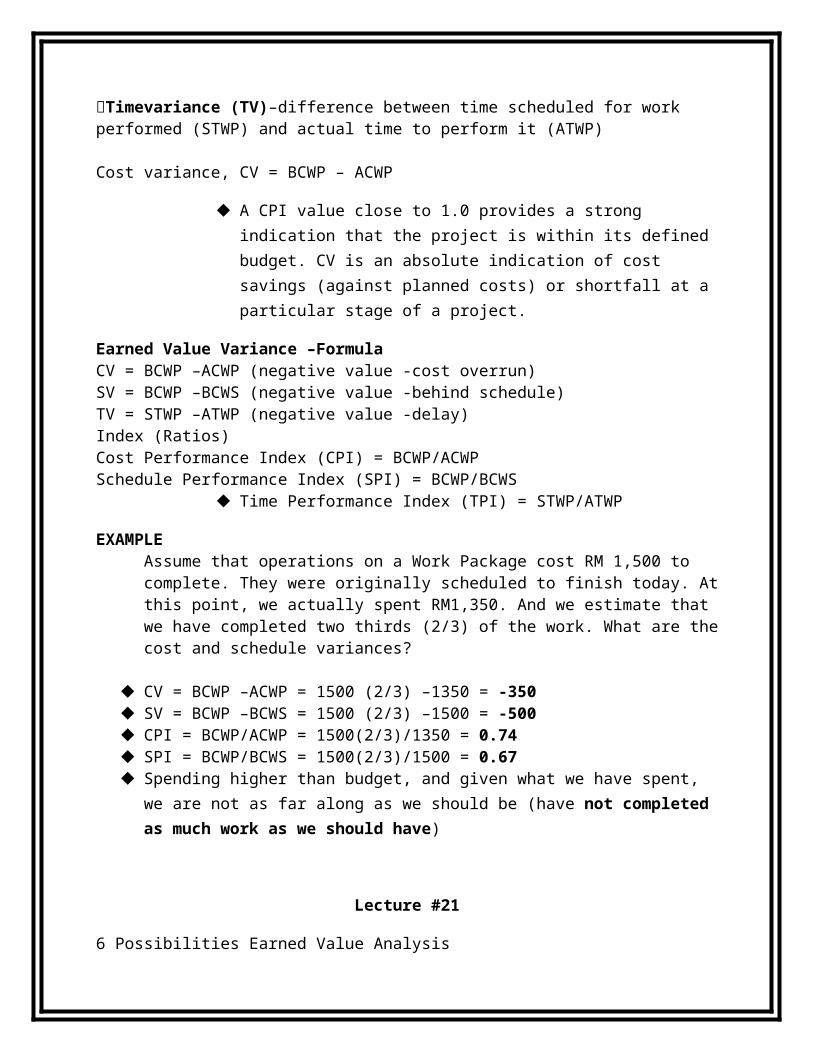
(c) more 10% try the product and the repeat purchase rate is 25% or more.
Based on the subjective estimates of experts the following joint probability table is available.
Test Market response
(a) (b) (c) Success(S) 0.05 0.10 0.25Failure(F) 0.45 0.15 0.00
Use a decision tree to determine what is best for the company to do . Also obtain the probability distribution of outcomes for each choice , and comment on the risk in each choice.
(figure of Decision tree)
OPTIMAL DECISION TREE
PROBABILITY DATA
P(S,a) = 0.05 P(S,b) = 0.10 P(S,c) = 0.25
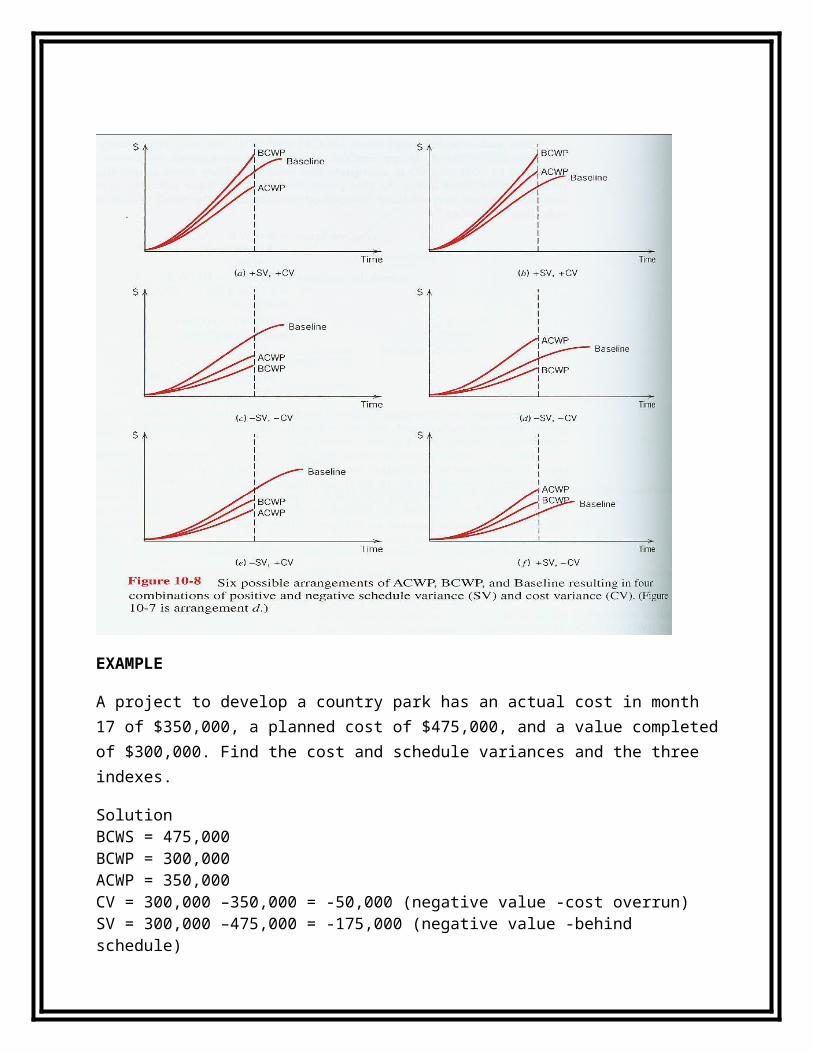
P(F,a) = 0.45 P(F,b) = 0.15 P(F,c) = 0.00
P(S) = (0.05+0.10+0.25) = 0.40
P(F) = (0.45+0.15+0.00) = 0.60
P(a) = (0.05+0.45) = 0.50
P(b) = (0.10+0.15) = 0.25
P(c) = (0.25+0.00) = 0.25 TREE EVALUATION
Let annual profit be (P) = 2,000,000Let loss due to failure be (F)=300,000 Let test market cost be (T) = 40,000
If product is launched direct then, At node 2, value (E2) = P(S)*P + P(F)*F = 0.4*2,000,000 + 0.6*(-300,000)(E2)= 620,000
If test market of product is done then, At node 9, value = [P(S,c)*P+P(F,c)*F]/P(c) =(0.25*2,000,000 + 0.00*(-300,000)) /0.25 (E9) = 2,000,000 TREE EVALUATION
At node 8, value = [P(S,b)*P+P(F,b)*F]/P(b) =(0.10*2,000,000 + 0.15*(-300,000)) /0.25 (E8) = 620,000
At node 7, value = [P(S,a)*P+P(F,a)*F]/P(a) =(0.05*2,000,000 + 0.45*(-300,000)) /0.50 (E7) = -70,000
Since nodal value @ node 7 is negative indicating loss thereby it is better to drop the product @ node 4 but launch the product @ node 5 & node 6 since nodal value @ node 8 & 9 are positive indicating profit .
The value @ node 6 (E6) = value @ node 9 =2,000,000 The value @ node 5 (E5) = value @ node 8 =620,000 The value @ node 4 (E4) = 0 Thereby P(F)=P(F,b)+P(F,c)=0.15+0=0.15 TREE EVALUATION
At node 3,value(E3)=P(a)*E4+P(b)*E5+P(c)*E6 = 0.5*0 + 0.25*620,000 + 0.25*2,000,000 = 655,000
If the company drop the idea then expected return is Rs 0
If the company directly launches the product then the expected return is Rs 620,000 If company tests the products potential by market survey then expected return is Rs (655,000-40,000)=615,000
Thereby to get some return company should not drop the idea, instead it should go for test market since expected return in direct launch and test market is near about same but the chance of failure in direct launch =0.6 while in test market it is only 0.15 ENUMERATION OF ALL STRATEGIES
The various possible strategies can be
(1) Drop or Status quo.
(2) Direct Launch
(3) Test Market
MODULE-III
Lecture #27
Quality management & people management
What is quality?
Quality is the ability of a set of inherent characteristics of a product, service, product component or process to fulfill requirements of customers.
What is Quality management?
It is the sum of all planned systematic activities and processes for creating , controlling and assuring quality.
What is Software Quality management?
It is the discipline that ensures that the software we are using and depending upon is of right quality.
Software Quality Standards
ISO 9001 (International Organization for Standardization)
– Defines the needs from a monitor & control system to check quality
– Certification of the Design, Development, Production, Installation an Service Processes
– Describes the fundamental features of Quality Management System (QMS)
– Useful in selecting a sub-contractor with “best practices” quality processes.
– Deals with quality of the development process, not with the quality of the product
ISO 9001 Principles
– Determine the NEEDS and Expectations of the customer– Establish Quality Policy and imply the actual quality objectives– Design the project activities to include the quality objectives– Assign responsible parties to all the quality objectives– Allocate enough and knowledgeable resources– Implement methods to measure the quality objectives in each process– Collect & Analyze the Measurements and Identify discrepancies– Define action items to eliminate the cause of the discrepancies– Documentation (follows quality manual) of the actual (updated) operation of an
activity that includes objectives, plans, procedures and records– The QMS is well managed and knowledgeable resources are assigned to the
Quality Management Process.– Demonstrate that the Production Process is well defined, designed, recorded,
communicated and measured.– Sub-Contractors and Purchasing are managed in the same manners.
CMM – Capability Maturity Model Software Development Methods and Tools which are Likely to produce Quality Software
Software Companies are assigned a level ( 1 to 5 ) of Process Maturity that indicates the quality of their software production practices
Level 1: Initial Level
– Default level, no defined quality process throughout the organization. Some projects may adopt some measures.
Level 2: Repeatable Level
– Basic Project Management in place, not in the activities level
Level 3: Defined Level
– Project Management Plan is well defined at all levels
Level 4: Managed Level
– Products & Processes are Measured and Controlled
Level 5: Optimizing Level
- Process Improvement is introduced based on documented data gathered from previous projects, processes.
Maturity Level 1 Initial:- Maturity Level 1 deals with performed processes.
- Processes are unpredictable, poorly controlled, reactive. - The process performance may not be stable and may not meet specific objectives such as
quality, cost, and schedule, but useful work can be done.
Maturity Level 2
Managed at the Project Level:- Maturity Level 2 deals with managed processes.
- A managed process is a performed process that is also:
– Planned and executed in accordance with policy
– Employs skilled people
– Adequate resources are available
– Controlled outputs are produced
– Stakeholders are involved
– The process is reviewed and evaluated for adherence to requirements
- Processes are planned, documented, performed, monitored, and controlled at the project level. Often reactive.
- The managed process comes closer to achieving the specific objectives such as quality, cost, and schedule.
Maturity Level 3Defined at the Organization Level:- Maturity Level 3 deals with defined processes.
- A defined process is a managed process that:- Well defined, understood, deployed and executed across the entire organization.
Proactive.- Processes, standards, procedures, tools, etc. are defined at the organizational
(Organization X ) level. Project or local tailoring is allowed, however it must be based

on the organization’s set of standard processes and defined per the organization’s tailoring guidelines.
Managing People and Organizing Teams
1) Introduction
Three main concerns are,
Staff selection
Staff development
Staff motivation
The project leader can encourage effective group working and decision making while giving purposeful leadership where needed.
Stages of project planning and execution.
2) Understanding Behaviour
People with practical experience of projects invariably identify the handling of people.
The managers must be able to decide on whether it is better to have experienced staff or get an expert advice.
Sensitive management of staff comes only from experience.
Organizational behaviour has evolved theories that try to explain people’s behaviour.
3) Organizational Behaviour : a Background
Three basic objectives are,
1. To select the best people for the job.
2. To instruct them in the best methods.
3. To give incentives in the form of higher wages to the best workers.
The encouragement to the staff will help the project group to work together in achieving their goals which ultimately increases thee productivity.
Theory X and Theory Y

The mangers work for money being instrumental are called as cash-oriented persons can be categorized based on their individual attitudes.
Theory X includes,
On an average , not every human likes to work.
Somebody must have the control and direct the person to work.
People do not like to hold responsibilities.
Theory Y includes,
People must like to work not forced to do it.
External control is not the way to reach organizational goals.
Commitment towards the work allocated to individuals.
Average human can learn to accept and seek responsibility
Creative qualities must be widely distributed.
Identifying best practice is valid.
A reward does not have to be a financial reward – it could be something like a sense of achievement.
4) Selecting the right person for the job
Taylor formulated the factor of selecting the right person for the right job.
The use of software tools and methodologies, affect programming productivity.
It is always better to have best people employed in the right place of work for effectively productivity.
4.1) The recruitment process
Recruitment is often an organizational responsibility.
There is a lot of stress for every project manager about choosing the right people to make up their team.
Meredith Belbin categorizes people in recruiting process in to two different types,

Eligible candidates – persons who have the right information needed by the organization in paper i.e curriculum vitae.
Suitable candidates – can actually do the job well but are not officially eligible.
Actual skills have to be taken into account while selecting a person rather than mere eligibility.
The recruitment process must include,
Create a job specification
Create a job holder profile
Obtaining applicants
Examine curriculum vitae
Interviews
References.
5)Instruction in the best methods
The responsibility of the team leader becomes very high in case of recruiting new members into the team.
Team members must be continually assessed by the team leader to meet their demands in the development process.
Proper training must be given to every staff member involved in the development of the project.
Decisions will need to be made about whether a newcomer can more effectively pick up technical expertise on the job or on formal training courses.
Team members finds about a new software tool and then demonstrating it to colleagues.
The training process must be actually implemented by the team members as a whole in order to meet the objectives.
Lecture #28
6) Motivation
There are various theories formulated by different persons for motivating the people to work.
They are,
Taylorist model
Maslow’s Hierarchy of needs
Herzberg’s two-factor theory
Expectancy theory of motivation
6.1) The Taylorist model
Piece rates can cause difficulties if a new system will change work practices.
Day-rates refer to payment for time worked.
The amount paid to the workers will not directly relate to maximize the output in order to maximize their income.
The amount of output will normally depend on the working group and not based on an individual.
Rewards based on piece-rates need to relate directly to work produced.
6.2) Maslow’s hierarchy of needs
Abraham Maslow, an American psychologist, formulated a hierarchy of needs with different levels.
Money can be very strong motivator with respect to individuals but even if the worker is satisfied with the payment.
Highest level of need defined by Maslow is “self-actualization” which expresses the feeling that the individual is completely fulfilling their potential.
The motivation of individuals varies.
Peoples are motivated by different things at different stages of their life.
6.3) Herzberg’s two-factor theory
People tend to be dissatisfied about their job due to certain factors. They are,
Hygiene or maintenance factors
Motivators
A hygiene factor makes the person dissatisfied if they are not rightly used.
A motivators can make the person feel that the job is worth doing it, like a sense of achievement or challenge of the work.
6.4) The expectancy theory of motivation
Three influences on motivation are,
Expectancy
Instrumentality
Perceived value
Expectancy – is a belief that working harder will lead to better performance.
Instrumentality – is the belief that better performance will be rewarded.
Perceived value – denotes the resulting reward.
7) The Oldham-Hackman job characteristics model
Managers should group together the elements of tasks to be carried out to satisfy the assignments.
The satisfaction that a job gives is based on five factors,
Skill variety
Task identity
Task significance
Autonomy
Feedback
7.1) Elements of Tasks
Factors that make the job meaningful to the person who is doing it are skill variety, task identity and task significance.
Skill variety – different skills that the job holder has the opportunity to exercise.
Task identity – person work and its results are identifiable as belonging to the person.
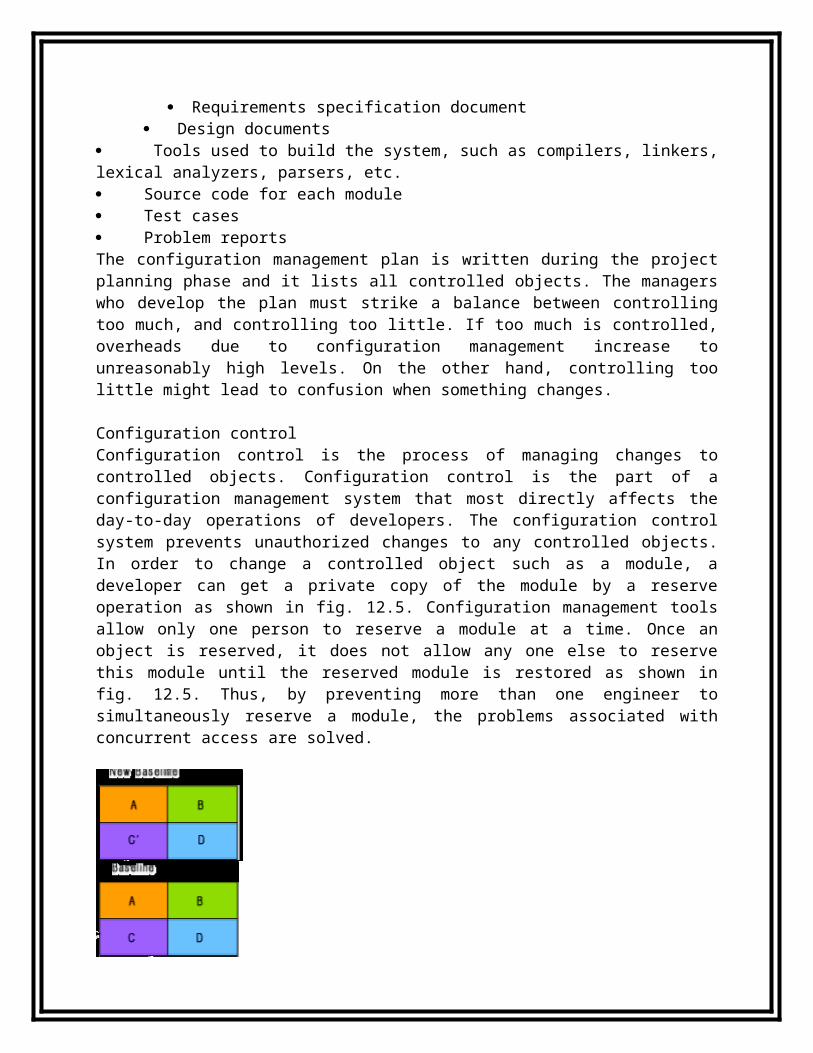
Task significance – the job has an influence on others.
Autonomy – discretion about the way the person works.
Feedback – information the person receives back about the results of his work.
7.2) Methods of improving motivation
Managers must adopt the factors listed below to improve motivation.
Set specific goals
Provide feedback
Consider job design
Set specific goals – demanding goals
Provide feedback – reflects the performance of the staff about how they are progressing.
Consider job design – the job more interesting and provides the staff with greater responsibility.
7.3) Measures for Enhancing job
Managers must involve the following measures to enhance the job design,
Job enlargement
Job enrichment.
Job enlargement – exactly reverse of specialization where the person doing the job carries out a wider variety of activities.
Job enrichment – where the job holder carried out tasks at managerial and supervisor level.
8) Working in Groups
Not all people involved in the development process like to work in groups.
Working in groups and many people attracted to software development find this difficult.
Formal groups can be formulated based on the different departments and task groups can be formed based on specific tasks carried.

Task groups can contain different people from different departments to work together to carry out a specific task.
9) Becoming a Team
Making people work together is the most difficult task that the project manager has to carefully handle.
A team cannot perform instantly, it has to develop over time.
Lecture #29
9.1) Team Formation Model
Every team has to go through five different stages of development as depicted in the team formation model namely,
Forming – rules and general behavior
Storming – methods of operation
Norming – conflicts are largely settled
Performing – how tasks are handled by the team
Adjourning – disbanding of the group.
9.2) Individual Characteristics
A team must be formed with the best mix of different personalities.
Belbin formulated the need of balanced teams based on individual characteristics of people.
The chair
The plant
The monitor-evaluator
The shaper
The team worker
The resource investigator
The completer-finisher
The company worker.
9.3) Group Performance
The groups are more effective than individuals working.
It is the responsibility of the project manager to distinguish the tasks which are supposed to be carried out together and those tasks to be carried out by individuals.
There are four different ways of categorizing group tasks, they are,
Additive tasks
Compensatory tasks
Disjunctive tasks
Conjunctive tasks
A major problem can arise with additive tasks that lead to social loafing.
Social loafing is a problem where some individuals do not make their proper contribution when carrying out group assignments.
10) Decision Making
Effective groups make decisions.
10.1) Categorize of Decisions
Decision making process can be categorized into,
Structured
Unstructured
Structured – decisions are generally simple where the rules are applied in a straight-forward way.
Unstructured – decisions are often more complex and require a great degree of creativity.
The amount of risk and the uncertainty involved in the development process can affect the decision making process.
10.2) Obstacles to good decision making

Few factors that affect good decision making process are,
Faulty heuristics – rules of thumb
Escalation of commitment – when a wrong decision is made which cannot be altered easily later
Information overload – too much of information also might lead the decision process to choose a wrong one.
10.3) Group decision making
In group discussions, different specialist and point of view stakeholders can be brought together to make a better decision.
Decisions made by a team can be approved and accepted easily than decisions imposed by individuals.
Every group meeting takes the collective responsibility of having properly briefed of solving complex problems.
A group can arrive at better solutions for complex problems because the members of the group have complementary skills and expertise.
Group meetings provide an opportunity for people to communicate freely and easily among the members of the group.
Groups are less effective for poorly structured problems where brainstorming techniques can be used to help the groups to make it structured.
10.4) Obstacles to Good Group Decision Making
Group decision making process has its own disadvantages,
It is time consuming process
Conflicts can arise among the members of the group
Decisions can be influenced by dominant personalities.
Sometimes people in groups take hasty decisions that can cause more risk than when they make their decisions on their own known as risky shift.
10.5) Measures to reduce Obstacles of Group Decision Making
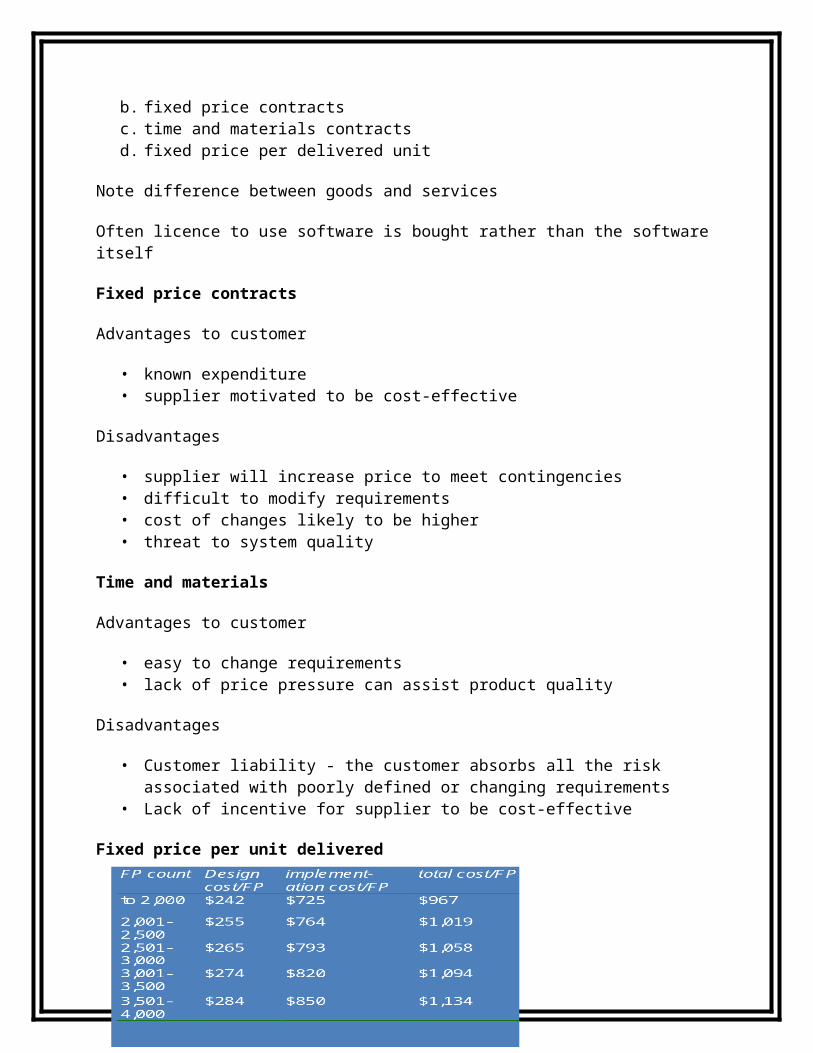
To make group decision making process to be more effective and efficient the Delphi technique can be adopted.
Delphi technique endeavourers to collate the judgements of a number of experts without actually bringing them face to face.
The set of procedures is carried out as follows,
Cooperation of a number of experts is enlisted.
Experts record their recommendations
Collected responses are recirculated
11) Leadership
Leadership means the ability to influence others in a group to act in a particular way to achieve group goals.
A leader need not be a very good manager or vice-versa since mangers have different roles such as organizing, planning and controlling.
It is very difficult to list the common characteristics of good leaders.
Leadership is generally based on the idea of authority or power.
11.1) Positional Leadership Power
Power can take the form based on the position of the person.
Positional power can be analyzed as,
Coercive power – ability to force someone to do something by threatening punishment.
Connection power – having access to those who have power.
Legitimate power – person’s title giving a special status.
Reward power – holder gives rewards to those who carry out tasks to the satisfaction of their leader.
11.2) Personal Leadership Power
Personal power depicts the person’s individual qualities.
Personal power can be analyzed as,

Expert power – who is capable of doing specialized tasks.
Information power – the holder has exclusive access to information.
Referent power – personal attractiveness of the leader.
11.3)Leadership Styles
The leaders must be an authoritative but at the same time more flexible and tolerant.
The leaders must be democratic as well, to have a very disciplined execution of the plan.
Leadership styles can be classified as,
Directive vs Permissive
Autocratic vs Democratic
Directive autocrat makes decisions alone
Permissive autocrat also makes decisions
Directive democrat makes decisions participative
Permissive democrat also makes decision participative
Lecture #30
12) Organizational Structures
Organizations are the foundations of software project management that rests on project management skills and techniques, software engineering processes and quality systems and measurement.
Definition
Organizations can be defined as groups of people who must coordinate their activities in order to meet the organizational objectives.
An organizational structure has a greater impact on the way a project is conducted.

12.1) Formal and Informal Structures
Formal structure is expressed in the organizational chart and it is concerned with authority.
An informal organizational structure can be represented as a web of relationships that typically crosses formal boundaries.
Hierarchical forms of organization shifts towards flatter, loosely structured team based models.
Authority will always flow from top to bottom through the structure.
Staff working in organization can be called as line workers who develop the end product and support staff who does the supporting staff role.
12.2) Departmentalization
Departmentalization of organizations depends on staff specialties, product lines, categories of customer .
The software development process approach is referred as either function-oriented or task-oriented.
Function oriented approach deals with different groups that are formed on their functional specialization.
Task oriented approach, members are grouped together with respect to a specific task.
Departmentalization is also based on life cycle phase.
Matrix form of departmentalization can also be formed where there are two managers namely project manager and programming manager.
Egoless programming.
12.3) Chief Programmer Teams
The chief programmer defines the specification , design, code, tests and documents the entire software.
The chief programmer can have a co-pilot who can assist in writing some code and discussions.
The editor –write up the documentation
Program clerk – maintains the actual code

Tester – validates the code
Disadvantage – overload with lots of information and cannot manage at some point of time.
Extreme programming concept can overcome this disadvantage.
Lecture #31
13) Stress
Every project will have obstacles and it has to overcome those obstacles by achieving the objectives.
Handling pressure in work spot must be healthy and it should not lead to health hazards.
Productivity and the quality of output decreases when people work for more than 40 hours a week.
Good planning and control of project management can help reduce unexpected problems generating unnecessary crises.
Stress is usually caused by role ambiguity when the staff does not know what they are supposed to do or what their role in the development process.
Role conflict can increase stress where the person demands two different roles.
14) Health and Safety
The two important factors that are more prominent in construction and other heavy engineering projects are health and safety.
A project manager must be aware of the safety policy document that applies to the environment in which the product is developed.
Safety policy document must be maintained by the manager to meet the safety objectives such as the reliability of the completed application or the overall cost of the project.
Responsibility of safety issues must be clearly defined at different levels and includes,
Top management must abide by the safety policy
Delegation of responsibilities for safety must be clear and must be agreed upon.
Job descriptions should include duties related to safety.

Deployment of a safety officer and the support of experts in technical areas.
Consultation of safety.
Adequate budget for the safety costs.
Safety procedures must be known to the employees and necessary training must be given wherever needed.
Lecture #32
Software Reliability :- is the probability of failure-free software operation for a specified period of time in a specified environment.
- Software Reliability is also an important factor affecting system reliability. - It differs from hardware reliability in that it reflects the design perfection, rather than
manufacturing perfection.- Software Reliability is an useful measure in planning and controlling the resources during
the development process so that high quality software can be developed. - Planning and controlling the testing resources via Software Reliability Measures can be
done by balancing the additional cost of testing and the corresponding improvements in Software Reliability.
- It is also a useful measure for giving the user confidence about software correctness.
Software failure mechanisms
Software failures may be due to errors, ambiguities, oversights or misinterpretation of the specification that the software is supposed to satisfy, carelessness or incompetence in writing code, inadequate testing, incorrect or unexpected usage of the software or other unforeseen problems. While it is tempting to draw an analogy between Software Reliability and Hardware Reliability, software and hardware have basic differences that make them different in failure mechanisms. Hardware faults are mostly physical faults, while software faults are design faults, which are harder to visualize, classify, detect, and correct. Design faults are closely related to fuzzy human factors and the design process, which we don't have a solid understanding. In hardware, design faults may also exist, but physical faults usually dominate. In software, we can hardly find a strict corresponding counterpart for "manufacturing" as hardware manufacturing process, if the simple action of uploading software modules into place does not count. Therefore, the quality of software will not change once it is uploaded into the storage and start running. Trying to achieve higher reliability by simply duplicating the same software modules will not work, because design faults cannot be masked off by voting.
A partial list of the distinct characteristics of software compared to hardware is listed below :
Failure cause: Software defects are mainly design defects. Wear-out: Software does not have energy related wear-out phase. Errors can occur
without warning. Repairable system concept: Periodic restarts can help fix software problems.

Time dependency and life cycle: Software reliability is not a function of operational time.
Environmental factors: Do not affect Software reliability, except it might affect program inputs.
Reliability prediction: Software reliability can not be predicted from any physical basis, since it depends completely on human factors in design.
Redundancy: Can not improve Software reliability if identical software components are used.
Interfaces: Software interfaces are purely conceptual other than visual. Failure rate motivators: Usually not predictable from analyses of separate statements. Built with standard components: Well-understood and extensively-tested standard parts
will help improve maintainability and reliability. But in software industry, we have not observed this trend. Code reuse has been around for some time, but to a very limited extent. Strictly speaking there are no standard parts for software, except some standardized logic structures.
The bathtub curve for Software Reliability
Software reliability, however, does not show the same characteristics similar as hardware. A possible curve is shown in Figure 2 if we projected software reliability on the same axes.
There are two major differences between hardware and software curves. One difference is that in the last phase, software does not have an increasing failure rate as hardware does. In this phase, software is approaching obsolescence; there are no motivation for any upgrades or changes to the software. Therefore, the failure rate will not change. The second difference is that in the useful-life phase, software will experience a drastic increase in failure rate each time an upgrade is made. The failure rate levels off gradually, partly because of the defects found and fixed after the upgrades.
SOFTWARE QUALITY
Quality is defined as “How well the project performs as we have planned” Quality is concerned at various stages of planning and execution
SOFTWARE QUALITY MEASURES:
Reliability

Maintainability Extendibility
SOFTWARE QUALITY MANAGEMENT SYSTEM:
– Quality Assurance• Through this process an org. establishes procedures and standards that
lead to the development of high quality software– Quality Planning
• Involves selection of appropriate procedures and standards for a project that will deliver quality software
• Sets the direction for the quality process- without clear spec. regarding desired quality of the product
– Quality Control
Ensures that selected procedures are followed throughput the project
MEASURING SOFTWARE QUALITY:
The first step towards measurement is to identify software metrics Metrics is defined as ‘a quantitative measure of the degree to which a system, component
or processes a given attribute’ –i.e., It involves collection of data over a period of time that gives a measure of performance
Three reasons for which you need to measure a software system:
To determine the quality of the product and development process in relation to expected standards.
To predict the qualities that the product will exhibit in future in relation to expected standards
To improve the quality of the product and the process that produced it
Lecture #33
Testing
Quality
Quality means “conformance to requirements”
The best testers can only catch defects that are contrary to specification.
Testing does not make the software perfect.
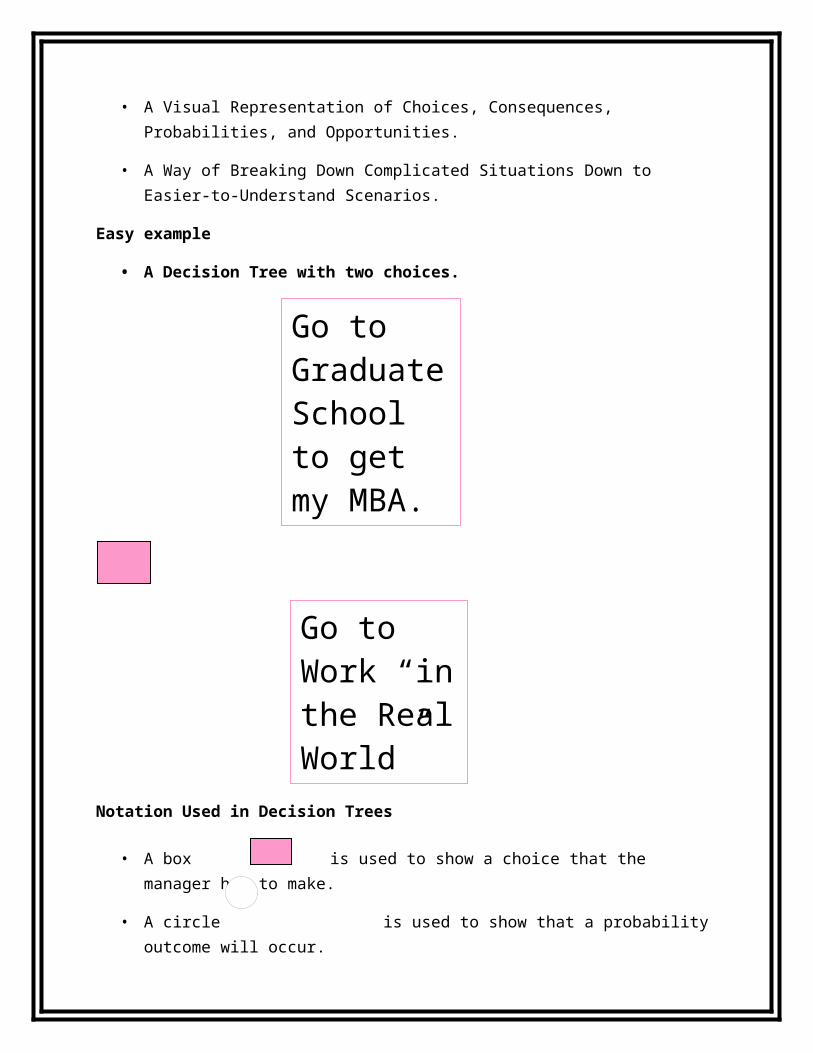
If an organization does not have good requirements engineering practices then it will be very hard to deliver software that fills the users’ needs, because the product team does not really know what those needs are.
Test Plans
The goal of test planning is to establish the list of tasks which, if performed, will identify all of the requirements that have not been met in the software. The main work product is the test plan.
The test plan documents the overall approach to the test. In many ways, the test plan serves as a summary of the test activities that will be performed.
It shows how the tests will be organized, and outlines all of the testers’ needs which must be met in order to properly carry out the test.
The test plan should be inspected by members of the engineering team and senior managers.
Test Cases
A test case is a description of a specific interaction that a tester will have in order to test a single behavior of the software. Test cases are very similar to use cases, in that they are step-by-step narratives which define a specific interaction between the user and the software.
A typical test case is laid out in a table, and includes:
• A unique name and number
• A requirement which this test case is exercising
• Preconditions which describe the state of the software before the test case (which is often a previous test case that must always be run before the current test case)
• Steps that describe the specific steps which make up the interaction
• Expected Results which describe the expected state of the software after the test case is executed
Test cases must be repeatable.
Good test cases are data-specific, and describe each interaction necessary to repeat the test exactly.
Test Execution
programmers deliver the alpha build, or a build that they feel is feature complete.

The alpha should be of high quality—the programmers should feel that it is ready for release, and as good as they can get it.
There are typically several iterations of test execution.
The first iteration focuses on new functionality that has been added since the last round of testing.
A regression test is a test designed to make sure that a change to one area of the software has not caused any other part of the software which had previously passed its tests to stop working.
Regression testing usually involves executing all test cases which have previously been executed.
There are typically at least two regression tests for any software project.
Defect Tracking
The defect tracking system is a program that testers use to record and track defects. It routes each defect between testers, developers, the project manager and others, following a workflow designed to ensure that the defect is verified and repaired.
Every defect encountered in the test run is recorded and entered into a defect tracking system so that it can be prioritized.
The defect workflow should track the interaction between the testers who find the defect and the programmers who fix it. It should ensure that every defect can be properly prioritized and reviewed by all of the stakeholders to determine whether or not it should be repaired. This process of review and prioritization referred to as triage.
Smoke Tests
A smoke test is a subset of the test cases that is typically representative of the overall test plan.
Smoke tests are good for verifying proper deployment or other non invasive changes.
They are also useful for verifying a build is ready to send to test.
Smoke tests are not substitute for actual functional testing.
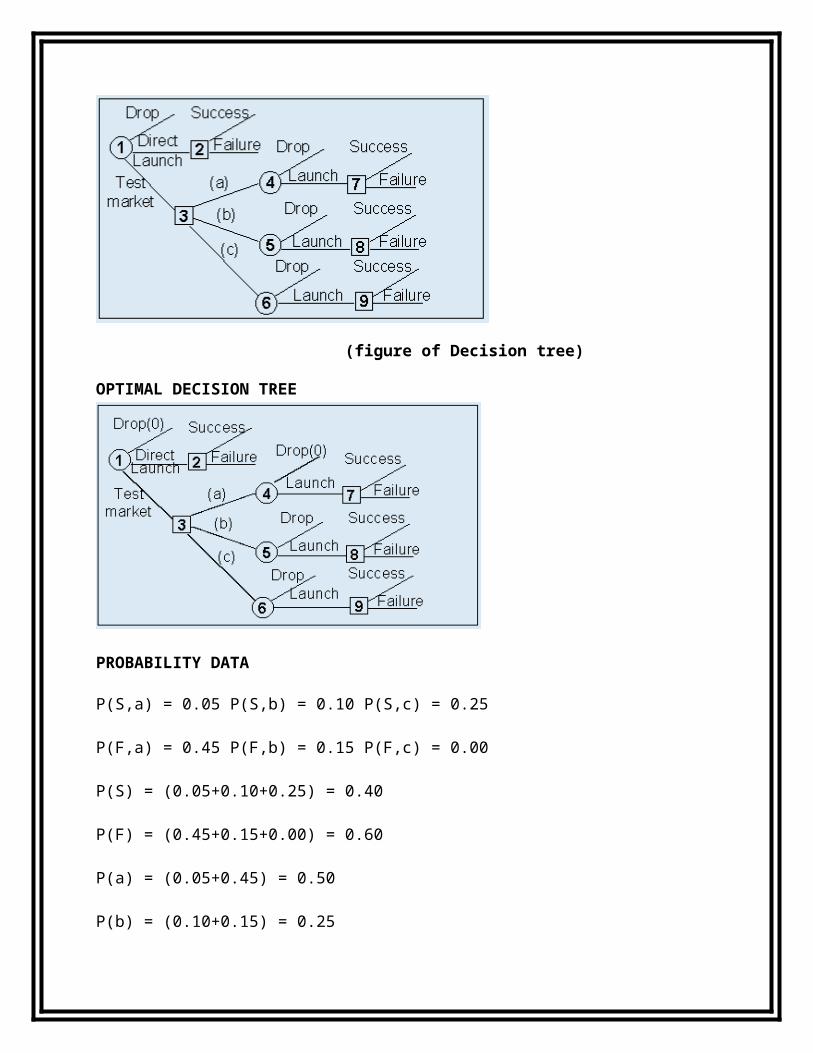
Lecture #34
Test Automation
Test automation is a practice in which testers employ a software tool to reduce or eliminate repetitive tasks.
Testers either write scripts or use record-and-playback to capture user interactions with the software being tested.
This can save the testers a lot of time if many iterations of testing will be required.
It costs a lot to develop and maintain automated test suites, so it is generally not worth developing them for tests that will executed only a few times
Postmortem Reports
The postmortem report is an overall account of the team’s experience in building the software, and of the experience of the users and stakeholders in working with the team.
The report should contain an honest assessment of how the team members, users, and stakeholders perceived the end product, and assessed the decisions made throughout the project.
The purpose of the post-mortem report is to highlight the team’s successes and identify any problems which should be fixed in future releases.
What is Software Test Automation?Software test automation refers to the activities and efforts that intend to automate
engineering tasks and operations in a software test process using well-defined strategies and systematic solutions.
The major objectives of software test automation:- To free engineers from tedious and redundant manual testing operations
- To speed up a software testing process, and to reduce software testing cost and time during a software life cycle
- To increase the quality and effectiveness of a software test process by achieving pre-defined adequate test criteria in a limited schedule
The major key to the success of software automation

--> to reduce manual testing activities and redundant test operations using a systematic solution to achieve a better testing coverage.
Software test automation activities could be performed in three different scopes:
- Enterprise-oriented test automation, where the major focus of test automation efforts is to automate an enterprise-oriented test process so that it could be used and reused to support different product lines and projects in an organization.
- Product-oriented test automation, where test automation activities are performed to focus on a specific software product line to support its related testing activities.
- Project-oriented test automation, where test automation effort is aimed at a specific project and its test process.
Different Maturity Levels of Software Test Automation
Level 1: Initial
– A software test process at this level provides engineers with systematic solutions and tools to create, update, and manage all types of software test information, including test requirements, test cases, test data, test procedures, test results, test scripts, and problem reports. No systematic solutions and tools are available to support engineers test design, test generation, and test executions.
Level 2: Repeatable
– A software test process at this level not only provides engineers with tools to manage diverse software testing information, but also provides systematic solutions to execute software tests in a systematic manner. These solutions allow engineers to use a systematic approach to run tests and validate test results. However, no systematic solutions and tools are available to assist test engineers in test design, test generation, and test coverage measurement.
Level 3: Automatic
– Besides the test management and test execution tools, a software test process at this level is supported with additional solutions to generate software tests using systematic methods. They could be useful to generate black box or white-box software tests. However, no systematic solutions are available to measure the test coverage of a test process.
Level 4: Optimal
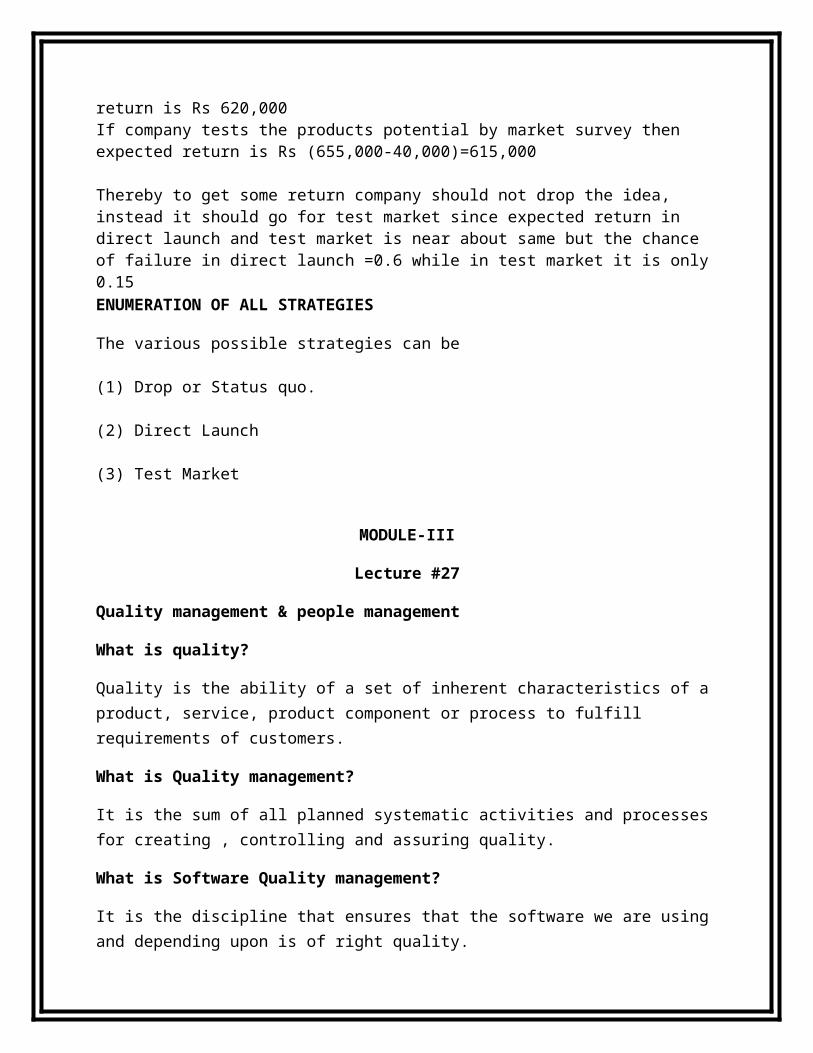
– This is an optimal level of test automation. At this level, systematic solutions are available to manage test information, execute tests, and generate tests, and measure test coverage. The primary benefit of achieving this level is to help engineers understand the current coverage of a test process, and identify the test coverage issues.
Lecture #35
Essential Needs of Software Test Automation
A dedicated work force for test automation
The commitment from senior managers and engineers
The dedicated budget and project schedule
A well-defined plan and strategy
Talent engineers and cost-effective testing tools
Maintenance of automated software tests and tools
Basic Issues of Software Test Automation
Poor manually performed software test process
Late engagement of software test automation in a software product life cycle
Unrealistic goals and unreasonable expectations
Organization issues
Lack of good understanding and experience of software test automation
Essential Benefits of Software Test Automation
There are a number of essential benefits from test automation.
They are listed below.
Reduce manual software testing operations and eliminate redundant testing efforts.
Produce more systematic repeatable software tests, and generate more consistent testing results.

Execute much more software tests and achieve a better testing coverage in a very limited schedule.
A Software Test Automation Process
Plan Software Test Automation
Design Test Automation Strategies & Solutions Select and Evaluate Available Software Testing Tools
Develop & Implement Test Automation Solutions
Introduce and Deploy Test Automation Solutions
Review and Evaluate Software Test Automation
A Software Test Automation Process
The process consists of the following steps:
Step #1: Test automation planning
– This is the initial step in software test automation. The major task here is to come out a plan that specifies the identified test automation focuses, objectives, strategies, requirements, schedule and budget.
Step #2: Test automation design
– The primary objective of this step is to draw out the detailed test automation solutions to achieve the major objectives and meet the given requirements in a test automation plan.
Step #3: Test tool development
– At this step, the designed test automation solutions are developed and tested as quality tools and facilities. The key in this step is to make sure that the developed tools are reliable and reusable with good documentation.
The other steps in a test automation process:
Step #4: Test tool deployment
– Similar to commercial tools, the developed test tools and facilities must be introduced and deployed into a project or onto a product line. At this step, basic user training is essential, and proper user support is necessary.
Step #5: Review and evaluation
– Whenever a new tool is deployed, a review should be conducted to identify its issues and limitations, and evaluate its provided features. The review results will provide valuable feedback to the test automation group for further improvements and enhancements.
Lecture #36
Overview of project management tools