SPM Thresholds: Imputing Subsidies to the Consumer ... · 1 — U.S. BUREAU OF LABOR STATISTICS •...
27
1 — U.S. BUREAU OF LABOR STATISTICS • bls.gov SPM Thresholds: Imputing Subsidies to the Consumer Expenditure Survey for Poverty Measurement Thesia I. Garner (co-authored with Marisa Gudrais) May 13, 2016 Society of Government Economists Annual Conference Session 3.B. Measuring Economic Well-being and Poverty in the United States: The Supplemental Poverty Measure (SPM) Bureau of Labor Statistics Washington, DC Not to be quoted without authors’ permission Discussant: Patricia Ruggles
Transcript of SPM Thresholds: Imputing Subsidies to the Consumer ... · 1 — U.S. BUREAU OF LABOR STATISTICS •...
1 — U.S. BUREAU OF LABOR STATISTICS • bls.gov
SPM Thresholds: Imputing Subsidies to the Consumer Expenditure Survey for Poverty
Measurement
Thesia I. Garner(co-authored with Marisa Gudrais)
May 13, 2016
Society of Government Economists Annual ConferenceSession 3.B. Measuring Economic Well-being and Poverty in the United States:
The Supplemental Poverty Measure (SPM)
Bureau of Labor StatisticsWashington, DC
Not to be quoted without authors’ permission Discussant: Patricia Ruggles
2 — U.S. BUREAU OF LABOR STATISTICS • bls.gov2 — U.S. BUREAU OF LABOR STATISTICS • bls.gov
Disclaimer
This presentation reports the results of research and analysis undertaken by researchers within the Bureau of Labor Statistics (BLS).
Any views expressed are those of the authors and not necessarily those of the BLS.
Results are preliminary and not to be quoted without authors’ permission.

3 — U.S. BUREAU OF LABOR STATISTICS • bls.gov3 — U.S. BUREAU OF LABOR STATISTICS • bls.gov
All Poverty Measures
Not Poor
Poor
Resources
Resources
Threshold

4 — U.S. BUREAU OF LABOR STATISTICS • bls.gov4 — U.S. BUREAU OF LABOR STATISTICS • bls.gov
This Research Purpose
Justification to add in-kind benefits to out-of-pocket spending data upon which Supplemental Poverty Measure (SPM) Thresholds are based
Impute benefits, at the micro-level & examine inclusion on all “expenditures” Produce SPM thresholds that include the value of in-kind benefits
Contribution Improved SPM that is consistently defined in terms of thresholds and resources Improved SPM thresholds that more nearly reflect consumption of basic
bundle
NOTE: Thus far, SPM thresholds used by the Census Bureau for the regular publication of SPM poverty statistics DO NOT account for in-kind subsidies.
5 — U.S. BUREAU OF LABOR STATISTICS • bls.gov5 — U.S. BUREAU OF LABOR STATISTICS • bls.gov
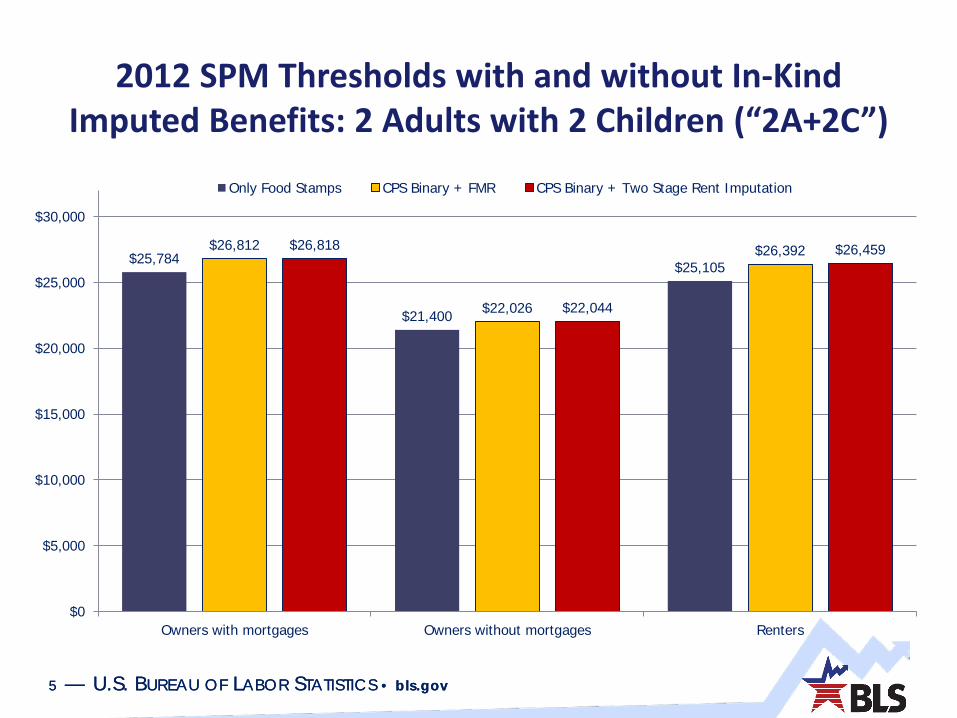
2012 SPM Thresholds with and without In-Kind Imputed Benefits: 2 Adults with 2 Children (“2A+2C”)
$25,784
$21,400
$25,105
$26,812
$22,026
$26,392$26,818
$22,044
$26,459
$0
$5,000
$10,000
$15,000
$20,000
$25,000
$30,000
Owners with mortgages Owners without mortgages Renters
Only Food Stamps CPS Binary + FMR CPS Binary + Two Stage Rent Imputation
6 — U.S. BUREAU OF LABOR STATISTICS • bls.gov6 — U.S. BUREAU OF LABOR STATISTICS • bls.gov
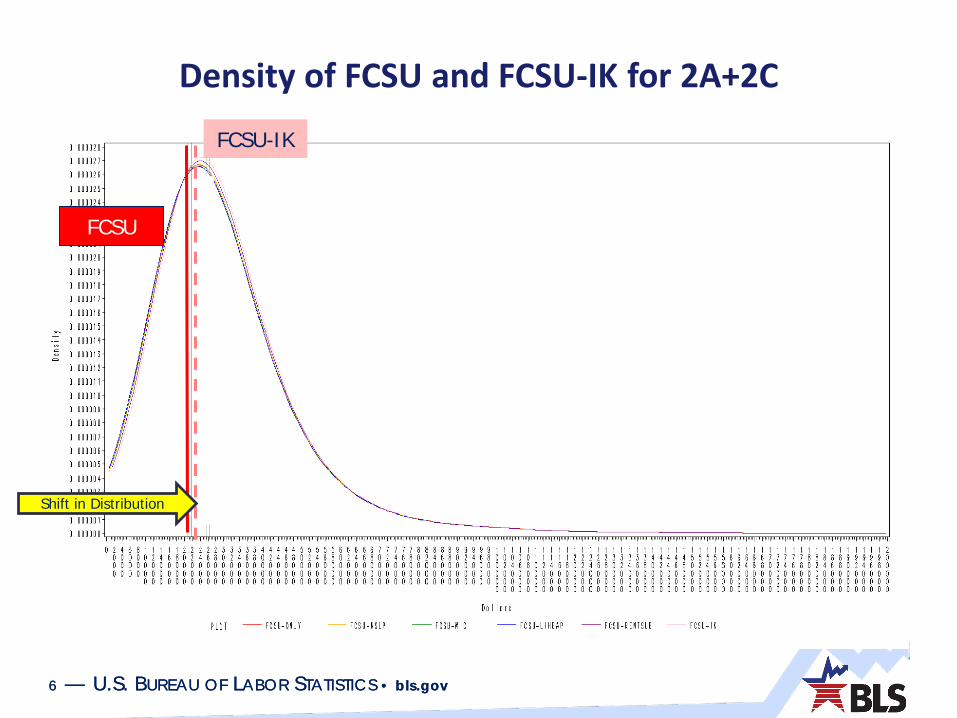
Density of FCSU and FCSU-IK for 2A+2C
FCSU-IK
FCSU
Shift in Distribution
7 — U.S. BUREAU OF LABOR STATISTICS • bls.gov7 — U.S. BUREAU OF LABOR STATISTICS • bls.gov
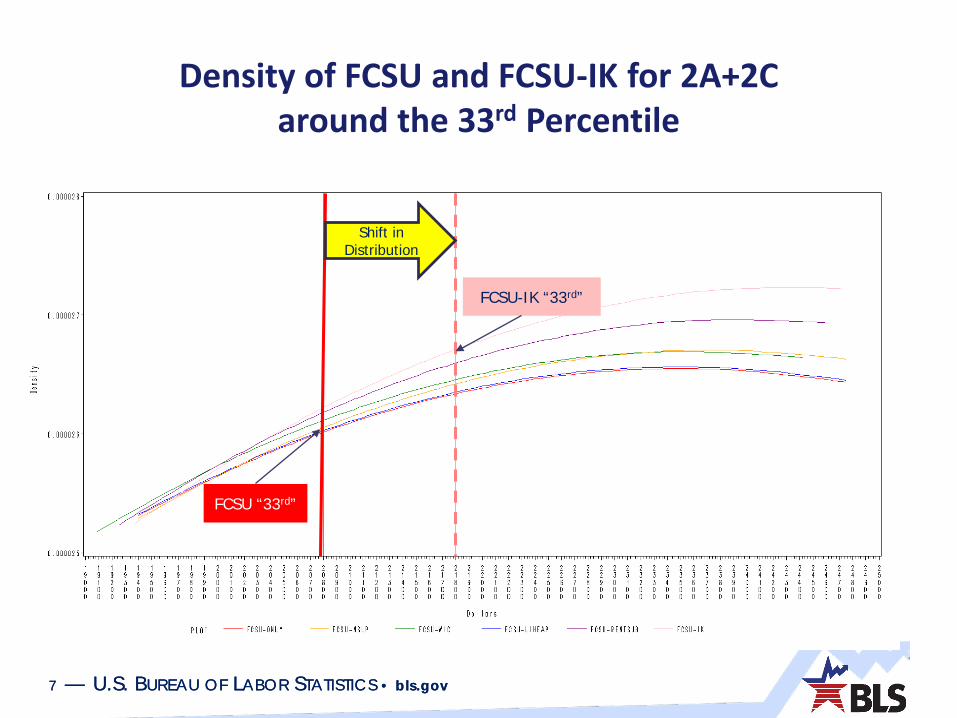
Density of FCSU and FCSU-IK for 2A+2C around the 33rd Percentile
FCSU “33rd”
FCSU-IK “33rd”
Shift in Distribution

8 — U.S. BUREAU OF LABOR STATISTICS • bls.gov8 — U.S. BUREAU OF LABOR STATISTICS • bls.gov
NAS Justification Effectiveness of benefit programs on poverty measurement
Thresholds and resources consistently defined with each other
“…proposed thresholds, although developed in somewhat different ways, reflect concept of budget for consumption needs” (NAS Report, 1995, pp. 66-67)
“Hence, … resources should add to money income the value of near-money in-kind benefits that are intended to support consumption” (pp. 67)
9 — U.S. BUREAU OF LABOR STATISTICS • bls.gov9 — U.S. BUREAU OF LABOR STATISTICS • bls.gov
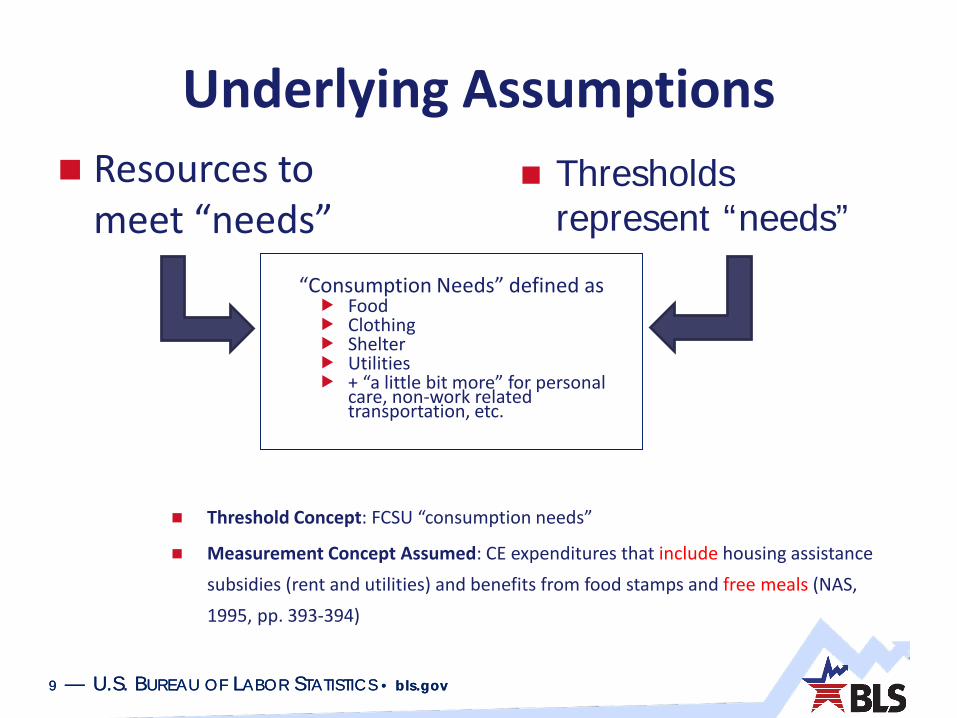
Underlying Assumptions Resources to
meet “needs” Thresholds
represent “needs”
“Consumption Needs” defined as Food Clothing Shelter Utilities + “a little bit more” for personal
care, non-work related transportation, etc.
Threshold Concept: FCSU “consumption needs”
Measurement Concept Assumed: CE expenditures that include housing assistance subsidies (rent and utilities) and benefits from food stamps and free meals (NAS, 1995, pp. 393-394)

10 — U.S. BUREAU OF LABOR STATISTICS • bls.gov10 — U.S. BUREAU OF LABOR STATISTICS • bls.gov
NAS Proposal and Measurement Assumption: Consistency
Resources
Other Food Subsidies
Expenditures for FCSU (includng
SNAP)
Expenditures for FCSU (includng
SNAP)
Other Food Subsidies
With SNAP In-Kind Benefits
Cash income
Housing & Energy Subsidies
Thresholds
FCSU+”little bit more” Consumption=
CE “Expenditures” (that include: housing assistance subsidies,
benefits for food stamps and free meals)
Consistent

11 — U.S. BUREAU OF LABOR STATISTICS • bls.gov11 — U.S. BUREAU OF LABOR STATISTICS • bls.gov
Missing Data Problem: Thresholds and Resources Inconsistently Defined Currently
published SPM
Resources
Expenditures for FCSU (includng
SNAP)
CE OOP Expenditures for FCSU (includng
SNAP)
Other Food Subsidies
With SNAP In-Kind Benefits
Cash income
Housing & Energy Subsidies
Thresholds
Consistent
12 — U.S. BUREAU OF LABOR STATISTICS • bls.gov12 — U.S. BUREAU OF LABOR STATISTICS • bls.gov
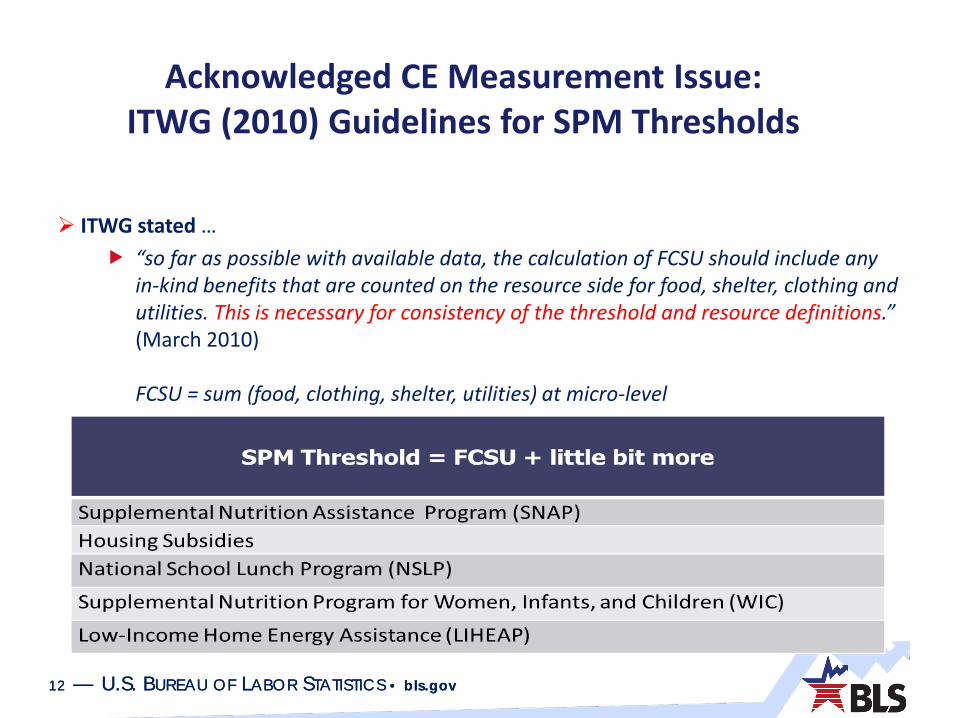
Acknowledged CE Measurement Issue: ITWG (2010) Guidelines for SPM Thresholds
ITWG stated … “so far as possible with available data, the calculation of FCSU should include any
in-kind benefits that are counted on the resource side for food, shelter, clothing and utilities. This is necessary for consistency of the threshold and resource definitions.” (March 2010)
FCSU = sum (food, clothing, shelter, utilities) at micro-level
SPM Threshold = FCSU + little bit more

13 — U.S. BUREAU OF LABOR STATISTICS • bls.gov13 — U.S. BUREAU OF LABOR STATISTICS • bls.gov
Problem: Thresholds and Resources Consistently Defined
Resources
Housing & Energy Subsidies
Other Food Subsidies
Expenditures for FCSU (includng
SNAP)
CE OOP Expenditures for FCSU (includng
SNAP)
Other Food Subsidies
With SNAP In-Kind Benefits
Cash income
Housing & Energy Subsidies
Thresholds
Proposed
Consistent
Consistent
14 — U.S. BUREAU OF LABOR STATISTICS • bls.gov14 — U.S. BUREAU OF LABOR STATISTICS • bls.gov
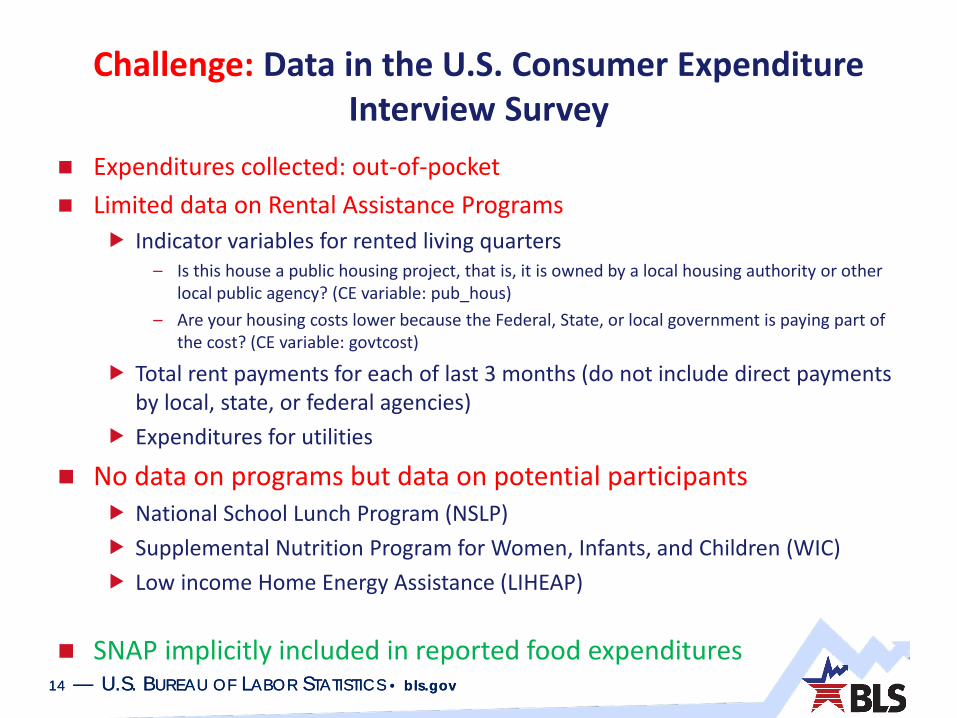
Challenge: Data in the U.S. Consumer Expenditure Interview Survey
Expenditures collected: out-of-pocket Limited data on Rental Assistance Programs
Indicator variables for rented living quarters– Is this house a public housing project, that is, it is owned by a local housing authority or other
local public agency? (CE variable: pub_hous)– Are your housing costs lower because the Federal, State, or local government is paying part of
the cost? (CE variable: govtcost)
Total rent payments for each of last 3 months (do not include direct payments by local, state, or federal agencies)
Expenditures for utilities
No data on programs but data on potential participants National School Lunch Program (NSLP) Supplemental Nutrition Program for Women, Infants, and Children (WIC) Low income Home Energy Assistance (LIHEAP)
SNAP implicitly included in reported food expenditures

15 — U.S. BUREAU OF LABOR STATISTICS • bls.gov15 — U.S. BUREAU OF LABOR STATISTICS • bls.gov
Expenditures, In-Kind Benefits, and Resources
Benefit Form of Benefit
Value of Commodity or Service in CE
Reported Expenditures?
Commodity or Service Value in Thresholds
In Resources
SNAP EBT cash-value to CUyes, as food
expenditures=full value
OOP cash value
Housing Subsidies
Landlord accepts voucher or CU lives in public housing < full value OOP+imputed
benefitimputedbenefit
NSLP Direct payment to school < full value OOP+imputed benefit
imputedbenefit
WIC Voucher paper or EBT for commodities to CU
< full value OOP+imputed benefit
imputedbenefit
LIHEAP Direct payment to vendor < full value OOP+imputed benefit
imputedbenefit
EBT: Electronic benefit transfersFull value could be at recipient or market value

16 — U.S. BUREAU OF LABOR STATISTICS • bls.gov16 — U.S. BUREAU OF LABOR STATISTICS • bls.gov
Imputation Approaches
CPS Binary + FMRs ASEC public use data to impute 0,1 program participation HUD Fair Market Rents (FMR)
CPS Binary + CE imputed rents ASEC public use data to impute 0, 1 program participation Imputed rents using internal CE data: 2-stage rent model
Regression-based program participation Benefit values assigned to participants based on
administrative data excluding CE-based imputed rents

17 — U.S. BUREAU OF LABOR STATISTICS • bls.gov17 — U.S. BUREAU OF LABOR STATISTICS • bls.gov
Imputations: Survey Data U.S. Consumer Expenditure Survey Interview
Consumer unit (CU) level data CU and member characteristics Quarterly data collected 2008Q2 – 2013Q1 Rents for unsubsidized, non-rent controlled units + rental unit characterisics
U.S. Current Population Survey Annual Social and Economic Supplement (CPS ASEC) public use data accessed from NBER Household level data Household and member characteristics Same years as in CE: collected 2009-2013 refers to 2008-2012 NSLP, WIC, and LIHEAP reported program participation

18 — U.S. BUREAU OF LABOR STATISTICS • bls.gov18 — U.S. BUREAU OF LABOR STATISTICS • bls.gov
Imputations: Benefits Data NSLP: U.S. Department of Agriculture for 2008-2012
Average per school lunch payment rates– Over 48 contiguous states plus Hawaii and Alaska– Rates for schools in which less than 60% of lunches served were free or reduced priced for all but
District of Columbia Louisiana, Mississippi, and New Mexico (60% + with free or reduced, USDEd)
Different values (same values for commodities)– Free– Reduced– Student paid full price for lunch (but also subsidized by USDA)
WIC: U.S. Department of Agriculture for 2008-2012 Average national monthly values per person
LIHEAP: U.S. Department of Health and Human Services for 2009 Average annual benefit levels per household per state adjusted by CPI Benefits
– Heating– Cooling (not all states offer this benefit)
Subsidized rents U.S. Department of Housing and Urban Development 2008-2012 Fair Market Rents
(FMRs) matched to CE by Census tract and number of bedrooms Imputed from CE renters not in rent controlled units, not public housing, not rental
assistance

19 — U.S. BUREAU OF LABOR STATISTICS • bls.gov19 — U.S. BUREAU OF LABOR STATISTICS • bls.gov
All Consumer Units in 5 years of CE data underlying 2012 SPM thresholds Add in-kind benefits to FCSU out-of-pocket expenditures at CU (micro) level Convert all quarterly expenditures to annual $2012
Resticted to SPM Thresholds Esstimation Sample Apply 3-parameter equivalence scale to convert estimation sample (CUs with
2 chidlren) FCSU to 2A+2CRank FCSU+ to identify 33rd percentile represented by 30th to 36th percentile range
Produce means of FCSU+ and SU by housing status Estimate thresholds for
– Owners with mortgages – Owners without mortgages– Renters
FCSU-IK Estimation
20 — U.S. BUREAU OF LABOR STATISTICS • bls.gov20 — U.S. BUREAU OF LABOR STATISTICS • bls.gov
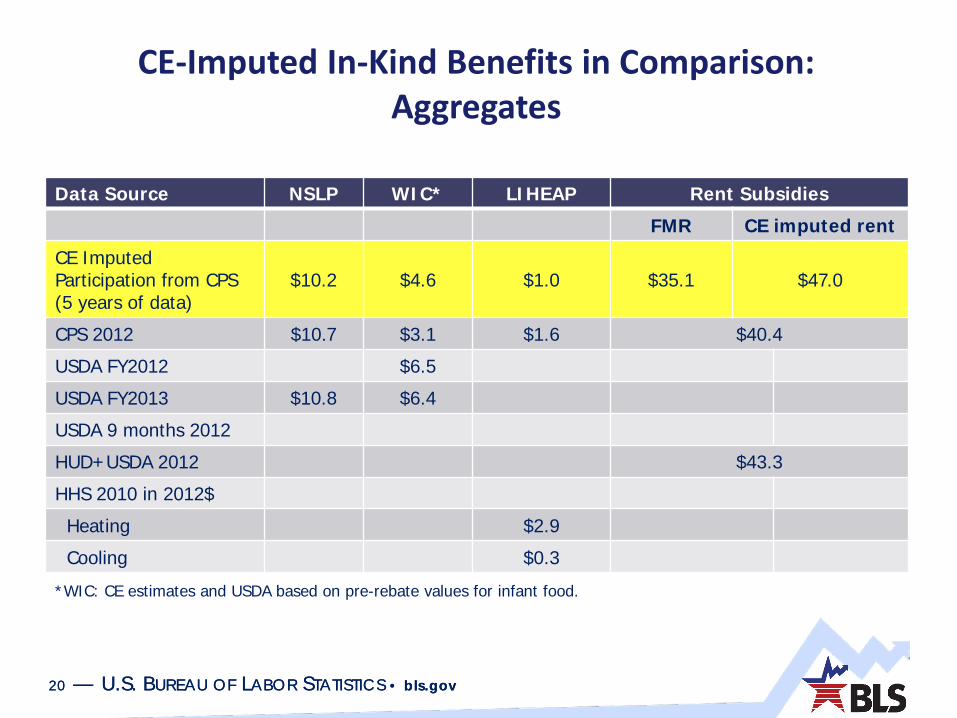
CE-Imputed In-Kind Benefits in Comparison: Aggregates
Data Source NSLP WIC* LIHEAP Rent Subsidies
FMR CE imputed rent
CE Imputed Participation from CPS (5 years of data)
$10.2 $4.6 $1.0 $35.1 $47.0
CPS 2012 $10.7 $3.1 $1.6 $40.4
USDA FY2012 $6.5
USDA FY2013 $10.8 $6.4
USDA 9 months 2012
HUD+USDA 2012 $43.3
HHS 2010 in 2012$
Heating $2.9
Cooling $0.3
*WIC: CE estimates and USDA based on pre-rebate values for infant food.

21 — U.S. BUREAU OF LABOR STATISTICS • bls.gov21 — U.S. BUREAU OF LABOR STATISTICS • bls.gov
CE-Imputed In-Kind Benefits in Comparison: CU/HH Participation
Data Source NSLP WIC* LIHEAP Rent Subsidies
FMR CE imputed rent
CE Imputed Participation from CPS (5 years of data)
19.0% 2.8% 2.2% 4.2% 4.5%
CPS 2012 17.5% 2.8% 3.3% 4.0%
HHS 2010 in 2012$
Heating 6.3%
Cooling 0.8%
*WIC: CE estimates based on pre-rebate values for infant food.

22 — U.S. BUREAU OF LABOR STATISTICS • bls.gov22 — U.S. BUREAU OF LABOR STATISTICS • bls.gov
CE-Imputed In-Kind Benefits in Comparison: Annual Average Benefit per CU/HH
Data Source NSLP WIC* LIHEAP Rent Subsidies
FMR CE imputed rent
CE Imputed Participation from CPS (5 years of data)
$441 $1,334 $367 $6,926 $8,591
CPS 2012 $478 $861 $383 $7,675
HHS 2010 in 2012$
Heating $391
Cooling $293
*WIC: CE estimates based on pre-rebate values for infant food.

23 — U.S. BUREAU OF LABOR STATISTICS • bls.gov23 — U.S. BUREAU OF LABOR STATISTICS • bls.gov
Percent of 2012 Aggregate Dollars Using 5 Years of CE Data
Food Only, 30.9% Food Only, 34.2%
Clothing, 4.9%Clothing, 4.9%
Shelter & Utilities Only, 62.0%
Shelter & Utilities Only, 56.5%
0.0%
10.0%
20.0%
30.0%
40.0%
50.0%
60.0%
70.0%
80.0%
90.0%
100.0%
All CUs CUs in 30-36% of +2C
IK=2.2% IK=4.4%
for SPM Thresholds
Aggregates based on CE imputed rent subsidies

24 — U.S. BUREAU OF LABOR STATISTICS • bls.gov24 — U.S. BUREAU OF LABOR STATISTICS • bls.gov
Aggregate Shares of In-kind Benefits
NSLP Free6% NSLP Reduced
7%NSLP Paid
3%WIC Children
4%WIC Infants
2%
WIC Pregnant1%
LIHEAP2%Rent Subsidy
75%
NSLP Free12%
NSLP Reduced12%
NSLP Paid5%
WIC Children10%
WIC Infants…
WIC Pregnant1%
LIHEAP2%
Rent Subsidy55%
All Cus: IK=2.2% of AggregateCUs in 30-36th Percentile “2+2”:
4.4% of Aggregate
Aggregates based on CE imputed rent subsidies

25 — U.S. BUREAU OF LABOR STATISTICS • bls.gov
Distribution of CUs with IK Benefits
25
All CUs
CUs with 2 childrenin 30-36th
0%
5%
10%
15%
20%
25%
30%
35%
40%
45%
Owners with Mortages Owners without Mortages Renters
0%5%
10%15%20%25%30%35%40%45%
Owners with Mortages Owners without Mortages Renters
NSLP Free NSLP Reduced NSLP Paid WIC Children WIC Infants WIC Pregnant LIHEAP Rent Subsidy
26 — U.S. BUREAU OF LABOR STATISTICS • bls.gov26 — U.S. BUREAU OF LABOR STATISTICS • bls.gov
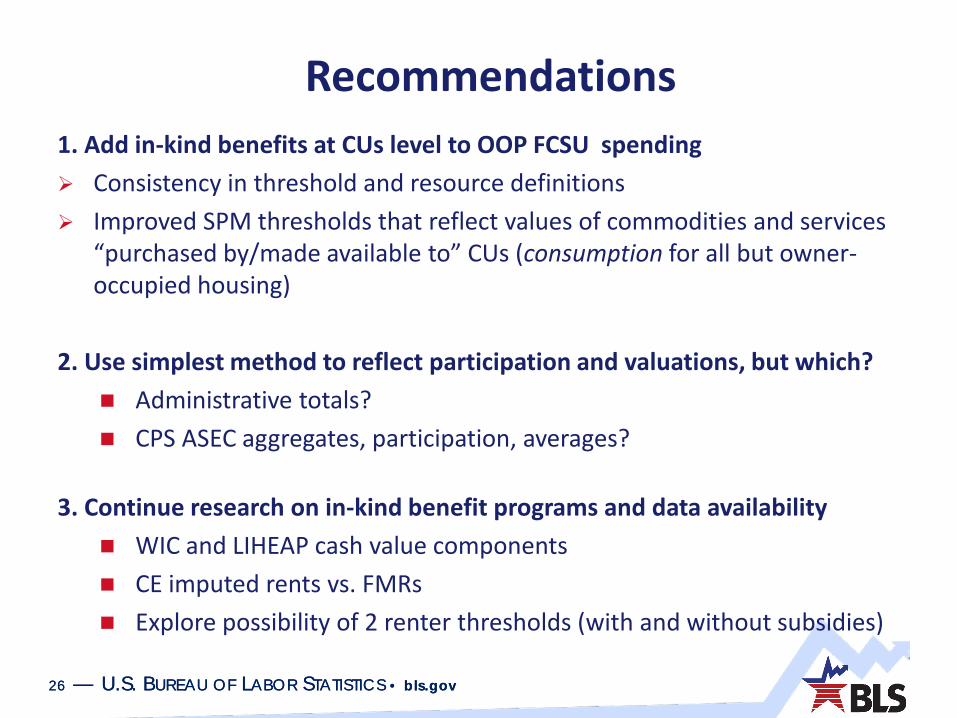
Recommendations1. Add in-kind benefits at CUs level to OOP FCSU spending Consistency in threshold and resource definitions Improved SPM thresholds that reflect values of commodities and services
“purchased by/made available to” CUs (consumption for all but owner-occupied housing)
2. Use simplest method to reflect participation and valuations, but which? Administrative totals? CPS ASEC aggregates, participation, averages?
3. Continue research on in-kind benefit programs and data availability WIC and LIHEAP cash value components CE imputed rents vs. FMRs Explore possibility of 2 renter thresholds (with and without subsidies)

Contact Information
27 — U.S. BUREAU OF LABOR STATISTICS • bls.gov
Thesia I. Garner
Supervisory Research EconomistDivision of Price and Index Number Research/
Office of Prices and Living Conditionshttp://stats.bls.gov/pir/spmhome.htm