SPM Summary for Policymakers - archive.ipcc.ch · 14 change involves an iterative risk management...
26
Do Not Cite, Quote or Distribute Working Group III – Mitigation of Climate Change SPM Summary for Policymakers
Transcript of SPM Summary for Policymakers - archive.ipcc.ch · 14 change involves an iterative risk management...

Do Not Cite, Quote or Distribute
Working Group III – Mitigation of Climate Change
SPM
Summary for Policymakers

Second Order Draft (SOD) IPCC WG III AR5
Do Not Cite, Quote or Distribute 1 of 25 Summary for Policymakers
Title: Summary for Policymakers
Author(s): Shardul Agrawala, Igor Bashmakov, Gabriel Blanco, Thomas Bruckner, Steffen Brunner, Mercedes Bustamante, Leon Clarke, Felix Creutzig, Shobhakar Dhakal, Patrick Eickemeier, Ellie Farahani, Manfred Fischedick, Marc Fleurbaey, Reyer Gerlagh, Shreekant Gupta, Sujata Gupta, Jochen Harnisch, Kejun Jiang, Susanne Kadner, Sivan Kartha, Stephan Klasen, Charles Kolstad, Howard Kunreuther, Oswaldo Lucon, Jan Minx, Yacob Mulugetta, Joyashree Roy, Roberto Schaeffer, Steffen Schlömer, Karen Seto, Kristin Seyboth, Ralph Sims, Jim Skea, Pete Smith, Eswaran Somanathan, Robert Stavins, Thomas Sterner, Taishi Sugiyama, Sangwon Suh, Kevin Urama, Diana Ürge-Vorsatz, David Victor, Christoph von Stechow, Dadi Zhou, Ji Zou, Timm Zwickel
Remarks: Second Order Draft (SOD)
Version: 1
File name: AR5 WGIII SPM for SOD.docx
Date: 25 February 2013 Template Version: 9
1
2

Second Order Draft (SOD) IPCC WG III AR5
Do Not Cite, Quote or Distribute 2 of 25 Summary for Policymakers
Summary for Policymakers 1
Contents 2
3
SPM.1 Introduction ................................................................................................................................. 3 4
SPM.2 Emission trends and drivers......................................................................................................... 3 5
SPM.3 Long-term mitigation scenarios ................................................................................................... 8 6
SPM.4 Mitigation options by economic sector ..................................................................................... 14 7
SPM.4.1 Cross-sectoral strategies .................................................................................................... 14 8
SPM.4.2 Mitigation options in individual sectors ............................................................................. 16 9
SPM.4.2.1 Energy supply .............................................................................................................. 16 10
SPM.4.2.2 Energy end-use sectors ............................................................................................... 17 11
SPM.4.2.3 Agriculture, Forestry and Other Land-Use (AFOLU).................................................... 19 12
SPM.4.3 Co-benefits, risks & sustainable development ................................................................... 21 13
SPM.5 Institutional options by governance level ................................................................................. 21 14
SPM.5.1 Human decision-making ..................................................................................................... 21 15
SPM.5.2 International and regional cooperation ............................................................................. 22 16
SPM.5.3 National and sub-national policies ..................................................................................... 24 17
18
19

Second Order Draft (SOD) IPCC WG III AR5
Do Not Cite, Quote or Distribute 3 of 25 Summary for Policymakers
SPM.1 Introduction 1
The Working Group III contribution to the IPCC's Fifth Assessment Report (AR5) presents new 2 findings from the scientific literature on climate change mitigation since the publication of the 3 Fourth Assessment Report (AR4) in 2007. Where appropriate it draws upon insights from the Special 4 Report on Renewable Energy Sources and Climate Change Mitigation (SRREN), which was approved 5 during the IPCC’s fifth assessment cycle. 6
Working Group III of the IPCC is charged with assessing scientific research related to the mitigation 7 of climate change. “Mitigation” is any human intervention to reduce the sources or enhance the 8 sinks of greenhouse gases. Because mitigation lowers the likely effects of climate change as well as 9 the risks of extreme impacts, it is part of a broader policy strategy that includes adaptation to 10 climate impacts—a topic addressed in more detail by Working Group II. Governments acknowledged 11 this interdependence when approving the Synthesis Report of the AR4 and unanimously expressed 12 their view of making risk management a unifying perspective for the AR5: “Responding to climate 13 change involves an iterative risk management process that includes both mitigation and adaptation, 14 taking into account actual and avoided climate change damages, co-benefits, sustainability, equity 15 and attitudes to risk”, (IPCC 2007:64). It is thereby crucial to look at climate change within the larger 16 context of sustainable development. Managing the risks of climate change affects individual and 17 collective rights and values throughout the world and over long periods of time. The literature 18 assessed in AR5 thus emphasizes the ethics of climate policy as well as equity considerations in 19 considerably more detail than AR4. 20
This Summary for Policymakers (SPM) provides an overview of those main areas where the scientific 21 understanding has advanced since AR4 and refers to sections of the report [in square brackets] 22 where more detail can be found. It is structured as follows: Section 2 synthesizes findings on past 23 emission trends and drivers; Section 3 provides information on future mitigation scenarios that are 24 commensurate with a range of stabilization goals; Section 4 presents new findings on technologies, 25 processes, and practices that can be used in different economic sectors to mitigate climate change; 26 and Section 5 discusses institutional options that can be used at multiple governance levels to 27 encourage the adoption of mitigation technologies, processes and practices. Throughout the SPM, 28 the degree of certainty in key findings is expressed as qualitative levels of confidence or evidence and 29 agreement as described in the IPCC Guidance Note on the Consistent Treatment of Uncertainties. 30
SPM.2 Emission trends and drivers 31
Despite existing mitigation policies, including the UNFCCC and the Kyoto Protocol, GHG emissions 32 have grown more rapidly between 2000-2010 than in previous decades (high confidence). Since the 33 AR4 (2004 data), global anthropogenic greenhouse gas (GHG) emissions have continued to grow and 34 reached an all-time high of 50.1 Gt CO2eq in 2010 (Figure SPM.1). Since 1970 anthropogenic GHG 35 emissions have grown by more than 75%. Growth in the recent decade (2000-2010) has been faster 36 than in any decade since 1970, more than twice as fast than during the periods 1980-1990 and 1990-37 2000. GHG emission growth has continued to be driven by growth in CO2 emissions. In 2010, CO2 38 emissions exceeded 75% of the total of GHG emissions (weighted with 100-year Global Warming 39 Potentials). At current levels, every 12 years an amount of fossil-fuel related CO2 is emitted 40 comparable to the total cumulative emissions before 1970. [1.3, 5.1] 41

Second Order Draft (SOD) IPCC WG III AR5
Do Not Cite, Quote or Distribute 4 of 25 Summary for Policymakers
Figure SPM.1. Change in global anthropogenic GHG emissions by major economic regions 1970-1 2010. GHG emissions are measured in gigatonnes per year (Gt/yr) of CO2 equivalent. Non CO2 2 greenhouse gases are converted to CO2 equivalents using 100-year global warming potentials. Trend 3 lines show emission of industrialised countries with G20 membership (IC-G20, green), other 4 industrialised countries (IC-other, purple), developing countries with G20 membership (DC-G20, red), 5 least developed countries (LDC, dashed black), other developing countries (DC-other, blue). Global 6 emission trends (Global) are shown by the solid black line. Coloured areas identify periods of major 7 global economic recessions. [Figure 1.4] 8
Developing countries tend to be net exporters of CO2 emissions, while developed countries tend to 9 be net importers of emissions (high confidence). A considerable share of CO2 emissions from fossil 10 fuel combustion in developing countries (non-Annex B) is released in the production of goods and 11 services that are exported to developed countries (Annex B). Less CO2 emissions are released in 12 developed countries in the production of goods and services as a result of developing countries’ 13 import demands. CO2 emissions released across the global supply chain in the production of goods 14 and services that are consumed in developed countries are often higher than their territorial 15 emissions. [5.5, 1.3] 16
In total, developing countries have higher territorial and consumption-based CO2 emissions than 17 developed countries, but their per capita contributions remain considerably lower – particularly in 18 the case of least developed countries (robust evidence, high agreement). Since the AR4, territorial 19 and consumption-based CO2 emissions from fossil fuel combustion of developing countries (non-20 Annex B) surpassed those in developed countries (Annex B). On a per capita basis, in 2010 developed 21 countries’ CO2 emissions were approximately four times higher than developing countries’ emissions 22 with very large variations existing within these groupings (Figure SPM.2). A growing number of 23 developing countries show per capita CO2 emissions within the range of industrialised countries 24 from a territorial and consumption perspective. [1.3, 5.5] 25

Second Order Draft (SOD) IPCC WG III AR5
Do Not Cite, Quote or Distribute 5 of 25 Summary for Policymakers
1
Figure SPM.2. Territorial (blue lines) versus consumption-based (red dotted lines) CO2 emissions 2 from fossil fuel combustion in five world regions, from 1990 to 2010. The left panel presents total 3 emissions, while the right panel presents per capita emissions. The red areas indicate that a region is 4 a net importer of embedded GHG emissions. The blue area indicates a region is a net exporter of 5 embedded GHG. Regions include: OECD90 (OECD1990 countries), EIT/REF (Economies in 6 Transition/ Reforming Economies), LAM (Latin America and Caribbean), MAF (Middle East and 7 Africa), ASIA (Asia). For country mappings please see Report Annex II. [Figure 5.5.1] 8
Asia’s current emission trajectory is similar to that which OECD countries experienced before 1970 9 (medium confidence). Since the AR4, the vast majority of CO2 emission growth from fossil fuel 10 combustion has taken place in Asia. Global CO2 emission show a 33% growth between 2000 and 11 2010, of which roughly 83% can be attributed to Asia from a territorial and 72% from a consumption 12 perspective. These sharp CO2 emission increases result from an industrialization process that tends 13 to be energy intensive. This process is similar to the experience of current OECD countries prior to 14 1970, though with lower energy requirements per capita equivalent income. The OECD countries 15 contributed most to the pre-1970 emissions, but in 2010 a major share of global annual CO2 16 emissions were associated with developing countries, and Asia in particular (Figure SPM.3). [5.3, 17 14.3] 18
0
2
4
6
8
10
12
14
16
1990 1995 2000 2005 2010
Emis
sio
ns
of
CO
2[G
tCO
2 y
ear-1
]
Net Import of CO2 Net Export of CO2
Consumption Territorial
OECD90
ASIA
REF
MAF
LAM
0
2
4
6
8
10
12
14
16
1990 1995 2000 2005 2010
Per
Cap
ita
Emis
sio
ns
of
CO
2[t
CO
2 y
ear-1
]
Net Import of CO2 Net Export of CO2
Consumption Territorial
OECD90
ASIA
REF
MAF
LAMASIA

Second Order Draft (SOD) IPCC WG III AR5
Do Not Cite, Quote or Distribute 6 of 25 Summary for Policymakers
1
Figure SPM.3. Current and historical anthropogenic CO2 emissions from fossil fuel combustion in five 2 major world regions. Panel (a) shows the annual emissions between 1850 and 2010 in gigatonnes of 3 CO2 per year. Panel (b) shows the regional contributions to cumulative global CO2 emissions between 4 1850 and 1970, cumulative global CO2 emissions between 1970 and 2009 and global CO2 emissions 5 in 2010. The five regions covered are OECD countries (blue), economies in transition (orange), Asia 6 (red), Latin America (green) and Middle East and Africa (ocher). For country mappings please see 7 Report Annex II. [Figure 5.2.2] 8
The largest share of anthropogenic CO2 is emitted by a small number of countries (high 9 confidence). For example, in 2010 ten countries accounted for 70% of global territorial-based 10 (production) CO2 emissions from fossil fuel combustion, if the 27 members of the EU are treated as a 11 whole. A similar relationship is found for consumption-based emissions as well as cumulative 12 emissions going back to 1750 (Figure SPM.4). [1.3] 13
Human settlements accounted for 75-81% of global CO2 emissions between 1990 to 2008. Areas 14 with urban populations were responsible for 29.9 to 35.7% of global CO2 emissions from 1990 to 15 2008, and for 4.7 (56%) of 8.3 Gt increase in emissions over that period. The share of emissions from 16 rural areas has not increased, remaining in the range 43.2 to 45.5%. [12.2, 12.3] 17
Uncertainties associated with estimates of historic anthropogenic GHG emissions vary by gas and 18 tend to decrease with increasing level of country or sector aggregation. Global CO2 emissions from 19 fossil fuel combustion are known to within 10% uncertainty (95% confidence interval) with individual 20 national total fossil-fuel CO2 emissions ranging from a few per cent to more than 50%. CO2 emissions 21 related to land use, land-use change and forestry (LULUCF) have very large uncertainties attached in 22 the order of ±50%. The uncertainty range of global CO2 emission trends reduces to ±5%, if LULUCF 23 related emissions are excluded. For global emissions of CH4, N2O and the fluorinated gases 24 uncertainty estimates of 25%, 30% and 20% are often used in the literature. [1.3] 25

Second Order Draft (SOD) IPCC WG III AR5
Do Not Cite, Quote or Distribute 7 of 25 Summary for Policymakers
1
Figure SPM.4. Shares of largest country contributors to 75% of global anthropogenic CO2 emissions 2 from fossil fuel combustion. Stacked bar on the left shows cumulative territorial emissions for the 3 period 1751-2009, stacked bar in the middle shows consumption based emissions in 2010 and the 4 stacked bar on the right shows production/territorial based emissions in 2010. [Figure 1.7] 5
Emissions growth from consumption continues to outpace emission savings from efficiency 6 improvements (robust evidence, high agreement). Together with the growth in population, global 7 CO2 emission from fossil energy maintained a stable upward trend, which characterizes the overall 8 increase in global GHG emission over the last two decades. Global CO2 emission from fossil fuel 9 combustion increased by 47% over the last two decades, which can be explained by a combination 10 of a modest 4% increase in CO2 intensity in energy resources, 24% decrease in energy intensity in 11 GDP, 43% increase in GDP per capita, and 31% increase in population (Figure SPM.5). In the most 12 recent decade (2000-2010) the carbon intensity of energy has contributed to growth in CO2 13 emissions from fossil fuel combustion for the first time since 1970 due to a rising importance of coal, 14 especially in the rapidly growing developing countries. By contrast, across the highly industrialized 15 world this ratio has been declining due to the shift away from high carbon fuels (notably coal) to 16 natural gas and also to renewables. [1.3, 5.3] 17

Second Order Draft (SOD) IPCC WG III AR5
Do Not Cite, Quote or Distribute 8 of 25 Summary for Policymakers
1
Figure SPM.5. Four factor decomposition of territorial fossil energy CO2 emission at regional level 2 (1970 – 2010); note that only the bottom-right panel for the World has a different scale for its vertical 3 axis. Regions include: OECD90 (OECD1990 countries), EIT/REF (Economies in Transition/ 4 Reforming Economies), LAM (Latin America and Caribbean), MAF (Middle East and Africa), ASIA 5 (Asia). For country mappings please see Report Annex II. [Figure 5.3.1] 6
SPM.3 Long-term mitigation scenarios 7
The balance of evidence suggests that the appropriate response to most of the relevant 8 uncertainties is to accelerate mitigation efforts compared to what would be most appropriate in 9 the absence of such uncertainties. For instance, mitigation efforts should be increased in the short 10 term when there is uncertainty about future policy stringency due to the asymmetry of future states 11 of nature. The “no policy” case implies a slower pace in the aggregation of low-carbon capital stock 12 and technological knowledge; the associated short-term economic gains would be more than 13 outweighed by the potential for substantial economic losses if a “stringent climate policy” state of 14 nature were realized and extremely rapid decarbonization were then needed. [2.4] 15
Sustainable development (SD) is a framework for describing and analysing multiple (development) 16 objectives as well as for organizing ethical considerations for climate policy. SD is variably 17 conceived as development that preserves the interests of future generations, that preserves natural 18 and environmental resources, or that harmonizes the co-evolution of three pillars (economic, social, 19 environmental). SD implicates concerns about social justice within and between generations. 20 Objectives such as development, the elimination of poverty, and the convergence of living standards 21 across countries and within countries can resonate with or conflict with the challenges of managing 22 climate change. A consideration of multiple development objectives and the associated synergies 23 and trade-offs is needed when choosing among combinations of interrelated climate mitigation 24 options within the context of SD. While mitigation pathways interact with and can be a means to 25

Second Order Draft (SOD) IPCC WG III AR5
Do Not Cite, Quote or Distribute 9 of 25 Summary for Policymakers
achieve multiple objectives, different policy and other social responses to climate change affect 1 regions, nations, and localities differently and thereby their possibilities for achieving sustainability. 2
4.2 3
Climate policy choices involve many ethical considerations. What duties and responsibilities do 4 present generations have towards future generations, in view of the fact that present emissions 5 affect environmental conditions in the future, and consequently the quality of life of future 6 generations? How should the responsibility to reduce emissions be allocated among nations and 7 individuals within societies, so that fair outcomes are achieved – who should act and who should 8 bear the costs? Do those who may suffer disproportionally from the consequences of climate change 9 have a claim to compensation? While there are many ways to weigh these ethical choices, the 10 literature points to two important perspectives—the process through which decisions are made and 11
the outcomes of such processes—and many different methods for assessment. 3.2, 3.10 12
Without explicit efforts to reduce emissions, GHG concentrations will exceed 450 ppm CO2eq 13 before 2030 and 850 ppm CO2eq by 2100 (high confidence). Economic growth will continue to drive 14 emissions growth at a global level. This emissions growth will not be meaningfully ameliorated by 15 improvements in technology or the nature of remaining fossil resources. Baseline emission 16 trajectories for fossil and industrial sources from the scenarios literature are inconsistent with more 17 stringent atmospheric GHG concentration pathways stabilizing in the long-run below 550 CO2eq 18 ppm. The majority of baseline scenarios will exceed atmospheric GHG concentrations of 1000 ppm in 19 2100 even though decelerated emissions growth is projected in most of the baseline scenarios, 20
particularly in comparison to the rapid rate observed in the past decade. [6.3] 21
Atmospheric GHG concentration pathways cannot be directly linked to a specific temperature 22 pathway largely because of the large uncertainties in the relationship between concentration and 23 temperature (high confidence). Because of these uncertainties, temperature targets can be 24 expressed in terms of a probability with which a particular temperature might be exceeded along a 25 particular emissions pathway. Studies indicate that the probability of remaining below the 2oC target 26 without temporary overshoot is approximately 60% for scenarios aiming at stabilizing atmospheric 27 GHG concentrations around 450 ppm CO2eq in 2100 if aggressive mitigation begins immediately. The 28 probability is approximately 40% to 50% for 550 ppm scenarios. The probability is substantially 29 below 50% for less ambitious goals. Model results show that delay in international mitigation efforts 30 leads to a considerably higher rate of temperature increase in the next decades and translates into a 31 higher probability of temporarily exceeding the 2oC target. [6.3.2] 32
This SPM puts an emphasis on scenarios in the neighbourhood of the 1.5 and 2 degree targets, 33 which are heavily discussed in international climate change negotiations. This is no indication of the 34 adequacy of these targets. Scientific information relevant for a review of the ambition level in 35 international climate policy will require information from all three IPCC Working Groups that will be 36 brought together in the Synthesis Report. 37
Scenario evidence indicates that stabilizing GHG concentration at 450 ppm CO2eq by the end of 38 the century will require a rapid change to energy systems and to the use of the global land surface. 39 These transitions are decidedly at odds with both long-term trends and those since the publication 40 of the AR4 (high confidence). A large number of scenarios consistent with the long-term ambition of 41 stabilizing atmospheric GHG concentrations at 450 ppm have been published since the AR4. In an 42 idealised scenario context of immediate and economically-efficient action, meeting a goal of 450 43 ppm CO2eq by 2100 would call for a reduction in global emissions below 2010 levels of 15% to over 44 50% in 2030 and 40% to almost 80% in 2050, and anywhere from a moderate increase to roughly a 45 tripling of low-carbon energy above 2010 levels in 2030 and from a tripling to a seven-fold increase 46 by 2050. [6.3] 47
48

Second Order Draft (SOD) IPCC WG III AR5
Do Not Cite, Quote or Distribute 10 of 25 Summary for Policymakers
Under advantageous conditions for limiting costs, scenarios indicate that stabilization of 1 atmospheric GHG concentrations at 450 ppm CO2eq could be achieved at macroeconomic costs of 2 less than 4% of GDP (assuming a discount rate of 5%) (medium confidence). The costs for 3 maintaining atmospheric GHG concentrations below 550 ppm CO2eq are estimated to be 4 approximately 50%-67% lower. Any deviations from idealized conditions including delayed global 5 mitigation efforts or the limited availability of individual technologies could substantially increase 6 costs. [6.3] 7
The vast majority of scenarios for stabilizing atmospheric GHG concentrations at 450 ppm CO2eq 8 by 2100 rely upon a temporary overshoot of these concentrations (high confidence). Overshoot is 9 possible, because carbon is removed from the atmosphere by the oceans over an extended period of 10 time. It can be further extended by the ability of society to create negative emissions through carbon 11 dioxide removal (CDR) technologies. Negative emissions may be from Bioenergy coupled with 12 Carbon Capture and Storage (BECCS) or large-scale afforestation, but there are also other CDR 13 options that could produce negative emissions. Most CDR technologies are not mature and 14 therefore attended by a large set of risks. [6.3, 6.4, 6.9] 15
16
Figure SPM.6. Mean CO2 emission pathways for different scenario categories according to 17 atmospheric CO2 concentration stabilization levels in 2100: Category 1 (blue, 375-420 ppm CO2), 18 Category 2 (green, 400-450 ppm CO2), Category 3 (yellow, 450-495 ppm CO2). The left panel 19 distinguishes between optimal and delayed policy responses, while the right panel indicates whether 20 a scenario includes negative emissions. [Figure 6.7] 21
If ambitious stabilization targets such as 450 ppm CO2eq are to be met, delays in international 22 cooperation will increasingly require the large-scale application of CDR technologies and can 23 dramatically increase the rate of emissions reductions and the costs of mitigation (high 24 confidence). Sufficient delays in global mitigation efforts – for example, delaying global action 25 beyond 2030 – can render ambitious mitigation levels such as 450 ppm CO2eq by 2100 physically 26 infeasible without substantial overshoot and negative global emissions (using BECCS or other CDR 27 technologies) in the second half of the century. Indeed, many integrated models cannot produce 28 scenarios that meet a concentration of 450 ppm CO2eq by 2100 even with overshoot when there is a 29 delay in global mitigation efforts or delays by a large component of the world’s emissions (e.g., the 30 OECD countries or the non-OECD countries) beyond 2030 (Figure SPM.6). These pathways are 31 characterized by increasingly risky profiles through a growing dependency on CDR technologies and 32 the associated loss in the ability of policymakers to hedge risks freely across the mitigation 33 technology portfolio. In addition, delays increase the costs of mitigation several-fold or more, 34 depending on the degree to which international action is delayed. Although delays allow for more 35 gradual near-term emissions reductions, they require commensurately rapid reductions in the 36 future. [6.3] 37

Second Order Draft (SOD) IPCC WG III AR5
Do Not Cite, Quote or Distribute 11 of 25 Summary for Policymakers
Technology cost, performance, and availability have a large influence on the costs of mitigation, 1 particularly for more ambitious stabilization goals. Studies show that macroeconomic costs under 2 broadly pessimistic assumptions about technology could increase the cumulative, century-long costs 3 of reaching 450 ppm CO2eq by the end of the century by four times to orders of magnitude, even 4 assuming idealized national and international policy architectures. Indeed, many models in recent 5 multi-model comparisons could not produce 450 ppm CO2eq scenarios with limited technology 6 portfolios, particularly when assumptions preclude the use of BECCS. Costs for 550 ppm CO2eq 7 scenarios could be increased as well, but only moderately to several-fold (Figure SPM.7). [6.3] 8
Current investment patterns would need to change if they were to become compatible with most 9 stabilization scenarios. Climate policy is expected to induce a partial redirection of investments in 10 the energy sector from fossil fuel based (up-stream production, processing and power plants) to 11 renewable power generation, nuclear energy and fossil fuels with Carbon Capture and Storage (CCS), 12 with limited incremental net investment needs for energy supply. In addition, annual incremental 13 investments in energy efficiency are required in the building sector of USD 215 (175 to 254) billion 14 until 2030, USD 267 (150 to 384) billion in the transport sector, and USD 104 (77 to 131) billion in the 15 industry sector are needed in scenarios compatible with a 450 ppm pathway. [16.2] 16
450 ppm CO2eq 550 ppm CO2eq
Figure SPM.7. Relative mitigation cost increase in case of technology portfolio variations compared to 17 the default (AllTech) technology portfolio under a 550 ppm (a) and a 450 ppm (b) CO2eq stabilization 18 target from the EMF27 study. The numbers at the bottom of both panels indicate the number of 19 models that attempted the reduced technology portfolio scenarios and how many in each sample 20 were feasible. The conventional (Conv) scenario combines pessimistic assumptions for bioenergy and 21 other Renewable Energy (RE) with availability of CCS and nuclear and the higher energy intensity 22 pathway and the energy efficiency and renewable energy (EERE) case combines optimistic bioenergy 23 and other RE assumptions with a low energy intensity future and non-availability of CCS and nuclear. 24 LimTech refers to a case in which essentially all supply side options are constrained and energy 25 intensity develops in line with historical records in the baseline. [Figure 6.23] 26
The Cancun agreements are broadly consistent with stabilization at 550 ppm CO2eq; they are 27 consistent with 450 ppm CO2eq emissions trajectories only in the context of widespread use of 28 negative emission technologies (medium confidence). At the United Nations Climate Conference in 29 Cancun, Mexico, pledges to reduce national emissions were put forward by both developed and 30 developing countries. Although near-term actions are only one step toward long-term stabilization, 31 they can reduce the options for future decisions. The near-term emission trajectory suggested by the 32 Cancun agreement renders a goal of 450 ppm CO2eq by centuries end increasingly difficult without 33 CDR technologies. A wide range of options for meeting a 550 ppm CO2eq goal are still available 34 based on the Cancun range (Figure SPM.8). [6.5] 35

Second Order Draft (SOD) IPCC WG III AR5
Do Not Cite, Quote or Distribute 12 of 25 Summary for Policymakers
1
2
Figure SPM.8. Near-Term Global Emissions from Scenarios Achieving Long-Term Targets of (a) 450 3 CO2eq (Categories 0-1) and (b) 550 CO2eq (Categories 2-3). Individual model results are indicated 4 with colors referring to scenario classification as not-to-exceed (NTE) vs. overshoot (OS); CO2 5 equivalence in terms of Kyoto gas contributions or total contributions to forcing; availability of a 6 negative emissions technology; and timing of international participation (full vs. delay). Number of 7 reported results is shown in legend (254 total for 450 CO2eq, 240 total for 550 CO2eq). [Figure 1.8, 8 Figure 6.31] 9
Climate policy could provide an entry point to achieve a broader set of non-climate objectives. 10 Long-term transformation scenario studies have typically focused on the goal of reducing GHG 11 emissions. However, mitigation choices may have an impact other societal objectives and non-12 climate policies may affect mitigation efforts. Similarly, if stringent climate policies are in place, 13 synergistic relationships between societal objectives tend to be stronger and the added costs of any 14 supplementary policies to reach other objectives (energy security/air pollution) at stringent levels 15 can be significantly reduced (Figure SPM.9) – particularly in the near term. The extent of the 16 synergies will depend on the ambition level for the different objectives. [3.5, 4.2, 6.6] 17
0
10
20
30
40
50
60
2000 2010 2020 2030
Bill
ion
to
ns
CO
2(a) 450 CO2-e Results (Categories 0-1)
NTE / Kyoto Forcing (3)
NTE / Total Forcing (2)
OS / No Negative / Full (22)
OS / No Negative / Delay (0)
OS / Negative / Full (145)
OS / Negative / Delay (82)
Ranges for 550 CO2-e
(see panel b)
Range for Cancun Agreement
History
0
10
20
30
40
50
60
2000 2010 2020 2030
Bill
ion
to
ns
CO
2
(b) 550 CO2-e Results (Categories 2-3)
NTE / Kyoto Forcing (44)
NTE / Total Forcing (68)
OS / No Negative / Full (12)
OS / No Negative / Delay (6)
OS / Negative / Full (70)
OS / Negative / Delay (40)
Ranges for 450 CO2-e
(see panel a)
Range for Cancun Agreement
History

Second Order Draft (SOD) IPCC WG III AR5
Do Not Cite, Quote or Distribute 13 of 25 Summary for Policymakers
1
Figure SPM.9: Costs of achieving societal objectives for energy sustainability under different policy 2 prioritization frameworks. For the colored bars, policy costs are derived from an ensemble of more 3 than 600 scenarios and represent the net financial requirements (cumulative discounted energy-4 system and pollution-control investments, variable costs, and operations and maintenance costs) over 5 and above baseline energy-system development, which itself is estimated at 2.1% of globally-6 aggregated GDP. For the pink circles, policy costs are derived from a set of four distinct scenarios 7 and are calculated as GDP losses (cumulative discounted) relative to a no-policy baseline. [6.32] 8
Long-term mitigation pathways that are commensurate with GHG concentrations of 550 ppm 9 CO2eq or lower require institutional progress of a scale and pace that is unprecedented in human 10 history. The attainability of stabilization goals in economic models relies on ambitious assumptions 11 with regard to the quality of institutions. The overarching assumption is that the sets of property 12 rights in all countries and in-between all countries are eventually fully defined and fully enforceable 13 at zero cost. Moreover, all information is known and made available to everybody at zero cost. In 14 other words, transaction costs are assumed to be zero. Model results are based on a series of 15 assumptions including among others: (1) Largest emitters around the world face a credible incentive 16 to make efforts to control GHG emissions; (2) International institutions can reduce regulatory 17 uncertainty; (3) The infrastructure requirements for such large mitigation efforts can be met 18 effectively; (4) Absence of market failures that affect optimal behaviour of firms; (5) Human 19 preferences are exogenous and constant. 20
The costs of mitigation vary substantially across countries and regions if effort sharing institutions 21 are not available. Mitigation costs will not be identical across countries. This is influenced by the 22 regional distribution of emission sources, the nature of international participation in mitigation, 23 allowance allocations, and transfer payments. In the idealized scenario setting, a universal carbon 24 price encourages mitigation where it is globally most efficient. A robust result of modelling studies is 25 that, in the absence of transfer payments, OECD costs would be lower than the global average, Latin 26 America would be on average around the global mean, and that other regions would face costs 27 higher than the global mean. If some countries delay their mitigation efforts while others take on an 28 expanded role in mitigation, then the former will take on lower mitigation and costs in the near-29 term. However, total costs borne over the century can be higher because of faster reductions that 30 may be necessary for meeting long-term stabilization goals. [6.3] 31
32
0.0%
0.2%
0.4%
0.6%
0.8%
1.0%
1.2%
Only energy security Only air pollution and health Only climate change All three objectives
Tota
l glo
bal
po
licy
cost
s 2
01
0-2
03
0 (
% o
f gl
ob
al G
DP
)
CC PH
ES
CC PH
ES
CC PH
ES
CC PH
ES
All objectives
fulfilled at
‘stringent’
level
At least one
objective
fulfilled at
‘intermediate’
level
At least one
objective
fulfilled at
‘weak’ level
Added costs of ES and
PH are comparatively
low when CC is taken as
an entry point
Policy Prioritization Framework
Tota
l Glo
bal
Po
licy
Co
sts,
20
10
-20
30
(% o
f gl
ob
ally
-agg
rega
ted
GD
P)

Second Order Draft (SOD) IPCC WG III AR5
Do Not Cite, Quote or Distribute 14 of 25 Summary for Policymakers
Mitigation costs borne in a region can be separated from who pays those costs using burden-1 sharing regimes. The choice of stabilization level and effort sharing principle are both of large 2 importance for the regional distribution of policy costs, in particular in the near term (high 3 confidence). Such schemes can be introduced explicitly via regional emissions allowances traded on 4 a global carbon market or through direct transfer of revenues from a global carbon tax. The regional 5 costs are sensitive to the given allocation scheme, especially for developing countries; and they are 6 highly dependent on the concentration stabilisation target. Different effort sharing principles can be 7 applied in the design of transfer schemes (Figure SPM.10). They will determine the direction of 8 transfer payments and the distributional impact of different allocation schemes. For the most 9 ambitious stabilisation level under any effort sharing approach, allowances in OECD and EITs are a 10 fraction of today’s emissions in 2050, and below current levels in 2050 for LAM, AME and Asia. This 11 holds for all of the fundamentally different effort sharing approaches included in the analysed 12 studies. Also for higher stabilization scenarios most studies show a significant decline in allowances 13 for OECD and EITs by 2050. Most studies show a decline in allowances for the LAM region, mostly 14 increasing for the AME region and an inconsistent picture for ASIA. The range of emission 15 allowances widens over time (from 2020 to 2050). [6.3] 16
17
Figure SPM.10. Policy costs for key regions and different allocation principles (C&C=Contraction and 18 Convergence, CDC=Common but differentiated Convergence, Tax=Uniform Carbon Tax, GDP 19 Shares= equal emission right of emission per unit of GDP) from the RECIPE project for a 450 ppm 20 CO2 stabilization target. [Figure 6.30] 21
SPM.4 Mitigation options by economic sector 22
SPM.4.1 Cross-sectoral strategies 23 Human settlements and infrastructure development patterns define the boundary conditions for 24 mitigation efforts over several decades in multiple ways: (i) the long lifetimes of built environment 25 structures limit the speed at which emissions in the use phase (e.g., buildings and transport) can be 26 reduced; (ii) their build-up requires large amounts of primary resources that contribute to industry 27 emissions; and (iii) once these structures have reached the end of their lifetime, the materials they 28 embody may be recovered for reuse or recycling (“urban mining”), which not only saves primary 29 resources and waste, but often also large amounts of energy and emissions in industry and energy 30 supply. [12.2] 31

Second Order Draft (SOD) IPCC WG III AR5
Do Not Cite, Quote or Distribute 15 of 25 Summary for Policymakers
Limiting the cost of stabilization ultimately requires the adoption of substantial mitigation actions 1 in all economic sectors (high confidence). Ambitious climate goals, such as 450 ppm CO2eq, require 2 that GHG emissions toward the end of the century be reduced to a fraction of what they are today 3 (Figure SPM.11). This means that GHG emissions in all sectors need to be substantially reduced; 4 approaches that emphasize only a subset of sectors or a subset of actions will either be insufficient 5 to meet this goal or dramatically raise the costs of mitigation. [6.8] 6
Decarbonization of electricity is a near-term element of strategy in virtually all transformation 7 scenarios that meet 450 ppm or 550 ppm goals while limiting the costs of mitigation (high 8 confidence). The prominence of electricity as a near-term emphasis is based on the notion that there 9 are multiple viable options available to produce low-carbon electricity, so it will be relatively easier 10 to reduce emissions in the electricity sector relative to the demand sectors. [6.8] 11
The emissions reduction benefits of energy demand reductions are highest in the near-term before 12 electricity and other fuels have been decarbonized (high confidence). Energy carriers such as liquid 13 fuels and electricity today are associated with high direct or upstream emissions in most regions of 14 the world. In the long-run, as fuels are progressively decarbonized, for example decarbonizing 15 electricity, end use reductions will lead to progressively smaller emissions reductions. [6.8] 16
There may be incentives to adopt energy efficiency measures independent of their mitigation 17 potential (high confidence). The literature documents a large number of co-benefits and a small 18 number of risks for energy efficiency options compared to supply side mitigation options. Hence, 19 energy efficiency options may provide opportunities to manage risks across the mitigation portfolio 20 and achieve other societal objectives beyond their potential to limit GHG emissions. [6.6, 7.9, 10.8, 21 9.8, 10.8, 11.8] 22
Rebound effects can offset some of the emission reductions from energy efficiency improvements. 23 Direct rebound effects are in the range of 10-30% of projected technical energy savings in developed 24 countries. Direct rebound effects will tend to be greater in developing economies and also appear to 25 be more significant in the productive sectors of economy, where direct rebound may range from 20-26 60% or higher, particularly for energy intensive sectors where energy services are easily substituted 27 for other factors of production. Some argue that macro-economic rebound effects are larger and can 28 exceed 100% (called backfire) in some cases (limited evidence, low agreement). [5.6, 15.5] 29
In the long-run, mitigation in the transportation sector and of non-CO2 gases may provide the 30 greatest challenges for deep emissions reductions (medium confidence). In the long-run, as 31 emissions must be reduced to a fraction of today’s levels, the ability to mitigate these final fractions 32 becomes increasingly important. Indeed, the long-term challenges associated with reductions in 33 transport and non-CO2 gases exert the largest influence on long-term mitigation costs in most long-34 term, integrated studies. The primary challenge in the transport sector is the need for high density 35 fuels. Studies that envision substantial advances in battery or fuel cell and hydrogen storage 36 technologies do not envision transport as a long-term roadblock. Challenging emissions reductions 37 of non-CO2 gases include those from land use process. [6.8, 8.7, 8.9, 11.9] 38
Large differences exist between long-term, integrated studies and bottom-up studies regarding 39 the potential for energy use reductions. Although both long-term integrated studies and bottom-up 40 studies indicate an important role for energy reductions for climate mitigation, a divide remains 41 regarding the cost-effective potential for such reductions. There are two key reasons for such 42 differences: assumptions about the existence of options that occur at a net benefit to the end-user 43 and sector versus economy-wide optimisation. More concretely, most integrated studies assume 44 that all energy efficiency options that are at a net profit to the investor have already been taken up 45 in baseline scenarios, while bottom-up studies acknowledge that there are market barriers and thus 46 large opportunities remain for such investments that can be captured by climate policies. 47 Furthermore, integrated studies optimise and balance mitigation opportunities across the entire 48
Second Order Draft (SOD) IPCC WG III AR5
Do Not Cite, Quote or Distribute 16 of 25 Summary for Policymakers
economy, while many bottom-up studies investigate the details of how and how much that sector 1 could contribute to mitigation or energy use reduction goals. [6.9] 2
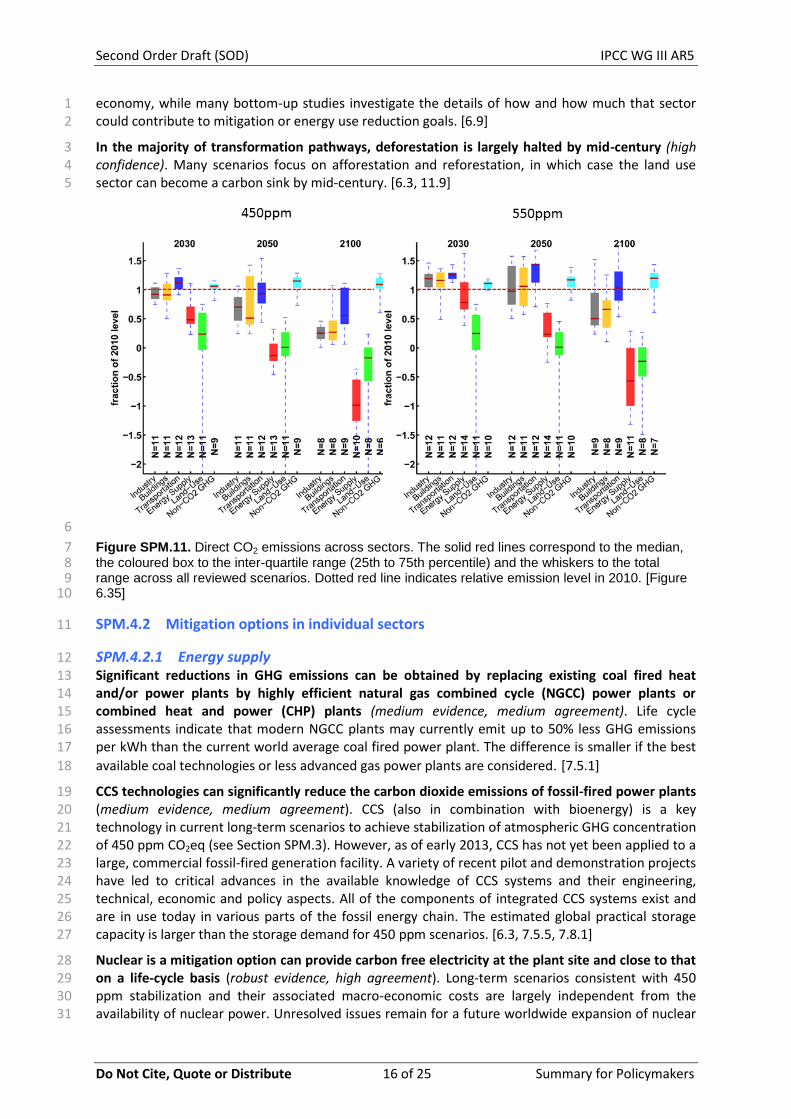
In the majority of transformation pathways, deforestation is largely halted by mid-century (high 3 confidence). Many scenarios focus on afforestation and reforestation, in which case the land use 4 sector can become a carbon sink by mid-century. [6.3, 11.9] 5
6
Figure SPM.11. Direct CO2 emissions across sectors. The solid red lines correspond to the median, 7 the coloured box to the inter-quartile range (25th to 75th percentile) and the whiskers to the total 8 range across all reviewed scenarios. Dotted red line indicates relative emission level in 2010. [Figure 9 6.35] 10
SPM.4.2 Mitigation options in individual sectors 11
SPM.4.2.1 Energy supply 12 Significant reductions in GHG emissions can be obtained by replacing existing coal fired heat 13 and/or power plants by highly efficient natural gas combined cycle (NGCC) power plants or 14 combined heat and power (CHP) plants (medium evidence, medium agreement). Life cycle 15 assessments indicate that modern NGCC plants may currently emit up to 50% less GHG emissions 16 per kWh than the current world average coal fired power plant. The difference is smaller if the best 17
available coal technologies or less advanced gas power plants are considered. [7.5.1] 18
CCS technologies can significantly reduce the carbon dioxide emissions of fossil-fired power plants 19 (medium evidence, medium agreement). CCS (also in combination with bioenergy) is a key 20 technology in current long-term scenarios to achieve stabilization of atmospheric GHG concentration 21 of 450 ppm CO2eq (see Section SPM.3). However, as of early 2013, CCS has not yet been applied to a 22 large, commercial fossil-fired generation facility. A variety of recent pilot and demonstration projects 23 have led to critical advances in the available knowledge of CCS systems and their engineering, 24 technical, economic and policy aspects. All of the components of integrated CCS systems exist and 25 are in use today in various parts of the fossil energy chain. The estimated global practical storage 26 capacity is larger than the storage demand for 450 ppm scenarios. [6.3, 7.5.5, 7.8.1] 27
Nuclear is a mitigation option can provide carbon free electricity at the plant site and close to that 28 on a life-cycle basis (robust evidence, high agreement). Long-term scenarios consistent with 450 29 ppm stabilization and their associated macro-economic costs are largely independent from the 30 availability of nuclear power. Unresolved issues remain for a future worldwide expansion of nuclear 31
Second Order Draft (SOD) IPCC WG III AR5
Do Not Cite, Quote or Distribute 17 of 25 Summary for Policymakers
energy. The related barriers are seen to comprise issues related to operational safety, proliferation 1 risks, waste management and the economics of power plants. Concerns about the resource 2 availability are limited if recycling options (via reprocessing plants) are taken into account. [6.3, 3 7.8.1, 7.5.5] 4
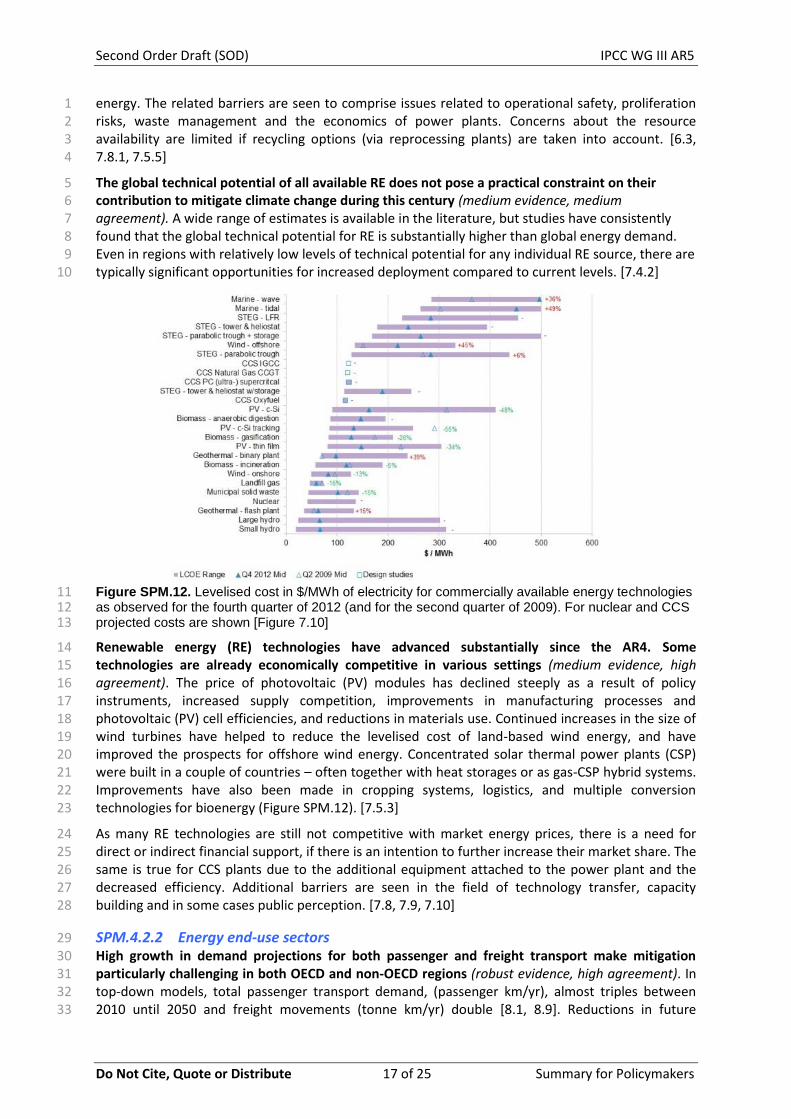
The global technical potential of all available RE does not pose a practical constraint on their 5 contribution to mitigate climate change during this century (medium evidence, medium 6 agreement). A wide range of estimates is available in the literature, but studies have consistently 7 found that the global technical potential for RE is substantially higher than global energy demand. 8 Even in regions with relatively low levels of technical potential for any individual RE source, there are 9 typically significant opportunities for increased deployment compared to current levels. [7.4.2] 10
Figure SPM.12. Levelised cost in $/MWh of electricity for commercially available energy technologies 11 as observed for the fourth quarter of 2012 (and for the second quarter of 2009). For nuclear and CCS 12 projected costs are shown [Figure 7.10] 13
Renewable energy (RE) technologies have advanced substantially since the AR4. Some 14 technologies are already economically competitive in various settings (medium evidence, high 15 agreement). The price of photovoltaic (PV) modules has declined steeply as a result of policy 16 instruments, increased supply competition, improvements in manufacturing processes and 17 photovoltaic (PV) cell efficiencies, and reductions in materials use. Continued increases in the size of 18 wind turbines have helped to reduce the levelised cost of land-based wind energy, and have 19 improved the prospects for offshore wind energy. Concentrated solar thermal power plants (CSP) 20 were built in a couple of countries – often together with heat storages or as gas-CSP hybrid systems. 21 Improvements have also been made in cropping systems, logistics, and multiple conversion 22 technologies for bioenergy (Figure SPM.12). [7.5.3] 23
As many RE technologies are still not competitive with market energy prices, there is a need for 24 direct or indirect financial support, if there is an intention to further increase their market share. The 25 same is true for CCS plants due to the additional equipment attached to the power plant and the 26 decreased efficiency. Additional barriers are seen in the field of technology transfer, capacity 27 building and in some cases public perception. [7.8, 7.9, 7.10] 28
SPM.4.2.2 Energy end-use sectors 29 High growth in demand projections for both passenger and freight transport make mitigation 30 particularly challenging in both OECD and non-OECD regions (robust evidence, high agreement). In 31 top-down models, total passenger transport demand, (passenger km/yr), almost triples between 32 2010 until 2050 and freight movements (tonne km/yr) double [8.1, 8.9]. Reductions in future 33

Second Order Draft (SOD) IPCC WG III AR5
Do Not Cite, Quote or Distribute 18 of 25 Summary for Policymakers
transport activities could result from improved IT communication, internet shopping, social 1 networking etc. but are difficult to predict [8.3] as is the rate of improving mobility access in many 2 developing countries [8.9]. 3
For the transport sector to decarbonise and achieve its mitigation potential will require dramatic 4 changes and depend upon a wide range of technologies, strategies and policies linked to lowering 5 fuel carbon intensity, improving vehicle energy intensity, developing infrastructure, encouraging 6 modal shifts and lowering demand activity (robust evidence, high agreement). Depending on their 7 source, the use of electricity, hydrogen or biofuel energy carriers could lower fuel carbon intensity 8 close to zero in 2100 if technological breakthroughs allowed their affordable and sustainable 9 production and use [8.3, 8.9]. Electric, hydrogen and compressed natural gas-fuelled light duty 10 vehicles (LDVs) may all be adopted for short-range journeys in urban areas [8.3]. The use of 11 advanced biofuels for heavy-duty vehicles (HDVs), boats and aircraft is feasible but there is 12 uncertainty in supplies (see Section SPM.4.2.3). IAM scenarios and transport-based literature 13 disagree on specific long-term technology options and the potential for reducing fuel carbon 14 intensity [8.9]. 15
Improving energy intensity provides high potential for mitigation in all vehicle types [8.6]. Reducing 16 fuel consumption per kilometre of newly sold LDVs by 50% globally in 2030 is a feasible target 17 technologically [8.3]. Many fuel-economy technologies are already commercially available and cost-18 effective for consumers with behavioural options such as “eco-driving” offering an additional 5-10% 19 fuel savings [8.3]. Improved traffic management, intelligent transport systems, plus better vehicle, 20 road and rail maintenance may achieve another 5-10% in fuel savings [8.3]. Efficiency improvements 21 in HDVs could achieve at least a 30% reduction in fuel consumption by 2050, but at moderate to high 22 costs [8.3, 8.6]. Aircraft could achieve efficiency improvement of 50% by 2050 compared to 2005 23 levels and ships around 60% per tonne kilometre by 2050 [8.3]. 24
Technological “improvements” and behavioural “shift” and “avoid” options may contribute more 25 to mitigation than was assumed in the AR4 (medium confidence). Reducing transport-related 26 emissions of short-lived climate forcers, including black carbon, could provide rapid mitigation 27 benefits [8.2]. In urban areas, city tolls, cycle tracks, footpaths, public transport, congestion charges 28 etc. can reduce LDV transport demand by up to 20%-30%, while overcoming barriers and inducing 29 social benefits [8.4, 8.7, 8.8]. Better urban planning, particularly in developing countries, can reduce 30 travel demand per capita by an additional 5-10%, and between 10-20% for cities with rapidly 31 growing populations [8.3, 8.4, 8.10]. 32
Technological options, design practices and behavioural changes can achieve a two to ten-fold 33 reduction in energy requirements of new buildings and a two to four-fold reduction in energy 34
requirements of existing buildings (robust evidence, high agreement) In countries with established 35 building stocks – mostly developed countries - policies focusing on retrofits, while in countries with 36 dynamic construction and relocation/urbanisation rates and development policies focusing on new 37 construction are the most effective. 38
For retrofitting existing buildings, potential reductions in heating energy requirements are 50-75% 39 in single-family housing and 50-90% in multi-family housing at costs of about $100-400/m2 (robust 40 evidence, high agreement). Although retrofits generally entail a large upfront cost, they also 41 generate large annual cost savings, and so are often attractive from a purely economic point of view. 42 Shallow retrofits can result in greater life-cycle costs than deep retrofits. [9.7.1.2] 43
Since the AR4 there have been large improvements in performance and reductions in the cost of 44 several technologies and systems, e.g. very low-energy buildings, net zero energy buildings, 45 insulation materials, use of thermal energy storage, heat pumps, other heating and cooling 46 equipment, cool-colored materials, fuel cells, digital building automation and control systems, smart 47 meters and grids, and advanced biomass systems and cookstoves. [9.3] 48
Second Order Draft (SOD) IPCC WG III AR5
Do Not Cite, Quote or Distribute 19 of 25 Summary for Policymakers
There has been significant progress in the adoption of voluntary and mandatory standards for low- 1 and zero-energy buildings since the AR4 with promising long-term energy implications. Net zero 2 energy and carbon buildings (NZEBs, with consumed energy or related carbon emissions equalling 3 those produced on site or purchased from zero-carbon sources) and nearly zero energy buildings 4 have been very dynamically incorporated by legislations in a large number of developed countries, 5 regions or cities. However, NZEBs may not always be the most optimal solutions for minimised 6 climate and environmental impact at a given cost. [9.3.3.3] 7
Behavioural aspects can lead to a 2-4-fold difference in the of energy requirements of buildings 8 (robust evidence, high agreement). Behavioural factors interact with the choice of technology. For 9 instance, centralized chillers, at least twice more energy-efficient than individual systems, may use 10 up to 9 times more energy than small decentralized units that are used selectively. [9.3.10] 11
Many policies have shown to reduce building energy use very cost- and environmentally effectively. 12 Among the most effective ones are mandatory and voluntary efficiency performance standards, 13 including appliance standards and building codes. Regulatory instruments may be particularly 14 important because of the high number and strength of barriers (technological, financial, market, 15 information, behavioral) that hinder market uptake of cost-effective opportunities. [9.10] 16
As limits to energy efficiency are being approached by the best practices in some energy intensive 17 industries, other options such as material use efficiency, product use efficiency, carbon intensity 18 improvements or demand reductions become increasingly important. The potential for future 19 improvements in energy intensity of industrial production is estimated to be roughly 25% of current 20 global industrial final energy consumption per unit output giving 12% to 26% savings in CO2 21 emissions intensities for different industrial sectors. [10.6] 22
Pace and extent of realisation of mitigation in industry faces significant limitations unless barriers 23 can be removed. For emissions efficiency improvements as feedstock/fuel change or application of 24 CCS availability of alternative resources and competition among sectors is also relevant as very 25 specific barriers like space constraints for CCS applications in retrofit situations. There are a wide 26 range of opportunities to be harnessed from implementing material efficiency options, including the 27 reduction in production costs, reduction in the demands for raw materials, and decreased amount of 28 waste material going into the landfill, and emergence of new business opportunities related to 29 material efficiency. However, commercial deployment thus far remains at a small scale. Barriers to 30 material efficiency include lack of human and institutional capacities to encourage management 31 decisions and public participation. 32
SPM.4.2.3 Agriculture, Forestry and Other Land-Use (AFOLU) 33 AFOLU is a significant component of mitigation in transformation pathways, offering a variety of 34 mitigation options and a large, cost competitive mitigation potential (low evidence, medium 35 agreement). Opportunities for mitigation include supply-side measures such as reduction of 36 emissions arising from land use change and land management, increasing carbon stocks by 37 sequestration in soils and biomass, or the substitution of fossil fuels by biomass for energy 38 production, and demand-side measures, such as reducing losses and wastes of food, changes in diet, 39 wood consumption etc.. Large-scale energy generation or carbon sequestration in the AFOLU sector 40 provides headroom for the development of mitigation technologies in the energy supply and energy 41 end-use sectors as the technologies already exist and most of them are commercial. 42
Within supply-side measures, global estimates for economic mitigation potentials in the AFOLU 43 sector by 2030 are 0.49 to 10.60 GtCO2eq/yr at carbon prices up to 100 US$/tCO2eq, about half of 44 which can be achieved at low carbon price (medium evidence, medium agreement). New 45 technologies, not assessed in the AR4 (such as biochar) could increase this potential, but there is less 46 evidence upon which to base robust estimates. Demand-side measures (e.g. dietary change and 47 waste reduction) also provide significant technical potential, but the barriers to implementation are 48

Second Order Draft (SOD) IPCC WG III AR5
Do Not Cite, Quote or Distribute 20 of 25 Summary for Policymakers
substantial. At carbon prices of around $100 t CO2eq, restoration of organic soils has the greatest 1 potential, followed by cropland management and grazing land management. At lower prices (20 2 US$/tCO2eq), cropland management and grazing land management have the greatest economic 3 mitigation potential. In other words, the composition of the agricultural mitigation portfolio varies 4 with the carbon price (Figure SPM.13). [11.6] 5
Within demand-side measures, changes in diet can have a significant impact on GHG emissions 6 from food production (0.76-9.31 GtCO2eq/yr by 2030), the range for which is determined by 7 assumptions about the implementation of bioenergy (low evidence, low agreement). Other 8 assumptions such as changes in productivity, feeding efficiency, waste reduction can also influence 9 demand-side mitigation, with total combined potential of 1.5-15.6 GtCO2eq/yr by 2050 (Figure 10 SPM.13). [11.6] 11
12
Figure SPM.13. Estimates of economic mitigation potentials in the AFOLU sector published since 13 AR4, (AR4 estimates shown for comparison, denoted by red arrows), including bottom-up, sectoral 14 studies, and top-down, multi-sector studies. Some studies estimate potential for agriculture and 15 forestry, others for one or other sector. Mitigation potentials are estimated for around 2030, but 16 studies range from estimates for 2025 to 2035. Studies are collated for those reporting potentials at 17 up to ~20 US$/tCO2eq. (actual range 1.64-21.45), up to ~50 US$/tCO2eq. (actual range 31.39-50.00), 18 and up to ~100 US$/tCO2eq. (actual range 70.0-120.91). Demand-side measures (shown on the right 19 hand side of the figure) are not assessed at a specific carbon price, and should be regarded as 20 technical potentials. Not all studies consider the same measures or the same GHGs; further details 21 are given in the text. [Figure 11.16] 22
Bioenergy deployment offers both significant potential for climate change mitigation, but also 23 considerable risks (medium evidence, medium agreement). In the SRREN it has been suggested that 24 a sustainable bioenergy potential is no higher than 300EJ, but many studies suggest lower potential 25 depending on the assumptions taken. Top-down scenarios project 15-225 EJ/yr bioenergy 26 deployment in 2050. Sustainability and livelihood concerns might constrain deployment levels. 27 Achieving such levels would require, among other options, extensive use of agricultural residues and 28 second-generation bioenergy to mitigate adverse impacts on land use and food production, and the 29 co-processing of biomass with coal or natural gas with CCS to make low net GHG-emitting 30 transportation fuels and/or electricity. Both mitigation potential and sustainability hinges crucially 31 on land carbon (forest) protection, careful fertilizer application, interaction with food markets, and 32
0
2000
4000
6000
8000
10000
12000
14000
Mt
CO
2-e
q. /
yr
Forest
Agriculture
Up to 20 US$/t CO2-eq. Up to 50 US$/t CO2-eq. Up to 100 US$/t CO2-eq.Demand-sidemeasures -technical potentials
Second Order Draft (SOD) IPCC WG III AR5
Do Not Cite, Quote or Distribute 21 of 25 Summary for Policymakers
good land and water management. Little is still known about the total livelihood effects associated 1 with bioenergy deployments. [11.A] 2
SPM.4.3 Co-benefits, risks & sustainable development 3 Climate policy decisions often lead to co-benefits and/or adverse side-effects for other societal 4 objectives (high confidence). Limiting climate change is one of many economic, social, and 5 environmental policy objectives. Mitigation objectives and options should therefore be assessed 6 within a multi-objective framework in order to maximize synergistic effects and to avoid trade-offs 7 with other societal objectives. This implies that policy design and implementation practices may 8 need to consider local priorities in order to create appropriate incentives. Since the relative 9 importance of different goals differs among various stakeholders and may change over time, 10 transparency on the multiple effects that accrue to different actors at different points of time is 11 important. The possibility of harnessing near-term co-benefits of mitigation policies may increase 12 the incentives for a global climate agreement. [3.5, 4.8, 6.6] 13
Most mitigation options result in co-benefits for air quality with significant short-term welfare 14 gains (high confidence). GHG and pollutant emissions typically derive from the same sources. By 15 reducing fossil fuel use, mitigation options often result in major cuts in other pollutants reducing 16 environmental and health risks. The range of the economic value of air quality co-benefits from 17 climate change mitigation range from $2/tCO2 to $196/tCO2, with a mean of $49/tCO2, depending on 18 diverse geographies, economic sectors, time horizons, and valuation techniques considered. Welfare 19 gains from co-benefits tend to be higher in developing countries than industrialized countries due to 20 higher pollution levels. Many energy supply and demand-side mitigation options show co-benefits 21 for air quality, reducing the impacts on human health and ecosystems. [4.3, 6.6, 7.9, 8.7, 9.7, 10.8, 22 11.7] 23
Many mitigation options result in co-benefits for energy security (medium confidence). Mitigation 24 options, such as renewables and energy efficiency, may cause reductions in global energy trade, and 25 thus help reduce dependency on fossil fuel imports (see Table TS.5). Other mitigation options, such 26 as CCS, however, reduce resource efficiency, and thus may have negative effects on energy security. 27 The integrated assessment scenarios show that climate change mitigation may increase the diversity 28 of energy sources used in the transport and electricity sectors (relative to today and to a baseline 29 scenario in which fossil fuels remain dominant). These developments would make energy systems 30 less vulnerable to various types of shocks and stresses. [6.6, 7.9, 8.7, 9.7] 31
Many climate mitigation options have adverse effects by increasing the cost of energy (high 32 confidence). Approximately 2.6 billion people worldwide (the poor, mostly in developing countries) 33 do not have access to electricity and/or are dependent on traditional use of biomass – burnt in open 34 fires or primitive cookstove designs with severe health implications. Increases in energy costs may 35 impede reaching development objectives related to poverty, such as universal access to modern and 36 clean energy and technologies. Design of climate policies will need thus to account for distributional 37 effects and avoid adverse impacts for the affordability of energy for the impoverished parts of the 38 population. [4.3, 6.6, 7.9, 9.8, 11.A.3, 15.7] 39
SPM.5 Institutional options by governance level 40
SPM.5.1 Human decision-making 41 The success of climate policy depends on how people perceive and respond to climate and other 42 risks in their choice context (medium evidence, high agreement). Awareness of the factors that drive 43 these perceptions can enrich expert assessments to reflect when (and how) key decision-makers are 44 likely to respond to climate with respect to their choices of what actions to take or policies to 45 pursue. Individuals, small groups and organizations often do not make decisions in the analytic or 46 rational way envisioned by standard models of choice in the economics and management science 47

Second Order Draft (SOD) IPCC WG III AR5
Do Not Cite, Quote or Distribute 22 of 25 Summary for Policymakers
literature. Risks frequently are perceived in ways that differ from expert judgments, which poses 1 challenges for climate risk communications and response. For example, risks that are seen as 2 proximate usually inspire greater concern and response than those that are more distant in time or 3 geographical impact. Judging climate change from personal experience with local weather events 4 such as unusually cold winters or severe losses from hurricanes or floods can easily distort risk 5 judgments. An understanding of behavioural responses to risk and uncertainty can suggest ways of 6 reframing the climate change issue. In this sense communication of uncertainty is a critical 7 component of risk management. [2.2] 8
There is status-quo bias in human response to uncertainty and change. It is common for 9 individuals, societies, and industries to defer action and postpone taking on new costs or altering 10 established preferences. Psychological mechanisms giving rise to this tendency to reject change, 11 sometimes referred to as status-quo bias, include risk-, ambiguity-, and loss-aversion. Education and 12 incentives are two traditional categories of intervention, with incentives having two subclasses, 13 positive inducements for responsible behaviour and negative deterrents to not making responsible 14 choices. More recently new theory in behavioural economics and psychology has provided a third 15 class of strategies or tactics, namely choice architecture interventions that describe or present action 16 alternatives in ways that minimize status-quo biases. [2.2, 2.4] 17
The selection of climate change policies and their implementation can benefit from examining the 18 perceptions and responses of relevant stakeholders. The policies will be influenced by how the 19 problem is formulated, the nature of the institutional arrangements, the interactions between 20 stakeholders that characterizes risk governance and the key risks and uncertainties. Policies may be 21 best designed, if they take into account how the relevant stakeholders perceive risk and their 22 behavioural responses to uncertain information and data (descriptive analysis). Further 23 consideration may be given to methodologies and decision aids for systematically addressing issues 24 of risk and uncertainty (normative analysis) that suggest strategies for improving outcomes at the 25 individual and societal level (prescriptive analysis). [2.2] 26
SPM.5.2 International and regional cooperation 27 Numerous existing and proposed approaches to international cooperation could facilitate progress 28 on climate change mitigation. A notable change since the AR4 is that the number of climate policy 29 approaches has increased. These approaches vary along several dimensions, including the degree to 30 which they are centrally organized and managed (Figure SPM.14). At one end of the spectrum is 31 strong multilateralism, whereby countries and regions agree to a high degree of mutually binding 32 rules or standards to guide their actions--for example, fixed targets and timetables for emission 33 reductions. The Kyoto Protocol is an example of such an approach. A less-centralized approach 34 would structure international cooperation around harmonized national policies, where national or 35 regional policies are made compatible through, for example, harmonized carbon taxes, cap and 36 trade schemes, or standards. Finally, at the other end of the spectrum of international cooperation, 37 decentralized architectures may arise out of heterogeneous regional, national, and sub-national 38 policies, which may vary in the extent to which they are internationally linked. [13.4] 39

Second Order Draft (SOD) IPCC WG III AR5
Do Not Cite, Quote or Distribute 23 of 25 Summary for Policymakers
Figure SPM.14. Degrees of centralized authority of existing (blue) and proposed (pink) approaches to 1 international cooperation. [Figure 13.2] 2
The performance of the Kyoto Protocol is mixed. In terms of environmental effectiveness, emission 3 reductions have exceeded the Kyoto Protocol’s goal: aggregate GHG emissions from Annex I 4 countries have fallen by 14% since 1990 if land use and forestry sector changes are taken into 5 account, and by 10% if they are not. However, most of these cuts may have been due to the scaling-6 back of GHG-intensive industries in the transition economies. In terms of cost-effectiveness, the 7 Kyoto Protocol established three flexible mechanisms. The first, international emissions trading (IET) 8 has not improved cost-effectiveness because trading has been very limited under this provision. The 9 second, Joint Implementation (JI), has not been as effective as its theoretical potential either since 10 activity under this mechanism in terms of CO2-equivalent trading volume has been low. The third, 11 the Clean Development Mechanism (CDM), has stimulated over five thousand registered projects 12 with a total of 1.15 billion emission credits issued between 2003 and 2012. However, the 13 environmental effectiveness of the CDM depends on three key factors: whether project developers 14 are indeed motivated primarily by expected revenue from the sale of the emission credits (so-called 15 “additionality”), the validity of the baseline from which emission reductions are calculated, as well as 16 indirect emissions impacts (“leakage”) caused by the projects. In terms of distributional impacts, the 17 Kyoto Protocol places emissions mitigation requirements on the Annex I countries, largely the 18 wealthiest countries and those responsible for the majority of the current stock of anthropogenic 19 GHGs in the atmosphere, consistent with the UNFCCC goal of “common but differentiated 20 responsibilities and respective capabilities.” However, by 2011, approximately fifty non-Annex I 21 countries had higher per capita income than the poorest of the Annex I countries. The geographical 22 distribution of CDM projects across developing countries has been uneven, with 80% of CDM 23 projects in Asia and less than 3% in sub-Saharan Africa. In terms of participation, the Kyoto Protocol 24 was ratified by more than 190 countries. This relatively high rate of participation may be due, in part, 25 to the substantial flexibility provided by the Protocol. [13.7, 13.13] 26

Second Order Draft (SOD) IPCC WG III AR5
Do Not Cite, Quote or Distribute 24 of 25 Summary for Policymakers
Climate finance reported under the UNFCCC accounts for less than 3% of current climate finance 1 and about 15-25% of the public international climate finance flows to developing countries 2 (medium evidence, medium agreement). Annex II countries reported an average of less than USD 10 3 billion per year from 2005-2010. From 2010- 2012, developed countries committed USD 28 billion 4 (2012 USD) in Fast Start Finance. [16.2] 5
The private sector plays a central role in investing in low carbon projects in industrialised and 6 developing countries (medium evidence, high agreement). Its contribution is estimated at USD 250-7 285 billion in 2010/2011, which represents around 75% of overall mitigation finance (2010/2011 8 USD). At present, a large share of private sector climate investments relies on low-interest and long-9 term loans as well as partial risk guarantees provided by public sector institutions to cover the 10 incremental costs and risks of many mitigation investments. [16.2] 11
Linkages among regional, national, and sub-national programs may complement international 12 cooperation (medium confidence). While policy linkage can take several forms, linkage through 13 carbon markets has been the primary means of regional policy linkage due to the greater 14 opportunities for trade as carbon markets expand. Such forms of regional agreements could then, in 15 principle, form building blocs for greater global cooperation by linking these efforts across regions. 16 The benefits of policy linkage may include lower mitigation costs, decreased emission leakage, 17 increased credibility of market signals, and increased liquidity due to expanded market size. Linking 18 national policies with international policies may also provide flexibility by allowing a group of parties 19 to meet emissions reduction obligations in the aggregate. However, policy linkage may also increase 20 transaction costs and raise the concern that the linked policies will be diluted (as enforcement in 21 linked systems is only as stringent as the weakest among them), and that countries may be unwilling 22 to accept an increase in mitigation costs that could result from linking with a more ambitious 23 system. [13.6, 13.7, 14.4] 24
SPM.5.3 National and sub-national policies 25 There is no best policy for mitigating climate change (high confidence). Different policies play 26 different roles, typically to 1) provide a price signal; 2) remove barriers; or 3) promote long-term 27 investments. A combination of policies that addresses all three roles (see also Table SPM.1) would 28 be most effective. Policies should be designed and adjusted so as to complement rather than 29 substitute for other policies in the same and other jurisdictions. Appropriate designs depend on 30 national and local circumstances and institutional capacity. For instance, countries that lack market 31 institutions and security of property rights cannot in any obvious way enjoy all the efficiency benefits 32 associated with economic instruments. These categories are complementary when policy packages 33 are designed to take advantage of synergies and avoid negative interactions. If there is no 34 coordination within an integrated perspective then results in one area may be undone by results in 35 another area for instance through leakage and rebound effects. [15.5, 15.6, 15.8] 36
The extent to which policy instruments introduce or manage regulatory risk differs, and this has an 37 effect on their effectiveness and efficiency (high confidence). Many market instruments, such as 38 carbon taxes and tradeable permits, create an incentive for low-carbon investment by influencing 39 actors’ expectations of long-term operating costs, and yet a number of factors can render these 40 expectations, in response to the policy, highly uncertain. The effect of this uncertainty in most cases 41 is to reduce the extent of behavioural change in response to the magnitude of the carbon price 42 signal. Some subsidy instruments, such as investment tax credits, do not alter long-term 43 expectations, but create an immediate incentive to shift investments. Other subsidy instruments, 44 such as feed-in tariffs, have the effect of stabilizing long-term expectations, a feature that has been 45 found to stimulate the level of investment relative to the magnitude of the subsidy. [2.4] 46
47
48

Second Order Draft (SOD) IPCC WG III AR5
Do Not Cite, Quote or Distribute 25 of 25 Summary for Policymakers
Table SPM.1: Three roles of climate policy instruments. [Table 15.1] 1
Providing a price signal Removing barriers Promoting long-term investments
Examples
of policy
instruments
Economic Instruments
▪Fuel, energy, or carbon tax
▪Emission trading systems
Regulatory approaches
▪Appliance standards
▪Energy management systems
and energy audits
Information programs
▪Appliance labeling
Voluntary actions
▪Voluntary agreements
Technology Policy
▪Govt grants for R&D and
investment
▪Feed-in tariff for renewable power)
▪Renewable portfolio standards.
Governmental Provision
▪Government Provision of low-
emission urban and transport
infrastructure
Suitable
Context The entire economy
Behavioral (cognitive and
computational) constraints,
Asymmetric information, non-
competitive markets
Technology development for
emission reduction
2 The use of economic instruments is not always sufficient to encourage mitigation by firms and 3 individuals because their behavior is often hampered by “barriers” such as the costs of acquiring 4 and processing information. A range of barrier-removal policies for energy efficiency improvement 5 including regulations, information measures, energy management systems, energy audits and so 6 forth, often bring about energy efficiency improvement and greenhouse gas emission cuts at 7 negative to low cost to society when assessed at individual policy instrument level. [15.5] 8
Instruments that promote long-term investment are an essential part of an adequate policy mix 9 (high confidence). The main reason for this is that there is a second market failure in addition to the 10 failure to internalize damages from greenhouse gases. This failure is that of the market for 11 protection of intellectual property rights (for example the patent market). Because of this failure, 12 private investments in non-fossil energy production and in efficiency of energy use are less than 13 socially optimal and there is an argument in favour of subsidies. In other contexts, technology policy 14 can extend beyond R&D activities to the support of commercialization and technology transfer. 15 [15.6] 16
Elimination or reduction of subsidies for fossil energy can result in major emission reductions at 17 negative cost. In most countries (particularly low and middle-income countries), carbon and fuel 18 taxes are progressive or neutral with the rich paying an equal or greater proportion of their income 19 than the poor. Kerosene in low-income countries is an exception, with taxation being regressive. 20 [15.5] 21