Splunk conf2014 - Getting Deeper Insights into your Virtualization and Storage with Splunk
41
Copyright © 2014 Splunk Inc. Stela Udovicic – Sr. Product Marke@ng Manager, Splunk Michael Donnelly – Senior SE, Virtualiza@on Technologies Specialist, Splunk GeIng Deeper Insights into your Virtualiza@on and Storage with Splunk
-
Upload
splunk -
Category
Technology
-
view
378 -
download
0
Transcript of Splunk conf2014 - Getting Deeper Insights into your Virtualization and Storage with Splunk

Copyright © 2014 Splunk Inc.
Stela Udovicic – Sr. Product Marke@ng Manager, Splunk
Michael Donnelly – Senior SE, Virtualiza@on Technologies Specialist, Splunk
GeIng Deeper Insights into your Virtualiza@on and Storage with Splunk
Disclaimer
2
During the course of this presenta@on, we may make forward-‐looking statements regarding future events or the expected performance of the company. We cau@on you that such statements reflect our current expecta@ons and
es@mates based on factors currently known to us and that actual events or results could differ materially. For important factors that may cause actual results to differ from those contained in our forward-‐looking statements,
please review our filings with the SEC. The forward-‐looking statements made in the this presenta@on are being made as of the @me and date of its live presenta@on. If reviewed aUer its live presenta@on, this presenta@on may not contain current or accurate informa@on. We do not assume any obliga@on to update any forward-‐looking statements we may make. In addi@on, any informa@on about our roadmap outlines our general product direc@on and is subject to change at any @me without no@ce. It is for informa@onal purposes only, and shall not be incorporated into any contract or other commitment. Splunk undertakes no obliga@on either to develop the features or func@onality described or to
include any such feature or func@onality in a future release.
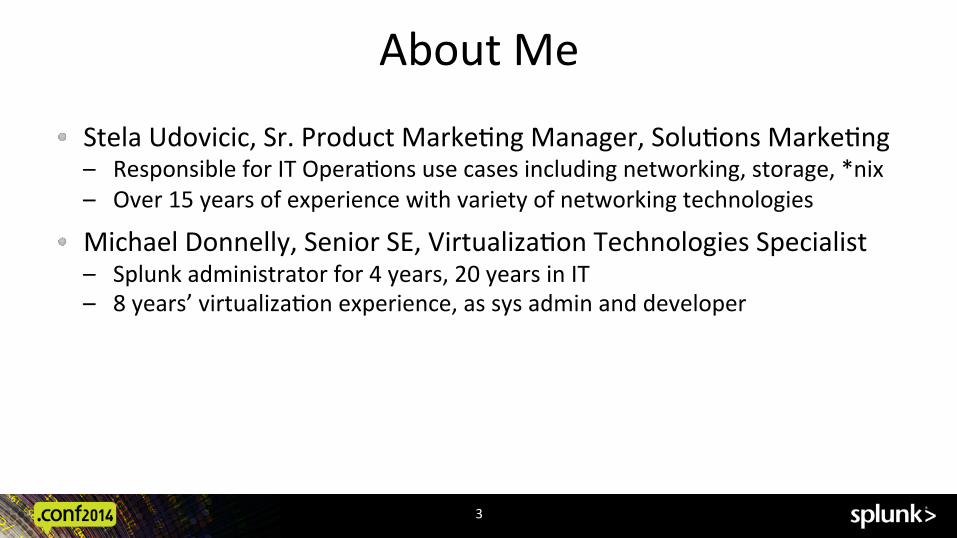
About Me
! Stela Udovicic, Sr. Product Marke@ng Manager, Solu@ons Marke@ng – Responsible for IT Opera@ons use cases including networking, storage, *nix – Over 15 years of experience with variety of networking technologies
! Michael Donnelly, Senior SE, Virtualiza@on Technologies Specialist – Splunk administrator for 4 years, 20 years in IT – 8 years’ virtualiza@on experience, as sys admin and developer
3
Agenda
! Introduc@on ! Virtualiza@on Insights: Splunk App for VMware ! Storage Insights: Splunk App for NetApp Data ONTAP ! Integrated Insights Demo
4
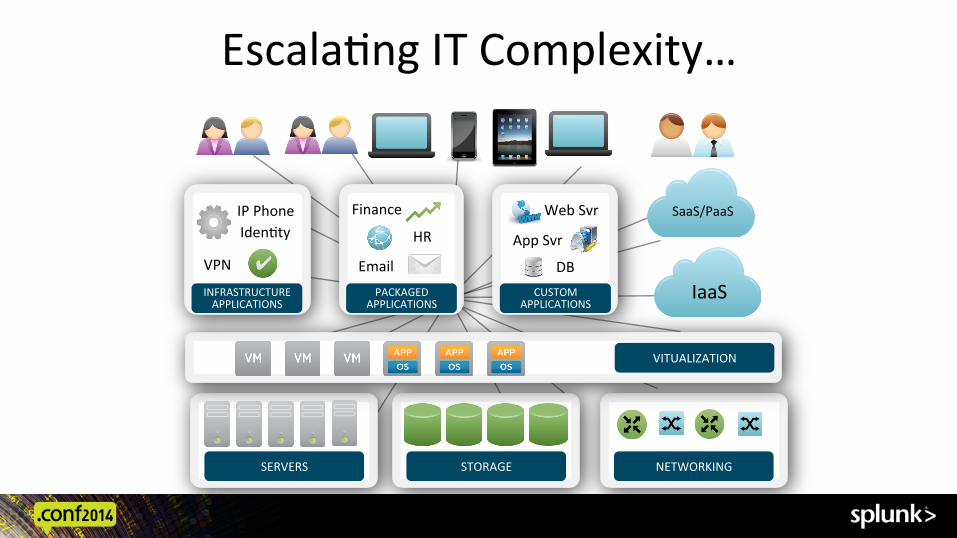
Escala@ng IT Complexity…
SERVERS STORAGE NETWORKING
VITUALIZATION
INFRASTRUCTURE APPLICATIONS
PACKAGED APPLICATIONS
CUSTOM APPLICATIONS
Iden@ty
VPN
IP Phone
HR
Finance
App Svr
DB
Web Svr SaaS/PaaS
IaaS
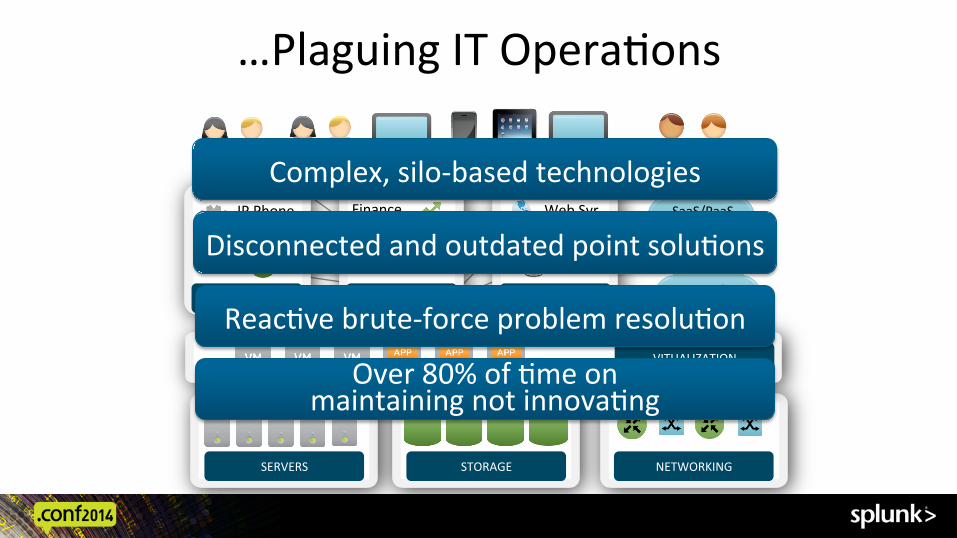
…Plaguing IT Opera@ons
SERVERS STORAGE NETWORKING
VITUALIZATION
INFRASTRUCTURE APPLICATIONS
PACKAGED APPLICATIONS
CUSTOM APPLICATIONS
Iden@ty
VPN
IP Phone
HR
Finance
App Svr
DB
Web Svr SaaS/PaaS
IaaS
Complex, silo-‐based technologies
Disconnected and outdated point solu@ons
Reac@ve brute-‐force problem resolu@on
Over 80% of @me on maintaining not innova@ng
7
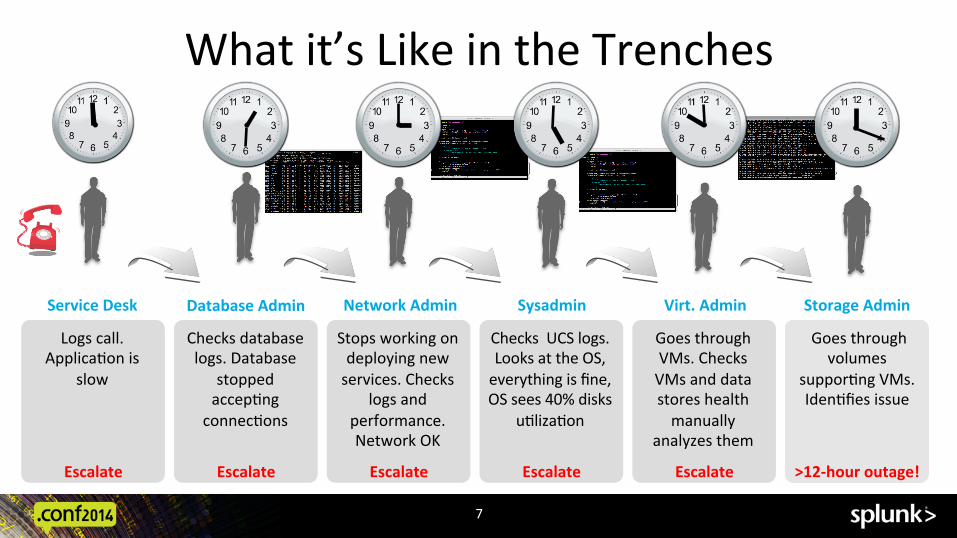
What it’s Like in the Trenches
Service Desk Database Admin Sysadmin Network Admin Virt. Admin Storage Admin
Logs call. Applica@on is
slow
Checks database logs. Database
stopped accep@ng
connec@ons
Stops working on deploying new services. Checks
logs and performance. Network OK
Checks UCS logs. Looks at the OS, everything is fine, OS sees 40% disks
u@liza@on
Goes through VMs. Checks VMs and data stores health manually
analyzes them
Goes through volumes
suppor@ng VMs. Iden@fies issue
Escalate Escalate Escalate Escalate Escalate >12-‐hour outage!
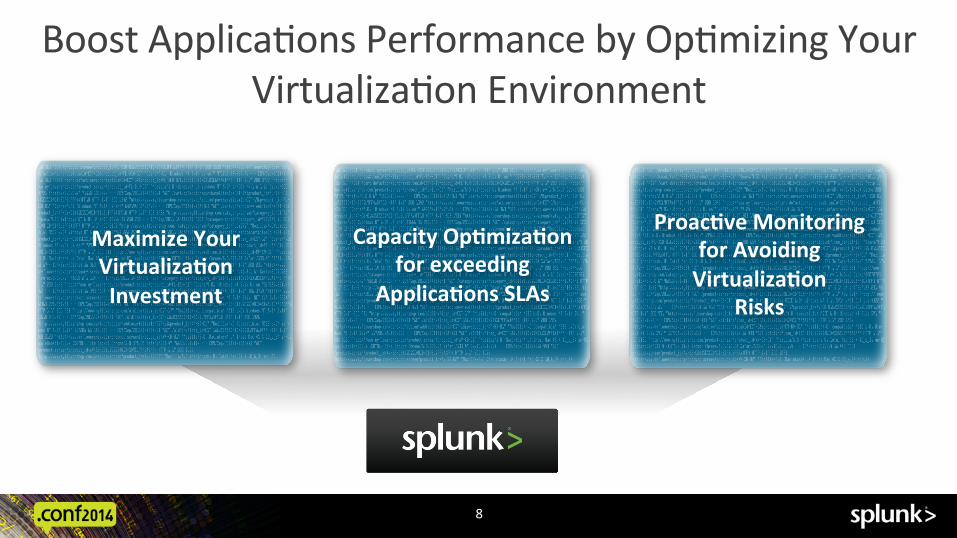
Boost Applica@ons Performance by Op@mizing Your Virtualiza@on Environment
8
Capacity OpEmizaEon for exceeding
ApplicaEons SLAs
ProacEve Monitoring for Avoiding VirtualizaEon
Risks
Maximize Your VirtualizaEon Investment
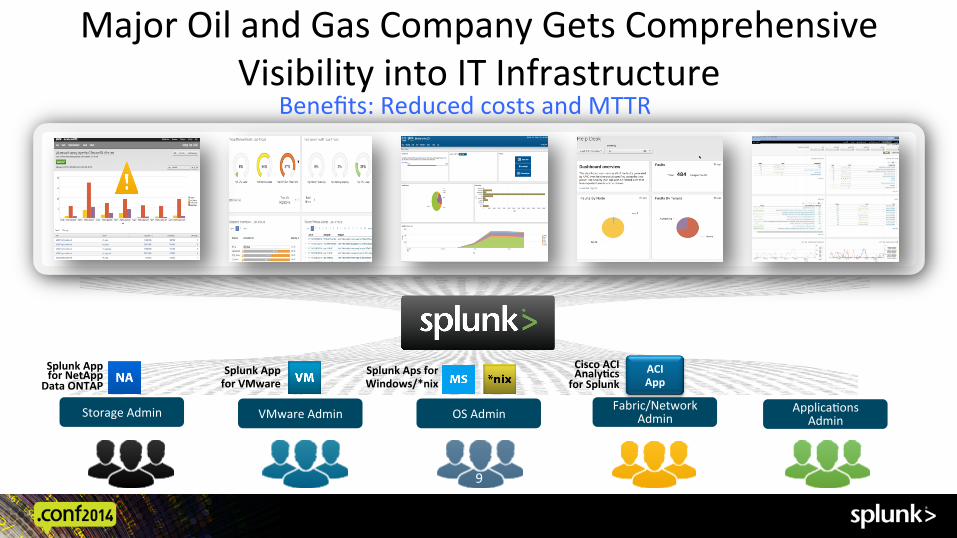
Major Oil and Gas Company Gets Comprehensive Visibility into IT Infrastructure
9
Benefits: Reduced costs and MTTR
Fabric/Network Admin VMware Admin Storage Admin Applica@ons
Admin OS Admin
Splunk App for NetApp
Data ONTAP Splunk App for VMware
Splunk Aps for Windows/*nix
Cisco ACI AnalyEcs for Splunk
ACI App

Virtualiza@on Insights
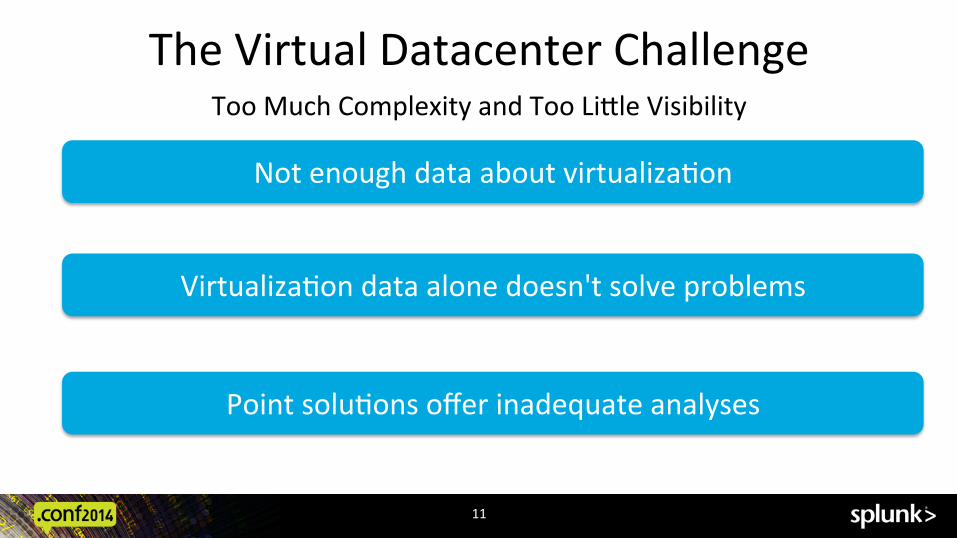
The Virtual Datacenter Challenge Too Much Complexity and Too Lille Visibility
Not enough data about virtualiza@on
Virtualiza@on data alone doesn't solve problems
Point solu@ons offer inadequate analyses
11
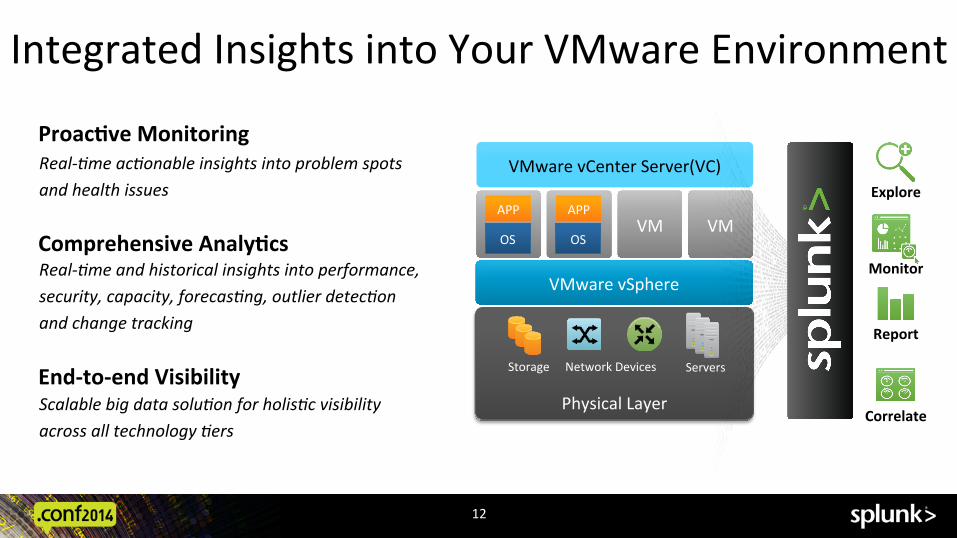
Integrated Insights into Your VMware Environment
12
ProacEve Monitoring
Comprehensive AnalyEcs
End-‐to-‐end Visibility
APP
OS
VMware vSphere
Physical Layer
Servers Storage Network Devices
VMware vCenter Server(VC)
APP
OS VM VM
Report
Correlate
Monitor
Explore
Real-‐&me ac&onable insights into problem spots and health issues
Real-‐&me and historical insights into performance, security, capacity, forecas&ng, outlier detec&on and change tracking
Scalable big data solu&on for holis&c visibility across all technology &ers
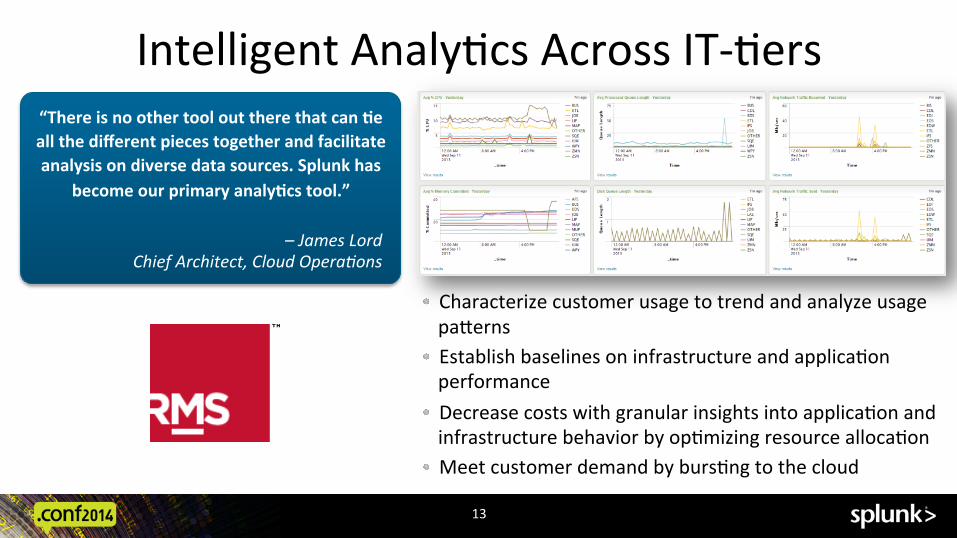
Intelligent Analy@cs Across IT-‐@ers
13
“There is no other tool out there that can Ee all the different pieces together and facilitate analysis on diverse data sources. Splunk has
become our primary analyEcs tool.”
! Characterize customer usage to trend and analyze usage palerns
! Establish baselines on infrastructure and applica@on performance
! Decrease costs with granular insights into applica@on and infrastructure behavior by op@mizing resource alloca@on
! Meet customer demand by burs@ng to the cloud
– James Lord Chief Architect, Cloud Opera&ons
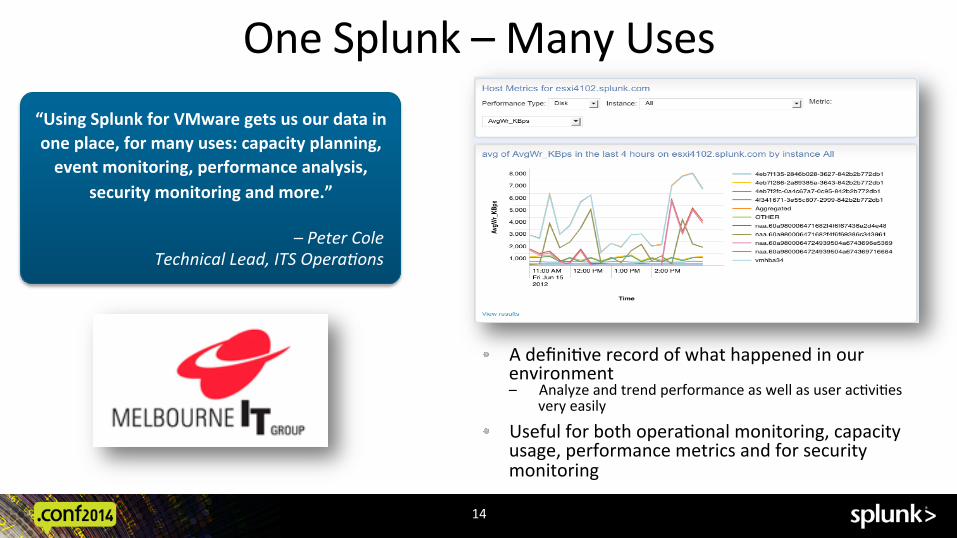
One Splunk – Many Uses
14
“Using Splunk for VMware gets us our data in one place, for many uses: capacity planning, event monitoring, performance analysis,
security monitoring and more.”
! A defini@ve record of what happened in our environment – Analyze and trend performance as well as user ac@vi@es
very easily
! Useful for both opera@onal monitoring, capacity usage, performance metrics and for security monitoring
– Peter Cole Technical Lead, ITS Opera&ons

15
Integrated Insights into Applica@on and OS Health
SAN & NAS
Splunk Environment
Network Infrastructure
Virtual Servers: Web, middleware, apps
Cri@cal Infrastructure
Servers Networking Ac@ve
Directory
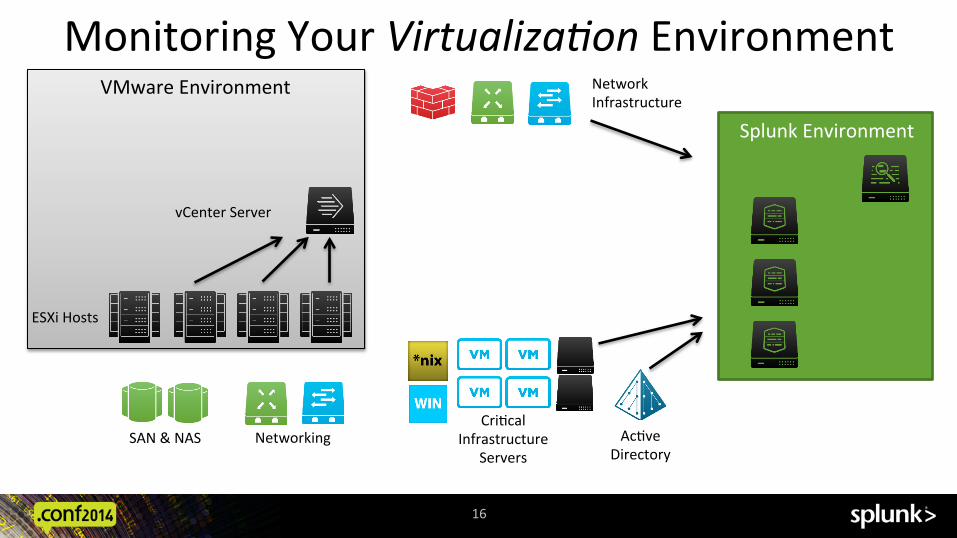
16
vCenter Server
ESXi Hosts
Monitoring Your Virtualiza&on Environment VMware Environment
SAN & NAS
Splunk Environment
Network Infrastructure
Ac@ve Directory
Virtual Servers: Web, middleware, apps
Cri@cal Infrastructure
Servers Networking
17
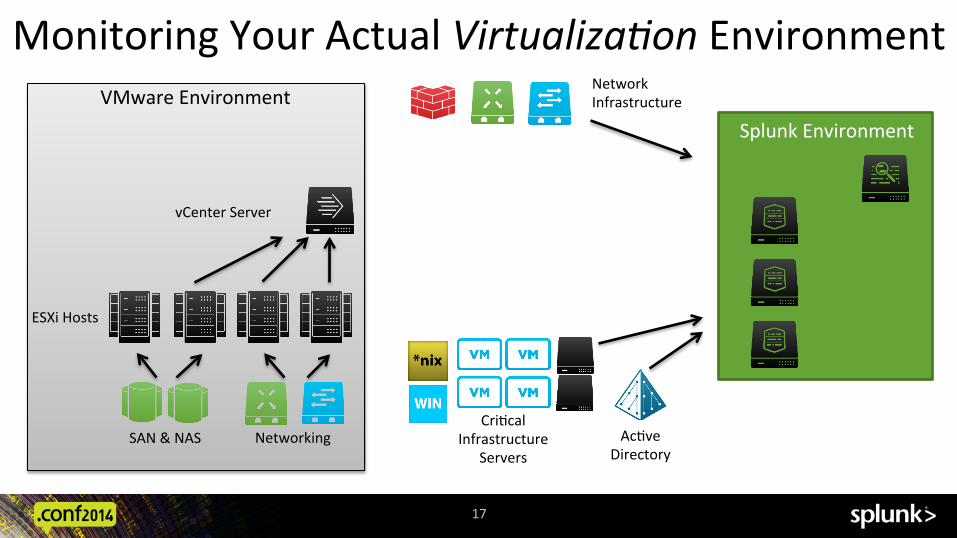
vCenter Server
ESXi Hosts
VMware Environment
SAN & NAS
Splunk Environment
Network Infrastructure
Virtual Servers: Web, middleware, apps
Cri@cal Infrastructure
Servers Networking Ac@ve
Directory
Monitoring Your Actual Virtualiza&on Environment
18
vCenter Server
ESXi Hosts
VMware Environment
SAN & NAS
Splunk Environment
Network Infrastructure
Virtual Servers: Web, middleware, apps
Cri@cal Infrastructure
Servers Networking Ac@ve
Directory
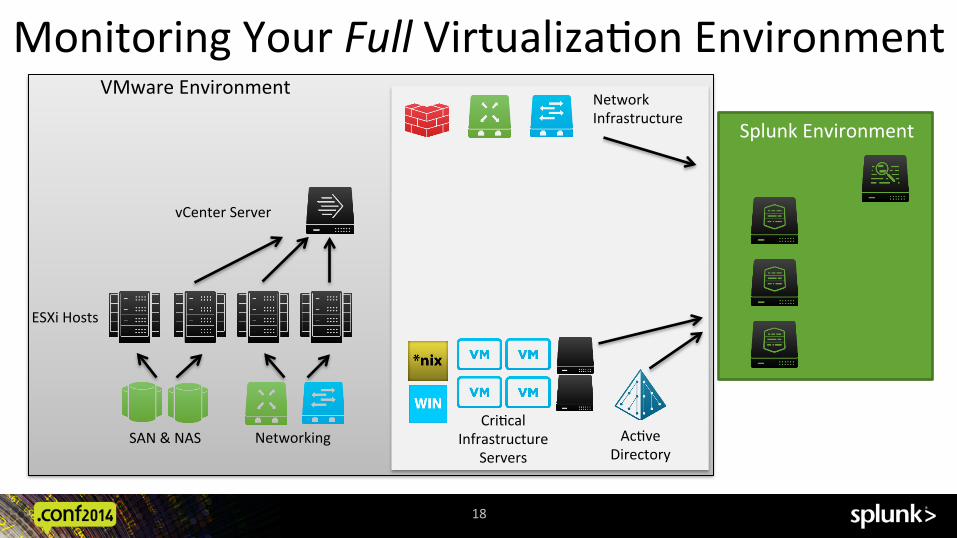
Monitoring Your Full Virtualiza@on Environment
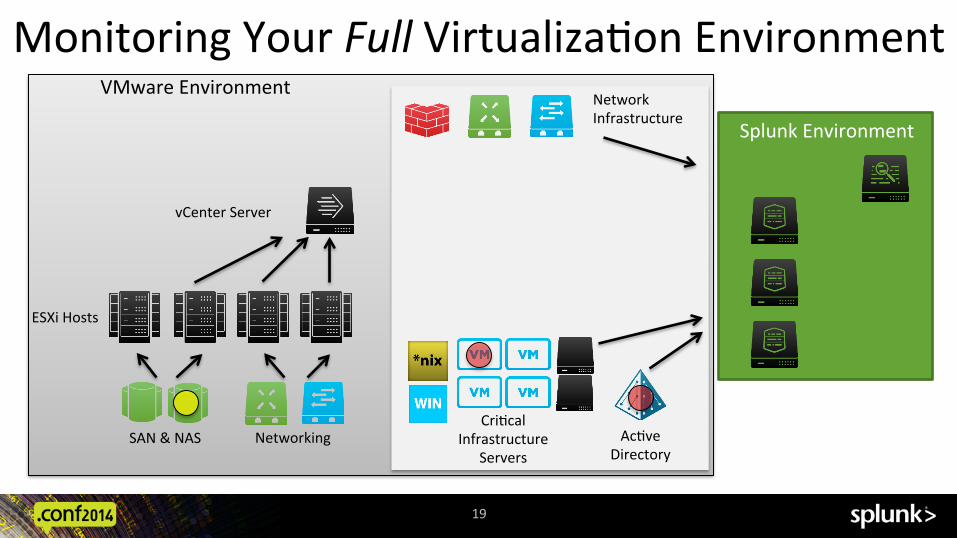
19
vCenter Server
ESXi Hosts
Monitoring Your Full Virtualiza@on Environment VMware Environment
SAN & NAS
Splunk Environment
Network Infrastructure
Virtual Servers: Web, middleware, apps
Cri@cal Infrastructure
Servers Networking Ac@ve
Directory

Storage Insights
Splunk App for NetApp Data ONTAP
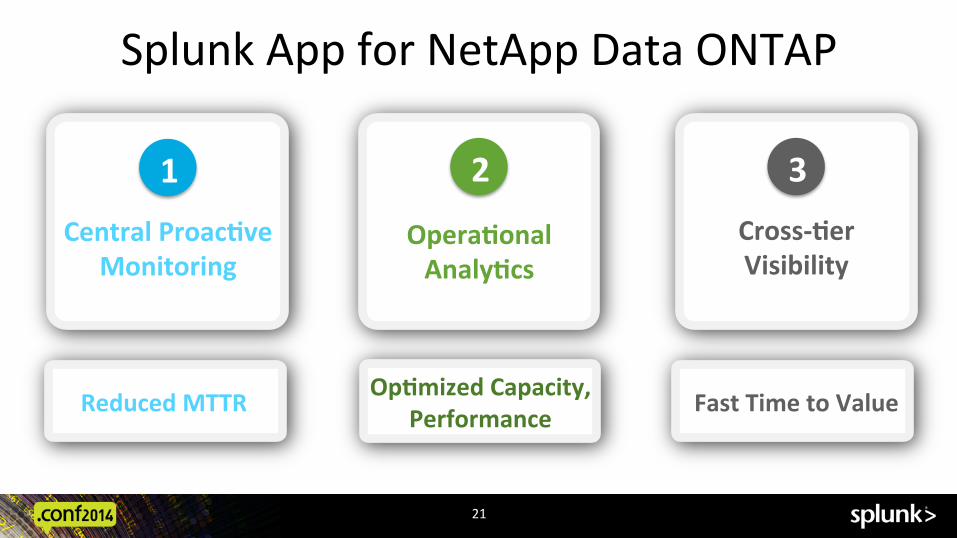
21
OperaEonal AnalyEcs
Cross-‐Eer Visibility
1 2 3
Central ProacEve Monitoring
Reduced MTTR OpEmized Capacity, Performance Fast Time to Value
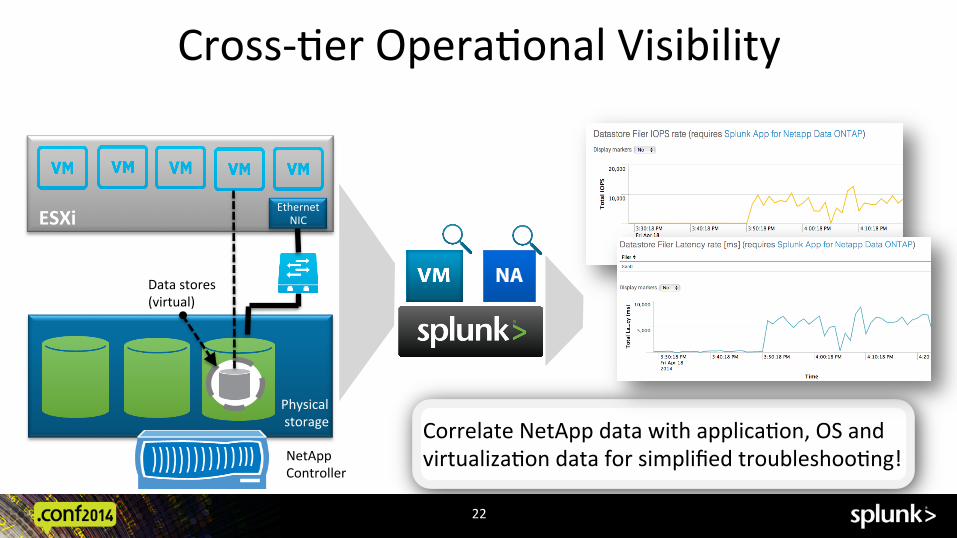
Cross-‐@er Opera@onal Visibility
22
ESXi Ethernet
NIC
Correlate NetApp data with applica@on, OS and virtualiza@on data for simplified troubleshoo@ng! NetApp
Controller
Physical storage
Data stores (virtual)
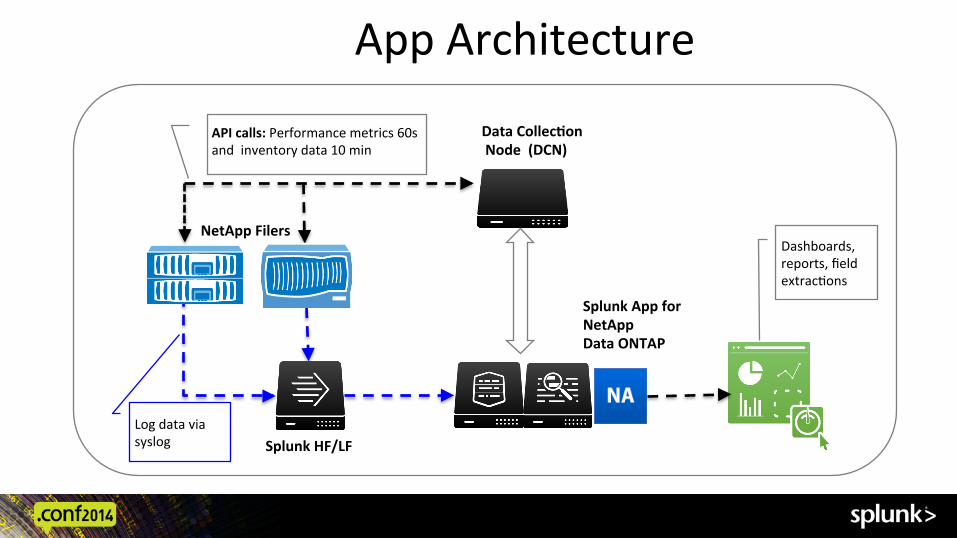
App Architecture
Splunk HF/LF
API calls: Performance metrics 60s and inventory data 10 min
Data CollecEon Node (DCN)
Dashboards, reports, field extrac@ons
Splunk App for NetApp Data ONTAP
Log data via syslog
NetApp Filers
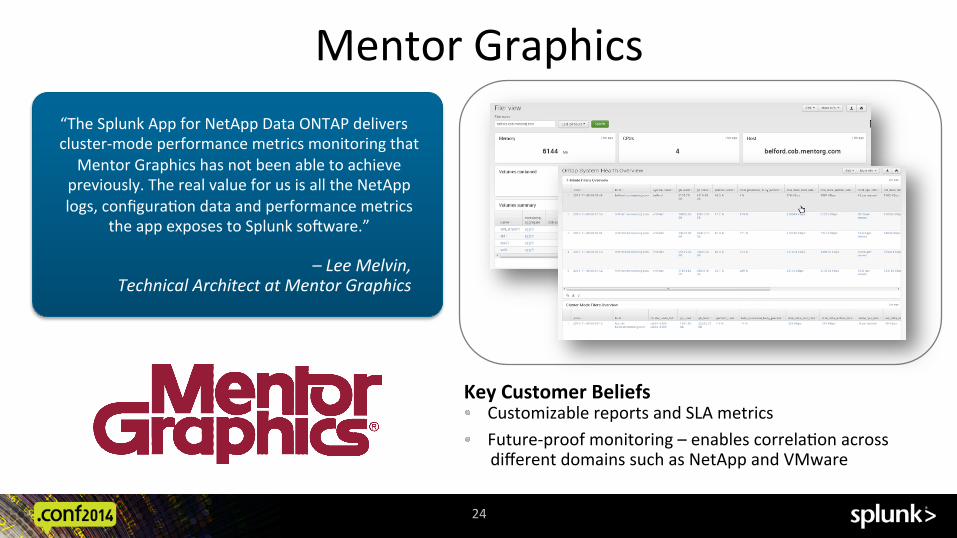
Mentor Graphics
– Lee Melvin, Technical Architect at Mentor Graphics
“The Splunk App for NetApp Data ONTAP delivers cluster-‐mode performance metrics monitoring that
Mentor Graphics has not been able to achieve previously. The real value for us is all the NetApp logs, configura@on data and performance metrics
the app exposes to Splunk soUware.”
Key Customer Beliefs ! Customizable reports and SLA metrics ! Future-‐proof monitoring – enables correla@on across
different domains such as NetApp and VMware
24
INSERT DASHBOARD
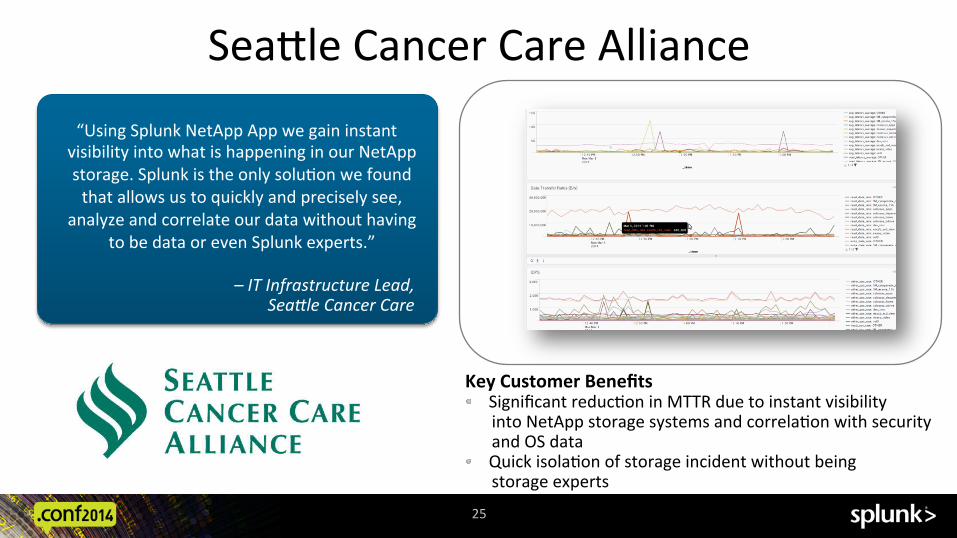
Sealle Cancer Care Alliance
– IT Infrastructure Lead, SeaJle Cancer Care
“Using Splunk NetApp App we gain instant visibility into what is happening in our NetApp storage. Splunk is the only solu@on we found that allows us to quickly and precisely see,
analyze and correlate our data without having to be data or even Splunk experts.”
Key Customer Benefits ! Significant reduc@on in MTTR due to instant visibility
into NetApp storage systems and correla@on with security and OS data
! Quick isola@on of storage incident without being storage experts
25
INSERT DASHBOARD
Integrated Insights Demo: Applica@ons, Virtualiza@on, Storage and OS
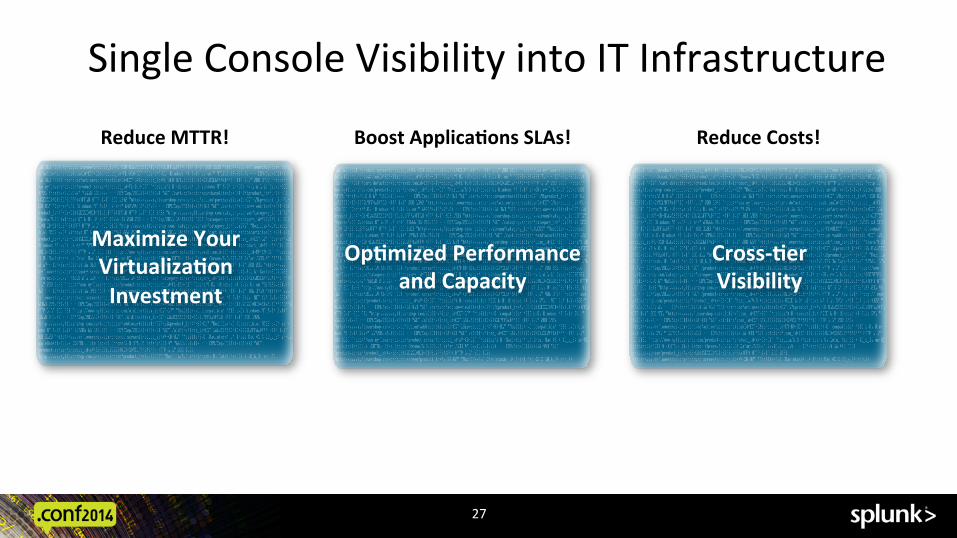
Single Console Visibility into IT Infrastructure
27
Reduce MTTR! Reduce Costs! Boost ApplicaEons SLAs!
OpEmized Performance and Capacity
Cross-‐Eer Visibility
Maximize Your VirtualizaEon Investment
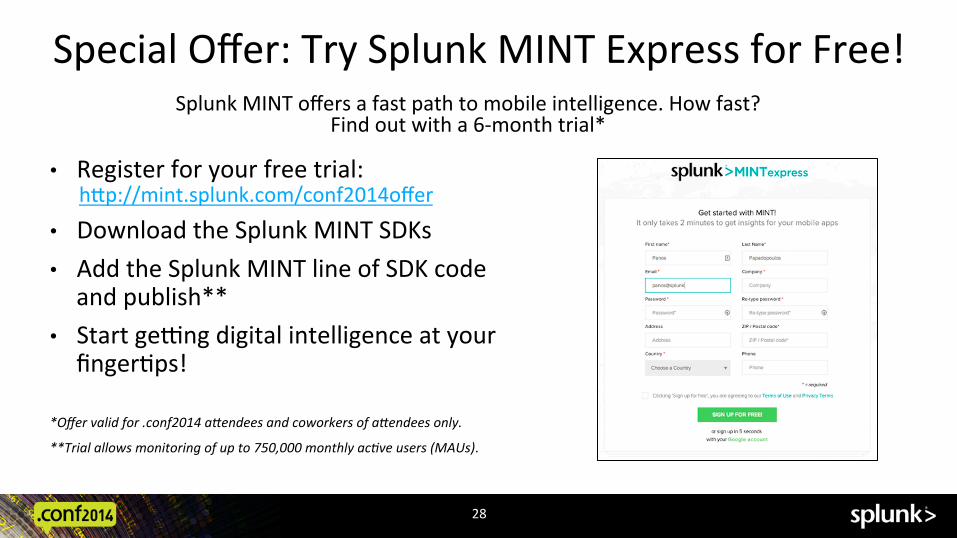
Special Offer: Try Splunk MINT Express for Free! Splunk MINT offers a fast path to mobile intelligence. How fast?
Find out with a 6-‐month trial*
• Register for your free trial: hlp://mint.splunk.com/conf2014offer
• Download the Splunk MINT SDKs • Add the Splunk MINT line of SDK code and publish**
• Start geIng digital intelligence at your finger@ps!
*Offer valid for .conf2014 aJendees and coworkers of aJendees only.
**Trial allows monitoring of up to 750,000 monthly ac&ve users (MAUs).
28

Thank You

Backup slides: Donnelly
31
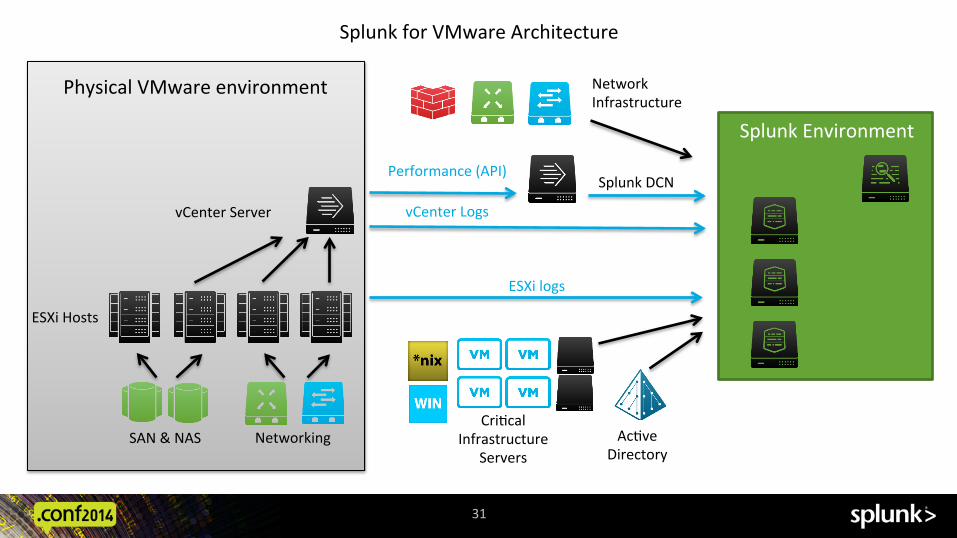
vCenter Server
ESXi Hosts
Splunk for VMware Architecture
Physical VMware environment
Splunk DCN
SAN & NAS
Splunk Environment
Network Infrastructure
Performance (API)
Ac@ve Directory
Cri@cal Infrastructure
Servers Networking
vCenter Logs
ESXi logs
32
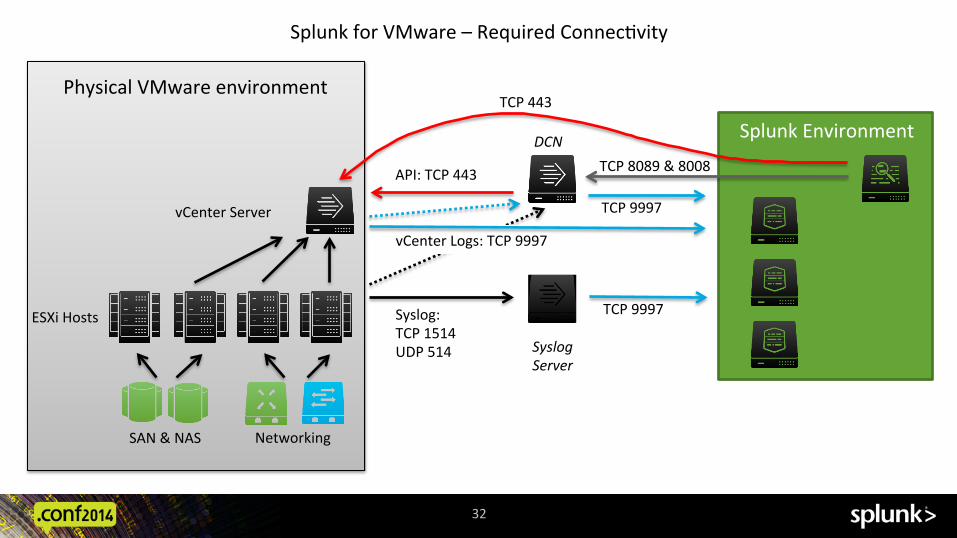
vCenter Server
ESXi Hosts
Splunk for VMware – Required Connec@vity
Physical VMware environment
SAN & NAS
Splunk Environment
API: TCP 443
Networking
TCP 8089 & 8008
TCP 9997
vCenter Logs: TCP 9997
Syslog: TCP 1514 UDP 514
TCP 9997
DCN
Syslog Server
TCP 443

Deployment notes
33
! All of the ports men@oned in the previous slide are the default ports; Splunk can be adapted to use alternates
! If you’re using search head pooling – there are addi@onal details covered in the installa@on guide. You must use a dedicated search head (not pooled) to act as the Data Collec@on Scheduler
! During installa@on, the DCN will be configured either by SSH or remote console access; addi@onal configura@on is done via the Splunk web UI on TCP port 8000. Ensure that access by SSH/8000 or by CLI via console will be possible

Backup Slides: Stela
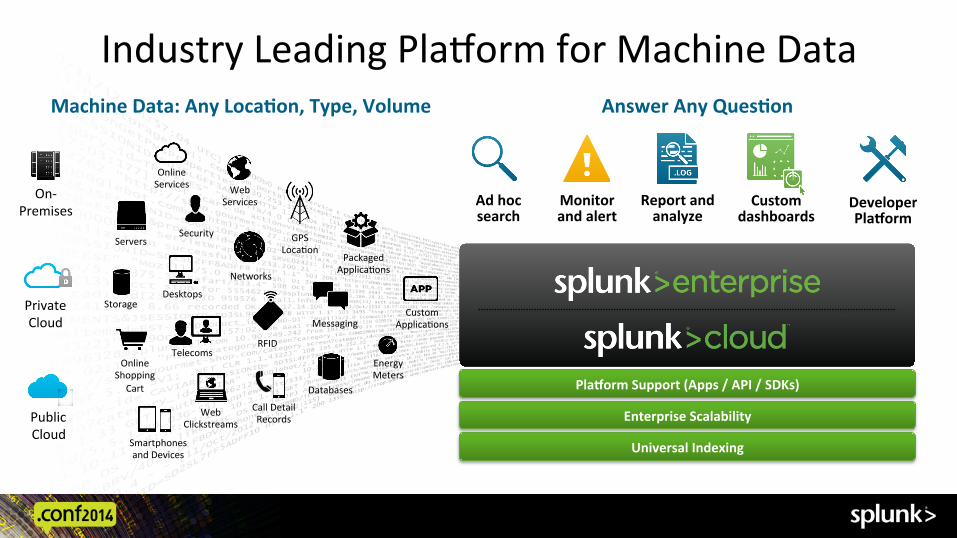
Industry Leading Plazorm for Machine Data Machine Data: Any LocaEon, Type, Volume
Online Services Web
Services
Servers Security GPS
Loca@on
Storage Desktops
Networks
Packaged Applica@ons
Custom Applica@ons Messaging
Telecoms Online
Shopping Cart
Web Clickstreams
Databases
Energy Meters
Call Detail Records
Smartphones and Devices
RFID
On-‐ Premises
Private Cloud
Public Cloud
Plaborm Support (Apps / API / SDKs)
Enterprise Scalability
Universal Indexing
Answer Any QuesEon
Developer Plaborm
Report and analyze
Custom dashboards
Monitor and alert
Ad hoc search
Any amount, any loca@on, any source
Schema-‐on-‐the-‐fly
Universal indexing
No back-‐end RDBMS
No need to filter data
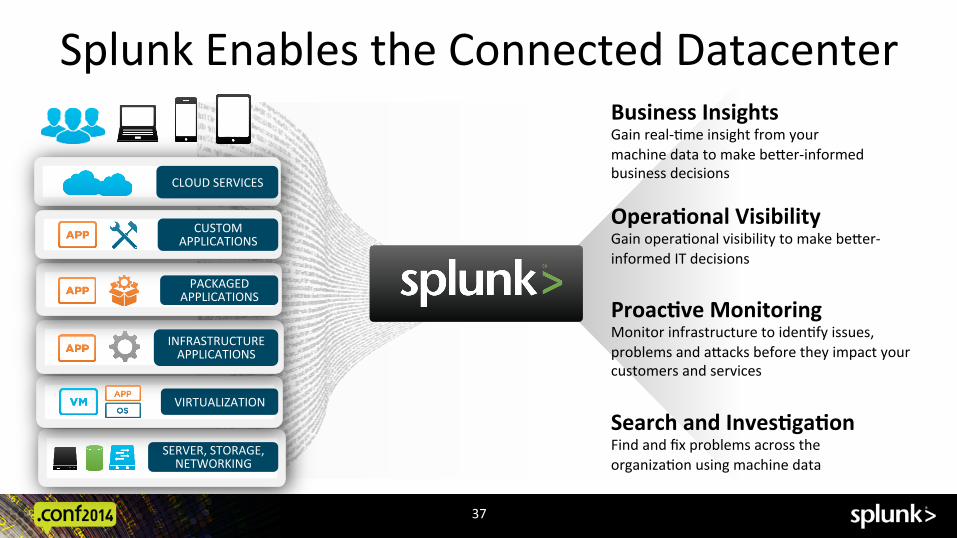
Splunk Enables the Connected Datacenter
37
SERVER, STORAGE, NETWORKING
VIRTUALIZATION
INFRASTRUCTURE APPLICATIONS
PACKAGED APPLICATIONS
CUSTOM APPLICATIONS
CLOUD SERVICES
OperaEonal Visibility Gain opera@onal visibility to make beler-‐informed IT decisions
ProacEve Monitoring Monitor infrastructure to iden@fy issues, problems and alacks before they impact your customers and services
Search and InvesEgaEon Find and fix problems across the organiza@on using machine data
Business Insights Gain real-‐@me insight from your machine data to make beler-‐informed business decisions
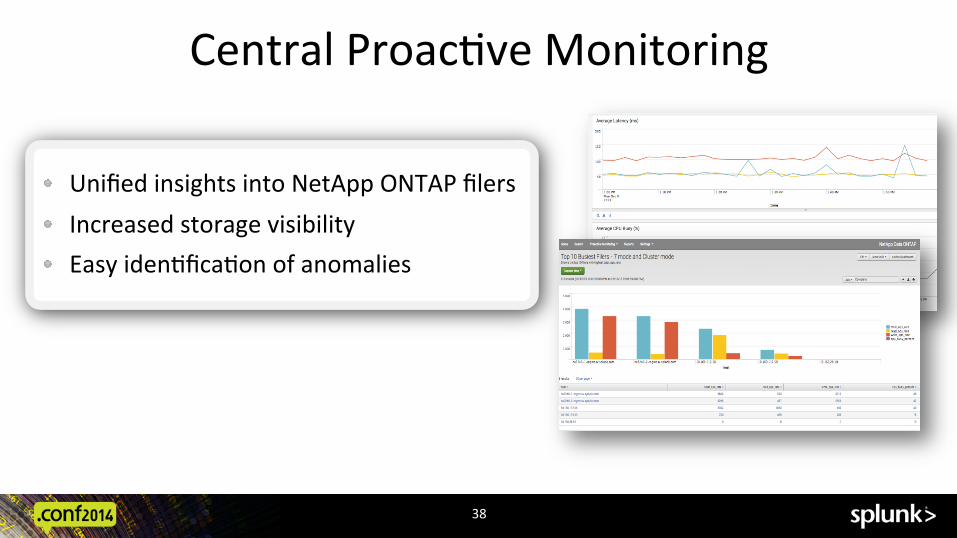
Central Proac@ve Monitoring
38
! Unified insights into NetApp ONTAP filers ! Increased storage visibility ! Easy iden@fica@on of anomalies
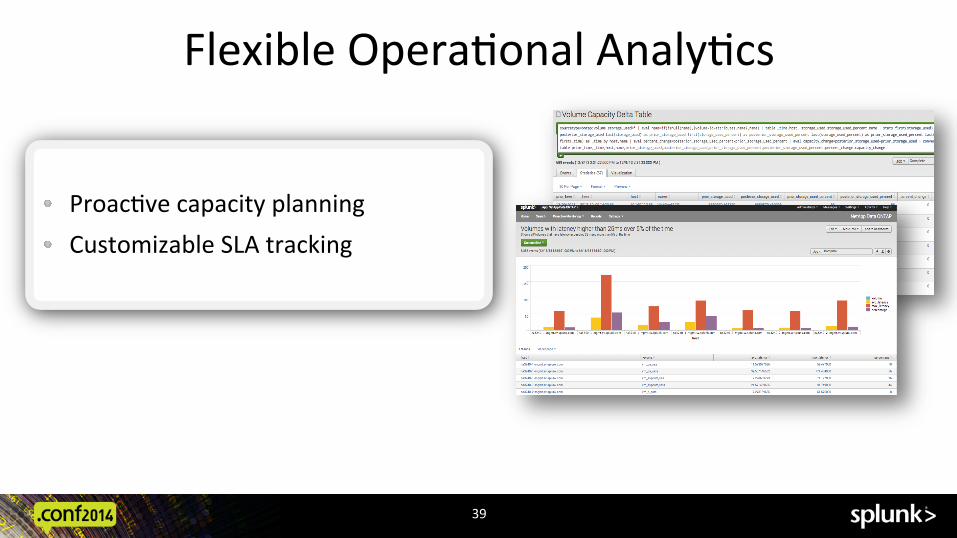
Flexible Opera@onal Analy@cs
39
! Proac@ve capacity planning ! Customizable SLA tracking
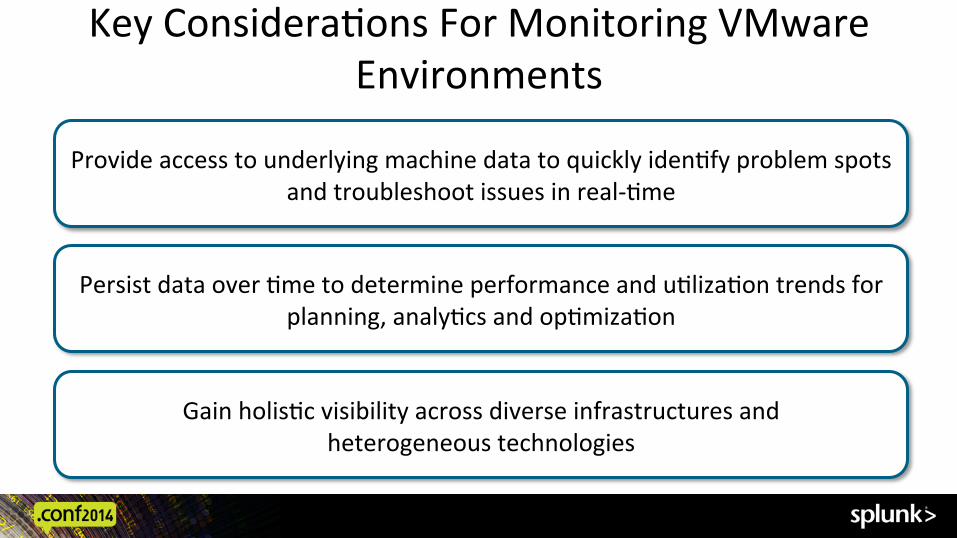
Provide access to underlying machine data to quickly iden@fy problem spots and troubleshoot issues in real-‐@me
Persist data over @me to determine performance and u@liza@on trends for planning, analy@cs and op@miza@on
Gain holis@c visibility across diverse infrastructures and heterogeneous technologies
Key Considera@ons For Monitoring VMware Environments
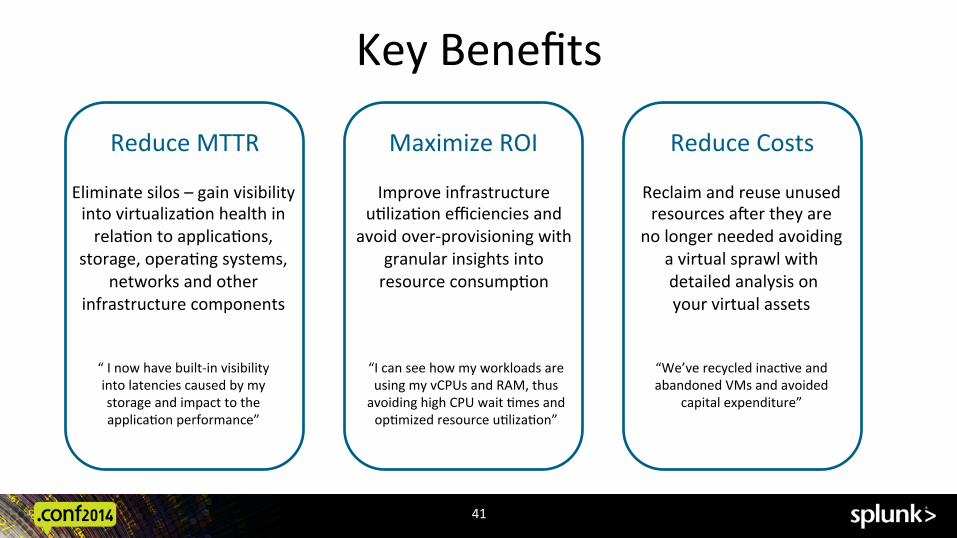
Key Benefits
41
Reduce MTTR
Eliminate silos – gain visibility into virtualiza@on health in rela@on to applica@ons,
storage, opera@ng systems, networks and other
infrastructure components
Maximize ROI
Improve infrastructure u@liza@on efficiencies and
avoid over-‐provisioning with granular insights into resource consump@on
Reduce Costs
Reclaim and reuse unused resources aUer they are
no longer needed avoiding a virtual sprawl with detailed analysis on your virtual assets
“ I now have built-‐in visibility into latencies caused by my storage and impact to the applica@on performance”
“I can see how my workloads are using my vCPUs and RAM, thus avoiding high CPU wait @mes and op@mized resource u@liza@on”
“We’ve recycled inac@ve and abandoned VMs and avoided
capital expenditure”