![arXiv:2004.11648v1 [cs.CL] 24 Apr 2020 · 2:::s jgbe a set of tweet stories, and U = fu 1;u 2:::u jUgbe a set of users. Each s i 2Graph is a short-text document (also called the source](https://static.fdocuments.in/doc/165x107/6054daed9183662281633d8a/arxiv200411648v1-cscl-24-apr-2020-2s-jgbe-a-set-of-tweet-stories-and-u.jpg)
Splash Screen Lesson 5 Contents Example 1Identify Linear Equations Example 2Graph by Making a Table...
15
-
Upload
harvey-andrews -
Category
Documents
-
view
218 -
download
0
Transcript of Splash Screen Lesson 5 Contents Example 1Identify Linear Equations Example 2Graph by Making a Table...


Example 1 Identify Linear Equations
Example 2 Graph by Making a Table
Example 3 Use the Graph of a Linear Equation
Example 4 Graph Using Intercepts
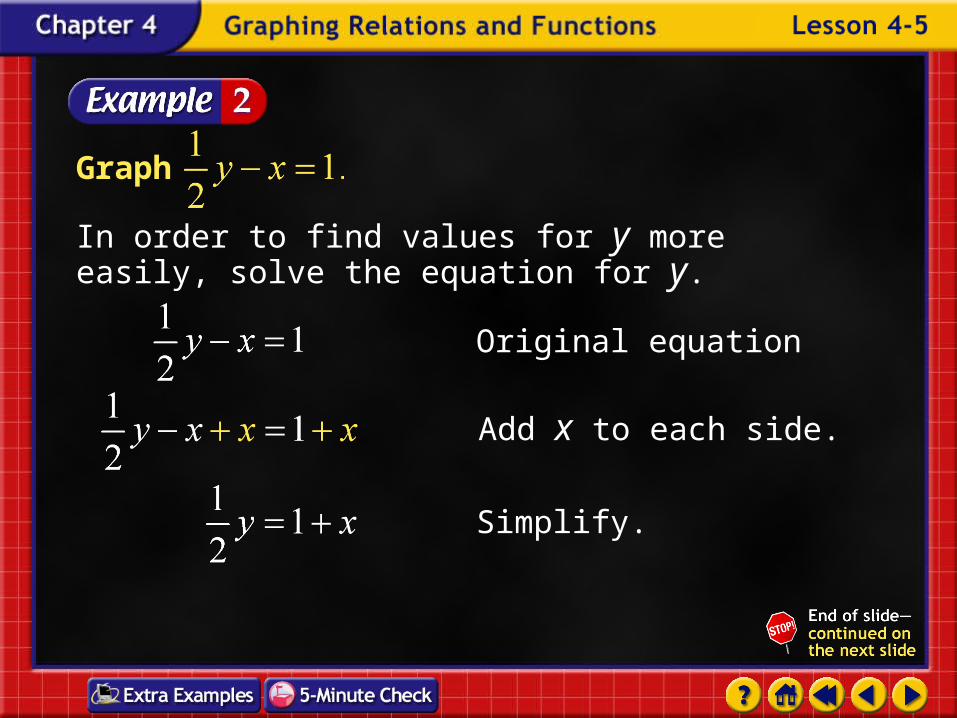
Graph
In order to find values for y more easily, solve the equation for y.
Original equation
Add x to each side.
Simplify.
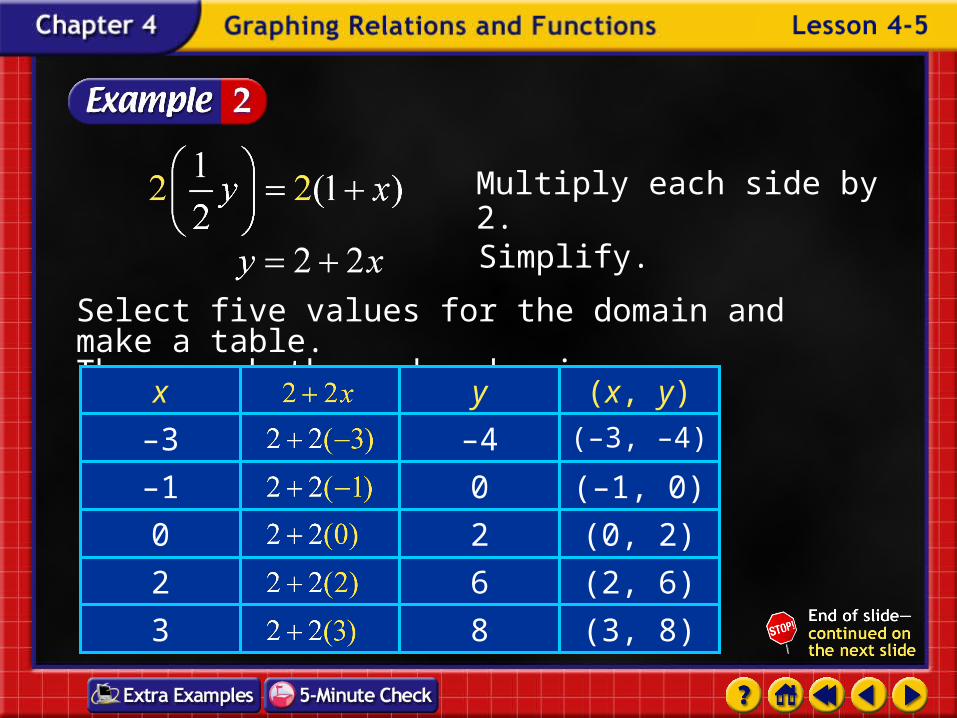
Select five values for the domain and make a table.Then graph the ordered pairs.
Multiply each side by 2.
Simplify.
(3, 8)83
(2, 6)62
(0, 2)20
(–1, 0)0–1
(–3, –4)–4–3
(x, y)yx

Answer:
When you graph the ordered pairs, a pattern begins to form. The domain ofis the set of all real numbers, so there are an infinite number of solutions of the equation. Draw a line through the points. This line represents all the solutions of .

Answer:
.
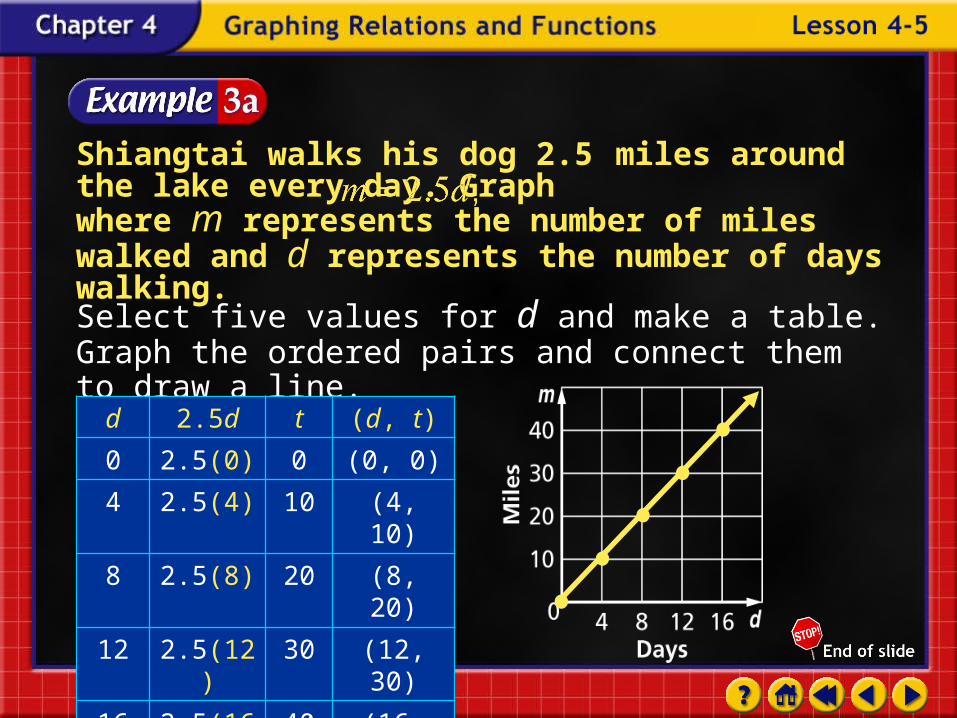
Shiangtai walks his dog 2.5 miles around the lake every day. Graph where m represents the number of miles walked and d represents the number of days walking.
Select five values for d and make a table. Graph the ordered pairs and connect them to draw a line.
d 2.5d t (d, t)
0 2.5(0) 0 (0, 0)
4 2.5(4) 10 (4, 10)
8 2.5(8) 20 (8, 20)
12 2.5(12) 30 (12, 30)
16 2.5(16) 40 (16, 40)

Suppose Shiangtai wanted to walk 50 miles, how many days would it take him?
Since any point on the line is a solution of the equation, use the graph to estimate the value of the x-coordinate in the ordered pair that contains 50 as the y-coordinate.
Answer: The ordered pair (20, 50) appears to be on the line so it should take Shiangtai 20 days to walk 50 miles. Check this solution algebraically by substituting (20, 50) into the original equation.

Lily rides her bike 3.5 miles every day.
a. Graph the equation where m represents the number of miles Lily ridesand d represents thenumber of days she rides.
b. Suppose Lily wanted to ride28 miles, how many dayswould it take her?
Answer:
Answer: 8 days
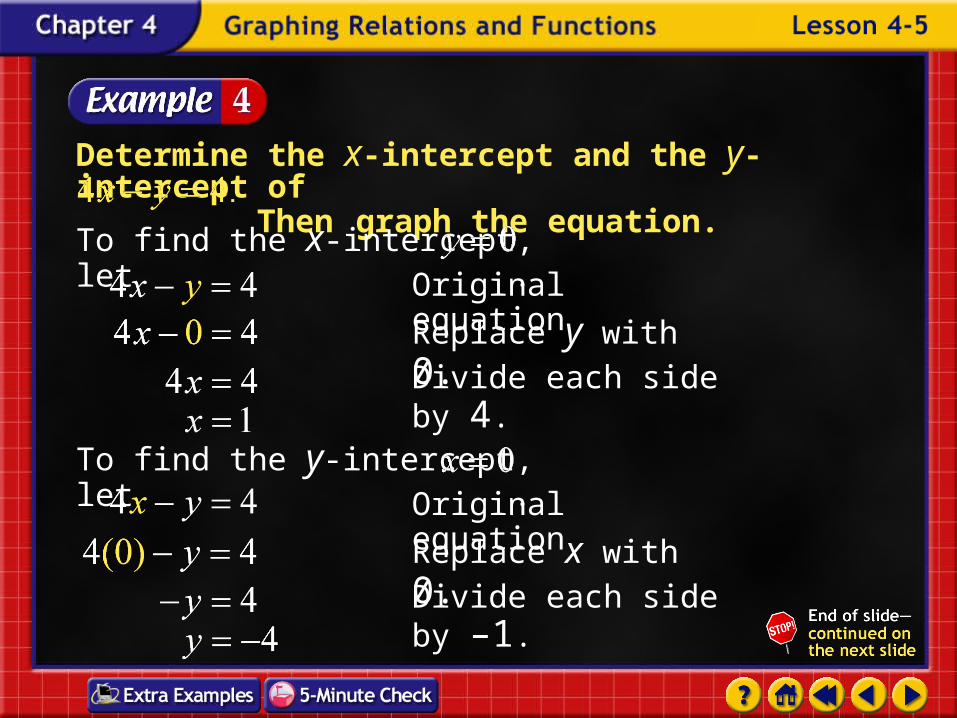
Determine the x-intercept and the y-intercept of Then graph the equation.
To find the x-intercept, let .
Original equation
Replace y with 0.Divide each side by 4.
To find the y-intercept, let .
Original equation
Replace x with 0.Divide each side by –1.

Answer: The x-intercept is 1, so the graph intersects the x-axis at (1, 0). The y-intercept is –4, so the graph intersects the y-axis at (0, –4).Plot these points. Then draw a line that connects them.

Determine the x-intercept and the y-intercept of. Then graph the equation.
Answer: x-intercept (5, 0); y-intercept (0, 2)


End of Custom Shows
WARNING! Do Not RemoveThis slide is intentionally blank and is set to auto-advance to end
custom shows and return to the main presentation.