SPINETORAM (233) EXPLANATION IDENTITY · Spinetoram 1639 SPINETORAM (233) First draft prepared by...
140
Spinetoram 1639 SPINETORAM (233) First draft prepared by Dr. Yukiko Yamada, Ministry of Agriculture, Forestry and Fisheries, Tokyo, Japan EXPLANATION Spinetoram, a multi-component tetracyclic macrolide in the class of spinosyn insecticides, was developed for the control of lepidopterous larvae, leafminers, and thrips on a variety of crops. Its mode of action is disruption of nicotinic/gamma amino butyric acid-gated chloride channels. It was identified as a priority new compound at the 39 th Session of the CCPR in 2007 (ALINORM 07/30/24-Rev.1) for evaluation by the 2008 JMPR. The Meeting received information on physical and chemical properties, animal and plant metabolism, environmental fate, analytical methods, storage stability, use patterns, supervised trials, processing and farm animal feeding. IDENTITY Spinetoram consists of two closely related active ingredients, as shown below, present approximately in a three to one ratio. The term spinetoram is used interchangeably for the combination of these two compounds. Spinetoram is a chemically-modified fermentation product of Saccharopolyspora spinosa. ISO common name: Spinetoram (Mixture of two main components as shown below) Chemical name Major component (XDE-175-J) (2R,3aR,5aR,5bS,9S,13S,14R,16aS, 16bR)-2-(6-deoxy-3-O- ethyl-2,4-di-O-methyl-α-L-mannopyranosyloxy)-13- [(2R,5S,6R)-5-(dimethylamino)tetrahydro-6-methylpyran-2- yloxy]-9-ethyl-2,3,3a,4,5,5a,5b,6,9,10,11,12,13,14,16a,16b- hexadecahydro-14-methyl-1H-as-indaceno[3,2- d]oxacyclododecine-7,15-dione IUPAC: Minor component (XDE-175-L) (2R,3aR,5aS,5bS,9S,13S,14R,16aS, 16bS)-2-(6-deoxy-3-O- ethyl-2,4-di-O-methyl-α-L-mannopyranosyloxy)-13- [(2R,5S,6R)-5-(dimethylamino)tetrahydro-6-methylpyran-2- yloxy]-9-ethyl-2,3,3a,5a,5b,6,9,10,11,12,13,14,16a,16b- tetradecahydro-4,14-dimethyl-1H-as-indaceno[3,2- d]oxacyclododecine-7,15-dione Major component (XDE-175-J) (2R,3aR,5aR,5bS,9S,13S,14R,16aS, 16bR)-2-[(6-deoxy-3-O- ethyl-2,4-di-O-methyl-α-L-mannopyranosyl)oxy]-13- [[(2R,5S,6R)-5-(dimethylamino)tetrahydro-6-methyl-2H- pyran-2-yl]oxy]-9-ethyl- 2,3,3a,4,5,5a,5b,6,9,10,11,12,13,14,16a,16b-hexadecahydro- 14-methyl-1H-as-indaceno[3,2-d]oxacyclododecine-7,15- dione CAS: Minor component (XDE-175-L) (2R,3aR,5aS,5bS,9S,13S,14R,16aS, 16bS)-2-[(6-deoxy-3-O- ethyl-2,4-di-O-methyl-α-L-mannopyranosyl)oxy]-13- [(2R,5S,6R)-5-(dimethylamino)tetrahydro-6-methyl-2H- pyran-2-yl]oxy]-9-ethyl- 2,3,3a,5a,5b,6,9,10,11,12,13,14,16a,16b-tetradecahydro- 4,14-dimethyl-1H-as-indaceno[3,2-d]oxacyclododecine- 7,15-dione
-
Upload
trinhtuong -
Category
Documents
-
view
234 -
download
0
Transcript of SPINETORAM (233) EXPLANATION IDENTITY · Spinetoram 1639 SPINETORAM (233) First draft prepared by...

Spinetoram 1639
SPINETORAM (233)
First draft prepared by Dr. Yukiko Yamada, Ministry of Agriculture, Forestry and Fisheries, Tokyo,
Japan
EXPLANATION
Spinetoram, a multi-component tetracyclic macrolide in the class of spinosyn insecticides, was developed for the control of lepidopterous larvae, leafminers, and thrips on a variety of crops. Its mode of action is disruption of nicotinic/gamma amino butyric acid-gated chloride channels.
It was identified as a priority new compound at the 39th Session of the CCPR in 2007 (ALINORM 07/30/24-Rev.1) for evaluation by the 2008 JMPR. The Meeting received information on physical and chemical properties, animal and plant metabolism, environmental fate, analytical methods, storage stability, use patterns, supervised trials, processing and farm animal feeding.
IDENTITY
Spinetoram consists of two closely related active ingredients, as shown below, present approximately in a three to one ratio. The term spinetoram is used interchangeably for the combination of these two compounds. Spinetoram is a chemically-modified fermentation product of Saccharopolyspora
spinosa.
ISO common name: Spinetoram
(Mixture of two main components as shown below)
Chemical name
Major component
(XDE-175-J)
(2R,3aR,5aR,5bS,9S,13S,14R,16aS, 16bR)-2-(6-deoxy-3-O-ethyl-2,4-di-O-methyl-α-L-mannopyranosyloxy)-13-[(2R,5S,6R)-5-(dimethylamino)tetrahydro-6-methylpyran-2-yloxy]-9-ethyl-2,3,3a,4,5,5a,5b,6,9,10,11,12,13,14,16a,16b-hexadecahydro-14-methyl-1H-as-indaceno[3,2-d]oxacyclododecine-7,15-dione
IUPAC:
Minor component
(XDE-175-L)
(2R,3aR,5aS,5bS,9S,13S,14R,16aS, 16bS)-2-(6-deoxy-3-O-ethyl-2,4-di-O-methyl-α-L-mannopyranosyloxy)-13-[(2R,5S,6R)-5-(dimethylamino)tetrahydro-6-methylpyran-2-yloxy]-9-ethyl-2,3,3a,5a,5b,6,9,10,11,12,13,14,16a,16b-tetradecahydro-4,14-dimethyl-1H-as-indaceno[3,2-d]oxacyclododecine-7,15-dione
Major component
(XDE-175-J)
(2R,3aR,5aR,5bS,9S,13S,14R,16aS, 16bR)-2-[(6-deoxy-3-O-ethyl-2,4-di-O-methyl-α-L-mannopyranosyl)oxy]-13-[[(2R,5S,6R)-5-(dimethylamino)tetrahydro-6-methyl-2H-pyran-2-yl]oxy]-9-ethyl-2,3,3a,4,5,5a,5b,6,9,10,11,12,13,14,16a,16b-hexadecahydro-14-methyl-1H-as-indaceno[3,2-d]oxacyclododecine-7,15-dione
CAS:
Minor component
(XDE-175-L)
(2R,3aR,5aS,5bS,9S,13S,14R,16aS, 16bS)-2-[(6-deoxy-3-O-ethyl-2,4-di-O-methyl-α-L-mannopyranosyl)oxy]-13-[(2R,5S,6R)-5-(dimethylamino)tetrahydro-6-methyl-2H-pyran-2-yl]oxy]-9-ethyl-2,3,3a,5a,5b,6,9,10,11,12,13,14,16a,16b-tetradecahydro-4,14-dimethyl-1H-as-indaceno[3,2-d]oxacyclododecine-7,15-dione

1640 Spinetoram
XDE-175-J 187166-40-1 CAS Registry No.:
XDE-175-L 187166-15-0
CIPAC No.: 802
Synonyms for active substance:
X574175 (2003-2004)
XDE-175 (2004-2007)
DE-175 (2007-)
Structural formula: XDE-175-J
H
O
O
O O H
C H 3
H H H
O
O
O
O
O
O
N
XDE-175-L
O
O
O
O
H
O
O
O
O H
CH3
H HH
O
O
N
XDE-175-J C42H69NO10 Molecular formula:
XDE-175-L C43H69NO10
XDE-175-J 748.02 Molecular weight:
XDE-175-L 760.03
PHYSICAL AND CHEMICAL PROPERTIES
Pure active ingredient
Property Results Reference XDE-175-J XDE-175-L Appearance: White powder White to yellow crystals Jennings, 2007, FAPC
73363 & FAPC 73364 Odour: Odourless Almond odour Jennings, 2007, FAPC
73363 & FAPC 73364 Melting point: 143.4 °C 70.8 °C Madsen & Jennings, 2005
FAPC-052-002 & FAPC-052-003
Relative density:
1.1495 g/cm3 at 19.5 °C 1.1807 g/cm3 at 20.1 °C Tunink, 2006 NAFST-06-134
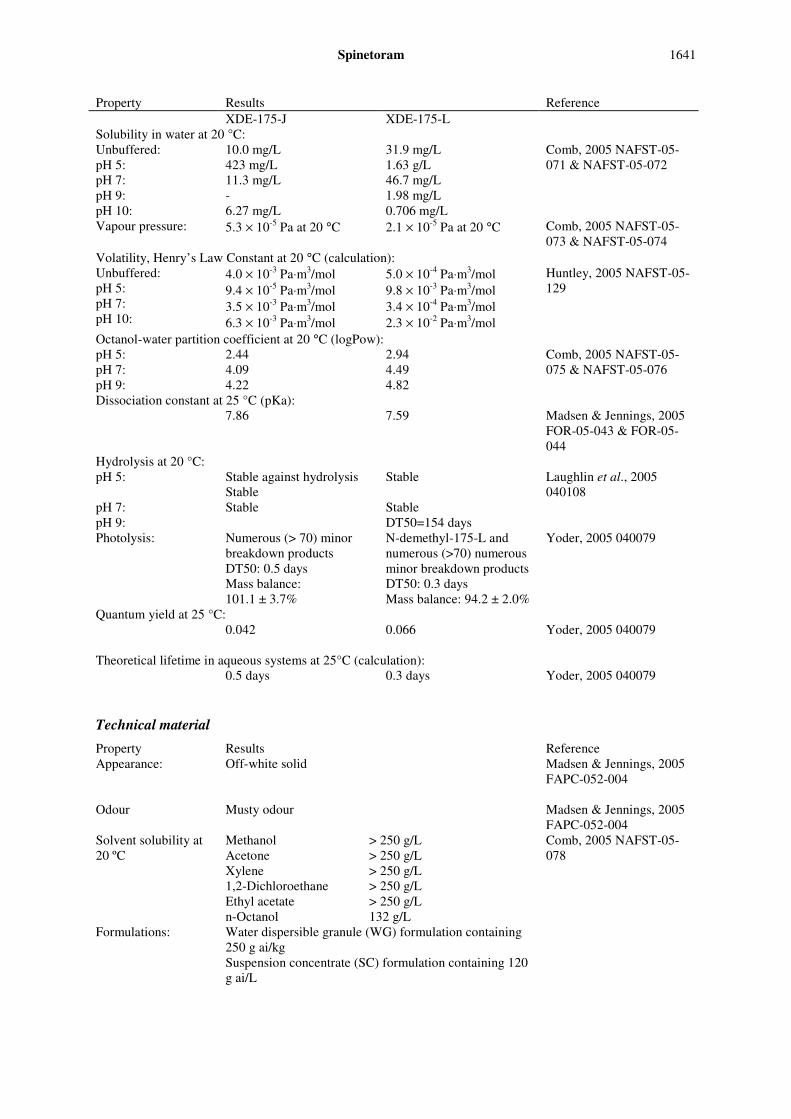
Spinetoram 1641
Property Results Reference XDE-175-J XDE-175-L Solubility in water at 20 °C: Unbuffered: pH 5: pH 7: pH 9: pH 10:
10.0 mg/L 423 mg/L 11.3 mg/L - 6.27 mg/L
31.9 mg/L 1.63 g/L 46.7 mg/L 1.98 mg/L 0.706 mg/L
Comb, 2005 NAFST-05-071 & NAFST-05-072
Vapour pressure: 5.3 × 10⁻⁵ Pa at 20 °C 2.1 × 10⁻⁵ Pa at 20 °C Comb, 2005 NAFST-05-073 & NAFST-05-074
Volatility, Henry’s Law Constant at 20 °C (calculation): Unbuffered: pH 5: pH 7: pH 10:
4.0 × 10⁻³ Pa⋅m3/mol 9.4 × 10⁻⁵ Pa⋅m3/mol 3.5 × 10⁻³ Pa⋅m3/mol 6.3 × 10⁻³ Pa⋅m3/mol
5.0 × 10⁻⁴ Pa⋅m3/mol 9.8 × 10⁻³ Pa⋅m3/mol 3.4 × 10⁻⁴ Pa⋅m3/mol 2.3 × 10⁻² Pa⋅m3/mol
Huntley, 2005 NAFST-05-129
Octanol-water partition coefficient at 20 °C (logPow): pH 5: pH 7: pH 9:
2.44 4.09 4.22
2.94 4.49 4.82
Comb, 2005 NAFST-05-075 & NAFST-05-076
Dissociation constant at 25 °C (pKa): 7.86 7.59 Madsen & Jennings, 2005
FOR-05-043 & FOR-05-044
Hydrolysis at 20 °C: pH 5: pH 7: pH 9:
Stable against hydrolysis Stable Stable
Stable Stable DT50=154 days
Laughlin et al., 2005 040108
Photolysis: Numerous (> 70) minor breakdown products DT50: 0.5 days Mass balance: 101.1 ± 3.7%
N-demethyl-175-L and numerous (>70) numerous minor breakdown products DT50: 0.3 days Mass balance: 94.2 ± 2.0%
Yoder, 2005 040079
Quantum yield at 25 °C: 0.042 0.066
Yoder, 2005 040079
Theoretical lifetime in aqueous systems at 25°C (calculation): 0.5 days 0.3 days Yoder, 2005 040079
Technical material
Property Results Reference Appearance: Off-white solid Madsen & Jennings, 2005
FAPC-052-004 Odour Musty odour Madsen & Jennings, 2005
FAPC-052-004 Solvent solubility at 20 ºC
Methanol > 250 g/L Acetone > 250 g/L Xylene > 250 g/L 1,2-Dichloroethane > 250 g/L Ethyl acetate > 250 g/L n-Octanol 132 g/L
Comb, 2005 NAFST-05-078
Formulations: Water dispersible granule (WG) formulation containing 250 g ai/kg Suspension concentrate (SC) formulation containing 120 g ai/L

1642 Spinetoram
METABOLISM AND ENVIRONMENTAL FATE
The following links manufacturer code number and structure or description of the compounds appearing in the various metabolism and environmental fate studies.
Structure of compounds appearing in metabolism and environmental fate studies
H
O
O
O O H
C H 3
H H H
O
O
O
O
O
O
N
H
O
O
O
O H
CH3
H HH
O
O
O
O
O
O
N
H
XDE-175-J
Plants, animals, soil, water, rotational crops
N-demethyl-175-J
Plants, animals, soil, water, rotational crops
H
O
O
O
O H
CH3
H HH
O
O
O
O
O
O
N
O
H
H
O
O
O
O H
CH3
H HH
O
O
O
O
OH
O
N
N-formyl-175-J Plants
3-O-deethyl-175-J
Plants
H
O
O
O
O H
CH3
H HH
OH
O
N
H
OH
O
O
O H
CH3
H HH
OH
C9-pseudoaglycone-175-J
Plants
Aglycone-175-J
Plants

Spinetoram 1643
H
OH
O
O
O H
CH3
H HH
O
O
O
O
O
H
O
O
O
O H
CH3
H HH
O
O
O
O
OH
O
N
C17-pseudoaglycone-175-J
Soil, plants
3’-O-deethyl-175-J
Animals
OH
O
H
O
O
O
O H
CH3
H HH
O
O
O
O
N
H
O
O
O
O H
CH3
H HH
O
O
O
OH
O
O
N
2’-O-demethyl-175-J
Animals
4’-O-demethyl-175-J
Animals
O
O
O
O
OH
O
O
O
O H
CH3
H HH
O
N
NO
O
O
O
O
H
O
O
O
O H
CH3
H HH
O
O
N
O
O
OH
N-demethyl-N-nitroso-175-J
Soil
N-succinyl-175-J
Soil
O
O
O
O
H
O
O
O
O H
CH3
H HH
O
O
N
H
O
O
O
O H
CH3
H HH
O
O
O
O
O
O
N
H
XDE-175-L
Plants, animals, soil, water, rotational crops
N-demethyl-175-L
Plants, animals, soil, water, rotational crops

1644 Spinetoram
H
O
O
O
O H
CH3
H HH
O
O
O
O
O
O
N
O
H
O
O
OH
O
OH
O
O
O
O H
CH3
H HH
O
N
N-formyl -175-L
Plants
3’-O-deethyl-175-L
Animals
O
O
O
OH
OH
O
O
O
O H
CH3
H HH
O
N
O
OH
O
O
H
O
O
O
O H
CH3
H HH
O
O
N
2’-O-demethyl-175-L
Animals
4’-O-demethyl-175-L
Animals
O
O
O
O
OH
O
O
O
O H
CH3
H HH
O
N
NO
O
O
O
O
H
O
O
O
O H
CH3
H HH
O
O
N
O
OH
O
N-demethyl-N-nitroso-175-L
Soil
N-succinyl-175-L
Soil
Radio-labelled XDE-175-J and XDE-175-J Used in Metabolism Studies
In plant and animal metabolism studies, XDE-175-J or XDE-175-L which were uniformly labelled with 14C in the macrolide ring was used. No radioactive carbon was incorporated into either sugar group.
Three forms of 14C-XDE-175-J produced through fermentation in the presence of 14C-acetate were combined to give a mixture of 1:1:1 ratio (w/w/w) with nominal specific activity of 11.62 µCi/mg (8.72 mCi/mmol or 429,940 Bq/mg. One form was ethylated at the 3'-position of the rhamnose and the 5,6-position of the macrolide ring then reduced to give 14C -XDE-175-J (INV1947). A second form was likewise reduced but was ethylated using a deuterated alkylating agent to give 14C-XDE-175-J (D5). A third form was ethylated in the same manner as the first but was reduced in

Spinetoram 1645
the presence of deuterium to give 14C-XDE-175-J (D2). These three forms aided in the mass spectrometric analyses of metabolites in confirming that peaks of interest were related to the test materials.
Two forms of 14C-XDE-175-L were combined to give a mixture of approximately one to one ratio (w/w) with nominal specific activity of 7.57 µCi/mg (5.77 mCi/mmol or 280,090 Bq/mg). One form was ethylated at the 3' position of the rhamnose to give 14C-XDE-175-L. A second form was ethylated using a deuterated alkylating agent to give 14C-XDE-175-L (D5). Since the 5,6-positions of the material cannot be reduced, there is no comparable D2 material formed. These two forms aided in the mass spectrometric analyses of metabolites confirming that peaks of interest were related to the test materials.
The following table shows the position of radioactive carbon in the test materials used.
Table 1 Radio-labelled compounds used in the metabolism studies
Name Structure 14C-XDE-175-J
H
O
O
O
O H
CH3
H HH
O
O
O
O
O
O
N
*
**
*
14C-XDE-175-J (D2)
H
O
O
O
O H
CH3
H HH
O
O
O
O
O
O
N
DH H D
*
**
*
14C-XDE-175-J (D5)
H
O
O
O
O H
CH3
H HH
O
O
O
O
O
O
N
DD
D
DD
**
**
14C-XDE-175-L
H
O
O
O
O H
CH3
H HH
O
O
O
O
O
O
N
**
**

1646 Spinetoram
Name Structure 14C-XDE-175-L (D5)
H
O
O
O
O H
CH3
H HH
O
O
O
O
O
O
N
DD
D
DD
**
**
Animal metabolism
The Meeting received information on the results of studies on lactating goats and laying hens.
Lactating goats: Two lactating goats (Alpine × Nubian Cross breed, 4 years old, 47-52 kg) were given oral doses of either 14C-XDE-175-J (14.9 mg/animal/day) or 14C-XDE-175-L (14.8 mg/animal/day) equivalent to 10–11 ppm in the total diet (on a dry weight basis) once daily via balling gun for five consecutive days (Magnussen, et. al., 2005; Report 040088). Milk was collected twice a day throughout the dosing period and urine and faeces at 24-h intervals. The mean daily milk production of the control, XDE-175-J treated or XDE-175-L treated goat was 1.01, 1.70 or 1.44 L respectively. Twenty-one hours (±1 h) after administering the final dose, the animals were sacrificed and liver, kidney, fat and muscle samples were collected for analysis.
Among excreta, a total of 51.1% of the administered radioactivity was recovered in faeces in the case of 14C-XDE-175-J and 78.3% in the case of 14C-XDE-175-L. A total radioactivity recovered in urine was not significant: 0.17% for 14C-XDE-175-J; and 0.03% for 14C-XDE-175-L. The cage rinse contained less than 0.01% of the administered dose.
Radioactivity started to appear in milk within 24 h after the first administration and seemed to reach a plateau by the fifth administration. The maximum total radioactive residues expressed in mg-equivalents of respective compound/kg were 0.047 mg/kg in the second milking of day 3 and the first milking of day 4 for 14C-XDE-175-L and 0.039 mg/kg in the first milking of day 5 for 14C-XDE-175-L. In the course of the study, no milk sample contained more than 0.07% of the administered dose. Only about 0.3% of the total administered dose of 14C-XDE-175-J and 0.2% of that of 14C-XDE-175-L was recovered from all the collected milk samples.
Radioactive residues were relatively low in edible tissues after sacrifice: the concentrations in fat were the highest at 0.235 and 0.119 mg/kg and in other tissues they were, in decreasing order, in liver at 0.116 and 0.099 mg/kg, in kidney at 0.065 and 0.047 mg/kg and in muscle at 0.017 and 0.015 mg/kg for 14C-XDE-175-J and 14C-XDE-175-L, respectively (Table 2). For both compounds, only about 0.3% and 0.5% of the total dose was accounted for in the edible tissues for XDE-175-L and XDE-175-J, respectively. The results showed that radioactivity of these compounds were not readily transferred into these edible tissues and that the residues accumulate more in tissues with higher fat content.
Table 2 Total radioactive residues (TRR) in the milk and edible tissues of lactating goats given either 14C-XDE-175-J or 14C-XDE-175-L
Total Radioactive Residues (mg/kg) Tissue
XDE-175-J XDE-175-L
Milk Day 1 1st - -
Day 1 2nd 0.001 0.011
Day 2 1st 0.012 0.015
Day 2 2nd 0.023 0.014
Day 3 1st 0.019 0.021

Spinetoram 1647
Total Radioactive Residues (mg/kg) Tissue
XDE-175-J XDE-175-L
Day3 2nd 0.047 0.014
Day 4 1st 0.047 0.029
Day 4 2nd 0.037 0.028
Day 5 1st 0.029 0.039
Day 5 2nd 0.037 0.029
Fat 0.235 0.119
Liver 0.116 0.099
Kidney 0.065 0.047
Muscle 0.017 0.015
Radioactive residues in tissues and milk were extracted under mild condition: fat was extracted with hexane; liver, kidney and muscle with acetonitrile/water; and milk with acetonitrile. The organic extract was subjected to SPE cleanup prior to analysis. In tissues and milk, radioactive residues extracted in organic solvents were ≥ 85% of TRR, except for liver where residues in organic solvent were 57–71% of TRR. Radioactive residues extracted in aqueous layer were ≤ 5% of TRR for all tissues and milk, except for 14C-XDE-175-J in liver where the aqueous extract contained 18% of TRR. Less than 15% of TRR or 0.025 mg/kg were unextractable from all tissues except liver. From liver, 23–35% of TRR were unextractable.
Characterization and identification of the organo-soluble residues from the muscle, milk and excreta samples showed the primary residue to be XDE-175-J or XDE-175-L, indicating that minimal metabolism had occurred. No residue components other than the unchanged parent compounds were identified in milk, kidney or fat. Radioactive residues in liver consisted of XDE-175-J or XDE-175-L, a metabolite that was tentatively identified as N-demethyl-175-J or –L at very low levels (< 2% of the TRR), and an unidentified metabolite (Metabolite J1 or Metabolite L1) that was more polar than most of the available reference standards. Radioactive residues in muscle also consisted primarily of XDE-175-J or XDE-175-L and much lesser amounts of what seemed to be the same unidentified metabolite as found in liver. Table 3 shows summaries of the characterised radioactive residues. Overall, for both compounds 77–99% of TRR were extracted.
Table 3 Characterization and identification of radioactive residues in the tissues and milk of lactating goats following oral doses of 14C-XDE-175-J or 14C-XDE-175-L
Muscle Fat Kidney Liver Day 5 Milk a Compound
mg/kg % TRR
mg/kg % TRR
mg/kg % TRR
mg/kg % TRR
mg/kg % TRR
Oral Dose of 14C-XDE-175-J
XDE-175-J 0.007 42.3 0.190 80.8 0.035 53.9 0.035 29.8 0.029 84.4
N-Demethyl-175-J
- - - - - - 0.002 1.8 - -
Metabolite J1 0.001 5.5 - - < 0.001 - 0.012 10.0 - -
Total identified 0.007 42.3 0.190 80.8 0.035 53.9 0.037 31.6 0.029 84.4
Total characterised b
0.009 47.2 0.021 8.8 0.021 31.8 0.050 43.3 0.005 14.7
Total extracted 0.016 89.5 0.211 89.6 0.056 85.7 0.087 74.9 0.034 99.1
Total unextractable
0.002 10.7 0.025 10.5 0.009 14.5 0.029 25.2 < 0.001 1.0
Total measured
(TRR in ( )) (0.017) 100 (0.235) 100 (0.065) 100 (0.116) 100 (0.034) 100

1648 Spinetoram
Muscle Fat Kidney Liver Day 5 Milk a Compound
mg/kg % TRR
mg/kg % TRR
mg/kg % TRR
mg/kg % TRR
mg/kg % TRR
Oral Dose of 14C-XDE-175-L
XDE-175-L 0.007 45.8 0.086 72.3 0.030 64.3 0.026 25.9 0.042 84.2
N-Demethyl-175-L - - - - - - 0.001 1.2 - -
Metabolite L1 0.003 17.7 - - - - 0.027 26.9 - -
Total identified 0.007 45.8 0.086 72.3 0.030 64.3 0.027 27.1 0.042 84.2
Total characterised
0.008 47.3 0.018 14.8 0.012 21.8 0.049 49.5 0.007 13.6
Total extracted 0.015 93.1 0.104 87.1 0.042 86.1 0.076 76.6 0.049 97.8
Total unextractable
0.001 6.9 0.016 12.9 0.007 13.9 0.023 23.4 0.002 2.2
Total measured (TRR in ( ))
(0.015) 100 (0.119) 100 (0.047) 100 (0.099) 100 (0.049) 100
a Prior to extraction and analysis, aliquots of the Day 5 PM milk sample were re-assayed by liquid scintillation counter to confirm the TRR levels.
b Characterised but not identified.
Laying hens: Laying hens (Bovan White Leghorn; 24 week old; 1.3–1.6 kg) were given either 14C-XDE-175-J or 14C-XDE-175-L, each at 1.25 or 1.75 mg/bird/day, equivalent to10 ppm in the diet, once daily via balling gun for seven consecutive days with (Smith-Drake, 2005; Report 040087). Each dosing group consisted of ten birds. Eggs were collected twice daily and excreta once daily. The hens were sacrificed within 22 ± 3 h of the final dose and the liver, muscle (breast and thigh), fat (abdominal), and skin with subcutaneous fat was collected for analysis.
The overall recovery of the dose was 95 and 94% for 14C-XDE-175-J and 14C-XDE-175-L, respectively. Approximately 93 and 91% of the administered dose of 14C-XDE-175-J and 14C-XDE-175-L, respectively, was recovered in the excreta.
Recovery of the administered dose in eggs and tissues was low for both 14C-XDE-175-J (0.40+0.98%) and 14C-XDE-175-L (0.93 + 2.1%). TRR in eggs increased over the experimental period and reached a maximum of 0.204 and 0.488 mg/kg for 14C-XDE-175-J and 14C-XDE-175-L, respectively, on Day 7. TRR in the tissues were highest in abdominal fat (1.04–2.46 mg/kg), followed by skin with subcutaneous fat (0.66–1.41 mg/kg), liver (0.53–0.90 mg/kg), eggs (0.2–0.49 mg/kg in Day 7) and muscle (0.05–0.11 mg/kg) (Table 4). TRR found in eggs and tissues of hens dosed with 14C-XDE-175-L were approximately twice as high as those from hens dosed with 14C-XDE-175-J. There is a tendency for these test compounds to accumulate more in tissues with higher fat content.
Table 4 Total radioactive residues (TRR) in the eggs and edible tissues of hens given either 14C-XDE-175-J or 14C-XDE-175-L
Total Radioactive Residues (mg/kg) Tissue
XDE-175-J XDE-175-L
Day 1 0.000 0.000
Day 2 0.032 0.036
Egg Day 3 0.067 0.123
Day 4 0.114 0.225
Day 5 0.161 0.340
Day 6 0.185 0.420
Day 7 0.204 0.488
Abdominal fat 1.04 2.46
Skin/Fat 0.661 1.41

Spinetoram 1649
Total Radioactive Residues (mg/kg) Tissue
XDE-175-J XDE-175-L
Muscle 0.050 0.108
Liver 0.535 0.902
Radioactive residues were readily extracted under the mild condition. Following hexane extraction of abdominal fat and skin with fat, 94–97% of TRR were extracted in hexane layer and 3–6% of TRR were unextractable. Partition of radioactive residues in muscle, liver, and egg samples between acetonitrile/water and dichloromethane resulted in 73–88% of TRR in the organic phase, < 1% of TRR in the aqueous phase, and 12–20% of TRR unextractable. Acid extraction of the liver tissue remaining after the above-mentioned extraction further released 7–8% of TRR as organo-soluble residues with 4–7% of TRR still not extracted. Table 5 shows summaries of the identified/characterised residues. Unextracted radioactivity was less than 7% of the TRR in all samples except muscle and eggs in which it was 12–20%.
Neither of these two test compound was extensively or rapidly metabolized in hens. Unchanged XDE-175-J or XDE-175-L remained as the primary residue in the egg and tissues.
Table 5 Characterization of radioactive residues in hen tissues following oral doses of 14C-XDE-175-J or 14C-XDE-175-L
Abdominal fat Skin with fat Muscle Liver Day 4 Egg Compound
mg/kg % TRR mg/kg % TRR mg/kg % TRR mg/kg % TRR mg/kg % TRR
Oral Dose of 14C-XDE-175-J
XDE-175-J 0.723 69.6 0.531 80.2 0.034 67.8 0.069 13.0 0.068 58.4
3’-O-deethyl-175-J 0.019 1.8 - - - - 0.093 17.7 - -
O-demethyl-175-J 0.059 5.7 0.022 3.3 0.002 3.2 0.034 6.5 - -
Total identified 0.801 77.1 0.553 83.5 0.036 71.0 0.196 37.2 0.068 58.4
Total characterised a 0.205 19.9 0.086 13.0 0.005 10.5 0.294 55.8 0.028 25.6
Total extracted 1.006 97.0 0.639 96.5 0.041 80.5 0.490 93.0 0.096 84.0
Total unextractable 0.032 3.0 0.023 3.5 0.010 19.5 0.037 7.0 0.019 16.0
Total measured (TRR in ( ))
(1.04) 100 (0.662) 100 (0.050) 100 (0.526) 100 (0.115) 100
Oral Dose of 14C-XDE-175-L
XDE-175-L 1.366 55.5 0.784 55.6 0.048 44.5 0.105 11.7 0.111 48.9
3’-O-deethyl-175-L 0.128 5.2 0.079 5.6 0.006 5.4 0.115 12.8 0.029 12.5
O-demethyl-175-L 0.479 19.5 0.239 16.9 0.020 17.8 0.135 15 0.030 13.4
N-demethyl-175-L - - - - - - 0.015 1.7 - -
Total identified 1.973 80.2 1.102 78.1 0.074 67.7 0.370 41.2 0.170 74.8
Total characterised a 0.414 16.8 0.226 15.9 0.016 14.8 0.493 54.5 0.029 13.2
Total extracted 2.387 97.0 1.328 94.0 0.090 82.5 0.863 95.7 0.199 88
Total unextractable 0.075 3.0 0.084 6.0 0.019 17.5 0.039 4.4 0.027 12
Total measured
(TRR in ( )) (2.46) 100 (1.41) 100 (0.108) 100 (0.902) 100 (0.226) 100
a Characterised but not identified.
Unchanged parent compound was the primary residue component in milk and all ruminant tissues as well as eggs and all avian tissues except liver for both XDE-175-J and XDE-175-L. The liver and muscle of the goat treated with XDE-175-J or XDE-175-L contained one unidentified metabolite present at less than 10 or 27% of TRR, respectively. The ruminant liver also contained a

1650 Spinetoram
minor amount of N-demethyl-175-J or N-demethyl-175-L (≤ 2% TRR). In hen liver, the O-deethyl- and O-demethyl metabolites were also found.
Metabolism of spinetoram appears to be primarily through dealkylation of the rhamnose sugar to give the O-deethyl and/or O-demethyl (two possible isomers) metabolites. Many other minor metabolites were also observed with each being present at levels lower than 10% of the TRR. Proposed metabolic pathways for spinetoram in livestock are shown in Figure 1 (XDE-175-J) and Figure 2 (XDE-175-L). The metabolism spinetoram in ruminant paralleled that in hens.
Figure 1 Proposed metabolic pathway of XDE-175-J in livestock
g, goat; h, hen.
4'-O-demethyl-175-J
H
O
O O O H
C H 3
H H H
O
O O
O O H O
N
3'-O-deethyl-175-J
XDE-175-J
H
O
O O O H
C H 3
H H H
O
O O
O O H
N O
2'-O-demethyl-175-J
Or
H
O
O O O
H C H 3
H H H
O
O O
O O O
N
N-demethyl-175-J
H
O
O O O
H C H 3
H H H
O
O O
O O O
N H
H
O
O O O H
C H 3
H H H
O
O O
O H O O
N
g h
h

Spinetoram 1651
Figure 2 Proposed Metabolic Pathway of XDE-175-L in Livestock
g, goat; h, hen.
Plant Metabolism
The Meeting received information on the fate of spinetoram after foliar applications in apples, lettuce and turnips representing the fruits, leafy crops and root crops, respectively.
Apple
A branch with immature fruits of individual Granny Smith apple tree was treated with single foliar application of either 14C-XDE-175-J or 14C-XDE-175-L at the rate of 1.8 kg ai/ha (4.8×) or 1.1 kg ai/ha (8.9×), respectively (Byrne, et. al., 2005; Report 040050). Immature apples and leaves were collected 0, 1, 3, 7, and 14 days after treatment (DAT). Covered apples, as dark samples, were also collected 3 DAT and 7 DAT (covered from 3–7 DAT). Mature apples were collected 30 DAT, as well as leaf samples. In addition, one branch on each treated tree was covered with plastic prior to application for testing translocation to an untreated branch. Apple fruits and leaves of the untreated branches were collected 30 DAT.
The collected samples were washed with acetonitrile and dichloromethane. The total radioactive residues (TRR) were determined as the sum of the residues in the washings and the washed fruit or leaves. In the fruit obtained from the 14C-XDE-175-J treated branch (0–30 DAT), 78–93% of TRR were found in the acetonitrile washings and 4–11% in the dichloromethane washings. Peels contained 2–11% of TRR while pulp contained less than 1% (≤ 0.007 mg/kg). In fruits from 14C-XDE-175-L treated branch (0-30 DAT), 46–85% of TRR were found in acetonitrile washings and 10–21% in dichloromethane washings. Peel contained 6–33% of TRR while pulp contained less than 4%.
In leaves from the 14C-XDE-175-J treated branch (0–30 DAT), 67–88% of TRR were recovered in acetonitrile washings and 6–11% of TRR in dichloromethane washings. Washed leaves contained 5–23% of TRR. In leaves from 14C-XDE-175-L treated branch (0–30 DAT), 55–79% of
H
O
O O O
H C H 3
H H H
O
O O
O H O O
N
H
O
O O O
H C H 3
H H H
O
O O
O O H O
N
H
O
O O O
H C H 3
H H H
O
O O
O O
O
N
H
O
O O O
H C H 3
H H H
O
O O
O O H
N O
Or
4'-O-demethyl-175-L 3'-O-deethyl-175-L
XDE-175-L
2'-O-demethyl-175-L
H
H
O
O O O
H C H 3
H H H
O
O O
O O
O
N
N-demethyl-175-L h h
g

1652 Spinetoram
TRR were recovered in acetonitrile washings and 10–17% of TRR in dichloromethane washings. Washed leaves contained 11–31% of TRR.
The leaves and peel from both treatments, and pulp from the 14C-XDE-175-L treatment were extracted with acetonitrile:water (80:20, v/v). Only pulp from the 14C-XDE-175-L treated trees was extracted since TRR in pulp from the 14C-XDE-175-J treated trees were ≤ 1% of TRR (≤ 0.007 mg/kg). Radioactive residues unextractable were < 10% of TRR in or on all samples. Pooled acetonitrile washing, dichloromethane washing, and extracts were analysed. Tables 6 and 7 summarize the identified residues. Several minor metabolites assumed to be structurally similar to the parent compound were also detected in the treated apples and leaves, each at ≤ 7.5% of TRR. A multi-component mixture of extensively degraded compounds represented up to 39–77% of TRR but each component was less than 1% of TRR.
Radioactive residues in the apple fruits from 14C-XDE-175-L treated tree shows a tendency to be higher when exposed than those in covered (dark) apple samples.
In the translocation experiment, TRR were below the limit of quantification of 0.001 mg/kg in apple fruits and 0.053 mg/kg and 0.009 mg/kg in leaves collected from the 14C-XDE-175-J and 14C-XDE-175-L treated trees, respectively indicating that translocation is negligible. As the concentrations in tissues were very low, no further analysis was conducted.
Table 6 Characterization and identification of radioactive residues in apple fruit washings and extracts
a following application of 14C-XDE-175-J at 1.8 kg ai/ha or 14C-XDE-175-L at 1.1 kg ai/ha
Compound %TRR mg/kg %TRR mg/kg %TRR mg/kg %TRR mg/kg
Application of 14C-XDE-175-J at 1.8 kg ai/ha
0 DAT 1 DAT 3 DAT (dark) 3 DAT
XDE-175-J 82.2 0.715 77.2 1.286 61.4 0.625 54.8 0.729
N-demethyl-175-J 5.0 0.044 7.0 0.116 10.2 0.104 8.4 0.112
N-formyl-175-J 1.7 0.015 4.1 0.068 3.1 0.031 3.6 0.048
C9-pseudoaglycone-175-J 0.5 0.004 0.1 0.002 0.8 0.008 1.3 0.018
3-O-deethyl-175-J 1.2 0.010 3.9 0.065 - - - -
Total identified 90.6 0.788 92.3 1.534 75.5 0.768 68.1 0.907
Total characterised b 9.2 0.081 7.2 0.130 24.4 0.250 31.5 0.418
Total extractable 99.8 0.869 99.5 1.664 99.9 1.018 99.6 1.325
Total unextractable 0.4 0.003 0.4 0.006 0.3 0.003 0.9 0.011
Total measured (TRR in ( )) 100 (0.870) 100 (1.67) 100 (1.02) 101 (1.33)
7 DAT (dark) 7 DAT 14 DAT 30 DAT
XDE-175-J 44.4 0.352 43.3 0.501 44.3 0.485 18.9 0.135
N-demethyl-175-J 8.3 0.066 9.5 0.110 9.1 0.100 6.3 0.044
N-formyl-175-J 5.9 0.047 5.1 0.059 3.0 0.033 3.5 0.024
C9-pseudoaglycone-175-J 1.5 0.011 2.9 0.033 3.8 0.043 1.5 0.010
3-O-deethyl-175-J 0.1 0.001 0.1 0.001 3.2 0.035 2.0 0.014
Total identified 60.2 0.477 60.9 0.704 63.4 0.696 32.2 0.227
Total characterised b 37.7 0.299 38.3 0.445 35.0 0.381 64.3 0.462
Total extracted 97.9 0.776 99.2 1.149 98.4 1.077 96.5 0.689
Total unextractable 1.6 0.013 1.6 0.02 1.3 0.014 3.8 0.027
Total measured (TRR in ( )) 100 (0.793) 101 (1.16) 100 (1.09) 100 (0.713)
Application of 14C-XDE-175-L at 1.1 kg ai/ha
0 DAT 1 DAT 3 DAT (dark) 3 DAT
XDE-175-L 42.7 0.184 18.4 0.115 17.7 0.237 12.9 0.115
N-demethyl-175-L 7.9 0.034 4.0 0.025 3.4 0.046 3.6 0.032

Spinetoram 1653
Compound %TRR mg/kg %TRR mg/kg %TRR mg/kg %TRR mg/kg
N-formyl-175-L 1.6 0.007 2.3 0.014 3.5 0.047 0.9 0.008
Total identified 52.2 0.225 24.7 0.154 24.6 0.330 17.4 0.155
Total characterised b 45.1 0.194 74.5 0.466 71.6 0.958 75.9 0.672
Total extracted 97.3 0.419 99.2 0.620 96.2 1.288 93.3 0.827
Total unextractable 2.0 0.009 1.2 0.007 3.0 0.041 7.0 0.063
Total measured (TRR in ( )) 99 (0.431) 100 (0.626) 99 (1.34) 100 (0.888)
7 DAT (dark) 7 DAT 14 DAT 30 DAT
XDE-175-L 8.5 0.088 1.3 0.005 - - - -
N-demethyl-175-L 2.7 0.027 1.0 0.004 0.3 0.002 0.4 0.003
N-formyl-175-L 1.0 0.010 1.0 0.004 0.2 0.001 0.4 0.003
Total identified 12.2 0.125 3.3 0.013 0.5 0.003 0.8 0.006
Total characterised 82.6 0.858 86.6 0.307 90.6 0.477 89.5 0.650
Total extracted 94.8 0.983 89.9 0.320 91.1 0.48 90.3 0.656
Total unextractable 4.0 0.042 7.2 0.025 6.9 0.036 9.0 0.066
Total measured (TRR in ( )) 99 (1.04) 97 (0.356) 98 (0.528) 99 (0.728) a Sum of residues of pooled fruit washings and peel/pulp extracts by HPLC. Only the pulp from XDE-175-L treated tree
was extracted. b Characterised but not identified
Table 7 Characterization and identification of radioactive residues in apple leaf washings a and extracts following application of 14C-XDE-175-J at 1.8 kg ai/ha or 14C-XDE-175-L at 1.1 kg ai/ha (Byrne, et. al., 2005)
Compound %TRR mg/kg %TRR mg/kg %TRR mg/kg
Application of 14C-XDE-175-J at 1.8 kg ai/ha
0 DAT 1 DAT 3 DAT
XDE-175-J 80.3 105 78.6 100.0 42.4 71.27
N-demethyl-175-J 9.1 11.9 10.4 13.35 14.8 24.83
N-formyl-175-J 2.4 3.20 2.4 3.07 0.7 1.15
C9-pseudoaglycone-175-J 0.9 1.11 0.2 0.21 2.3 3.86
3-O-deethyl-175-J 0.1 0.10 0.9 1.07 4.2 6.95
Total identified 92.8 122 92.5 117.69 64.4 108.06
Total characterised b 9.6 12.8 8.5 10.92 35.1 59.23
Total extracted 102.4 134 101.0 128.61 99.5 167.29
Total unextractable 0.3 0.33 0.2 0.29 0.6 1.03
Total measured (TRR in ( )) 103 (131) 101 (127) 100 (168)
7 DAT 14 DAT 30 DAT
XDE-175-J 37.6 58.40 24.0 34.36 19.9 27.77
N-demethyl-175-J 12.0 18.70 9.4 12.45 7.5 10.50
N-formyl-175-J 3.4 5.39 3.0 4.34 2.2 3.07
C9-pseudoaglycone-175-J 1.7 2.63 3.6 5.11 3.1 4.37
3-O-deethyl-175-J 2.2 3.40 4.3 6.15 2.5 3.45
Total identified 56.9 88.53 44.3 63.40 35.2 49.15
Total characterised b 41.9 65.06 54.1 77.51 61.0 84.98
Total extracted 98.8 153.59 98.4 140.92 96.2 134.13
Total unextractable 0.5 0.78 1.0 1.48 3.3 4.54

1654 Spinetoram
Compound %TRR mg/kg %TRR mg/kg %TRR mg/kg
Total measured (TRR in ( )) 99 (155) 99 (143) 100 (140)
Application of 14C-XDE-175-L at 1.1 kg ai/ha
0 DAT 1 DAT 3 DAT
XDE-175-L 26.8 18.56 19.6 9.29 2.0 1.15
N-demethyl-175-L 1.8 1.36 3.2 1.53 0.6 0.37
N-formyl-175-L 2.0 1.50 1.3 0.58 0.7 0.38
Total identified 30.6 21.42 24.1 11.40 3.3 1.90
Total characterised b 69.3 42.93 73.8 35.08 95 55.17
Total extracted 99.9 64.35 97.9 46.48 98.3 57.07
Total unextractable 1.2 0.77 1.3 0.60 2.2 1.29
Total measured (TRR in ( )) 101 (64.4) 99 (47.4) 101 (58.1)
7 DAT 14 DAT 30 DAT
XDE-175-L 1.3 0.59 0.7 0.24 0.2 0.12
N-demethyl-175-L 0.9 0.41 0.6 0.25 0.2 0.12
N-formyl-175-L 1.2 0.55 1 0.39 0.3 0.18
Total identified 3.4 1.55 2.3 0.89 0.7 0.42
Total characterised b 94.6 49.44 94.4 37.26 90.4 50.34
Total extracted 98.0 50.99 96.7 38.14 91.1 50.76
Total unextractable 2.7 1.38 2.4 0.94 6.8 3.77
Total measured (TRR in ( )) 101 (52.1) 99 (39.4) 98 (55.4) a Sum of residues of pooled washings and extracts by HPLC. b Characterised but not identified
Lettuce
Individual pots of red leaf lettuce (variety New Fire Red) were treated with either single or multiple foliar spray applications of 14C-XDE-175-J or 14C-XDE-175-L (Magnussen, et. al., 2005; Report 040048). For 14C-XDE-175-J, single applications were made at rates equivalent to 0.90 kg ai/ha (single application treatment) while the same amount of the test compound was sprayed in three separate applications with the equal rate at weekly intervals (multiple application treatment). For 14C-XDE-175-L, plants were treated in a similar fashion but at a rate equivalent to 0.30 kg ai/ha. For both compounds, the amounts applied approximately correspond to four times the maximum seasonal rate described on label.
Lettuce receiving a single application was harvested at 0, 0.25, 1, 3, and 7 DAT. Lettuce treated with multiple applications was harvested at 3 and 7 DAT. Identification of residues was not conducted for some of the 7 DAT samples as they were damaged by heat stress.
Collected samples were washed first with dichloromethane followed by acetonitrile in order to remove surface residues. Total radioactive residues (TRR) were determined as sum of radioactive residues in washings and washed lettuce. In both 14C-XDE-175-J and 14C-XDE-175-L treated lettuce samples, 76–96% of TRR were found in the solvent washings. From lettuce samples collected 0, 0.25 and 1 day after the last application, approximately 3.4–21% of TRR were found in acetonitrile washings. The radioactive residues remaining after washing in lettuce samples taken 3 DAT were extracted by homogenizing and refluxing with acetonitrile/water (75/25, v/v) followed by partitioning with acetonitrile/dichloromethane (50/50, v/v) at neutral and acidic pH. About 12–19% of TRR were in the organic phase and 0.3–3.4% of TRR in the aqueous phase. Overall, only 0.2–5.2% of TRR remained unextractable in all treated lettuce samples.
The solvent washings and extracts were pooled and analysed. Table 8 summaries the identified residues. Several minor metabolites assumed to be structurally similar to the parent

Spinetoram 1655
compound were also observed in the 14C-XDE-175-J and 14C-XDE-175-L treated lettuce at or less than 6% of TRR. A multi-component mixture of extensively degraded compounds represented up to 13–78% of TRR, each component at less than 3% of TRR.
Table 8 Characterization and identification of radioactive residues in lettuce following application of 14C-XDE-175-J at 0.90 kg ai/ha or 14C-XDE-175-L at 0.30 kg ai/ha
0 DAT 0.25 DAT 1 DAT 3 DAT 3 DAT
(multiple)a Compound
%TRR mg/kg %TRR mg/kg %TRR mg/kg %TRR mg/kg %TRR mg/kg
Application of 14C-XDE-175-J at 0.90 kg ai/ha
XDE-175-J 63.6 31.74 42.1 27.23 31.1 10.71 17.6 6.41 8.5 0.52
N-demethyl-175-J 8.9 4.44 18.0 11.64 19.6 6.75 15.5 5.64 7.2 0.44
N-formyl-175-J 6.6 3.29 7.8 5.05 10.6 3.65 11.2 4.08 14.8 0.90
Total identified 79.1 39.48 67.9 43.92 61.3 21.11 44.3 16.12 30.5 1.86
Total characterised 20.7 10.32 31.6 20.45 37.5 12.90 55.1 20.07 66.6 4.06
Total extracted 99.8 49.80 99.5 64.37 98.8 34.01 88.4 36.19 97.1 5.93
Total unextractable 0.2 0.10 0.5 0.32 1.2 0.41 0.6 0.22 3.0 0.18
Total measured
(TRR in ( ))
100 (49.9) 100 (64.7) 100 (34.4) 100 (36.3) 100 (6.11)
Application of 14C-XDE-175-L at 0.30 kg ai/ha
XDE-175-L 62.4 6.18 8.2 1.47 11.9 0.91 5.1 0.55 2.8 0.10
N-demethyl-175-L 17.6 2.08 6.7 0.54 7.2 0.55 3.5 0.38 1.5 0.05
N-formyl-175-L 5.9 0.70 5.3 0.43 4.0 0.30 2.0 0.22 1.1 0.04
Total identified 75.9 8.95 30.2 2.45 23.1 1.76 10.6 1.14 5.4 0.18
Total characterised 22.5 2.66 65.8 5.33 71.7 8.97 87.7 9.46 91.2 3.08
Total extracted 98.4 11.61 96 7.77 94.8 7.21 98.3 10.60 96.6 3.28
Total unextractable 1.6 0.19 4.0 0.32 5.2 0.40 1.8 0.19 3.4 0.12
Total measured
(TRR in ( ))
100 (11.8) 100 (8.10) 100 (7.61) 100 (10.8) 100 (3.38)
a Samples received multiple applications of 14C-XDE-175-J or 14C-XDE-175-L.
Turnips
Individual pots of Purple Top White Globe turnips were treated with either a single or multiple foliar applications of 14C-XDE-175-J or 14C-XDE-175-L (Graper, et. al., 2005; Report 040049). Single applications of XDE-175-J were made at rates equivalent to 0.90 kg ai/ha (single application treatment) while the same amount of the test compound was sprayed in three separate applications with the equal rate at weekly intervals (multiple application treatment). For XDE-175-L, plants were treated in a similar fashion but at a rate equivalent to 0.30 kg ai/ha. For both test compounds, applied approximately correspond to four times the maximum seasonal rate described on label.
Following application, plants treated with a single application were harvested at 0, 0.25, 1, 3 and 7 DAT. Plants that received the multiple applications were harvested at 3 and 7 DAT of the final application (17 and 21 days after the initial application).
Collected turnip tops were washed first with dichloromethane followed by acetonitrile in order to remove surface residues. Total radioactive residues (TRR) were determined as the sum of the residue in the washing and washed tissue. In 14C-XDE-175-J treated turnip tops, 59–91% of TRR were surface residues found in the solvent washings. In 14C-XDE-175-L treated turnip tops, surface residues were 39–80% of TRR, slightly smaller percentage than in XDE-175-J treated tops. In treatment with both compounds, the percentage of TRR as surface residues of turnip tops was lower in samples receiving multiple applications than for those receiving a single application.

1656 Spinetoram
Washed turnip tops were extracted by homogenizing and refluxing with acetonitrile/water (80/20, v/v) followed by partitioning with dichloromethane at neutral and acidic pH. Approximately 8–35% of TRR were found in organic phase and < 0.1–9% of TRR were in the aqueous phase, but < 1–18% of TRR were unextractable. The remaining residues in 3 DAT turnip top samples receiving multiple applications were extracted with acid and 2–3% of TRR were released as organo-soluble residues and 1–4% of TRR as aqueous residues, leaving 4–5% of TRR still not extracted.
Turnip root samples were extracted by homogenizing and refluxing with acetonitrile/water (80/20, v/v) followed by dichloromethane partitioning at neutral and acidic pH. In turnip root samples from both 14C-XDE-175-J and 14C-XDE-175-L treatments, 38–93% of TRR were in organic phase and 2–28% of TRR were in the aqueous phase, but 6–34% of TRR were unextractable.
For metabolite characterization and identification, the washings and residues in organic solvent and aqueous extracts of turnip tops or turnip roots were pooled as composite extracts. For tops, samples harvested at 0.25 DAT and 3 DAT after a single application and those at 3 DAT after multiple applications were used. For roots, samples taken at 3 DAT after a single application were used. Table 9 summarizes residues characterised and identified in turnip tops and roots. Several minor metabolites assumed to be structurally similar to the parent compound were also observed in treated turnip tops, each less than 4% of TRR. A multi-component mixture of extensively degraded compounds represented 10–74% of TRR, each compound at less than 1% TRR.
Table 9 Characterization and identification of radioactive residues in turnip tops and roots following application of 14C-XDE-175-J at 0.90 kg ai/ha or 14C-XDE-175-L at 0.30 kg ai/ha
TOPS ROOTS
0.25 DAT 3 DAT 3 DAT
(multiple)a
3 DAT Compound
% TRR mg/kg % TRR mg/kg % TRR mg/kg % TRR mg/kg
Application of 14C-XDE-175-J at 0.90 kg ai/ha
XDE-175-J 35.7 4.20 9.4 1.11 4.9 0.35 22.3 0.03
N-demethyl-175-J 14.4 1.69 8.5 1.01 4.1 0.30 10.0 0.01
N-formyl-175-J 10.4 1.23 11.2 1.32 11.4 0.82 16.6 0.02
C17-pseudoaglycone-175-J - - - - 0.3 0.02 - -
Aglycone-175-J - - - - 0.5 0.03 - -
Total identified 60.5 7.12 29.1 3.43 21.2 1.53 48.9 0.06
Total characterised 38.9 4.58 68.7 8.08 74.8 5.41 40.8 0.05
Total extracted 99.4 11.71 97.8 11.51 96.0 6.93 89.0 0.11
Total unextractable 0.6 0.08 2.2 0.26 4.0 0.29 10.3 0.01
Total measured
(TRR in ( ))
100 (11.8) 100 (11.8) 100 (7.22) 100 (0.12)
Application of 14C-XDE-175-L at 0.30 kg ai/ha
XDE-175-L 17.1 0.91 2.9 0.06 3.0 0.07 14.8 0.005
N-demethyl-175-L 7.4 0.40 0.6 0.01 1.1 0.02 - -
N-formyl-175-L 3.0 0.16 1.0 0.2 0.5 0.01 3.0 0.001
Total identified 27.5 1.47 4.5 0.10 4.6 0.10 17.8 0.006
Total characterised 69.8 3.73 88.8 1.89 89.2 1.92 62.4 0.019
Total extracted 97.3 5.20 93.3 1.99 93.8 2.03 80.2 0.025
Total unextractable 2.7 0.14 6.6 0.14 6.2 0.13 19.8 0.006
Total measured
(TRR in ( ))
100 (5.34) 100 (2.13) 100 (2.16) 100 (0.031)
a Samples received multiple applications of 14C-XDE-175-J or 14C-XDE-175-L.

Spinetoram 1657
A consistent metabolism of spinetoram was observed in the three crops studied–apple, lettuce and turnip–indicating that a common metabolism is expected for not only fruits, leafy vegetables and root vegetables but also other plants.
Based on the results of the submitted metabolism studies, it appears that three metabolic pathways are responsible for the breakdown of spinetoram in plants. The first one involves changes to the N-dimethyl moiety on the forosamine sugar to give the N-demethyl and N-formyl metabolites. Due to the presence of these metabolites at the 0-day PHI, it is thought that their formation may be the result of photolysis. The second involves cleavage of the macrolide ring system at one or more positions, ultimately resulting in a complex residue mixture consisting of numerous components. The third, applicable only to XDE-175-J, involves changes to the rhamnose sugar producing the 3-O-deethyl and C9-pseudoaglycone-175-J metabolites. All the metabolites occurring as a result of changes in forosamine and rhamnose are further degraded via the second pathway. XDE-175-L might also undergo degradation through the third pathway no relevant metabolites were detected perhaps because degradation through the second pathway might be too fast. The proposed metabolic pathways for spinetoram in plants are shown in Figures 3 and 4 for XDE-175-J and XDE-175-L, respectively.
Figure 3 Proposed Metabolic Pathway of XDE-175-J in Plants
H
O
O O
O H C H 3
H H H
O
O O
O O
O
N
H
O
O O
O H C H 3
H H H
O
O O
O O
O
N H
H
O
O O O H
C H 3
H H
H
O
O O
O O
O
N O
H
H
O
O O
O H C H 3
H H
H
O
O O
O O H
O
N
H
O
O O
O H C H 3
H H H
O H
O
N
XDE-175-J
1
1
3' - O - deethyl - 175 - J ( 5,6 - dihydro - spinosyn J)
3
3
C9 - (Rev erse) - Pseudoaglycone - 175 - J
Macrolide ring cleavage products
2
2 2 2
2
N-demethyl-175-J
N-formyl-175-J

1658 Spinetoram
Figure 4 Proposed Metabolic Pathway of XDE-175-L in Plants
Environmental fate in soil
The Meeting received information on the aerobic soil metabolism, aqueous photolysis and hydrolysis, and residues in succeeding crops. Since spinetoram is intended for use on root vegetables and supervised trials were conducted on sugar beet, the above mentioned information was reviewed. The Meeting also received information on anaerobic soil metabolism and photolysis in soil but they were not reviewed.
In laboratory studies on aerobic soil metabolism, the same 14C-labelled and 14C- and D-labelled active substances were used as in the animal and plant metabolism studies. Unless otherwise indicated, the radiochemical purity was > 97%.
Aerobic soil metabolism
Yoder et al. (2005; Report 040068) incubated radio-labelled spinetoram for up to one year under aerobic condition in the dark at 25 °C and 75% of 1/3 bar moisture in four soils in the USA: Commerce loam from Mississippi; Fayette silt loam from Iowa; Kimberlina/Nord sandy loam from California; and Slagle loam from Virginia. XDE-175-J was applied at the rate of 0.21 mg ai/kg soil, equivalent to 375 g ai/ha (1×). XDE-175-L was also applied at 0.21 mg ai/kg soil, or approximately equivalent to 3× its anticipated maximum use rate.
H
O
O O
O H
C H 3
H H H
O
O O
O O
O
N
XDE-175-L
H
O
O O
O H
C H 3
H H H
O
O O
O O
O
N H
N-demethyl-175-L
H
O
O O
O H
C H 3
H H H
O
O O
O O
O
N
O
H
N-formyl-175-L
1
2 2
2
1
Macrolide ring cleavage products

Spinetoram 1659
The degradation of spinetoram in European soils under aerobic conditions in the dark was also studied (Smith-Drake, et. al., 2007; Report 050076.1). Radio-labelled spinetoram was incubated at 20 °C for 127 days in four soils: a sandy loam from Longwoods Quarry, Lincolnshire, UK; a loamy sand from Hanhofen, Rheinlan-Pfalz, Germany; a sandy clay loam from Little Shelford, UK; and a sandy clay loam from Altlussheim, Baden-Wurttemberg, Germany. XDE-175-J was applied at the rate of 0.8 mg ai/kg soil, equivalent to 300 g ai/ha. XDE-175-L was applied at the same rate equivalent to 3× the label rate. Radio-labelled spinetoram was also incubated at 10 °C in the dark for 127 days in the sandy loam from Longwoods Quarry.
The results of these studies are summarized in Table 9.
Under aerobic conditions, spinetoram applied to soil was degraded relatively rapidly. In all soils tested, XDE-175-L was degraded faster than XDE-175-J. After one year of incubation, 1.2–2.8% and 0.3–2.9% of applied XDE-175-J and XDE-175-L respectively (dose rate, 0.21 mg/kg soil; 25 °C) remained as the parent in US soils tested. In European soils except the loamy sand, after 127 days of incubation, 2.0–4.9% and 1.4–5.0% of applied XDE-175-J and XDE-175-L respectively (dose rate, 0.80 mg/kg soil; 20 °C) remained as the parent. In the loamy sand, 50% and 33% of the applied XDE-175-J and XDE-175-L respectively (dose rate, 0.80 mg/kg soil; 20 °C) remained as the parent). In the sandy loam maintained at 10 °C, 4.9% and 2.1% of the applied XDE-175-J and XDE-175-L respectively (same dose rate as at 20 °C) remained as the parent.
Carbon dioxide was evolved slowly from all soils and accounted for 5.0–35% and 9.5–32% of the applied XDE-175-J and XDE-175-L respectively after one year at 25 °C, and 0.8–1.1% and 1.2–3.2% of the applied XDE-175-J and XDE-175-L respectively after 127 days at 20 °C.
As major degradation products, N-demethyl 175-J and N-demethyl-175-L were formed and then degraded during the study periods. As minor products (at or less than 10% of the applied dose), N-demethyl-N-nitroso-175-J, N-demethyl-N-nitroso-175-L, N-succinyl-175-L and N-succinyl-175-L were also formed and degraded. Many other degradates were formed but at very low concentrations.
While extractable radioactivity decreased, non-extractable radioactivity steadily increased to reach 22–29% and 32–37% of the applied XDE-175-J and XDE-175-L respectively after one year at 25 °C; and 5–15% and 11–24% of the applied XDE-175-J and XDE-175-L respectively after 127 days at 20 and 10 °C.
The half-life of spinetoram was calculated to be 21 days and 13 days for XDE-175-J and XDE-175-L respectively at 0.21 mg/kg dose rate (25 °C) and 20 days and 14 days for XDE-175-J and XDE-175-L respectively at 0.80 mg/kg dose rate (20 °C). When maintained at 10 °C the half-life was 21 days and 16 days for XDE-175-J and XDE-175-L respectively at 0.80 mg/kg dose rate. In the sterile sandy clay loam from Little Shelford, the half-life of XDE-175-J and XDE-175-L was much longer at 207 and 298 days respectively than in the respective unsterilized soil. The half-life of XDE-175-J and XDE-175-L under anaerobic condition in sandy loam from Longwoods Quarry was 203 days and 122 days respectively, much longer than the half-life under aerobic condition.
The half-life of N-demethyl-175-J and -L ranged 32–273 days and 5–88 days respectively at 25 °C and 136–301 days and 59–204 days at 20 °C.
Table 9 Results of aerobic soil metabolism studies [(J): XDE-175-J (L): XDE-175-L]
Ref: Yoder et al., 2005; Report 040068 Soil: Loam (Commerce) Dose rate: 0.21 mg ai/kg soil (both compounds) Duration: 276 days (J) and 365 days (L) Temperature: 25 ± 2 °C pH: 7.5 Moisture: 75% of 1/3 bar moisture Organic carbon: 0.6% Average half-life: 23 days (J) 17 days (L)
14C accountability: 97–108% (J) 90–105% (L) Mineralization at the end: 7.5% (J) 18% (L) Unextractable at the end: 22% (J) 33% (L) Average half-life of N-demethyl metabolite: 253 days (J) 88 days (L)

1660 Spinetoram
Spinetoram remaining at the end: 1.2% (J) 0.7% (L)
N-demethyl metabolite at the end: 45% (J) 9.1% (L)
Metabolite Max % of dose Day XDE-175-J 102 0 N-demethyl-175-J 68 98, 125 XDE-175-L 95 0 N-demethyl-175-L 41 32
Ref: Yoder et al., 2005; Report 040068 Soil: Silt loam (Fayette) Dose rate: 0.21 mg ai/kg soil (both compounds) Duration: 366 days (J) and 365 days (L) Temperature: 25 ± 2 °C pH: 7.4 Moisture: 75% of 1/3 bar moisture Organic carbon: 1.1% Average half-life: 29 days (J) 15 days (L) Spinetoram remaining at the end: 1.7%(J) 0.3% (L)
14C accountability: 92–109% (J) 92–104% (L) Mineralization at the end: 6.9% (J) 17% (L) Unextractable at the end: 23% (J) 37% (L) Average half-life of N-demethyl metabolite: 273 days (J) 18 days (L) N-demethyl metabolite at the end: 41% (J) 0.8% (L)
Metabolite Max % of dose Day XDE-175-J 95 0 N-demethyl-175-J 62 63 XDE-175-L 88 0 N-demethyl-175-L 29 7, 32
Ref: Yoder et al., 2005; Report 040068 Soil: Sandy loam (Kimberlina/Nord) Dose rate: 0.21 mg ai/kg soil (both compounds) Duration: 366 days (J) and 365 days (L) Temperature: 25 ± 2 °C pH: 8.1 Moisture: 75% of 1/3 bar moisture Organic carbon: 0.7% Average half-life: 23 days (J) 17 days (L) Spinetoram remaining at the end: 2.8%(J) 2.0% (L)
14C accountability: 97–109% (J) 98-107% (L) Mineralization at the end: 5.0% (J) 9.5% (L) Unextractable at the end: 25% (J) 35% (L) Average half-life of N-demethyl metabolite: 156 days (J) 29 days (L) N-demethyl metabolite at the end: 23% (J) 6.9% (L)
Metabolite Max % of dose Day XDE-175-J 98 0 N-demethyl-175-J 51 92 XDE-175-L 97 0 N-demethyl-175-L 33 32
Ref: Yoder et al., 2005; Report 040068 Soil: Loam (Slagle) Dose rate: 0.21 mg ai/kg soil (both compounds) Duration: 366 days (J) and 365 days (L) Temperature: 25 ± 2 °C pH: 5.8 Moisture: 75% of 1/3 bar moisture Organic carbon: 0.5% Average half-life: 8 days (J) 3 days (L) Spinetoram remaining at the end: 2.0%(J) 2.9% (L)
14C accountability: 90–104% (J) 8 8–104% (L) Mineralization at the end: 35% (J) 32% (L) Unextractable at the end: 29% (J) 32% (L) Average half-life of N-demethyl metabolite: 32 days (J) 5 days (L) N-demethyl metabolite at the end: 6.3% (J) 0.6% (L)

Spinetoram 1661
Metabolite Max % of dose Day XDE-175-J 93 0 N-demethyl-175-J 45 14 XDE-175-L 89 0 N-demethyl-175-L 35 123
Ref: Smith-Drake, et. al., 2007; Report 050076.1 Soil: Sandy loam (Longwoods Quarry) Dose rate: 0.80 mg ai/kg soil (both compounds) Duration: 127 days Temperature: 20 ± 2 °C pH: 7.9 Moisture: 10.8 g/g-soil at 1/3 bar Organic carbon: 0.8% Average half-life: 8 days (J) 7 days (L) Spinetoram remaining at the end: 2.0% (J) 1.4% (L)
14C accountability: 95–103% (J) 94–100% (L) Mineralization at the end: 0.9% (J) 3.2% (L) Unextractable at the end: 13% (J) 24% (L) Average half-life of N-demethyl metabolite: 136 days (J) 59 days (L) N-demethyl metabolite at the end: 36%(J) 15% (L)
Metabolite Max % of dose Day XDE-175-J 93 0 N-demethyl-175-J 46 29 N-demethyl-N-nitroso-175-J 19 85 XDE-175-L 93 0 N-demethyl-175-L 38 21 N-demethyl-N-nitroso-175-L 13 42 N-succinyl-175-L 13 42
In anaerobic condition, spinetoram remaining at the end (125 days): 4.2%(J) 7.1% (L) Average half-life: 203 days (J) 122 days (L)
Ref: Smith-Drake, et. al., 2007; Report 050076.1 Soil: Sandy loam (Longwoods Quarry) Dose rate: 0.80 mg ai/kg soil (both compounds) Duration: 127 days Temperature: 10 ± 2 °C pH: 7.9 Moisture: 10.8 g/g-soil at 1/3 bar Organic carbon: 0.8% Average half-life: 21 days (J) 16 days (L) Spinetoram remaining at the end: 4.9% (J) 2.1% (L)
14C accountability: 95–103% (J) 94–100% (L) Mineralization at the end: 0.9% (J) 1.4% (L) Unextractable at the end: 13% (J) 13% (L) Average half-life of N-demethyl metabolite: 386 days (J) 110 days (L) N-demethyl metabolite at the end: 36% (J) 27%(L)
Metabolite Max % of dose Day XDE-175-J 93 a 0 N-demethyl-175-J 45 43, 85 N-demethyl-N-nitroso-175-J
19 71, 99
XDE-175-L 93 1 0 N-demethyl-175-L 31 42 N-demethyl-N-nitroso-175-L
16 56
a Data from 20 °C experiment.
Ref: Smith-Drake, et. al., 2007; Report 050076.1 Soil: Loamy sand (Hanhofen) Dose rate: 0.80 mg ai/kg soil (both compounds) Duration: 127 days Temperature: 20 ± 2 °C pH: 6.0 Moisture: 9.7 g/g-soil at 1/3 bar
14C accountability: 95–102% (J) 94–101% (L) Mineralization at the end: 0.4% (J) 1.2% (L) Unextractable at the end: 4.7% (J) 11% (L)

1662 Spinetoram
Organic carbon: 1.8% Average half-life: 129 days (J) 71 days (L) Spinetoram remaining at the end: 50% (J) 33% (L)
Average half-life of N-demethyl metabolite: 180 days (J) 72 days (L) N-demethyl metabolite at the end: 30% (J) 17% (L)
Metabolite Max % of dose Day XDE-175-J 88 0 N-demethyl-175-J 30 113 N-demethyl-N-nitroso-175-J
1.6 113
XDE-175-L 92 0 N-demethyl-175-L 20 84 N-demethyl-N-nitroso-175-L
3.7 7
Ref: Smith-Drake, et. al., 2007; Report 050076.1 Soil: Sandy clay loam (Little Shelford) Dose rate: 0.80 mg ai/kg soil (both compounds) Duration: 127 days Temperature: 20 ± 2°C pH: 7.8 Moisture: 16.9 g/g-soil at 1/3 bar Organic carbon: 1.2% Average half-life: 11 days (J) 8 days (L) Spinetoram remaining at the end: 3.2% (J) 2.1% (L)
14C accountability: 96–106% (J) 91–101% (L) Mineralization at the end: 0.8% (J) 2.9% (L) Unextractable at the end: 15% (J) 24% (L) Average half-life of N-demethyl metabolite: 292 days (J) 112 days (L) N-demethyl metabolite at the end: 55% (J) 22% (L)
Metabolite Max % of dose Day XDE-175-J 91 0 N-demethyl-175-J 57 99 N-demethyl-N-nitroso-175-J
5.4 85
XDE-175-L 93 0 N-demethyl-175-L 37 14 N-demethyl-N-nitroso-175-L
2.8 28
In the sterile soil, spinetoram remaining at the end (120 days): 54% (J) 74% (L) Average half-life: 207 days (J) 298 days (L)
Ref: Smith-Drake, et. al., 2007; Report 050076.1 Soil: Sandy clay loam (Altlussheim) Dose rate: 0.80 mg ai/kg soil (both compounds) Duration: 127 days Temperature: 20 ± 2 °C pH: 7.8 Moisture: 20.4 g/g-soil at 1/3 bar Organic carbon: 1.3% Average half-life: 15 days (J) 12 days (L) Spinetoram remaining at the end: 4.9% (J) 5.0% (L)
14C accountability: 95–103% (J) 95–100% (L) Mineralization at the end: 1.1% (J) 2.5% (L) Unextractable at the end: 12% (J) 17% (L) Average half-life of N-demethyl metabolite: 301 days (J) 204 days (L) N-demethyl metabolites at the end: 58% (J) 39% (L)
Metabolite Max % of dose Day XDE-175-J 87 0 N-demethyl-175-J 59 85 N-demethyl-N-nitroso-175-J
10 57
XDE-175-L 91 0 N-demethyl-175-L 42 84, 98 N-demethyl-N-nitroso-175-L
5.6 70

Spinetoram 1663
Figure 5 Proposed Degradation Pathway of XDE-175-J in Soil under Aerobic Conditions
O
O O
O H
O
O O
O H
C H 3
H H H
O
O
N
O
O O
O O H
O
O O
O H C H 3
H H H
O
N H
O
O O
O O H
O
O O
O H
C H 3
H H H
O
N N O
O
O O
O H
O
O O
O H
C H 3
H H H
O
O
N
O O
O H
XDE-175-J
N-demethyl-175-J
N-demethyl-N-nitroso-175-J
N-succinyl-175-J
Unextractableresidues

1664 Spinetoram
Figure 6 Proposed Degradation Pathway of XDE-175-L in Soil under Aerobic Conditions
Aqueous photolysis
The aqueous photolysis of radiolabelled spinetoram was studied at 25 °C in sterile aqueous tris buffer solution at pH 7 (Yoder, et al., 2005, Report 040079). XDE-175-J was added at approximately 0.3 mg ai/L and XDE-175-L at 0.5 mg ai/L. Acetonitrile (0.5%) was used as a co-solvent. Samples were continuously irradiated using a xenon lamp as a light source. No trapping of CO2 or organic volatiles took place.
Samples were analysed after 4, 8 and 16 h, and 1, 2, 4, 7, 13 and 19 days of continuous irradiation; 24 h of continuous exposure (1 DAT) was equivalent to 1.8 days of summer sunlight at
O
O O
O H
O
O O
O H
C H 3
H H H
O
O
N
O
O O
O O H
O
O O
O H
C H 3
H H H
O
N H
O
O O
O O H
O
O O
O H
C H 3
H H H
O
N N
O
O
O O
O H
O
O O
O H
C H 3
H H H
O
O
N
O O H O
XDE-175-L
N-demethyl-175-L
N-demethyl-N-nitroso-175-L N-succinyl-175-L
Unextractable Residues

Spinetoram 1665
40° N latitude. Time 0 samples and dark controls were also analysed. Aliquots of each sample were directly analysed by LSC and HPLC. Characterization of transformation products was done by LC/MS.
A PNAP/pyridine chemical actinometer solution was used to quantify the amount of light that the sample solutions received. Based on actinometer data, the 19 experimental days of continuous irradiation was equivalent to 34 days of irradiation in the summer sun at 40° N latitude.
Material balance was 101.1 ± 3.7% of applied radioactivity for the irradiated XDE-175-J solutions and 95.8 ± 3.4% for the dark XDE-175-J controls. Irradiated and dark XDE-175-L solutions had a material balance of 94.2 ± 2.0% and 96.7 ± 4.0%, respectively. At test termination, greater than 90% of the applied amount remained as parent in the dark controls indicating that negligible transformation of the parent compounds occurred in the dark. No degradates were observed in the dark controls.
In the irradiated solutions, the concentration of XDE-175-J decreased from 98% at 0 DAT to 0% (95% to 0% for XDE-175-L) of the applied amount at study termination. The major transformation product detected in the irradiated XDE-175-J solutions had a molecular weight of 813 g/mol and a chemical formula of C42H71NO14. This degradate reached a maximum concentration of 11% of the applied amount at 7 DAT before declining to approximately 1% at study termination. The major product formed from XDE-175-L photodegradation was N-demethyl-L, which reached a maximum concentration of 13% of the applied radioactivity after 4 h of irradiation and declined to less that 1% after 2 DAT. Numerous minor degradate peaks were observed that were not identified, but all were less than 10% of the applied radioactivity from either parent compounds. No loss of radioactivity due to volatiles was observed.
Photodegradation of XDE-175-J resulted in a complex pathway containing numerous degradates, of which only one (Molecular Weight 813) was observed at concentrations greater than 10% of applied. Photoproducts with additional oxygen atoms or hydroxyl groups were observed. As many as 80 peaks, each accounting for less than 5% of the applied radioactivity, were observed at study termination. Photodegradates became increasingly polar over time.
As a major degradate, N-demethyl-175-L was observed in solutions dosed with XDE-175-L. The N-demethyl-175-L degradate and parent XDE-175-L degraded rapidly to numerous increasingly polar compounds. As many as 75 minor peaks (less than 5% of the applied radioactivity) were detected at 19 DAT. The polar degradates formed from the photolysis of both XDE-175-J and XDE-175-L were presumed to be products created by cleavage of the macrolide ring.
Aqueous hydrolysis
Hydrolysis of radiolabelled XDE-175-J and XDE-175-L at 0.5 mg ai/L was studied in the dark at 25 °C in sterile aqueous buffered solutions at pH 5 (acetate), pH 7 (THAM), and pH 9 (borate) for 30 days (Rutherford, et al., 2005, Report 040108). Samples were analysed at 0, 2, 7, 14, 21, and 30 days by diluting the samples with a mixture of acetonitrile and methanol to adjust the concentration of acetonitrile at 20%.
For XDE-175-J-containing solutions, material balance was 98.4 ± 1.0%, 97.6 ± 1.4% and 97.0 ± 1.4% of the applied radioactivity at pH 5, pH 7 and pH 9, respectively. The concentration of parent compound remained constant at 96.2 ± 1.6%, 94.5 ± 2.1%, and 91.3 ± 2.5% of applied radioactivity at pH 5, pH 7, and pH 9, respectively. At pH 9, a minor transformation product, N-demethyl-175-J, with a maximum average concentration of 6.7% of applied radioactivity, was observed on the 30th day of incubation. Volatiles were not trapped. The average unidentified radioactivity was 2.7, 3.3 and 1.6% of the applied amount at pH 5, pH 7 and pH 9, respectively, at study termination.
XDE-175-J was stable to hydrolysis at pH 5 and pH 7. Although a degradate product formed at pH 9, the averaged parent compound concentration did not decrease below 89% of the applied radiocarbon.

1666 Spinetoram
For XDE-175-L-containing solutions, material balance was 94.0 ± 1.2%, 96.9 ± 0.8% and 97.0 ± 1.3% of the applied radioactivity at pH 5, pH 7, and pH 9, respectively. The concentration of parent compound remained constant at 90.4 ± 2.4% and 92.6 ± 2.1% of applied radiocarbon at pH 5 and pH 7, respectively. At test termination, the average concentration of the parent compound had decreased from 92.1 to 81.6% of the initial applied radioactivity at pH 9. At pH 9 the major transformation product was N-demethyl-175-L, with a maximum average concentration of 11.9% of applied radioactivity, observed on the 30th day of incubation. No minor transformation products were detected. Volatiles were not trapped. The average unidentified radioactivity was 4.8, 5.1 and 3.1% of the applied amount at pH 5, pH 7 and pH 9, respectively, at study termination.
XDE-175-L was stable to hydrolysis at pH 5 and pH 7. Using simple first-order kinetics, the degradation rate constant of XDE-175-L at pH 9 was 0.0045 days-1, which corresponds to a half-life of 154 days and a DT90 of 512 days.
In summary, no hydrolysis of XDE-175-J or XDE-175-L occurred at pH 5 or pH 7. At pH 9, N-demethyl-175-J and N-demethyl-175-L were observed as minor transformation products on the 30th day of incubation. No other minor transformation products were detected.
Residues in Succeeding Crops
In an rotational crop study conducted in the USA in 2008 (Graper and Smith, 2008; Report 040086.01), applications of 14C-XDE-175-J or 14C-XDE-175-L were made to confined, outdoor plots of sandy loam soil at rates of 405 and 135 g ai/ha, respectively, which were equivalent to the seasonal maximum use rate (based on 3 to 1 ratio in the final formulation). The test plots were aged for 30, 120 and 365 days after treatment (DAT), and radishes, lettuce, and wheat were planted into the plots at each interval (plant-back). Immature and mature radishes, immature and mature lettuce, wheat forage, wheat hay, and mature wheat grain and straw were harvested from the plots.
Total radioactive residues (TRR) in the raw agricultural commodities (RAC), expressed as mg of XDE-175 equivalents per kg plant tissue (mg/kg) are summarized in Table 10.
Table 10 Total radioactive residues determined in rotational crops planted 30, 120, and 365 days after application of radiolabelled spinetoram to soil
Total radioactive residues (mg-XDE-175 equivalents/kg)
RADISH LETTUCE WHEAT
Immature tops
Mature tops
Mature roots
Immature Mature Forage Hay Straw Grain
30 DAT a (68) (89) (89) (82) (89) (105) (140) (177) (177)
Control b < LOQ < LOD < LOD < LOD < LOQ < LOD < LOD < LOD < LOD
XDE-175-J 0.079 0.014 0.005 0.085 0.027 0.004 0.013 c 0.022 < LOQ
XDE-175-L
0.021 < LOQ < LOD 0.033 0.016 < LOQ < LOQ 0.015 < LOQ
120 DAT a (56) (69) (69) (56) (69) (77) (93) (128) (128)
XDE-175-J 0.013 0.006 < LOQ 0.012 < LOQ 0.011 0.014 0.023 < LOQ
XDE-175-L
< LOQ < LOQ < LOQ < LOQ < LOQ < LOQ 0.008 d 0.020 < LOQ
365 DAT a (31) (58) (58) (31) (58) (31) (129) (205) (205)
XDE-175-J 0.018 0.016 0.006 0.013 0.005 0.013 0.031 0.045 0.008
XDE-175-L
0.006 < LOQ < LOQ 0.016 < LOQ < LOQ 0.021 0.029 0.006
a Days between planting and harvest. b Limits of detection (LOD): 0.001 and 0.002 mg/kg for XDE-175-J and XDE-175-L, respectively.
Limits of quantification (LOQ): 0.004 and 0.006 mg/kg for XDE-175-J and XDE-175-L, respectively. c Measured TRR value of 0.009 mg/kg (40% moisture) adjusted to 0.013 mg/kg (15% moisture). d Measured TRR value of 0.007 mg/kg (23.5% moisture) adjusted to 0.008 mg/kg (15% moisture).

Spinetoram 1667
No radioactive residues greater than 0.085 mg/kg, in spinetoram-equivalents, were found in any of the crops evaluated. Crop samples that contained TRR of 0.010 mg/kg or higher were subjected to solvent extraction, and unextractable residues in tissue were less than 0.019 mg/kg. The extractable radioactivity was characterised further by solvent partitioning. Residues of no greater than 0.065, 0.004 and 0.007 mg/kg were found in the neutral organic phases, acidic organic phases, and in the extracted aqueous phase, respectively. The organic phases were purified with silica solid phase extraction (SPE), and then eluates were analysed by HPLC. In any immature or mature sample, no single component exceeded 0.024 mg/kg or 0.007 mg/kg, respectively. The N-demethyl-175-J and N-formyl-175-J metabolites and parent XDE-175-J were tentatively identified at 0.024 mg/kg or less in 30 DAT immature samples and at 0.007 mg/kg or less in 30 DAT mature samples.
At 120 DAT and 365 DAT, no radioactive residues were associated with any of XDE-175-L, N-demethyl-175-L or N-formyl-175-L. The results of 120 DAT indicated that no single residue greater than 0.006 mg/kg was present. Of the XDE-175-J treated crop samples, radish (immature tops), radish (mature tops), lettuce (immature), and wheat forage, hay, and straw contained TRR greater than 0.010 mg/kg but the concentrations were too low for identification.
The characterization and identification of radioactive residues in 30 DAT samples following treatment with radiolabelled XDE-175-J is summarized in Table 11. Identification of the residues from XDE-175-L treated crops was not possible due to low concentration of residues.
Table 11 Characterization and identification of radioactive residues in rotational crops following application of radiolabelled spinetoram
Radish Lettuce
Immature Mature Immature Mature
Wheat hay Wheat straw Compound
%TRR
mg/kg %TRR
mg/kg %TRR
mg/kg %TRR
mg/kg %TRR
mg/kg %TRR
mg/kg
Application of 14C-XDE-175-J at 0.41 kg ai/ha (30DAT)
XDE-175-J 16.1 0.012 - - 14.1 0.012 -- -- -- -- -- --
N-demethyl-175-J
- - -- -- -- --
O-deethyl-175-J 26.8 0.021 - - 29.3 0.025 25.3 0.007 -- -- -- --
N-formyl-175-J - - -- -- -- --
Total identified 42.9 0.033 - - 43.4 0.037 25.3 0.007 -- -- -- --
Total characterised
43.2 0.035 75.4 0.010 42.3 0.036 62.7 0.017 55.3 0.007 56.7 0.013
Total extractable 86.1 0.068 75.4 0.010 85.7 0.073 88.0 0.024 55.3 0.007 56.7 0.013
Total unextractable
13.9 0.011 24.6 0.003 14.3 0.012 15.4 0.004 44.7 0.006 43.3 0.010
Total measured (TRR in ( ))
100 (0.079) 100 (0.014) 100 (0.085) 103.4 (0.027) 100 (0.013) 100 (0.022)
Application of 14C-XDE-175-L at 0.13 kg ai/ha (30DAT)
Total identified - - - - - - - -
Total characterised
60.2 0.013 66.3 0.022 66.5 0.010 50.7 0.007
Total extractable 60.2 0.013 66.3 0.022 66.5 0.010 50.7 0.007
Total unextractable
39.8 0.009 33.7 0.011 33.5 0.005 49.3 0.007
Total measured (TRR in ( ))
100 (0.021) 100 (0.033) 100 (0.015) 100 (0.015)

1668 Spinetoram
Radish tops, immature
Lettuce, immature
Wheat forage Wheat hay Wheat straw Compound
%TRR mg/kg %TRR mg/kg %TRR mg/kg %TRR mg/kg %TRR mg/kg Application of 14C-XDE-175-J at 0.41 kg ai/ha (120DAT) Total identified - - Total characterised 71.4 0.009 76.6 0.009 70.7 0.008 53.9 0.007 57.3 0.013 Total extractable 71.4 0.009 76.6 0.009 70.7 0.008 53.9 0.007 57.3 0.013 Total unextractable 28.6 0.004 23.4 0.003 29.3 0.003 46.1 0.006 42.7 0.010 Total measured (TRR in ( ))
100 (0.013) 100 (0.012) 103 (0.011) 100 (0.014) 100 (0.023)
Radish, immature tops
Radish mature tops
Lettuce, immature
Wheat forage Wheat hay Wheat straw Compound
%TRR
mg/kg %TRR
mg/kg
%TRR
mg/kg %TRR
mg/kg
%TRR
mg/kg %TRR
mg/kg
Application of 14C-XDE-175-J at 0.41 kg ai/ha (365DAT) Total identified - - - - - - - - - - - - Total characterised
63.4 0.011 64.7 0.010 71.8 0.010 73.2 0.010 51.1 0.016 58.2 0.026
Total extractable
63.4 0.011 64.7 0.010 71.8 0.010 73.2 0.010 51.1 0.016 58.2 0.026
Total unextractable
36.6 0.006 35.3 0.006 28.2 0.004 26.8 0.003 48.9 0.015 41.8 0.019
Total measured (TRR in ( ))
100 (0.018)
100 (0.016)
100 (0.013)
103 (0.013)
100 (0.031)
100 (0.045)
Application of 14C-XDE-175-L at 0.13 kg ai/ha (365DAT) Total identified - - - - - - Total characterised
60.2 0.010 32.6 0.007 54.1 0.015
Total extractable
60.2 0.010 32.6 0.007 54.1 0.015
Total unextractable
39.8 0.006 67.4 0.014 45.9 0.013
Total measured (TRR in ( ))
100 (0.016)
100 (0.021)
100 (0.029)
The levels of radioactivity taken up from soil treated with [14C]spinetoram into the three succeeding crops (radish, lettuce, and wheat) planted 30, 120, or 365 days after treatment, were below 0.085 mg/kg spinetoram equivalents. Since such low radioactive residues were found in analysed fractions of these rotational crop samples, spinetoram is unlikely to be taken up readily by succeeding crops.
METHODS OF RESIDUE ANALYSIS
Analytical methods
Analytical methods for determination of residues of XDE-175-J and XDE-175-L and a set of their metabolites, including N-demethyl-175-J and -L, N-formyl-175-J and -L were developed for a wide range of plant matrices and animal matrices.
After an extraction specific to matrix, and a reasonably standard cleanup, spinetoram and the metabolites were determined by HPLC with positive-ion electron-spray (ESI) tandem mass spectrometry (HPLC-MS/MS). The methods have been extensively validated with numerous recovery tests on a wide range of matrices.

Spinetoram 1669
Multi-residue Methods
FDA Multi-Residue Method PAM, Vol. I
The applicability of the multi-residue screen methods outlined in the FDA Pesticide Analytical Manual, Volume I, Third Edition was assessed for spinetoram and its metabolites, XDE-175-J and XDE-175-L, N-demethyl-175-J and -L, and N-formyl-175-J and –L (Peyton, 2005, Report 051013). The test substances were analysed in accordance with selected multiresidue methods (MRMs) described in Protocols A and C of the FDA PAM I. Results of the tests summarized below show that the FDA PAM I multi-residue methods are not suitable for enforcement purposes.
Protocol A: XDE-175-J, XDE-175-L, N-demethyl-XDE-175-J, N-demethyl-XDE-175-L, N-formyl-XDE-175-J and N-formyl-XDE-175-L were each injected at approximately 1000 ng and showed no response in FSD when analysed according to the above procedures outlined in Protocol A. Because no fluorescence was demonstrated for any of the test substances, no further procedures were required for Protocol A
Protocol B: Because the analytes are not acids or phenols, testing through Protocol B was not required.
Protocol C: All test substances were subjected to Protocol C, modules DG-1, DG-5, DG-13, DG-17, and DG-18. GC systems for each module were set up appropriately according to the parameters described in the PAM Volume 1, Section 302. The test substances were analysed using a nitrogen-phosphorous detector set to nitrogen mode detection according to modules DG-5 and DG-17. DG-5 analysed the test substances at 1000 ng. Results for the analytes at 1000 ng were off-scale and therefore were reanalysed at 200 ng. DG-5 analysis resulted in sample peaks that were broad with significant tailing. DG-17 analysis resulted in sample peaks that were less broad but still contained a significantly large tailing factor. Modules DG-5 and DG-17 were unsuccessful for XDE-175 due to broad peak shape and tailing factors observed. Failure of the test substances to produce quantifiable peaks using the nitrogen-specific modules led to analysis of the test substance by more general modules, non-specific for chemical properties, DG-1, DG-13 and DG-18. No peaks were observed for any of the test substances using electron capture detection modules. Protocol C was unsuccessful due to chromatographic peak broadening and tailing and (for electron capture detection) a lack of detectability.
Protocols D, E, and F: Due to the poor sensitivity and poor chromatographic properties of the test substances to detection by methods described in Protocol C, no further analyses were performed by Protocol D and Protocol E.
Protocol G: Because the test substances are not carbamates, testing through Protocol G was not required.
Multi-Residue Enforcement Method, DFG S19
The German multi-residue enforcement method DFG S19 was intended for the determination of pesticides by gas chromatography (GC). Recently it was proposed to extend the S19 based modular multi-method L 00.00-34 (German §35 LMBG) by a module using liquid chromatography with tandem mass spectrometric detection (LC-MS/MS) for the determination of a multitude of active substances.
Various DFG S19 extraction modules were employed: extraction module E 1 was used for apple; extraction module E 2 was assessed for wheat grain; module E 3 was used for whole orange and grape; and module E 7 was assessed for oilseed rape seed. Basic steps of the E 1, E 2, and E 3 extraction modules are adjustment of neutral pH (if necessary) and total water to 100 mL followed by extraction with water/acetone (1/2, v/v) and subsequent partition into the organic phase by addition of sodium chloride and ethyl acetate/cyclohexane (1/1, v/v). Module E 7 uses extraction with acetonitrile/acetone (225/25, v/v) with addition of synthetic calcium silicate (Calflo E) and Celite to eliminate oily plant matrix and facilitate filtration.

1670 Spinetoram
The DFG S19 multiresidue method, in conjunction with LC-MS/MS determination, using matrix matched standards for external calibration, was validated for XDE-175-J and XDE-175-L, N-demethyl-175-J and -L, and N-formyl-175-J and -L in three plant matrices, apple, grape, and orange (Class, 2007; Report 061066). Validation was also attempted for wheat grain and for oilseed rape seed but was unsuccessful most likely due to incomplete extraction and excessive matrix effects. Recoveries of spinetoram and its metabolites in apples, oranges and grape using the multiresidue method are summarized in Table 12. Average recoveries ranged between 73% and 102%, with relative standard deviations of ≤ 14% for all analytes and matrices.
Table 12 Procedural recovery for spinetoram and its metabolites from fortified apple, grape, and orange samples, using the multiresidue method, DFG S-19
Recovery Rate (%) Analyte Matrix
Fortification
Level (mg/kg) mean range
RSD
(%) n
XDE-175-J Apple 0.010 83 77–91 8 5
m/z Q1/Q3 748.7/142.1 1.0 84 81–88 3 5
0.010–1.0 84 77–91 6 10
XDE-175-L Apple 0.010 83 77–91 8 5
m/z Q1/Q3 760.7/142.1 1.0 79 71–86 8 5
0.010–1.0 81 71–91 8 10
N-demethyl-175-J Apple 0.010 82 75–90 7 5
m/z Q1/Q3 734.7/127.9 1.0 79 76–81 3 5
0.010–1.0 80 75–90 6 10
N-demethyl-175-L Apple 0.010 82 69–95 13 5
m/z Q1/Q3 746.8/127.9 1.0 73 69–78 5 5
0.010–1.0 79 69–95 11 10
N-formyl-175-J Apple 0.010 96 90–100 9 5
m/z Q1/Q3 762.3/156.1 1.0 91 88–92 5 5
0.010–1.0 93 88–100 8 10
N-formyl-175-L Apple 0.010 103 85–112 11 5
m/z Q1/Q3 774.3/155.9 1.0 87 84–89 2 5
0.010–1.0 95 84–112 12 10
XDE-175-J Apple 0.010 85 79–92 6 5
m/z Q1/Q3 748.7/98.2 1.0 82 79–86 4 5
0.010–1.0 83 79–92 5 10
XDE-175-L Apple 0.010 80 77–87 5 5
m/z Q1/Q3 760.7/98.2 1.0 79 71–86 8 5
0.010–1.0 79 71–87 6 10
N-demethyl-175-J Apple 0.010 85 77–94 8 5
m/z Q1/Q3 734.7/84.2 1.0 72 69–75 4 5
0.010–1.0 78 69–94 11 10
N-demethyl-175-L Apple 0.010 86 76–98 12 5
m/z Q1/Q3 746.8/84.2 1.0 73 69–79 6 5
0.010–1.0 80 69–98 12 10
N-formyl-175-J Apple 0.010 105 98–112 5 5
m/z Q1/Q3 762.3/203.0 1.0 89 88–90 1 5
0.010–1.0 97 88–112 9 10
N-formyl-175-L Apple 0.010 105 91–115 9 5
m/z Q1/Q3 774.3/203.0 1.0 87 84–89 2 5

Spinetoram 1671
Recovery Rate (%) Analyte Matrix
Fortification
Level (mg/kg) mean range
RSD
(%) n
0.010–1.0 96 84–115 12 10
XDE-175-J Grape 0.010 92 84–96 6 4
m/z Q1/Q3 748.7/142.1 1.0 84 77–91 7 5
0.010–1.0 87 77–96 7 9
XDE-175-L Grape 0.010 88 80–92 6 4
m/z Q1/Q3 760.7/142.1 1.0 78 71–84 7 5
0.010–1.0 82 71–92 9 9
N-demethyl-175-J Grape 0.010 84 77–91 7 4
m/z Q1/Q3 734.7/127.9 1.0 78 73–83 6 5
0.010–1.0 81 73–91 7 9
N-demethyl-175-L Grape 0.010 86 76–100 12 4
m/z Q1/Q3 746.8/127.9 1.0 73 69–77 4 5
0.010–1.0 79 69–100 12 9
N-formyl-175-J Grape 0.010 102 88–111 9 5
m/z Q1/Q3 762.3/156.1 1.0 94 90–100 5 5
0.010–1.0 98 88–111 8 10
N-formyl-175-L Grape 0.010 97 89–106 8 5
m/z Q1/Q3 774.3/155.9 1.0 94 91–98 3 5
0.010–1.0 96 89–106 6 10
XDE-175-J Grape 0.010 90 85–95 5 4
m/z Q1/Q3 748.7/98.2 1.0 82 76–89 7 5
0.010–1.0 86 76–95 8 9
XDE-175-L Grape 0.010 84 77–89 7 4
m/z Q1/Q3 760.7/98.2 1.0 76 69–83 8 5
0.010–1.0 80 69–89 9 9
N-demethyl-175-J Grape 0.010 85 78–95 9 4
m/z Q1/Q3 734.7/84.2 1.0 77 72–81 5 5
0.010–1.0 80 72–95 9 9
N-demethyl-175-L Grape 0.010 91 77–106 13 4
m/z Q1/Q3 746.8/84.2 1.0 75 72–79 4 5
0.010–1.0 82 72–106 14 9
N-formyl-175-J Grape 0.010 97 89–106 7 5
m/z Q1/Q3 762.3/203.0 1.0 94 89–100 5 5
0.010–1.0 96 89–106 6 10
N-formyl-175-L Grape 0.010 96 83–113 12 5
m/z Q1/Q3 774.3/203.0 1.0 91 86–98 6 5
0.010–1.0 94 83–113 9 10
XDE-175-J Orange 0.010 102 92–114 9 5
m/z Q1/Q3 748.7/142.1 1.0 97 93–100 3 5
0.010–1.0 99 92–114 7 10
XDE-175-L Orange 0.010 94 86–104 7 5
m/z Q1/Q3 760.7/142.1 1.0 92 81–99 9 5
0.010–1.0 93 81–104 7 10
N-demethyl-175-J Orange 0.010 96 89–112 10 5

1672 Spinetoram
Recovery Rate (%) Analyte Matrix
Fortification
Level (mg/kg) mean range
RSD
(%) n
m/z Q1/Q3 734.7/127.9 1.0 93 88–96 4 5
0.010–1.0 95 88–112 7 10
N-demethyl-175-L Orange 0.010 91 83–113 14 5
m/z Q1/Q3 746.8/127.9 1.0 89 79–95 8 5
0.010–1.0 90 79–113 11 10
N-formyl-175-J Orange 0.010 102 95–105 4 5
m/z Q1/Q3 762.3/156.1 1.0 95 92–98 3 5
0.010–1.0 99 92–105 5 10
N-formyl-175-L Orange 0.010 96 90–107 7 5
m/z Q1/Q3 774.3/155.9 1.0 102 97–105 3 5
0.010–1.0 99 90–107 6 10
XDE-175-J Orange 0.010 95 87–104 8 5
m/z Q1/Q3 748.7/98.2 1.0 93 89–96 3 5
0.010–1.0 94 87–104 6 10
XDE-175-L Orange 0.010 93 86–101 6 5
m/z Q1/Q3 760.7/98.2 1.0 90 79–97 9 5
0.010–1.0 92 79–101 8 10
N-demethyl-175-J Orange 0.010 89 82–100 8 5
m/z Q1/Q3 734.7/84.2 1.0 90 85–92 4 5
0.010–1.0 90 82–100 6 10
N-demethyl-175-L Orange 0.010 92 84–106 10 5
m/z Q1/Q3 746.8/84.2 1.0 87 79–92 8 5
0.010–1.0 89 79–106 9 10
N-formyl-175-J Orange 0.010 102 98–108 5 5
m/z Q1/Q3 762.3/203.0 1.0 95 91–98 3 5
0.010–1.0 99 91–108 5 10
N-formyl-175-L Orange 0.010 101 92–104 6 5
m/z Q1/Q3 774.3/203.0 1.0 101 98–104 3 5
0.010–1.0 101 92–104 4 10
The FDA PAM I multi-residue methods were found to be unsuitable for the determination of spinetoram and its metabolites in plant and animal matrices for enforcement purposes.
The DFG S19 multi-residue method was only successfully validated for the determination of spinetoram and it metabolites in apples, grapes and oranges when using matrix-matched calibration standards. It was not successful for the determination of the analytes in wheat grain and for oilseed rape seed due to matrix effects. The addition of GPC clean-up was not helpful in achieving successful results, most likely due to the fact that the large molecules elute early with the oily biomolecules. It was therefore predicted that this method would not work for determination of spinetoram and its metabolites in animal matrices.
Analytical Methods for Determination of Residues in Foods and Feeding stuffs of Plant Origin Used
in Supervised Trials
Methods GRM 05.03 and GRM 05.04 have been developed for the determination of residues of XDE-175-J and XDE-175-L and their metabolites N-demethyl-175-J and -L, N-formyl-175-J and -L in plant matrices using HPLC with positive-ion electron-spray (ESI) tandem mass spectrometry (LC-MS/MS).

Spinetoram 1673
Method GRM 05.03
In method GRM 05.03 developed by Hastings and Wendelburg (2005), residues of spinetoram and its metabolites are extracted from agricultural commodities by shaking with an acetonitrile/water (80:20, v/v) solution. An aliquot of the extraction solvent is removed and a stable isotope internal standard solution containing XDE-175 and metabolites is added. XDE-175 and its metabolites are analysed without sample clean-up by liquid chromatography with positive-ion electron-spray ionization (ESI) tandem mass spectrometry (LC-MS/MS).
The method was validated over the concentration range of 0.01-1.0 mg/kg for all crops (dry crops, wet crops, oily crops and acidic crops), except lettuce which was validated over the concentration range of 0.01–10 mg/kg. The validated limit of quantification (LOQ) for all crops was 0.01 mg/kg (Hastings, 2005, Report 041021). Recoveries of spinetoram and its metabolites in a number of crops fortified at various levels are summarized in Table 13. Average recovery ranged between 82% and 106%, with relative standard deviations of ≤ 15% for analytes in all crops, except for N-formyl-175-L in oily crops, where the relative standard deviation was 27%.
Table 13 Procedural recovery for spinetoram and its metabolites in various plant matrices using Method GRM 05.03
Recovery Rate (%) Analyte Matrix
Fortification Level (mg/kg) mean range
RSD (%)
n
XDE-175-J Wet Crop a 0.01 99 89–107 5.1 18
1.0 96 88–101 3.7 16
10 93 89–99 4.3 6
0.01–10 97 88–107 4.9 40
XDE-175-L Wet Crop 0.01 106 97–116 4.4 18
1.0 102 97–107 3.0 16
10 93 90–96 2.1 6
0.01–10 103 90–116 5.4 40
N-demethyl-175-J Wet Crop 0.01 99 89–116 7.1 18
1.0 102 98–109 3.1 16
10 92 87–97 3.6 6
0.01–10 99 87–116 6.4 40
N-demethyl-175-L Wet Crop 0.01 98 89–114 6.6 18
1.0 100 96–103 2.1 16
10 93 90–95 1.8 6
0.01–10 98 89–114 5.2 40
N-formyl-175-J Wet Crop 0.01 90 79–106 8.1 18
1.0 94 87–100 4.6 16
10 88 82–96 5.9 6
0.01–10 91 79–106 6.8 40
N-formyl-175-L Wet Crop 0.01 89 76–101 6.9 18
1.0 92 86–100 4.0 16
10 89 87–92 2.6 6
0.01–10 90 76–101 5.4 40
XDE-175-J Dry Crop b 0.01 90 83–103 5.6 20
1.0 91 84–100 4.5 20
0.01–1.0 91 83–103 5.0 40
XDE-175-L Dry Crop 0.01 104 97–114 4.5 20
1.0 102 96–109 2.9 20

1674 Spinetoram
Recovery Rate (%) Analyte Matrix
Fortification
Level (mg/kg) mean range
RSD
(%) n
0.01–1.0 103 96–114 3.9 40
N-demethyl-175-J Dry Crop 0.01 102 94–109 3.6 20
1.0 103 97–110 3.1 20
0.01–1.0 103 94–110 3.3 40
N-demethyl-175-L Dry Crop 0.01 103 94–109 4.1 20
1.0 104 98–113 3.5 20
0.01–1.0 104 94–113 3.8 40
N-formyl-175-J Dry Crop 0.01 99 77–115 9.1 20
1.0 100 82–111 7.0 20
0.01–1.0 99 77–115 8.0 40
N-formyl-175-L Dry Crop 0.01 91 71–109 11.0 20
1.0 96 81–109 8.5 20
0.01–1.0 93 71–109 10.1 40
XDE-175-J Acidic Crop c 0.01 99 89–114 7.2 17
1.0 94 86–100 4.0 18
0.01–1.0 96 86–114 6.4 35
XDE-175-L Acidic Crop 0.01 107 97–116 5.4 17
1.0 102 95–107 3.1 18
0.01–1.0 104 95–116 5.2 35
N-demethyl-175-J Acidic Crop 0.01 102 95–115 5.1 17
1.0 100 96–106 2.8 18
0.01–1.0 101 95–115 4.2 35
N-demethyl-175-L Acidic Crop 0.01 102 93–112 5.7 17
1.0 101 96–106 2.8 18
0.01–1.0 101 93–112 4.4 35
N-formyl-175-J Acidic Crop 0.01 94 79–112 10.5 17
1.0 94 80–106 7.2 18
0.01–1.0 94 79–112 8.8 35
N-formyl-175-L Acidic Crop 0.01 93 73–107 10.2 17
1.0 94 86–100 3.9 18
0.01–1.0 93 73–107 7.5 35
XDE-175-J Oily Crop d 0.01 94 88–102 5.3 10
1.0 95 87–102 4.7 10
0.01–1.0 95 87–102 4.9 20
XDE-175-L Oily Crop 0.01 96 90–102 4.5 10
1.0 100 95–107 4.3 10
0.01–1.0 98 90–107 4.8 20
N-demethyl-175-J Oily Crop 0.01 96 92–101 3.2 10
1.0 102 95–110 5.1 10
0.01–1.0 99 92–110 5.1 20
N-demethyl-175-L Oily Crop 0.01 89 80–99 6.0 10
1.0 94 84–101 5.2 10
0.01–1.0 92 80–101 6.3 20
N-formyl-175-J Oily Crop 0.01 89 71–110 15.0 10

Spinetoram 1675
Recovery Rate (%) Analyte Matrix
Fortification
Level (mg/kg) mean range
RSD
(%) n
1.0 96 85–105 6.8 10
0.01–1.0 92 71–110 11.7 20
N-formyl-175-L Oily Crop 0.01 80 48–113 27.5 10
1.0 83 48–108 25.1 10
0.01–1.0 82 48–113 25.7 20 a “Wet crop” includes: broccoli, cabbage, grape, green beans (succulent), leek, lettuce, onion, sweet peppers, and tomato. b “Dry crop” includes: barley grain, forage and straw, grass forage, maize grain forage and stover, and wheat grain,
forage and straw. c “Acidic crop” includes: apple, cherry (without seed), lemon, orange (whole fruit, peel and pulp), peach (without seed),
pear and plum (without seed). d “Oily crop” canola seed, cotton seed, olive (without seed), olive oil and soya bean.
An independent validation was carried out at PTRL Europe by analysts having no previous experience with the residue method (Richter, 2005; Report 050051). The limit of quantification was established at 0.01 mg/kg for spinetoram and its metabolites in lettuce (wet crop) and in whole oranges (acidic crop). The final extracts were analysed for residues of spinetoram and its metabolites by LC-MS/MS. Table 14 summarizes the validation data for spinetoram and its metabolites in lettuce and oranges. Average recoveries ranged between 82% and 110%, with relative standard deviations of ≤ 14%. Method GRM 05.03 was demonstrated to be applicable for use in the determination of spinetoram and its metabolites residues in these matrices.
Table 14 Procedural recovery obtained by an independent laboratory validation of Method GRM 05.03
Recovery Rate (%) Analyte Matrix
Fortification Level (mg/kg) mean range
RSD (%)
n
XDE-175-J 0.01 92 89–95 3 5
10 83 80–86 3 5
Lettuce (Wet Crop)
0.01–10 88 80–95 6 10
XDE-175-L 0.01 82 77–86 5 5
10 85 83–90 4 5
Lettuce
(Wet Crop) 0.01–10 84 77–90 5 10
N-demethyl-175-J 0.01 89 84–92 3 5
10 92 85–98 6 5
Lettuce
(Wet Crop) 0.01–10 90 84–98 5 10
N-demethyl-175-L 0.01 87 71–105 14 5
10 87 75–101 14 5
Lettuce (Wet Crop)
0.01–10 87 71–105 13 10
N-formyl-175-J 0.01 100 93–111 8 5
10 83 76–97 10 5
Lettuce (Wet Crop)
0.01–10 91 76–111 13 10
N-formyl-175-L 0.01 99 89–112 10 5
10 82 77–88 5 5
Lettuce
(Wet Crop) 0.01–10 91 77–112 12 10

1676 Spinetoram
Recovery Rate (%) Analyte Matrix
Fortification
Level (mg/kg) mean range
RSD
(%) n
XDE-175-J 0.01 95 87–100 5 5
0.10 92 89–98 4 5
Whole Orange (Acidic Crop)
0.01–0.10 94 87–100 5 10
XDE-175-L 0.01 85 76–92 8 5
0.10 93 89–98 5 5
Whole Orange (Acidic Crop)
0.01–0.10 89 76–98 8 10
N-demethyl-175-J 0.01 89 87–93 3 5
0.10 87 84–91 4 5
Whole Orange (Acidic Crop)
0.01–0.10 88 84–93 4 40
N-demethyl-175-L 0.01 90 81–105 11 5
0.10 90 73–100 12 5
Whole Orange (Acidic Crop)
0.01–0.10 90 73–105 11 10
N-formyl-175-J 0.01 91 83–104 11 5
0.10 89 71–95 11 5
Whole Orange (Acidic Crop)
0.01–0.10 90 71–104 10 10
N-formyl-175-L 0.01 98 96–104 3 5
0.10 95 87–103 6 5
Whole Orange (Acidic Crop)
0.01–0.10 97 87–104 5 10
XDE-175-J 0.01 90 81–102 9 5
10 90 87–94 2 5
Lettuce (Wet Crop)
0.01–10 90 81–102 6 10
XDE-175-L 0.01 96 92–103 7 5
10 86 84–90 2 5
Lettuce (Wet Crop)
0.01–10 91 84–103 8 10
N-demethyl-175-J 0.01 89 82–93 5 5
10 89 83–99 7 5
Lettuce
(Wet Crop) 0.01–10 89 82- 99 6 10
N-demethyl-175-L 0.01 83 72–92 9 5
10 87 77–95 8 5
Lettuce
(Wet Crop) 0.01–10 85 72–95 8 10
N-formyl-175-J 0.01 88 82–96 7 5
10 98 92–110 10 5
Lettuce (Wet Crop)
0.01–10 93 82–110 10 10
N-formyl-175-L 0.01 93 70–104 15 5
10 89 74–109 14 5
Lettuce (Wet Crop)
0.01–10 91 70–109 14 10
XDE-175-J 0.01 89 82–100 8 5
0.10 96 91–100 4 5
Whole Orange (Acidic Crop)
0.01–0.10 93 82–100 7 10
XDE-175-L 0.01 91 87–96 4 5
0.10 92 84–100 6 5
Whole Orange (Acidic Crop)
0.01–0.10 91 84–100 5 10
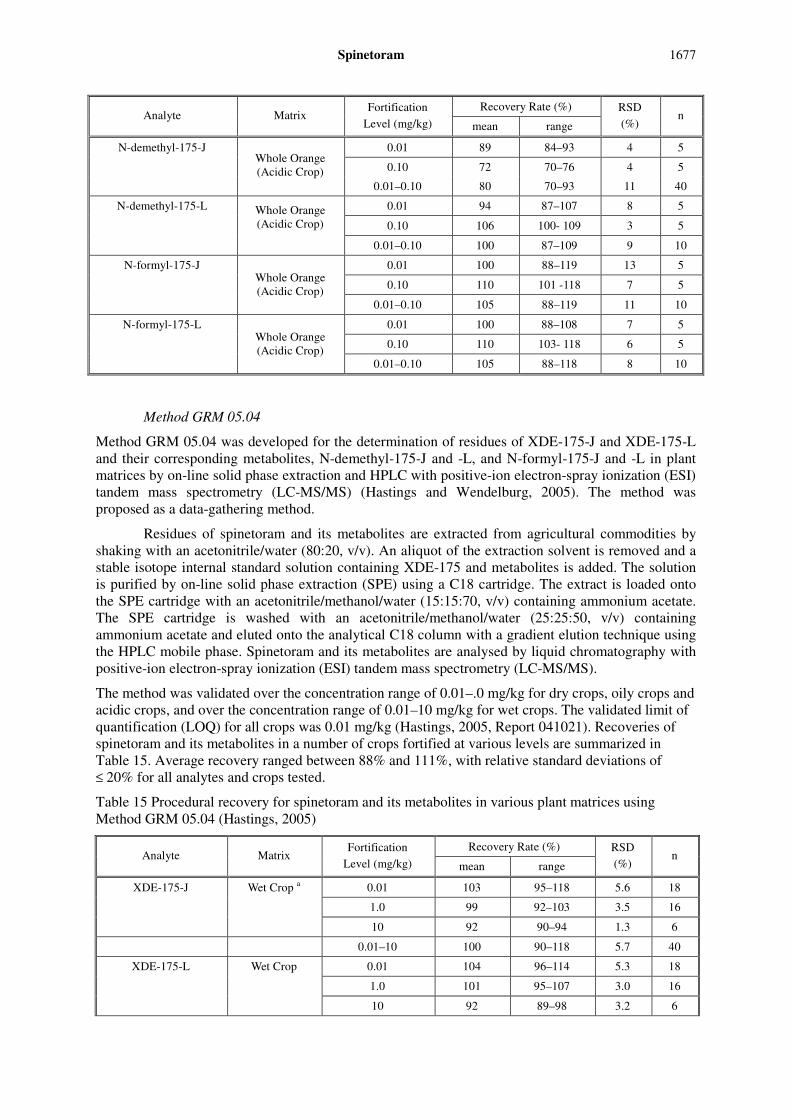
Spinetoram 1677
Recovery Rate (%) Analyte Matrix
Fortification
Level (mg/kg) mean range
RSD
(%) n
N-demethyl-175-J 0.01 89 84–93 4 5
0.10 72 70–76 4 5
Whole Orange (Acidic Crop)
0.01–0.10 80 70–93 11 40
N-demethyl-175-L 0.01 94 87–107 8 5
0.10 106 100- 109 3 5
Whole Orange (Acidic Crop)
0.01–0.10 100 87–109 9 10
N-formyl-175-J 0.01 100 88–119 13 5
0.10 110 101 -118 7 5
Whole Orange (Acidic Crop)
0.01–0.10 105 88–119 11 10
N-formyl-175-L 0.01 100 88–108 7 5
0.10 110 103- 118 6 5
Whole Orange (Acidic Crop)
0.01–0.10 105 88–118 8 10
Method GRM 05.04
Method GRM 05.04 was developed for the determination of residues of XDE-175-J and XDE-175-L and their corresponding metabolites, N-demethyl-175-J and -L, and N-formyl-175-J and -L in plant matrices by on-line solid phase extraction and HPLC with positive-ion electron-spray ionization (ESI) tandem mass spectrometry (LC-MS/MS) (Hastings and Wendelburg, 2005). The method was proposed as a data-gathering method.
Residues of spinetoram and its metabolites are extracted from agricultural commodities by shaking with an acetonitrile/water (80:20, v/v). An aliquot of the extraction solvent is removed and a stable isotope internal standard solution containing XDE-175 and metabolites is added. The solution is purified by on-line solid phase extraction (SPE) using a C18 cartridge. The extract is loaded onto the SPE cartridge with an acetonitrile/methanol/water (15:15:70, v/v) containing ammonium acetate. The SPE cartridge is washed with an acetonitrile/methanol/water (25:25:50, v/v) containing ammonium acetate and eluted onto the analytical C18 column with a gradient elution technique using the HPLC mobile phase. Spinetoram and its metabolites are analysed by liquid chromatography with positive-ion electron-spray ionization (ESI) tandem mass spectrometry (LC-MS/MS).
The method was validated over the concentration range of 0.01–.0 mg/kg for dry crops, oily crops and acidic crops, and over the concentration range of 0.01–10 mg/kg for wet crops. The validated limit of quantification (LOQ) for all crops was 0.01 mg/kg (Hastings, 2005, Report 041021). Recoveries of spinetoram and its metabolites in a number of crops fortified at various levels are summarized in Table 15. Average recovery ranged between 88% and 111%, with relative standard deviations of ≤ 20% for all analytes and crops tested.
Table 15 Procedural recovery for spinetoram and its metabolites in various plant matrices using Method GRM 05.04 (Hastings, 2005)
Recovery Rate (%) Analyte Matrix
Fortification
Level (mg/kg) mean range
RSD
(%) n
XDE-175-J Wet Crop a 0.01 103 95–118 5.6 18
1.0 99 92–103 3.5 16
10 92 90–94 1.3 6
0.01–10 100 90–118 5.7 40
XDE-175-L Wet Crop 0.01 104 96–114 5.3 18
1.0 101 95–107 3.0 16
10 92 89–98 3.2 6

1678 Spinetoram
Recovery Rate (%) Analyte Matrix
Fortification
Level (mg/kg) mean range
RSD
(%) n
0.01–10 101 89–114 6.0 40
N-demethyl-175-J Wet Crop 0.01 100 94–117 5.8 18
1.0 100 94–105 2.8 16
10 94 89–101 5.5 6
0.01–10 99 89–117 5.3 40
N-demethyl-175-L Wet Crop 0.01 102 92–120 6.6 18
1.0 101 95–104 2.3 16
10 91 87–99 5.4 6
0.01–10 100 87–120 6.3 40
N-formyl-175-J Wet Crop 0.01 93 86–106 7.2 18
1.0 101 91–116 6.9 16
10 91 84–101 7.6 6
0.01–10 96 84–116 8.3 40
N-formyl-175-L Wet Crop 0.01 100 79–119 11.2 18
1.0 99 91–111 4.9 16
10 90 81–99 7.8 6
0.01–10 98 79–119 9.3 40
XDE-175-J Dry Crop b 0.01 88 81–105 6.0 20
1.0 88 81–98 5.6 20
0.01–1.0 88 81–105 5.7 40
XDE-175-L Dry Crop 0.01 102 94–114 5.5 20
1.0 102 92–114 6.2 20
0.01–1.0 102 92–114 5.8 40
N-demethyl-175-J Dry Crop 0.01 102 92–114 5.1 20
1.0 102 95–114 3.8 20
0.01–1.0 102 92–114 4.4 40
N-demethyl-175-L Dry Crop 0.01 105 99–114 4.3 20
1.0 104 96–110 3.6 20
0.01–1.0 105 96–114 4.0 40
N-formyl-175-J Dry Crop 0.01 105 77–131 12.5 20
1.0 110 97–121 5.3 20
0.01–1.0 108 77–131 9.7 40
N-formyl-175-L Dry Crop 0.01 95 78–119 12.1 20
1.0 93 77–117 12.5 20
0.01–1.0 94 77–119 12.2 40
XDE-175-J Acidic Crop c 0.01 102 93–115 6.0 17
1.0 101 94–105 3.3 18
0.01–1.0 102 93–115 4.8 35
XDE-175-L Acidic Crop 0.01 106 98–114 4.6 17
1.0 100 92–104 3.0 18
0.01–1.0 103 92–114 5.0 35
N-demethyl-175-J Acidic Crop 0.01 104 96–114 5.6 17
1.0 102 97–107 3.1 18
0.01–1.0 103 96–114 4.5 35

Spinetoram 1679
Recovery Rate (%) Analyte Matrix
Fortification
Level (mg/kg) mean range
RSD
(%) n
N-demethyl-175-L Acidic Crop 0.01 100 87–113 7.8 17
1.0 101 96–107 2.9 18
0.01–1.0 100 87–113 5.8 35
N-formyl-175-J Acidic Crop 0.01 97 76–118 12.4 17
1.0 103 94–118 6.0 18
0.01–1.0 100 76–118 9.8 35
N-formyl-175-L Acidic Crop 0.01 94 86–107 7.4 17
1.0 97 91–107 4.2 18
0.01–1.0 95 86–107 6.1 35
XDE-175-J Oily Crop d 0.01 94 84–105 7.4 10
1.0 96 89–102 4.9 10
0.01–1.0 95 84–105 6.2 20
XDE-175-L Oily Crop 0.01 99 90–110 6.3 10
1.0 101 95–107 4.7 10
0.01–1.0 100 90–110 5.5 20
N-demethyl-175-J Oily Crop 0.01 97 86–105 6.2 10
1.0 103 93–111 5.1 10
0.01–1.0 100 86–111 6.3 20
N-demethyl-175-L Oily Crop 0.01 90 83–101 6.4 10
1.0 98 92–102 3.4 10
0.01–1.0 94 83–102 6.2 20
N-formyl-175-J Oily Crop 0.01 103 82–120 11.2 10
1.0 115 102–140 9.8 10
0.01–1.0 109 82–140 11.7 20
N-formyl-175-L Oily Crop 0.01 105 63–138 19.7 10
1.0 111 76–139 15.4 10
0.01–1.0 108 63–139 17.3 20 a “Wet crop” includes: broccoli, cabbage, grape, green beans (succulent), leek, lettuce, onion, sweet peppers, and tomato. b “Dry crop” includes: barley grain, forage and straw, grass forage, maize grain forage and stover, and wheat grain,
forage and straw. c “Acidic crop” includes: apple, cherry (without seed), lemon, orange (whole fruit, peel and pulp), peach (without seed),
pear and plum (without seed). d “Oily crop” canola seed, cotton seed, olive (without seed), olive oil and soya bean.
Methods GRM 05.03 and GRM 05.04 are considered to be suitable for the determination of residues of spinetoram and its metabolites in commodities of plant origin. The methods were fully validated for a range of crops and crop types, with a limit of quantification (LOQ) of 0.01 mg/kg for all crops. Method GRM 05.03 has been designated by EPA as an appropriate enforcement method for analysis of residues of spinetoram and its metabolites in plant matrices.
Analytical Methods for Determination of Residues in Foods and Feedstuffs of Animal Origin Used in
Supervised Trials
Methods GRM 05.15 and GRM 06.08 were developed for the determination of residues of spinetoram and its metabolites in bovine and poultry tissues, milk, cream, and eggs, using HPLC with positive ion electron-spray (ESI) tandem mass spectrometry (LC-MS/MS).

1680 Spinetoram
Method GRM 05.15
Method GRM 05.15 was developed for the quantitative determination of XDE-175-J and XDE-175-L and their metabolites N-demethyl-175-J, N-demethyl-175-L, 3′-O-deethyl-175-J and 3′-O-deethyl-175-L in bovine tissues (muscle, kidney, liver and fat), milk (whole and skim) and cream, and poultry tissues (muscle, liver and fat) and poultry eggs (Shackelford and Hastings, 2005).
Residues of spinetoram and its metabolites are extracted from the samples of animal origin by homogenizing and shaking with an acetonitrile/water solution (80:20, v/v). The samples are filtered through a 0.45 µm membrane GHP filter. A stable isotope internal standard solution containing XDE-175-J, XDE-175-L, and metabolites N-demethyl-175-J and N-demethyl-175-L is added to each sample. Spinetoram and its metabolites are analysed without sample cleanup by liquid chromatography with positive-ion electron-spray ionization (ESI) tandem mass spectrometry (LC-MS/MS).
The method was validated over the concentration range of 0.01-15 mg/kg for bovine and poultry muscle and bovine kidney; 0.01-50 mg/kg for bovine and poultry liver, bovine milk and cream and poultry eggs; and 0.01-150 mg/kg for bovine and poultry fat (Shackelford, 2005; Report 051022). The validated limit of quantification (LOQ) for all of the animal matrices was 0.01 mg/kg. Recoveries of spinetoram and its metabolites in animal matrices fortified at various levels are summarized in Table 16. Average recovery ranged between 87% and 119%, with relative standard deviations of ≤ 18.2% for all analytes and matrices tested.
Table 16 Procedural recovery for spinetoram and its metabolites in various animal matrices, using Method GRM 05.15 (Shackelford, 2005)
Recovery Rate (%) Analyte Matrix
Fortification Level (mg/kg) mean range
RSD (%)
n
XDE-175-J 0.010 108 101–115 4.3 12
1.0 98 93–102 3.2 10
Muscle
(bovine & poultry) 15 100 93–106 4.6 10
0.010–15 103 93–115 6.0 32
XDE-175-L 0.010 100 92–114 6.5 12
1.0 92 89–95 2.1 10
Muscle
(bovine & poultry) 15 97 92–102 3.7 10
0.010–15 97 89–114 5.7 32
N-demethyl-175-J 0.010 111 106–117 2.7 12
1.0 103 99–108 3.1 10
Muscle
(bovine & poultry) 15 105 96–112 5.6 10
0.010–15 106 96–117 5.0 32
N-demethyl-175-L 0.010 101 92–110 6.2 12
1.0 100 95–104 2.4 10
Muscle
(bovine & poultry) 15 108 96–116 7.4 10
0.010–15 103 92–116 6.6 32
3′-O-deethyl-175-J 0.010 113 103–118 4.9 12
1.0 93 90–99 3.4 10
Muscle
(bovine & poultry) 15 102 96–109 3.9 10
0.010–15 103 90–118 9.0 32
3′-O-deethyl-175-L 0.010 119 115–125 2.0 12
1.0 91 87–93 2.2 10
Muscle
(bovine & poultry) 15 104 97–109 4.2 10
0.010–15 105 87–125 11.3 32

Spinetoram 1681
Recovery Rate (%) Analyte Matrix
Fortification
Level (mg/kg) mean range
RSD
(%) n
XDE-175-J 0.010 102 84–117 9.6 12
1.0 100 91–108 6.2 10
Liver
(bovine & poultry) 15 103 100–109 3.1 10
50 99 84–111 11.7 10
0.010–50 101 84–117 8.2 42
XDE-175-L 0.010 104 83–119 11.5 12
1.0 93 87–99 4.7 10
Liver
(bovine & poultry) 15 98 93–101 2.5 10
50 93 81–103 9.9 10
0.010–50 97 81–119 9.3 42
N-demethyl-175-J 0.010 108 99–118 4.3 12
1.0 97 92–102 3.2 10
Liver
(bovine & poultry) 15 102 97–114 5.4 10
50 97 80–112 14.6 10
0.010–50 101 80–118 8.9 42
N-demethyl-175-L 0.010 103 95–115 6.7 12
1.0 104 93–119 8.2 10
Liver
(bovine & poultry) 15 103 97–116 6.9 10
50 98 80–113 15.9 10
0.010–50 102 80–119 9.7 42
3′-O-deethyl-175-J 0.010 112 101–120 5.4 12
1.0 103 93–118 8.6 10
Liver
(bovine & poultry) 15 106 95–116 6.7 10
50 100 86–114 11.0 10
0.010–50 106 86–120 8.7 42
3′-O-deethyl-175-L 0.010 110 104–116 4.4 12
1.0 93 85–100 5.7 10
Liver
(bovine & poultry) 15 102 91–115 8.1 10
50 101 85–116 11.4 10
0.010–50 102 85–116 9.6 42
XDE-175-J Kidney 0.010 101 91–112 7.1 6
(bovine) 1.0 90 88–92 2.1 5
15 97 95–100 2.3 5
0.010–15 96 88–112 6.4 16
XDE-175-L Kidney 0.010 103 97–109 4.6 6
(bovine) 1.0 87 84–93 4.2 5
15 91 87–96 4.6 5
0.010–15 94 84–109 8.4 16
N-demethyl-175-J Kidney 0.010 111 103–116 4.4 6
(bovine) 1.0 105 100–112 5.3 5
15 110 99–119 8.3 5
0.010–15 109 99–119 6.2 16

1682 Spinetoram
Recovery Rate (%) Analyte Matrix
Fortification
Level (mg/kg) mean range
RSD
(%) n
N-demethyl-175-L Kidney 0.010 108 102–116 4.8 6
(bovine) 1.0 104 101–110 3.9 5
15 112 102–119 7.3 5
0.010–15 108 101–119 6.0 16
3′-O-deethyl-175-J Kidney 0.010 107 104–112 3.1 6
(bovine) 1.0 93 90–96 3.2 5
15 100 94–104 4.7 5
0.010–15 100 90–112 7.0 16
3′-O-deethyl-175-L Kidney 0.010 106 90–119 11.9 6
(bovine) 1.0 88 84–92 3.6 5
15.0 99 94–102 3.7 5
0.010–15.0 98 84–119 11.3 16
XDE-175-J 0.01 105 87–119 8.2 14
1.0 101 92–109 5.2 10
Fat
(bovine & poultry) 15 105 102–110 2.3 10
150 95 89–101 3.9 10
0.010–150 102 87–119 6.8 44
XDE-175-L 0.01 100 88–114 7.2 14
1.0 92 88–96 2.9 10
Fat
(bovine & poultry) 15 98 94–101 1.7 10
150 93 88–97 3.2 10
0.010–150 96 88–114 5.8 44
N-demethyl-175-J 0.01 110 102–117 3.6 14
1.0 101 95–109 4.5 10
Fat
(bovine & poultry) 15 100 94–111 6.0 10
150 99 95–104 2.8 10
0.010–150 103 94–117 6.0 44
N-demethyl-175-L 0.01 102 89–118 8.6 14
1.0 103 100–108 2.5 10
Fat
(bovine & poultry) 15 102 93–118 7.5 10
150 101 97–106 2.8 10
0.010–150 102 89–118 6.1 44
3′-O-deethyl-175-J 0.01 109 91–118 8.0 14
1.0 94 86–100 4.5 10
Fat
(bovine & poultry) 15 103 99–110 2.8 10
150 94 89–100 3.4 10
0.010–150 101 86–118 8.6 44
3′-O-deethyl-175-L 0.01 111 102–119 5.4 14
1.0 93 89–97 2.6 10
Fat
(bovine & poultry) 15 105 100–113 3.1 10
150 94 89–99 3.6 10
0.010–150 102 89–119 8.8 44
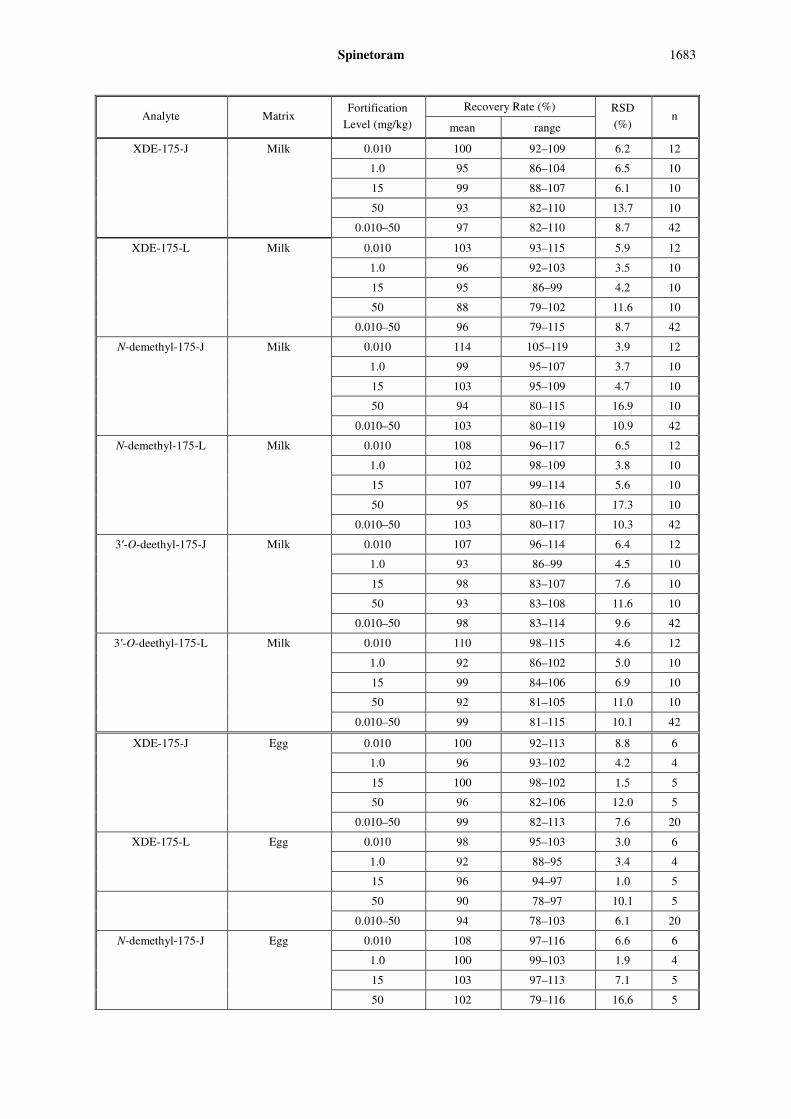
Spinetoram 1683
Recovery Rate (%) Analyte Matrix
Fortification
Level (mg/kg) mean range
RSD
(%) n
XDE-175-J 0.010 100 92–109 6.2 12
Milk
1.0 95 86–104 6.5 10
15 99 88–107 6.1 10
50 93 82–110 13.7 10
0.010–50 97 82–110 8.7 42
XDE-175-L 0.010 103 93–115 5.9 12
Milk
1.0 96 92–103 3.5 10
15 95 86–99 4.2 10
50 88 79–102 11.6 10
0.010–50 96 79–115 8.7 42
N-demethyl-175-J 0.010 114 105–119 3.9 12
Milk
1.0 99 95–107 3.7 10
15 103 95–109 4.7 10
50 94 80–115 16.9 10
0.010–50 103 80–119 10.9 42
N-demethyl-175-L 0.010 108 96–117 6.5 12
Milk
1.0 102 98–109 3.8 10
15 107 99–114 5.6 10
50 95 80–116 17.3 10
0.010–50 103 80–117 10.3 42
3′-O-deethyl-175-J 0.010 107 96–114 6.4 12
Milk
1.0 93 86–99 4.5 10
15 98 83–107 7.6 10
50 93 83–108 11.6 10
0.010–50 98 83–114 9.6 42
3′-O-deethyl-175-L 0.010 110 98–115 4.6 12
Milk
1.0 92 86–102 5.0 10
15 99 84–106 6.9 10
50 92 81–105 11.0 10
0.010–50 99 81–115 10.1 42
XDE-175-J Egg 0.010 100 92–113 8.8 6
1.0 96 93–102 4.2 4
15 100 98–102 1.5 5
50 96 82–106 12.0 5
0.010–50 99 82–113 7.6 20
XDE-175-L Egg 0.010 98 95–103 3.0 6
1.0 92 88–95 3.4 4
15 96 94–97 1.0 5
50 90 78–97 10.1 5
0.010–50 94 78–103 6.1 20
N-demethyl-175-J Egg 0.010 108 97–116 6.6 6
1.0 100 99–103 1.9 4
15 103 97–113 7.1 5
50 102 79–116 16.6 5

1684 Spinetoram
Recovery Rate (%) Analyte Matrix
Fortification
Level (mg/kg) mean range
RSD
(%) n
0.010–50 104 79–116 9.4 20
N-demethyl-175-L Egg 0.010 95 83–108 11.7 6
1.0 104 102–105 1.1 4
15 106 100–115 7.5 5
50 103 78–119 18.2 5
0.010–50 101 78–119 11.7 20
3′-O-deethyl-175-J Egg 0.010 104 96–111 5.7 6
1.0 91 90–92 1.1 4
15 99 97–102 2.6 5
50 92 78–101 11.3 5
0.010–50 97 78–111 8.2 20
3′-O-deethyl-175-L Egg 0.010 108 100–117 5.8 6
1.0 90 89–92 1.3 4
15 98 94–102 3.7 5
50 93 78–102 11.6 5
0.010–50 98 78–117 9.6 20
An independent validation was carried out at PTRL Europe by analysts having no previous experience with the residue method (Richter, 2005, Report 050049). Bovine milk (high water content) and poultry muscle were used as the representative matrices. Control bovine milk samples and control poultry muscle samples that were fortified at 0.01 mg/kg (at LOQ) and 15 mg/kg (1500× the LOQ) were analysed by liquid chromatography with positive-ion electron-spray ionization (ESI) tandem mass spectrometry (LC-MS/MS).
Table 17summarizes the validation data for spinetoram and its metabolites in bovine and poultry tissues. Average recovery ranged between 85% and 109%, with relative standard deviations of ≤ 12 %.
Table 17 Procedural recovery obtained by an independent laboratory validation of Method GRM 05.15
Recovery Rate (%) Analyte Matrix
Fortification Level (mg/kg) mean range
RSD (%)
n
XDE-175-J Bovine Milk 0.010 103 97–108 4 5
15 91 87–99 5 5
0.010–15 97 87–108 8 10
XDE-175-L Bovine Milk 0.010 105 99–109 4 5
15 89 84–98 6 5
0.010–15 97 84–109 10 10
N-demethyl-175-J Bovine Milk 0.010 93 89–102 6 5
15 89 82–94 7 5
0.010–15 91 82–102 6 10
N-demethyl-175-L Bovine Milk 0.010 85 72–97 12 5
15 93 81–107 11 5
3'-O-deethyl-175-J Bovine Milk 0.010 109 91–118 10 5
15 100 90–105 6 5
0.010–15 105 90–118 9 10

Spinetoram 1685
Recovery Rate (%) Analyte Matrix
Fortification
Level (mg/kg) mean range
RSD
(%) n
3'-O-deethyl-175-L Bovine Milk 0.010 108 100–115 6 5
15 92 86–99 5 5
0.010–15 100 86–115 10 10
XDE-175-J Poultry Muscle 0.010 105 94–117 8 5
15 101 98–105 3 5
0.010–15 103 94–117 6 10
XDE-175-L Poultry Muscle 0.010 103 97–113 7 5
15 101 96–105 3 5
0.010–15 102 96–113 5 10
N-demethyl-175-J Poultry Muscle 0.010 107 102–117 6 5
15 94 90–98 3 5
0.010–15 101 90–117 8 10
N-demethyl-175-J Poultry Muscle 0.010 98 88–112 10 5
15 98 87–109 10 5
0.010–15 98 87–112 9 10
3'-O-deethyl-175-J Poultry Muscle 0.010 98 91–119 12 5
15 93 90–98 5 5
0.010–15 95 90–119 9 10
3'-O-deethyl-175-J Poultry Muscle 0.010 109 100–113 5 5
15 101 94–107 5 5
0.010–15 105 94–113 6 10
Method GRM 06.08
Method GRM 06.08 supersedes method GRM 05.15. Initially method GRM 05.15 was developed to include the determination of metabolites N-demethyl-175-J, N-demethyl-175-L, 3′-O-deethyl-175-J and 3′-O-deethyl-175-L. Method GRM 06.08 was developed to only include the determination of N-demethyl-175-J and N-formyl-175-J (Shackelford, et. al., 2007).
Residues of spinetoram and its metabolites are extracted from the animal matrices by homogenizing and by shaking with an acetonitrile/water solution (80:20, v/v). A stable isotope internal standard solution containing XDE-175-J, XDE-175-L, and metabolites N-demethyl-175-J and N-demethyl-175-L is added to each sample. Samples are analysed by direct injection of the extraction solution without further cleanup. Determination of spinetoram and its metabolites is by liquid chromatography with positive ion electron-spray ionization (ESI) tandem mass spectrometry (LC-MS/MS).
Method GRM 06.08 is identical to method GRM 05.15, except in slight differences in the metabolites determined. Method GRM 06.08 was validated for the quantitative determination of XDE-175-J and XDE-175-L and the major metabolites of XDE-175-J, i.e., N-demethyl-175-J and N-formyl-175-J, in bovine tissues (muscle, kidney, liver and fat), milk (whole and skim) and cream, and poultry tissues (muscle, liver and fat) and poultry eggs (Shackelford, 2007, Report 061023). With the exception of metabolite N-formyl-175-J, the method was validated over the concentration range of 0.01–15 mg/kg in bovine and poultry muscle and bovine kidney; 0.01–50 mg/kg for bovine and poultry liver, bovine milk and cream and poultry eggs; and 0.01-150 mg/kg for bovine and poultry fat.
For N-formyl-175-J, the method was validated over the concentration range of 0.01-0.10 mg/kg for all bovine matrices and over the concentration range of 0.01–5.0 mg/kg for all poultry matrices. The validated limit of quantification (LOQ) for all of the animal matrices was

1686 Spinetoram
0.01 mg/kg. Recoveries of spinetoram and its metabolites in bovine and poultry tissues are summarized Table 18. Average recovery ranged between 83% and 118%, with relative standard deviations of ≤ 17% for all analytes and matrices tested.
Table 18 Procedural recovery for spinetoram and its metabolites in various animal matrices, using Method 06.08 (Shackelford, 2007)
Recovery Rate (%) Analyte Matrix
Fortification
Level (mg/kg) mean range
RSD
(%) n
XDE-175-J 0.010 99 73–117 13.9 22
0.10 90 85–94 3.2 10
Muscle
(bovine & poultry) 1.0 98 93–102 3.4 10
15 100 93–106 4.7 10
0.010–15 97 73–117 10.2 52
XDE-175-L 0.010 90 68–114 13.3 22
0.10 86 82–89 2.3 10
Muscle
(bovine & poultry) 1.0 92 89–95 2.2 10
15 97 92–102 3.7 10
0.010–15 91 68–114 9.6 52
N-demethyl-175-J 0.010 106 90–117 6.6 22
0.10 111 107–117 2.8 10
Muscle
(bovine & poultry) 1.0 103 99–108 3.1 10
15 105 96–112 5.6 10
0.010–15 106 90–117 5.7 52
N-formyl-175-J 0.010 89 77–109 9.7 24
0.10 88 79–107 7.9 20
Muscle
(bovine & poultry) 5.0 105 100–110 3.2 6
0.010–5.0 90 77–110 10.2 50
XDE-175-J 0.010 103 84–117 9.6 12
1.0 100 91–108 6.2 10
Liver
(bovine & poultry) 15 103 100–109 3.0 10
50 99 84–111 11.8 10
0.010–50 101 84–117 8.3 42
XDE-175-L 0.010 104 83–119 11.5 12
1.0 94 87–99 4.7 10
Liver
(bovine & poultry) 15 98 93–101 2.6 10
50 93 81–103 10.0 10
0.010–50 98 81–119 9.3 42
N-demethyl-175-J 0.010 108 99–118 4.4 12
1.0 97 92–102 3.3 10
Liver
(bovine & poultry) 15 102 97–114 5.5 10
50 98 80–112 14.8 10
0.010–50 101 80–118 9.0 42
N-formyl-175-J 0.010 89 72–107 13.1 14
0.10 91 80–102 7.8 10
Liver
(bovine & poultry) 5.0 107 103–114 3.7 6
0.010–5.0 93 72–114 12.4 30

Spinetoram 1687
Recovery Rate (%) Analyte Matrix
Fortification
Level (mg/kg) mean range
RSD
(%) n
XDE-175-J Kidney 0.010 101 91–112 7.0 6
(bovine) 1.0 91 88–92 1.8 5
15.0 97 95–100 2.2 5
0.010–15.0 96 88–112 6.3 16
XDE-175-L Kidney 0.010 103 97–109 4.6 6
(bovine) 1.0 87 84–93 4.3 5
15 91 87–96 4.7 5
0.010–15 95 84–109 8.5 16
N-demethyl-175-J Kidney 0.010 111 103–116 4.4 6
(bovine) 1.0 105 100–112 5.4 5
15 110 99–119 8.5 5
0.010–15 109 99–119 6.2 16
N-formyl-175-J Kidney 0.010 83 75–103 12.6 8
(bovine) 0.10 86 80–91 5.3 4
0.010–0.10 84 75–103 10.4 12
XDE-175-J 0.01 105 87–119 8.0 14
1.0 101 92–109 5.1 10
Fat
(bovine & poultry) 15 105 102–110 2.3 10
150 95 89–101 3.9 10
0.010–150 102 87–119 6.7 44
XDE-175-L 0.01 100 88–114 7.1 14
1.0 92 88–96 2.9 10
Fat
(bovine & poultry) 15 98 94–101 1.9 10
150 93 88–97 3.1 10
0.010–150 96 88–114 5.8 44
N-demethyl-175-J 0.01 110 102–117 3.7 14
1.0 101 95–109 4.6 10
Fat
(bovine & poultry) 15 101 94–111 6.0 10
150 99 95–104 2.9 10
0.010–150 103 94–117 6.1 44
N-formyl-175-J 0.01 94 79–122 9.3 42
0.10 96 84–109 6.5 24
Fat
(bovine & poultry) 5.0 113 105–121 5.4 6
0.010–5.0 96 79–122 9.6 72
XDE-175-J Milk and Cream 0.010 100 92–109 6.1 12
1.0 95 86–104 6.6 10
15 99 88–107 6.2 10
50 93 82–110 13.6 10
0.010–50 97 82–110 8.7 42
XDE-175-L Milk and Cream 0.010 103 93–115 5.9 12
1.0 96 92–103 3.4 10
15 95 86–99 4.3 10
50 88 79–102 11.6 10
0.010–50 96 79–115 8.6 42

1688 Spinetoram
Recovery Rate (%) Analyte Matrix
Fortification
Level (mg/kg) mean range
RSD
(%) n
N-demethyl-175-J Milk and Cream 0.010 114 105–119 3.9 12
1.0 99 95–107 3.7 10
15 103 95–109 4.7 10
50 94 80–115 17.0 10
0.010–50 103 80–119 11.0 42
N-formyl-175-J Milk and Cream 0.010 88 67–100 7.8 38
0.10 92 81–104 6.4 18
1.0 91 87–94 NA 2
0.010–1.0 89 67–104 7.5 58
XDE-175-J Egg 0.010 101 92–113 8.8 6
1.0 96 93–102 4.2 4
15 100 98–102 1.7 5
50 96 82–106 12.0 5
0.010–50 99 82–113 7.6 20
XDE-175-L Egg 0.010 98 95–103 3.1 6
1.0 92 88–95 3.4 4
15 96 94–97 1.3 5
50 89 78–97 10.2 5
0.010–50 94 78–103 6.3 20
N-demethyl-175-J Egg 0.010 108 97–116 6.5 6
1.0 101 99–103 1.9 4
15 104 97–113 7.1 5
50 102 79–116 16.6 5
0.010–50 104 79–116 9.3 20
N-formyl-175-J Egg 0.010 93 74–111 15.5 6
0.10 92 88–96 4.1 6
5.0 106 98–111 5.2 6
0.010–5.0 97 74–111 11.1 18
Methods GRM 05.15 and GRM 06.08 are considered to be suitable for the determination of spinetoram and its metabolites in commodities of animal origin. The methods were fully validated for a range of animal matrices, with a limit of quantification (LOQ) of 0.01 mg/kg for all matrices. Method GRM 06.08 has been designated by EPA as an appropriate enforcement method for analysis of residues of spinetoram and its metabolites in animal matrices.
Stability of residues in stored analytical samples
The Meeting received information on frozen storage stability of residues of spinetoram and its metabolites in wheat, soya bean, orange, lettuce and sugar beet samples.
Commodities of plant origin
A storage stability study was conducted with XDE-175 and metabolites in agricultural commodities to determine the stability of the residues in homogenized samples while stored frozen (Wendelburg, 2006; Report 050027.01). Wheat grain, soya bean seed, orange whole fruit, lettuce leaf, and sugar beet root were selected to represent each of five crop groupings (dry, oily, acidic, wet, and root crops) to obtain information on a wide variety of crops. Samples taken from trial studies (report 040063 and 040051) were used.

Spinetoram 1689
The stability of the compounds, XDE-175-J, XDE-175-L, N-demethyl-175-J, N-demethyl-175-L, N-formyl-175-J, and N-formyl-175-L, were investigated for twelve months. All samples were weighed into individual high density polyethylene (HDPE) containers, fortified at 0.10 mg/kg and stored in a temperature-monitored freezer set at approximately –20 °C. Samples were analysed at 0, 63, 90, 231, and 372 days of frozen storage after fortification, by LC-MS/MS following method GRM 05.04.
The efficiency of the analytical method was determined at the time of analysis of each sampling event by creating two concurrent recovery samples and analysing them according to the method above. Concurrent recovery results confirmed the suitability of the method for determination of spinetoram and its metabolites in the agricultural commodities selected.
Results of the storage stability tests are summarized in Table 19. The results show that spinetoram and its metabolites are stable for at least 12 months in agricultural commodities, except lettuce, under frozen storage at approximately –20 °C. In lettuce, remaining XDE-175-L and N-dimethyl-175-L were 60 and 65% respectively (unadjusted for procedural recovery) on 372 days after initiation of the study.
Table 19 Stability of spinetoram and specific metabolites in agricultural commodities at fortification level of 0.10 mg/kg following storage at –20 °C (Wendelburg, 2006)
Commodity Storage
interval (days)
% Remaining a Concurrent recovery (%)
XDE-175-J
Wheat Grain 0 104 103
63 119 119
90 95 110
231 102 102
372 99 109
Soya bean Seed 0 105 108
63 97 95
90 98 110
231 103 96
372 95 92
Orange Fruit 0 101 102
63 99 104
90 95 106
231 100 98
372 98 97
Lettuce Leaf 0 90 96
63 91 89
90 95 91
231 85 87
372 87 96
Sugar Beet Root 0 100 98
63 105 103
90 96 106
231 98 101
372 87 99

1690 Spinetoram
Commodity Storage
interval (days)
% Remaining a Concurrent recovery (%)
XDE-175-L
Wheat Grain 0 107 104
63 98 100
90 108 111
231 95 103
372 91 98
Soya bean Seed 0 101 108
63 100 85
90 104 108
231 92 99
372 84 89
Orange Fruit 0 98 96
63 88 94
90 102 104
231 92 96
372 86 88
Lettuce Leaf 0 88 89
63 87 76
90 105 105
231 73 77
372 60 81
Sugar Beet Root 0 100 102
63 88 91
90 100 105
231 100 93
372 111 102
N-demethyl-175-J
Wheat Grain 0 106 116
63 96 95
90 103 114
231 97 101
372 89 101
Soya bean Seed 0 100 106
63 97 89
90 96 104
231 92 93
372 86 87
Orange Fruit 0 99 99
63 96 95
90 94 100
231 91 95
372 83 84

Spinetoram 1691
Commodity Storage
interval (days)
% Remaining a Concurrent recovery (%)
Lettuce Leaf 0 94 109
63 90 98
90 91 102
231 84 102
372 80 95
Sugar Beet Root 0 98 96
63 97 93
90 89 102
231 88 91
372 83 90
N-demethyl-175-L
Wheat Grain 0 103 105
63 85 90
90 98 106
231 90 98
372 80 94
Soya bean Seed 0 101 107
63 89 95
90 96 102
231 87 93
372 85 88
Orange Fruit 0 100 102
63 88 93
90 88 97
231 91 95
372 84 87
Lettuce Leaf 0 93 104
63 91 95
90 90 99
231 77 93
372 65 89
Sugar Beet Root 0 100 102
63 88 94
90 87 102
231 88 95
372 80 95
N-formyl-175-J
Wheat Grain 0 133 141
63 83 82
90 90 105
231 83 88
372 78 85

1692 Spinetoram
Commodity Storage
interval (days)
% Remaining a Concurrent recovery (%)
Soya bean Seed 0 106 108
63 102 87
90 111 127
231 91 95
372 96 92
Orange Fruit 0 91 94
63 93 90
90 86 90
231 90 88
372 79 75
Lettuce Leaf 0 98 101
63 105 110
90 89 94
231 90 85
372 86 95
Sugar Beet Root 0 92 90
63 86 88
90 91 99
231 77 102
372 79 85
N-formyl-175-L
Wheat Grain 0 99 106
63 94 94
90 112 117
231 97 87
372 79 96
Soya bean Seed 0 116 108
63 84 88
90 129 145
231 104 108
372 98 90
Orange Fruit 0 89 85
63 78 96
90 94 101
231 90 90
372 84 75
Lettuce Leaf 0 80 99
63 75 75
90 102 102
231 86 84
372 86 91

Spinetoram 1693
Commodity Storage
interval (days)
% Remaining a Concurrent recovery (%)
Sugar Beet Root 0 82 83
63 89 79
90 93 101
231 93 104
372 77 87 a Mean of three subsamples.
Commodities of animal origin
Samples of animal tissues, milk, and eggs from the metabolism and feeding studies were analysed within 20 days of sample collection in the supervised trials. Therefore, storage stability tests were not conducted.
USE PATTERN
The Meeting received approved labels from Canada and the USA.
Information on registered formulations, applications methods and dosage rates of spinetoram for uses on the crops for which supervised trial data were provided is summarized in Table 20. Unless otherwise noted, each of the following GAPs are for field use and all applications are foliar applications. Other than the crops for which supervised trial data were available to the Meeting, spinetoram is approved for use on asparagus, banana, beet greens, Brassica vegetables, bulb vegetables, bush berries, caneberries, cereals, corn (field and sweet), cotton, cranberry, cucurbits, fig, grape, herbs, legume vegetables, mint, peanuts, pulses, soya bean, strawberry, tropical fruits and turnip greens in these countries.
Table 20 Registered uses of spinetoram
Formulation Application Crop Country
g ai/L or
g ai/kg
type Method Rate
g ai/ha
Rate
g ai/hL
Min. interval
days
Max. no./
g ai/ season
PHI
days
Apricot Canada 250 WG Foliar 53–105 7 3 14
Apricot USA 250 WG Foliar 53–123 7 4 / (490)a 14
Cherry Canada 250 WG Foliar 53–105 7 3 7
Cherry USA 250 WG Foliar 53–123 3 4 / (490)a 7
Citrus fruits USA 250 WG Foliar 53–105 7 3 / (210)a 1
Fruiting vegetables
Canada 250 WG Foliar 35–50 5 3 1
Fruiting vegetables
USA 120 SC Foliar 44–88 4 6 / (298)a 1
Leaf of root, tuber & legume vegetables
USA 120 SC Foliar 44–88 7 6 / (298) a 3
Leafy vegetables Canada 250 WG Foliar 35–50 5 3 1
Leafy vegetables USA 120 SC Foliar 44–88 4 6 / (298) a 1
Nectarine Canada 250 WG Foliar 53–105 7 3 14
Nectarine USA 250 WG Foliar 53–123 7 4 / (490)a 1
Peach Canada 250 WG Foliar 53–105 7 3 14

1694 Spinetoram
Formulation Application Crop Country
g ai/L or
g ai/kg
type Method Rate
g ai/ha
Rate
g ai/hL
Min. interval
days
Max. no./
g ai/ season
PHI
days
Peach USA 250 WG Foliar 53–123 7 4 / (490)a 14
Plums, prunes Canada 250 WG Foliar 53–105 7 3 7
Plums, prunes USA 250 WG Foliar 53–123 3 4 / (490)a 7
Pome fruits Canada 250 WG Foliar 53–105 7 3 7
Pome fruits New Zealand
250 WG Foliar 50 2.5 14 4 7
Pome fruits USA 250 WG Foliar 79–123 7 4 / (490)a 7
Root vegetables (carrot, horse radish, radish, rutabaga, turnip)
Canada 250 WG Foliar 35–50 5 3 3
Root vegetables
(potato, sugar beet, etc)
USA 120 SC Foliar 53–70 7 4 / (281) a 7
Root vegetables
(radish, turnip)
USA 120 SC Foliar 53–70 4 3 / (210)a 3
Tree nuts USA 250 WG Foliar 26–123 7 4 / (490)a 14 a Total application per season or year.
RESIDUES RESULTING FROM SUPERVISED TRIALS ON CROPS
The Meeting received information on supervised field trials of spinetoram on the following crops:
Commodity Group Table No. Oranges Citrus Table 21 Apple Pome fruits Table 22 Apple Pome fruits Table 23 Apple Pome fruits Table 24 Pear Pome fruits Table 25 Cherry Stone fruit Table 26 Peach Stone fruit Table 27 Nectarine Stone fruit Table 28 Apricot Stone fruit Table 29 Tomatoes Fruiting vegetables, Other than Cucurbits Table 30 Leafy lettuce Leafy vegetables Table 31 Sugarbeet Root and tuber vegetables Table 32 Almonds Tree nuts Table 33 Pecan nut Tree nuts Table 34 Sugar beet leaves and tops Animal feedstuffs Table 35 Almond hulls Animal feedstuffs Table 36
Trials were generally well documented with full laboratory and field reports. Laboratory reports included method validation, with batch recoveries at residue levels similar to those occurring in samples from the supervised trials. Dates of analyses or duration of residue sample storage were also provided. In general, data on procedural recoveries were within the acceptable range 70–120%, with relative standard deviation of < 20%. In addition, frozen storage periods from harvest to analysis of all samples were within those confirmed to be stable through separate storage stability determinations.

Spinetoram 1695
Field reports provide data on the dates of spray applications, methods used and sampling dates. Although trials included control plots, but no control data are recorded in the tables below unless residues in control samples exceeded the LOQ.
The residue concentrations are reported for XDE-175-J, XDE-175-L, N-demethyl-175-J and N-formyl-175-J. They are unadjusted for procedural recovery. Where residues were below the limit of detection (0.003 mg/kg in US and Canadian trials and 0.05 mg/kg in trials in Australia and New Zealand), they are expressed as “ND”. Where they are below the limit of quantification (0.01 mg/kg) and at or above the limit of detection, they are expressed as “< 0.01”.
Total residues for estimation of maximum residue levels were calculated by summing up the concentrations of XDE-175-J and XDE-175-L. XDE-175-J was the primary residue reflecting higher ratio in spinetoram formulations. The method for calculation of the total residues is illustrated below. In the calculation, “ND” is treated in the same manner as “< 0.01”.
XDE-175-J XDE-175-L Total
mg/kg
< 0.01 < 0.01 < 0.01
0.05 < 0.01 0.05
0.06 0.02 0.08
Total residues for estimation of STMRs were calculated by summing up the concentrations of XDE-175-J, XDE-175-L, N-demethyl-175-J and N-formyl-175-J. In most trials, XDE-175-J was the primary residue at shorter PHIs while, in many cases, N-formyl-175-J was found at higher concentrations than XDE-175-J at longer PHIs. On the other hand, XDE-175-L, with its concentration being one third of that of XDE-175-J, was a minor component in the four compounds. N-demethyl-J was in most cases at lower concentrations than XDE-175-J and in a number of trials was not determined. The method for calculation of the total residues taking the above into account is illustrated below. In the calculation, “ND” is treated in the same manner as “< 0.01”.
XDE-175-J XDE-175-L N-demethyl-175-J N-formyl-175-J Total
mg/kg
< 0.01 < 0.01 < 0.01 < 0.01 < 0.02
0.05 < 0.01 < 0.01 < 0.01 0.06
< 0.01 < 0.01 < 0.01 0.05 0.06
0.05 < 0.01 < 0.01 0.05 0.10
0.06 0.02 0.02 0.06 0.16
In all the US trials, duplicate samples were taken and analysed. In accordance with the 2007 JMPR’s decision, the higher value of the two was used for estimating maximum residue level.
Total values of XDE-175-J and XDE-175-L residues from the trials conducted according to the GAP have been underlined and used for the estimation of maximum residue levels. Corresponding total values of XDE-175-J, XDE-175-L, N-demethyl-175-J and N-formyl-175-J residues were used for estimation of STMRs and they are double underlined.
Orange
Twelve supervised trials on oranges were conducted in commercial citrus growing areas in the US in 2004 and 2007 (Dolder and Wendelberg, 2005; Report 040063; McKellar, 2008; Report ARAP 07D-001).

1696 Spinetoram
Trials were conducted in six sites, each site consisting of a control plot and 2 treated plots. Trial plots had a minimum of 6 orange trees, with samples taken from the 4 inner trees. In each site, one plot was treated using a low spray volume (700 L/ha) and the other, a high spray volume (approximately 3300 L/ha). Each treated plot received three applications of a suspension concentrate (SC) formulation containing 100 g/L of spinetoram at the nominal rate of 70 g ai/ha or a seasonal total of 210 g ai/ha. The applications were made at 4-day intervals and mature fruits were collected at the PHI of 1 day. In one of each of the low volume and high volume spray trials, samples were also taken on days 0, 3, 7, and 14 after the last application.
Approximately 4.5 kg of mature oranges were collected by hand. At each sampling, a single composite sample was taken from the control plot while duplicate composite samples were taken independently from each treated plot. Samples were frozen within 4 h of collection, placed in plastic bags, labelled, shipped frozen, and kept in temperature-monitored freezers at –20 °C until analysis.
Spinetoram and the metabolites were analysed using the method GRM 05.04 with an LOQ of 0.01 mg/kg and LOD of 0.003 mg/kg. Samples from the 2008 trials were analysed using method GRM 05.03, with the same LOQ and LOD values as GRM 05.04.
Table 21-1 Residues of spinetoram from supervised trials on orange in the USA (for estimation of maximum residue level)
Application Residue, mg/kg Location, year
(Variety)
Form
g ai/hL
g ai/ha No
Total/ season,
g ai/ha
PHI, days
XDE-175-J
XDE-175-L
Total a
Report No.
GAP, USA Citrus fruits
SC or
WG
53–105
3 210 1
Foliar application using low spray volume (~700 L/ha)
0.030 < 0.01 0.030 Deleon Springs, FL, 2004
(Valencia)
SC 10 70–72 3 213 1
0.028 < 0.01 0.028
040063
0.011 ND 0.011 Mount Dora, FL, 2004
(Valencia)
SC 11 71–72 3 214 1
0.022 < 0.01 0.022
040063
< 0.01 ND < 0.01 Raymondville, TX, 2004 (N-33)
SC 10 70–72 3 213 1
< 0.01 ND < 0.01
040063
< 0.01 ND < 0.01 Richgrove, CA, 2004
(Olinda)
SC 9 70–71 3 211 1
< 0.01 ND < 0.01
040063
0.011 ND 0.011 SC 9 70 3 210 0
0.014 < 0.01 0.014
040063
0.012 < 0.01 0.012 1
0.010 ND 0.010
< 0.01 ND < 0.01 3
0.011 ND 0.011
< 0.01 ND < 0.01 7
< 0.01 ND < 0.01
< 0.01 ND < 0.01
Porterville,CA, 2004
(Cutter Valencia)
14
< 0.01 ND < 0.01
0.028 < 0.01 0.028 FL, 2007 (Not specified)
WG 11 69- 72 3 212 1
0.025 ND 0.025
ARAP
07D-001
Foliar application using high spray volume (~3300 L/ha)
Deleon Springs, SC 2 70-71 3 212 1 0.015 < 0.01 0.015 040063

Spinetoram 1697
Application Residue, mg/kg Location, year
(Variety)
Form
g ai/hL
g ai/ha No
Total/ season,
g ai/ha
PHI, days
XDE-175-J
XDE-175-L
Total a
Report No.
GAP, USA Citrus fruits
SC or
WG
53–105
3 210 1
FL, 2004 (Valencia)
0.014 ND 0.014
0.017 < 0.01 0.017 Mount Dora, FL, 2004
(Valencia)
SC 2 70-71 3 212 1
0.018 < 0.01 0.018
040063
< 0.01 ND < 0.01 Raymondville, TX, 2004 (N-33)
SC 2 70-71 3 211 1
ND ND < 0.01
040063
0.021 < 0.01 0.021 Richgrove, CA, 2004
(Olinda)
SC 2 70-71 3 211 1
0.020 < 0.01 0.020
040063
SC 2 70 3 210 0.021 < 0.01 0.021
0
0.012 < 0.01 0.012
0.010 ND 0.010
Porterville, CA, 2004
(Cutter Valencia)
1
0.012 ND 0.012
< 0.01 ND < 0.01
3
ND ND < 0.01
040063
< 0.01 ND < 0.01 7
< 0.01 ND < 0.01
< 0.01 ND < 0.01
14
< 0.01 ND < 0.01
0.021 < 0.01 0.021 FL, USA, 2007 (Not specified)
WG 2 69- 70 3 209 1
0.024 < 0.01 0.024
ARAP 07D-001
a Total residues = XDE-175-J + XDE-175-L
Table 21-2 Residues of spinetoram and metabolites from supervised trials on orange in the USA (for estimation of STMR)
Application Residue, mg/kg Location, year (Variety) Form
g ai/hL
g ai/ha
No
Total/ season,
g ai/ha
PHI, days XDE-
175-J XDE-175-L
ND-J NF-J Total
a
Report No.
GAP, USA Citrus fruits
SC or
WG
53-105
3 210 1
Foliar application using low spray volume (~700 L/ha)
0.030 < 0.01 0.011 0.016 0.057 Deleon Springs, FL,
2004 (Valencia)
SC 10 70-72
3 213 1 0.028 < 0.01 0.014 0.024 0.066
040063
0.011 ND < 0.01 < 0.01 0.021 Mount Dora, FL, 2004
(Valencia) SC 11
71-72
3 214 1 0.022 < 0.01 0.012 0.017 0.051
040063
< 0.01 ND < 0.01 0.012 0.022 Raymondville, TX, 2004 (N-33)
SC 10 70-72
3 213 1 < 0.01 ND < 0.01 0.011 0.021
040063
Richgrove, SC 9 70- 3 211 1 < 0.01 ND ND ND < 0.02 040063

1698 Spinetoram
Application Residue, mg/kg Location, year (Variety) Form
g ai/hL
g ai/ha
No
Total/ season,
g ai/ha
PHI, days XDE-
175-J XDE-175-L
ND-J NF-J Total
a
Report No.
GAP, USA Citrus fruits
SC or
WG
53-105
3 210 1
CA, 2004 (Olinda)
71 < 0.01 ND ND < 0.01 < 0.02
0.011 ND < 0.01 0.014 0.025 Porterville,CA, 2004
(Cutter Valencia)
SC 9 70 3 210 0 0.014 < 0.01 < 0.01 0.012 0.026
040063
0.012 < 0.01 ND 0.015 0.027 1
0.010 ND < 0.01 0.020 0.030
< 0.01 ND ND < 0.01 < 0.02 3
0.011 ND < 0.01 0.022 0.033
< 0.01 ND ND 0.015 0.025 7
< 0.01 ND ND < 0.01 < 0.02
< 0.01 ND ND 0.013 0.023
14 < 0.01 ND ND 0.015 0.025
0.028 < 0.01 0.013 < 0.01 0.051 FL, 2007 (Not
specified) WG 11
69- 72
3 212 1 0.025 ND < 0.01 ND 0.035
ARAP 07D-001
Foliar application using high spray volume (~3300 L/ha)
0.015 < 0.01 < 0.01 0.026 0.041 Deleon Springs, FL,
2004 (Valencia)
SC 2 70-71
3 212 1 0.014 ND < 0.01 0.024 0.038
040063
0.017 < 0.01 < 0.01 0.022 0.039 Mount Dora, FL, 2004
(Valencia) SC 2
70-71
3 212 1 0.018 < 0.01 < 0.01 0.021 0.039
040063
< 0.01 ND < 0.01 < 0.01 < 0.02 Raymondville, TX, 2004 (N-33)
SC 2 70-71
3 211 1 ND ND ND < 0.01 < 0.02
040063
0.021 < 0.01 < 0.01 0.032 0.053 Richgrove, CA, 2004 (Olinda)
SC 2 70-71
3 211 1 0.020 < 0.01 < 0.01 0.049 0.069
040063
SC 2 70 3 210 0.021 < 0.01 < 0.01 0.038 0.059
0
0.012 < 0.01 < 0.01 0.026 0.038
0.010 ND < 0.01 0.035 0.045
Porterville, CA, 2004 (Cutter
Valencia)
1
0.012 ND < 0.01 0.035 0.047
< 0.01 ND ND 0.019 0.029
3
ND ND ND < 0.01 < 0.02
040063
< 0.01 ND ND 0.026 0.036 7
< 0.01 ND ND 0.026 0.036
< 0.01 ND ND 0.023 0.033
14 < 0.01 ND ND 0.020 0.03
0.021 < 0.01 0.010 < 0.01 0.041 FL, USA, 2007 (Not
specified)
WG 2 69- 70
3 209 1 0.024 < 0.01 0.012 < 0.01 0.046
ARAP 07D-001
a Total residues = XDE-175-J + XDE-175-L + ND-J + NF-J

Spinetoram 1699
Pome Fruits
Supervised trials on apples were conducted in Australia, Canada, New Zealand, and the USA during 2004-2007. Trials on pears were also conducted in Australia and New Zealand during 2005/2006 season.
Supervised trials on apple in the USA
Supervised trials on apples were conducted in major apple growing areas in the USA in 2004 and 2007 (Dolder and Wendelburg, 2005; Report 040063; McKellar, 2008; Report ARAP 07D-001).
Twelve trials were carried out in six different sites, with ten trials conducted in 2004 and two conducted in 2007. Each site consisted of one control plot and two treated plots. Each treated plot had a minimum of 6 apple trees, with samples taken from the four inner trees. In each site, one plot was treated using low spray volume application (~700 L/ha) and the other, a high volume spray (~3300 L/ha). Five applications of a formulation (100 g/L SC or 250 g/kg WG) were made to each treated plot using tractor-mounted airblast sprayers at a nominal rate of 100 g ai/ha or a total seasonal rate of 500 g ai/ha. Applications were made at intervals of about 28 days and mature fruits were harvested at the PHI of 7 days. In one of each of the low volume and high volume spray trials, samples were also taken on days 0, 1, 3, 7, and 14 after the last application.
Approximately 2.6 kg of apples were harvested by hand on each sampling date. A single composite sample was taken from the control plot while duplicate composite samples were taken independently from each treated plot. Samples were frozen within 4 h of collection, placed in plastic bags, labelled, shipped frozen, and kept in temperature-monitored freezers at –20 °C until analysis.
Spinetoram and the metabolites were analysed using the method GRM 05.04 with an LOQ and LOD of 0.01 mg/kg and 0.003 mg/kg, respectively.
Table 22-1 Residues of spinetoram from supervised trials on apples in the USA (for estimation of maximum residue level)
Application Residue, mg/kg Location, year
(Variety)
Form
g ai/hL g ai/ha No
Total/ season,
g ai/ha
PHI,
days
XDE-175-J
XDE-175-L
Total a
Report No.
GAP, USA Pome fruits
SC or WG
79-123 4 490 7
Foliar application using low spray volume (~700 L/ha)
< 0.01 ND < 0.01 North Rose, NY, 2004 (Rome)
SC 14 100 5 500 7
< 0.01 ND < 0.01
040063
0.011 ND 0.011 Blairsville, GA, 2004
(Red Rome)
SC 14 99-103 5 505 7
0.013 ND 0.013
040063
ND ND < 0.01 Paynesville, MN, 2004
(Honey Crisp)
SC 15 101-102
5 508 7
ND ND < 0.01
040063
ND ND < 0.01 Orosi, CA,
2004 (Granny Smith)
SC 13 97-101 5 494 7
< 0.01 ND < 0.01
040063
0.048 0.014 0.062 0
0.044 0.013 0.057
0.019 < 0.01 0.019 1
0.027 < 0.01 0.027
Ephrata, WA, 2004 (Red
Delicious)
SC 14 100 5 500
3 0.014 ND 0.014
040063

1700 Spinetoram
Application Residue, mg/kg Location, year
(Variety)
Form
g ai/hL g ai/ha No
Total/ season,
g ai/ha
PHI,
days
XDE-175-J
XDE-175-L
Total a
Report No.
GAP, USA Pome fruits
SC or WG
79-123 4 490 7
0.019 < 0.01 0.019
0.013 ND 0.013
7
< 0.01 ND < 0.01
< 0.01 ND < 0.01 14
< 0.01 ND < 0.01
0.028 ND 0.028 MI, 2007 (Not specified)
WG 16 99- 101
5 501 7
0.023 ND 0.023
ARAP 07D-001
Foliar application using high spray volume (~3300 L/ha)
< 0.01 ND < 0.01 North Rose, NY, 2004 (Rome)
SC 4 98-100 5 498 7
< 0.01 ND < 0.01
040063
0.012 ND 0.012 Blairsville, GA, 2004
(Red Rome)
SC 3 100-103
5 509 7
0.010 ND 0.010
040063
ND ND < 0.01 Paynesville, MN, 2004
(Honey Crisp)
SC 3 101-102
5 506 7
ND ND < 0.01
040063
< 0.01 ND < 0.01 Orosi, CA,
2004 (Granny Smith)
SC 3 98-100 5 498 7
< 0.01 ND < 0.01
040063
0.041 0.011 0.052 0
0.045 0.012 0.057
0.015 ND 0.015 1
0.012 ND 0.012
0.013 ND 0.013 3
0.011 ND 0.011
< 0.01 ND < 0.01 7
< 0.01 ND < 0.01
< 0.01 ND < 0.01
Ephrata, WA, 2004 (Red
Delicious)
SC 3 99-100 5 498
14
< 0.01 ND < 0.01
040063
0.020 ND 0.020 MI, 2007 (Not
specified)
WG 3 96- 101
5 498 7
0.020 ND 0.020
ARAP 07D-001
a Total residue = XDE-175-J + XDE-175-L.
Table 22-2 Residues of spinetoram and metabolites from supervised trials on apples in the USA (for estimation of STMR)
Application Residue, mg/kg
Location, year
(Variety)
Form
g ai/hL
g ai/ha
No
Total/ season,
g ai/ha
PHI, days XDE-
175-J XDE-175-L
ND-J NF-J Total a
Report No.
GAP, USA Pome fruits
SC or
WG
79-123
4 490 7

Spinetoram 1701
Application Residue, mg/kg
Location, year
(Variety)
Form
g ai/hL
g ai/ha
No
Total/ season,
g ai/ha
PHI, days XDE-
175-J XDE-175-L
ND-J NF-J Total a
Report No.
GAP, USA Pome fruits
SC or
WG
79-123
4 490 7
Foliar application using low spray volume (~700 L/ha)
< 0.01 ND ND ND < 0.02 North Rose, NY, 2004 (Rome)
SC 14 100 5 500 7
< 0.01 ND ND < 0.01 < 0.02
040063
0.011 ND < 0.01 ND 0.021 Blairsville, GA, 2004
(Red Rome)
SC 14 99-103
5 505 7
0.013 ND < 0.01 < 0.01 0.023
040063
ND ND ND ND < 0.02 Paynesville, MN, 2004
(Honey Crisp)
SC 15 101-102
5 508 7
ND ND ND ND < 0.02
040063
ND ND ND ND < 0.02 Orosi, CA, 2004
(Granny Smith)
SC 13 97-101
5 494 7
< 0.01 ND ND ND < 0.02
040063
0.048 0.014 < 0.01 < 0.01 0.072 0
0.044 0.013 < 0.01 < 0.01 0.067
0.019 < 0.01 < 0.01 0.010 0.029 1
0.027 < 0.01 0.012 0.014 0.053
0.014 ND < 0.01 < 0.01 0.024 3
0.019 < 0.01 < 0.01 0.013 0.032
0.013 ND 0.010 0.013 0.036
Ephrata, WA, 2004 (Red
Delicious)
SC 14 100 5 500
7
< 0.01 ND < 0.01 < 0.01 < 0.02
040063
< 0.01 ND < 0.01 0.010 0.020 14
< 0.01 ND < 0.01 < 0.01 < 0.02
0.028 ND < 0.01 0.010 0.038 MI, 2007 (Not
specified)
WG 16 99- 101
5 501 7
0.023 ND < 0.01 0.010 0.033
ARAP 07D-001
Foliar application using high spray volume (~3300 L/ha)
< 0.01 ND ND < 0.01 < 0.02 North Rose, NY, 2004 (Rome)
SC 4 98-100
5 498 7
< 0.01 ND < 0.01 0.012 0.022
040063
0.012 ND < 0.01 < 0.01 0.022 Blairsville, GA, 2004
(Red Rome)
SC 3 100-103
5 509 7
0.010 ND < 0.01 < 0.01 0.020
040063
ND ND ND ND < 0.02 Paynesville, MN, 2004 (Honey Crisp)
SC 3 101-102
5 506 7
ND ND ND ND < 0.02
040063
< 0.01 ND ND < 0.01 < 0.02 Orosi, CA, 2004
(Granny Smith)
SC 3 98-100
5 498 7
< 0.01 ND ND < 0.01 < 0.02
040063
0.041 0.011 < 0.01 < 0.01 0.062 0
0.045 0.012 < 0.01 < 0.01 0.067
Ephrata, WA, 2004 (Red
SC 3 99-100
5 498
1 0.015 ND < 0.01 0.017 0.032
040063

1702 Spinetoram
Application Residue, mg/kg
Location, year
(Variety)
Form
g ai/hL
g ai/ha
No
Total/ season,
g ai/ha
PHI, days XDE-
175-J XDE-175-L
ND-J NF-J Total a
Report No.
GAP, USA Pome fruits
SC or
WG
79-123
4 490 7
0.012 ND < 0.01 0.016 0.028
0.013 ND < 0.01 0.017 0.030 3
0.011 ND < 0.01 0.018 0.029
< 0.01 ND ND 0.012 0.022 7
< 0.01 ND < 0.01 0.016 0.026
< 0.01 ND ND 0.015 0.025
Delicious)
14
< 0.01 ND ND 0.010 0.020
0.020 ND < 0.01 0.017 0.037 MI, 2007 (Not
specified)
WG 3 96- 101
5 498 7
0.020 ND < 0.01 0.016 0.036
ARAP 07D-001
a Total residue = XDE-175-J + XDE-175-L + ND-J + NF-J.
Supervised trials on apple in Canada
Six supervised trials were conducted on apples in Canada in 2005 (Dolder and Schelle, 2006; Report 050041). Two additional trials included in the study were conducted in Idaho, USA.
A total of eight trials were carried out in four different sites, four trials in two sites in Ontario, two trials in Quebec, and two trials in Idaho. Each site consisted of one control plot and two treated plots. Three applications of a water dispersible granule formulation (WG) containing 250 g /kg spinetoram were made at two different rates, one plot receiving a seasonal rate of 240 g ai/ha and the other, 315 g ai/ha. Applications were made at 6–8-day intervals, using airblast sprayers with 5–7 nozzles, with spray volumes ranging from 916 to 993 L/ha. Mature apples were harvested 5–7 days after the last application.
A minimum of 24 fruits, weighing approximately 2.8 kg were harvested by hand. A single composite sample was taken from the control plot while duplicate composite samples were taken independently from each treated plot. Samples were frozen within 4 h of collection, placed in plastic bags, labelled, shipped frozen, and kept in temperature-monitored freezers at –20 °C until analysis.
Spinetoram and the metabolites were analysed using the method GRM 05.04 with an LOQ and LOD of 0.01 mg/kg and 0.003 mg/kg, respectively.
Table 23-1 Residues of spinetoram from supervised trials on apple in Canada (for estimation of maximum residue level)
Application Residue, mg/kg Location, year
(Variety)
Form
g ai/hL g ai/ha No
Total/ season,
g ai/ha
PHI,
days
XDE-175-J
XDE-175-L
Totala
Report No.
GAP, Canada WG 53-105 3 7
< 0.01 ND < 0.01 St. George, Ontario, 2005
(Red Delicious)
WG 8 79- 81 3 239 6
< 0.01 ND < 0.01
050041

Spinetoram 1703
Application Residue, mg/kg Location, year
(Variety)
Form
g ai/hL g ai/ha No
Total/ season,
g ai/ha
PHI,
days
XDE-175-J
XDE-175-L
Totala
Report No.
0.017 < 0.01 0.017 St. George, Ontario, 2005
(Red Delicious)
WG 11 103- 106
3 314 6
0.012 ND 0.012
050041
0.010 ND 0.010 St.George, Ontario, 2005
(IdaRed)
WG 8 76- 80 3 233 6
0.010 ND 0.010
050041
0.011 ND 0.011 St.George, Ontario, 2005
(IdaRed)
WG 11 99- 108
3 309 5
0.015 ND 0.015
050041
< 0.01 ND < 0.01 S-Paul d’Abbotsford, Quebec, 2005 (McIntosh)
WG 9 77- 80 3 237 7
< 0.01 ND < 0.01
050041
< 0.01 ND < 0.01 S-Paul d’Abbotsford, Quebec, 2005 (McIntosh)
WG 11 101- 107
3 314 7
< 0.01 ND < 0.01
050041
0.018 < 0.01 0.018 Rockland, Idaho, USA,
2005 (McIntosh)
WG 8 78- 80 3 236 7
0.020 < 0.01 0.020
050041
0.028 < 0.01 0.028 Rockland, Idaho, USA,
2005 (McIntosh)
WG 11 101- 103
3 306 7
0.019 < 0.01 0.019
050041
a Total residue = XDE-175-J + XDE-175-L.
Table 23-2. Residues of spinetoram and metabolites from supervised trials on apple in Canada (for estimation of STMR)
Application Residue, mg/kg Location,
year (Variety)
Form g
ai/hL g
ai/ha No
Total/ season, g ai/ha
PHI, days XDE-
175-J XDE-175-L
ND-J NF-J Total a
Report No.
GAP, Canada WG 53-105
3 7
< 0.01 ND < 0.01 ND < 0.02 St. George, Ontario,
2005 (Red
Delicious)
WG 8 79- 81
3 239 6
< 0.01 ND < 0.01 < 0.01 < 0.02
050041
0.017 < 0.01 0.011 < 0.01 0.038 St. George, Ontario, 2005
(Red Delicious)
WG 11 103- 106
3 314 6
0.012 ND < 0.01 < 0.01 0.022
050041
0.010 ND < 0.01 < 0.01 0.020 St.George, Ontario, 2005
(IdaRed)
WG 8 76- 80
3 233 6
0.010 ND < 0.01 ND 0.020
050041
0.011 ND < 0.01 < 0.01 0.021 St.George, Ontario, 2005
(IdaRed)
WG 11 99- 108
3 309 5
0.015 ND < 0.01 < 0.01 0.025
050041

1704 Spinetoram
Application Residue, mg/kg Location,
year (Variety)
Form
g ai/hL
g ai/ha
No
Total/ season,
g ai/ha
PHI, days XDE-
175-J XDE-175-L
ND-J NF-J Total a
Report No.
GAP, Canada WG 53-105
3 7
< 0.01 ND < 0.01 ND < 0.02 S-Paul d’Abbotsford, Quebec, 2005 (McIntosh)
WG 9 77- 80
3 237 7
< 0.01 ND < 0.01 ND < 0.02
050041
< 0.01 ND < 0.01 ND < 0.02 S-Paul d’Abbotsford, Quebec, 2005 (McIntosh)
WG 11 101- 107
3 314 7
< 0.01 ND < 0.01 ND < 0.02
050041
0.018 < 0.01 < 0.01 < 0.01 0.028 Rockland, Idaho, USA,
2005 (McIntosh)
WG 8 78- 80
3 236 7
0.020 < 0.01 < 0.01 < 0.01 0.030
050041
0.028 < 0.01 < 0.01 < 0.01 0.038 Rockland, Idaho, USA,
2005 (McIntosh)
WG 11 101- 103
3 306 7
0.019 < 0.01 < 0.01 < 0.01 0.029
050041
a Total residue = XDE-175-J + XDE-175-L + ND-J + NF-J.
Supervised trials on apple in Australia
A total of 20 supervised field trials on apples and eight on pears were conducted at six sites in Australia during 2004/2005 and 2005/2006 season (Cowles, 2006; Reports 040114 and 050062).
In trials in the 2004/2005 season at one site in Australia, apple trees were treated with one or four applications of a SC formulation of spinetoram, using two treatment regimes. The first treatment schedule consisted of four applications of spinetoram formulation at 63, 49, 35 and 21 days before harvest. The second treatment schedule consisted of one application at 21 days before harvest. Treatments were made as high volume applications at rates of 2.5 g/hL, 3.75 g/hL, 5 g/hL and 7.5 g/hL of spinetoram, respectively.
During the 2005/2006 season, trials were conducted in five sites in Australia where apple plots, consisting of 1 to 6 trees per plot ranging from early flowering to full size maturing fruit, were treated with 4 or 7 applications of a WG formulation of spinetoram (250 g ai/L). Two treatment regimens were used. The first treatment schedule consisted of three applications at 5-day intervals over flowering followed by four applications at 14-day intervals commencing 63 days before harvest so that the last application was 21 days before harvest. The results show that these early season treatments had no cumulative effect on residues resulting from the 4 applications at 14-day interval sprays used later in the season. The second treatment schedule consisted of four applications at 14-day intervals commencing 63 days before commercial harvest so that the last application is 21 days before harvest. Treatments were made as foliar spray applications at rates of 5 g ai/hL and 7.5 g ai/hL of spinetoram.
Twenty-five whole apples or pears, weighing approximately 2–5 kg, were collected from each field at 0, 7, 14, 21, 28 and 35 days after the last application. Samples were collected by hand, packed in plastic bags, labelled, and transported frozen to the laboratory.
Spinetoram and the metabolites were analysed using the method GRM 05.03, with an LOQ 0.01 mg/kg. The LOD was determined to be 0.005 mg/kg.

Spinetoram 1705
Supervised trials on apple and pear in New Zealand
A total of 20 supervised field trials on apples and 8 on pears were carried out at 6 sites in New Zealand during the 2004/05 and 2005/06 seasons (Cowles, 2006; Reports 040114 and 050074). All the trials were decline trials.
Each field site consisted of one untreated and four treated plots, each with four trees (except for the trial on apple in 2004/2005, which had two trees). Each treated plot received one of four treatment rates of 2.5, 3.75, 5, and 7.5 g ai/hL (SC 100 or 120 g ai/L spinetoram) applied at intervals of 14–21 days. For the 2004/2005 trials, two application regimes were used; one using 4 applications at 60–63, 49, 36, and 21 days before harvest, and the other using a single application 21 days before harvest. The 2005/2006 trials used four applications. Mature apples were harvested 5–7 days after the last application. Applications were by hand-gun to run-off (1500–1800 L water/ha).
About 3–4 kg (12 fruits) of whole mature fruits were harvested by hand on 0, 1, 3, 7, 14, 28, and 35 or 42 days after the last application. Samples were placed in plastic bags, labelled, frozen and transported frozen to the laboratory, where they were kept in freezers at –18 °C until analysis.
Spinetoram and the metabolites were analysed using the method GRM 05.03, previously validated with an LOQ 0.01 mg/kg. The LOD was 0.005 mg/kg.
Table 24-1 Residues of spinetoram from supervised trials on apple in Australia and New Zealand (for estimation of maximum residue level)
Application Residue, mg/kg Location, year
(Variety)
Form
g ai/hL g ai/ha No
Total/ season,
g ai/ha
PHI,
days
XDE-175-J
XDE-175-L
Total a
Report No.
GAP, New Zealand
Pome fruits
WG 2.5 4 7
AUSTRALIAN TRIALS, 2004/2005 SEASON
0 0.051 < 0.01 0.051
3 0.021 ND 0.021
7 < 0.01 ND < 0.01
14 < 0.01 ND < 0.01
21 < 0.01 ND < 0.01
28 ND ND < 0.01
Shepparton East, VIC,
2005 (Sundowner) 040114-01
SC 2.5 37.5 4 150
35 ND ND < 0.01
040114
0 0.120 0.023 0.143
3 0.050 < 0.01 0.05
8 0.020 ND 0.02
14 0.011 ND 0.011
21 < 0.01 ND < 0.01
28 < 0.01 ND < 0.01
Shepparton East, VIC,
2005 (Sundowner) 040114-01
SC 3.75 56–57 4 225
36 ND ND < 0.01
040114
0 0.120 0.026 0.146
3 0.094 0.012 0.106
8 0.042 ND 0.042
14 0.016 ND 0.016
21 < 0.01 ND < 0.01
28 < 0.01 ND < 0.01
Shepparton East, VIC,
2005 (Sundowner) 040114-01
SC 5 75 4 300
36 < 0.01 ND < 0.01
040114

1706 Spinetoram
Application Residue, mg/kg Location, year
(Variety)
Form
g ai/hL g ai/ha No
Total/ season,
g ai/ha
PHI,
days
XDE-175-J
XDE-175-L
Total a
Report No.
0 0.186 0.039 0.225
3 0.101 0.017 0.118
8 0.049 ND 0.049
14 0.024 ND 0.024
21 < 0.01 ND < 0.01
28 0.024 ND 0.024
Shepparton East, VIC,
2005 (Sundowner) 040114-01
SC 7.5 112–113
4 450
36 < 0.01 ND < 0.01
040114
0 0.030 < 0.01 0.03
3 0.024 ND 0.024
8 < 0.01 ND < 0.01
14 ND ND < 0.01
21 ND ND < 0.01
28 ND ND < 0.01
Shepparton East, VIC,
2005 (Sundowner) 040114-01
SC 2.5 37.5 1 37.5
36 ND ND < 0.01
040114
0 0.053 0.012 0.065
3 0.026 ND 0.026
8 < 0.01 ND < 0.01
14 ND ND < 0.01
21 ND ND < 0.01
28 ND ND < 0.01
Shepparton East, VIC,
2005 (Sundowner) 040114-01
SC 3.75 56 1 56
36 ND ND < 0.01
040114
0 0.095 0.022 0.117
3 0.040 < 0.01 0.04
8 0.017 ND 0.017
14 0.010 ND 0.01
21 ND ND < 0.01
28 ND ND < 0.01
Shepparton East, VIC,
2005 (Sundowner) 040114-01
SC 5 75 1 75
36 ND ND < 0.01
040114
0 0.123 0.031 0.154
3 0.076 0.014 0.09
8 0.014 ND 0.014
14 0.034 ND 0.034
21 < 0.01 ND < 0.01
28 < 0.01 ND < 0.01
Shepparton East, VIC,
2005 (Sundowner) 040114-01
SC 7.5 112.5 1 112.5
36 ND ND < 0.01
040114
AUSTRALIAN TRIALS, 2005/2006 SEASON
0 0.04 < 0.01 0.04
7 < 0.01 ND < 0.01
14 ND ND < 0.01
28 ND ND < 0.01
Ardmona VIC, 2006
(Granny Smith) 050062-01
SC 5 62 4 248
35 ND ND < 0.01
050062

Spinetoram 1707
Application Residue, mg/kg Location, year
(Variety)
Form
g ai/hL g ai/ha No
Total/ season,
g ai/ha
PHI,
days
XDE-175-J
XDE-175-L
Total a
Report No.
0 0.06 0.02 0.08
7 0.01 ND 0.01
14 ND ND < 0.01
28 ND ND < 0.01
Ardmona VIC, 2006
(Granny Smith) 050062-01
SC 7.5 93 4 372
35 ND ND < 0.01
050062
0 0.05 0.01 0.06
7 < 0.01 ND < 0.01
28 ND ND < 0.01
Poziers, QLD, 2005-06
(Summer Del) 050062-022
WG 5 186–229
4 805
35 ND ND < 0.01
050062
0 0.04 0.02 0.06
7 0.03 ND 0.03
28 0.01 ND 0.01
Poziers, QLD, 2005-06
(Summer Del) 050062-022
WG 7.5 278–344
4 1207
35 ND ND < 0.01
050062
0 0.09 0.01 0.10
7 0.03 ND 0.03
14 0.02 ND 0.02
28 < 0.01 ND < 0.01
Spreyton, Tasmania, 2006
(Fuji) 050062-03
WG 5 128–149
4 551
35 ND ND < 0.01
050062
0 0.11 0.02 0.13
7 0.04 ND 0.04
14 0.02 ND 0.02
28 < 0.01 ND < 0.01
Spreyton, Tasmania, 2006
(Fuji) 050062-03
WG 7.5 188- 207
4 797
35 ND ND < 0.01
050062
0 0.06 0.02 0.08
7 < 0.01 ND < 0.01
14 ND ND < 0.01
28 ND ND < 0.01
Ardmona VIC, 2006
(Granny Smith) 050062-01
SC 5 62 7 434
35 ND ND < 0.01
050062
0 0.04 0.01 0.05
7 0.01 ND 0.01
14 ND ND < 0.01
28 ND ND < 0.01
Ardmona VIC, 2006
(Granny Smith) 050062-01
SC 7.5 93 7 651
35 ND ND < 0.01
050062
0 ND ND < 0.01 Poziers, QLD 2005-06 b
(Summer Del) 050062-02
WG 5 65–229
7 848
35 ND ND < 0.01
050062
0 ND ND < 0.01 Poziers, QLD, 2005-06 b
(Summer Del) 050062-02
WG 7.5 98–344
7 1549
35 ND ND < 0.01
050062

1708 Spinetoram
Application Residue, mg/kg Location, year
(Variety)
Form
g ai/hL g ai/ha No
Total/ season,
g ai/ha
PHI,
days
XDE-175-J
XDE-175-L
Total a
Report No.
0 0.05 < 0.01 0.05
7 0.03 ND 0.03
14 0.02 ND 0.02
28 ND ND < 0.01
Spreyton, Tasmania, 2006
(Fuji) APPLE
050062-03
WG 5 70–149
7 785
35 ND ND < 0.01
050062
0 0.11 0.02 0.13
7 0.03 ND 0.03
14 0.01 ND 0.01
28 0.01 ND 0.01
Spreyton, Tasmania, 2006
(Fuji) 050062-03
WG 7.5 101–207
7 1017
35 ND ND < 0.01
050062
NEW ZEALAND TRIALS, 2004/2005 SEASON
0 0.032 < 0.01 0.032
3 < 0.01 ND < 0.01
8 ND ND < 0.01
14 ND ND < 0.01
21 ND ND < 0.01
28 ND ND < 0.01
Hort Research, 2005 (Fuji)
040114-02
SC 2.5 52–62 4 233
36 ND ND < 0.01
040114
0 0.050 0.016 0.066
3 < 0.01 ND < 0.01
8 < 0.01 ND < 0.01
14 ND ND < 0.01
21 ND ND < 0.01
28 ND ND < 0.01
Hort Research, 2005 (Fuji)
040114-02
SC 3.75 69–83 4 307
36 ND ND < 0.01
040114
0 0.068 0.020 0.088
3 0.012 ND 0.012
8 < 0.01 ND < 0.01
14 ND ND < 0.01
21 ND ND < 0.01
28 ND ND < 0.01
Hort Research, 2005 (Fuji)
040114-02
SC 5 122–130
4 498
36 ND ND < 0.01
040114
0 0.075 0.023 0.098
3 0.025 < 0.01 0.025
8 < 0.01 ND < 0.01
14 < 0.01 ND < 0.01
21 ND ND < 0.01
28 ND ND < 0.01
Hort Research, 2005 (Fuji)
040114-02
SC 7.5 159–180
4 681
36 ND ND < 0.01
040114

Spinetoram 1709
Application Residue, mg/kg Location, year
(Variety)
Form
g ai/hL g ai/ha No
Total/ season,
g ai/ha
PHI,
days
XDE-175-J
XDE-175-L
Total a
Report No.
0 0.021 < 0.01 0.021
3 ND ND < 0.01
8 ND ND < 0.01
14 ND ND < 0.01
21 ND ND < 0.01
28 ND ND < 0.01
Hort Research, 2005 (Fuji)
040114-02
SC 2.5 62 1 62
36 ND ND < 0.01
040114
0 0.046 0.015 0.061
3 0.015 ND 0.015
8 < 0.01 ND < 0.01
14 ND ND < 0.01
21 ND ND < 0.01
28 ND ND < 0.01
Hort Research, 2005 (Fuji)
040114-02
SC 3.75 81 1 81
36 ND ND < 0.01
040114
0 0.086 0.027 0.113
3 0.016 ND 0.016
8 < 0.01 ND < 0.01
14 ND ND < 0.01
21 ND ND < 0.01
28 ND ND < 0.01
Hort Research, 2005 (Fuji)
040114-02
SC 5 104 1 104
36 ND ND < 0.01
040114
0 0.127 0.041 0.168
3 0.026 < 0.01 0.026
8 0.015 ND 0.015
14 ND ND < 0.01
21 ND ND < 0.01
28 ND ND < 0.01
Hort Research, 2005 (Fuji)
040114-02
SC 7.5 147 1 147
36 ND ND < 0.01
040114
NEW ZEALAND TRIALS, 2005/2006 SEASON
0 0.015 ND 0.015
3 0.012 ND 0.012
7 < 0.01 ND < 0.01
14 ND ND < 0.01
21 ND ND < 0.01
28 ND ND < 0.01
36 ND ND < 0.01
Twyford, Hawkes Bay,
2006 (Braeburn) 050074-01
SC 2.5 38-39 4 154
42 ND ND < 0.01
050074

1710 Spinetoram
Application Residue, mg/kg Location, year
(Variety)
Form
g ai/hL g ai/ha No
Total/ season,
g ai/ha
PHI,
days
XDE-175-J
XDE-175-L
Total a
Report No.
0 0.035 < 0.01 0.035
3 0.031 < 0.01 0.031
7 0.013 ND 0.013
14 0.011 ND 0.011
21 ND ND < 0.01
28 ND ND < 0.01
36 ND ND < 0.01
Twyford, Hawkes Bay,
2006 (Braeburn) 050074-01
SC
3.72 55- 58 4 226
42 ND ND < 0.01
050074
0 0.037 < 0.01 0.037
3 0.038 < 0.01 0.038
7 0.016 ND 0.016
14 0.011 ND 0.011
21 < 0.01 ND < 0.01
28 ND ND < 0.01
36 ND ND < 0.01
Twyford, Hawkes Bay,
2006 (Braeburn) 050074-01
SC
5 75- 79 4 307
42 ND ND < 0.01
050074
0 0.068 0.018 0.086
3 0.058 0.014 0.072
7 0.028 0.008 0.036
14 0.016 ND 0.016
21 < 0.01 ND < 0.01
28 ND ND < 0.01
36 ND ND < 0.01
Twyford, Hawkes Bay,
2006 (Braeburn) 050074-01
SC 7.6 112-118
4 461
42 ND ND < 0.01
050074
0 0.020 < 0.01 0.02
3 < 0.01 ND < 0.01
7 < 0.01 ND < 0.01
14 ND ND < 0.01
21 ND ND < 0.01
28 ND ND < 0.01
36 ND ND < 0.01
Havelock North, Hawkes
Bay, 2006 (Royal Gala) 050074-02
SC
2.5 36- 38 4 150
42 ND ND < 0.01
050074

Spinetoram 1711
Application Residue, mg/kg Location, year
(Variety)
Form
g ai/hL g ai/ha No
Total/ season,
g ai/ha
PHI,
days
XDE-175-J
XDE-175-L
Total a
Report No.
0 0.023 < 0.01 0.023
3 < 0.01 ND < 0.01
7 ND ND < 0.01
14 ND ND < 0.01
21 ND ND < 0.01
28 ND ND < 0.01
36 ND ND < 0.01
Havelock North, Hawkes
Bay, 2006 (Royal Gala) 050074-02
SC
3.7 54- 56 4 222
42 ND ND < 0.01
050074
0 0.045 0.012 0.057
3 < 0.01 ND < 0.01
7 < 0.01 ND < 0.01
14 < 0.01 ND < 0.01
21 ND ND < 0.01
28 ND ND < 0.01
36 ND ND < 0.01
Havelock North, Hawkes
Bay, 2006 (Royal Gala) 050074-02
SC
5 73- 76 4 300
42 ND ND < 0.01
050074
0 0.074 0.019 0.093
3 0.015 ND 0.015
7 < 0.01 ND < 0.01
14 < 0.01 ND < 0.01
21 ND ND < 0.01
28 ND ND < 0.01
36 ND ND < 0.01
Havelock North, Hawkes
Bay, 2006 (Royal Gala) 050074-02
SC
7.6 109- 115
4 450
42 ND ND < 0.01
050074
0 0.017 ND 0.017
3 ND ND < 0.01
7 ND ND < 0.01
14 ND ND < 0.01
21 ND ND < 0.01
28 ND ND < 0.01
36 ND ND < 0.01
Riwaka, Nelson, 2006 (Royal Gala) 050074-04
SC 2.5 38- 40 4 154
42 ND ND < 0.01
050074
SC 3.72 56- 59 4 228 0 0.016 ND 0.016 050074
3 < 0.01 ND < 0.01
7 ND ND < 0.01
Riwaka, Nelson, 2006 (Royal Gala) 050074-04
14 ND ND < 0.01
21 ND ND < 0.01
28 ND ND < 0.01
36 ND ND < 0.01
42 ND ND < 0.01

1712 Spinetoram
Application Residue, mg/kg Location, year
(Variety)
Form
g ai/hL g ai/ha No
Total/ season,
g ai/ha
PHI,
days
XDE-175-J
XDE-175-L
Total a
Report No.
0 0.025 < 0.01 0.025
3 ND ND < 0.01
7 < 0.01 ND < 0.01
14 ND ND < 0.01
21 ND ND < 0.01
28 ND ND < 0.01
36 ND ND < 0.01
Riwaka, Nelson, 2006 (Royal Gala) 050074-04
SC 5 76- 79 4 308
42 ND ND < 0.01
050074
0 0.060 0.018 0.078
3 0.012 ND 0.012
7 < 0.01 ND < 0.01
14 < 0.01 ND < 0.01
21 ND ND < 0.01
28 ND ND < 0.01
36 ND ND < 0.01
Riwaka, Nelson, 2006 (Royal Gala) 050074-04
SC 7.6 113- 119
4 461
42 ND ND < 0.01
050074
a Total residue = XDE-175-J + XDE-175-L. b Samples on Days 0, 7, and 28 are from replacement trials in Cottonvale, QLD, referred to as 050062-06 in the study.
Table 24-2 Residues of spinetoram and metabolites from supervised trials on apple in Australia and New Zealand (for estimation of STMR).
Application Residue, mg/kg Location,
year (Variety)
Form
g ai/hL
g ai/ha
No
Total/ season,
g ai/ha
PHI, days XDE-
175-J XDE-175-L
ND-J NF-J Total a
Report No.
GAP, New Zealand
Pome fruits
WG 2.5 4 7
AUSTRALIAN TRIALS, 2004/2005 SEASON
0 0.051 < 0.01 - ND 0.061
3 0.021 ND - ND 0.031
7 < 0.01 ND - ND < 0.02
14 < 0.01 ND - ND < 0.02
21 < 0.01 ND - ND < 0.02
28 ND ND - ND < 0.02
Shepparton East, VIC,
2005 (Sundowner) 040114-01
SC 2.5 37.5 4 150
35 ND ND - ND < 0.02
040114
SC 225 0 0.120 0.023 - < 0.01 0.153 040114
3 0.050 < 0.01 - < 0.01 0.060
8 0.020 ND - ND 0.030
Shepparton East, VIC,
2005 (Sundowner) 040114-01 14 0.011 ND - ND 0.021
21 < 0.01 ND - ND < 0.02
3.75 56–57
4
28 < 0.01 ND - ND < 0.02

Spinetoram 1713
Application Residue, mg/kg Location,
year (Variety)
Form
g ai/hL
g ai/ha
No
Total/ season,
g ai/ha
PHI, days XDE-
175-J XDE-175-L
ND-J NF-J Total a
Report No.
36 ND ND - ND < 0.02
0 0.120 0.026 - < 0.01 0.156
3 0.094 0.012 - < 0.01 0.116
8 0.042 ND - < 0.01 0.052
14 0.016 ND - ND 0.026
21 < 0.01 ND - ND < 0.02
28 < 0.01 ND - ND < 0.02
Shepparton East, VIC,
2005 (Sundowner) 040114-01
SC 5 75 4 300
36 < 0.01 ND - ND < 0.02
040114
0 0.186 0.039 - 0.011 0.236
3 0.101 0.017 - 0.012 0.130
8 0.049 ND - < 0.01 0.059
14 0.024 ND - < 0.01 0.034
21 < 0.01 ND - ND < 0.02
28 0.024 ND - < 0.01 0.034
Shepparton East, VIC,
2005 (Sundowner) 040114-01
SC 7.5 112–113
4 450
36 < 0.01 ND - ND < 0.02
040114
0 0.030 < 0.01 - ND 0.04
3 0.024 ND - ND 0.034
8 < 0.01 ND - ND < 0.02
14 ND ND - ND < 0.02
21 ND ND - ND < 0.02
28 ND ND - ND < 0.02
Shepparton East, VIC,
2005 (Sundowner) 040114-01
SC 2.5 37.5 1 37.5
36 ND ND - ND < 0.02
040114
0 0.053 0.012 - ND 0.075
3 0.026 ND - ND 0.036
8 < 0.01 ND - ND < 0.02
14 ND ND - ND < 0.02
21 ND ND - ND < 0.02
28 ND ND - ND < 0.02
Shepparton East, VIC,
2005 (Sundowner) 040114-01
SC 3.75 56 1 56
36 ND ND - ND < 0.02
040114
0 0.095 0.022 - ND 0.127
3 0.040 < 0.01 - ND 0.050
8 0.017 ND - ND 0.027
14 0.010 ND - ND 0.020
21 ND ND - ND < 0.02
28 ND ND - ND < 0.02
Shepparton East, VIC,
2005 (Sundowner) 040114-01
SC 5 75 1 75
36 ND ND - ND < 0.02
040114
0 0.123 0.031 - ND 0.164
3 0.076 0.014 - < 0.01 0.100
8 0.014 ND - ND 0.024
14 0.034 ND - ND 0.044
21 < 0.01 ND - ND < 0.02
28 < 0.01 ND - ND < 0.02
Shepparton East, VIC,
2005 (Sundowner) 040114-01
SC 7.5 112.5 1 112.5
36 ND ND - ND < 0.02
040114

1714 Spinetoram
Application Residue, mg/kg Location,
year (Variety)
Form
g ai/hL
g ai/ha
No
Total/ season,
g ai/ha
PHI, days XDE-
175-J XDE-175-L
ND-J NF-J Total a
Report No.
AUSTRALIAN TRIALS, 2005/2006 SEASON
0 0.04 < 0.01 ND ND 0.05
7 < 0.01 ND ND ND < 0.02
14 ND ND ND ND < 0.02
28 ND ND ND ND < 0.02
Ardmona VIC, 2006 (Granny Smith)
050062-01
SC 5 62 4 248
35 ND ND ND ND < 0.02
050062
0 0.06 0.02 ND ND 0.09
7 0.01 ND < 0.01 ND 0.02
14 ND ND ND ND < 0.02
28 ND ND ND ND < 0.02
Ardmona VIC, 2006 (Granny Smith)
050062-01
SC 7.5 93 4 372
35 ND ND ND ND < 0.02
050062
0 0.05 0.01 < 0.01 ND 0.07
7 < 0.01 ND 0.01 < 0.01 0.03
28 ND ND < 0.01 < 0.01 < 0.02
Poziers, QLD, 2005-
06 (Summer
Del) 050062-02 b
WG 5 186-229
4 805
35 ND ND ND ND < 0.02
050062
0 0.04 0.02 < 0.01 < 0.01 0.07
7 0.03 ND 0.03 0.01 0.07
28 0.01 ND 0.02 0.01 0.04
Poziers, QLD, 2005-
06 (Summer
Del) 050062-02 b
WG 7.5 278–344
4 1207
35 ND ND < 0.01 < 0.01 < 0.02
050062
0 0.09 0.01 < 0.01 < 0.01 0.11
7 0.03 ND < 0.01 < 0.01 0.04
14 0.02 ND ND ND 0.03
28 < 0.01 ND ND ND < 0.02
Spreyton, Tasmania,
2006 (Fuji)
050062-03
WG 5 128–149
4 551
35 ND ND ND ND < 0.02
050062
0 0.11 0.02 < 0.01 < 0.01 0.14
7 0.04 ND 0.010 < 0.01 0.06
14 0.02 ND ND ND 0.03
28 < 0.01 ND ND ND < 0.02
Spreyton, Tasmania,
2006 (Fuji)
050062-03
WG 7.5 188–207
4 797
35 ND ND ND ND < 0.02
050062
0 0.06 0.02 < 0.01 ND 0.09
7 < 0.01 ND ND ND < 0.02
14 ND ND ND ND < 0.02
28 ND ND ND ND < 0.02
Ardmona VIC, 2006 (Granny Smith)
050062-01
SC 5 62 7 434
35 ND ND ND ND < 0.02
050062
0 0.04 0.01 ND ND 0.06
7 0.01 ND < 0.01 ND 0.02
14 ND ND ND ND < 0.02
28 ND ND ND ND < 0.02
Ardmona VIC, 2006 (Granny Smith)
050062-01
SC 7.5 93 7 651
35 ND ND ND ND < 0.02
050062

Spinetoram 1715
Application Residue, mg/kg Location,
year (Variety)
Form
g ai/hL
g ai/ha
No
Total/ season,
g ai/ha
PHI, days XDE-
175-J XDE-175-L
ND-J NF-J Total a
Report No.
0 ND ND ND < 0.01 < 0.02 Poziers, QLD
2005-06 (Summer
Del) 050062-02
WG 5 65–229
7 848
35 ND ND ND ND < 0.02
050062
0 ND ND ND < 0.01 < 0.02 Poziers, QLD, 2005-
06 (Summer
Del) 050062-02
WG 7.5 98–344
7 1549
35 ND ND ND < 0.01 < 0.02
050062
0 0.05 < 0.01 ND ND 0.06
7 0.03 ND < 0.01 ND 0.04
14 0.02 ND ND ND 0.03
28 ND ND ND ND < 0.02
Spreyton, Tasmania,
2006 (Fuji)
APPLE 050062-03
WG 5 70–149
7 785
35 ND ND ND ND < 0.02
050062
0 0.11 0.02 0.01 < 0.01 0.15
7 0.03 ND < 0.01 < 0.01 0.04
14 0.01 ND ND ND 0.02
28 0.01 ND ND ND 0.02
Spreyton, Tasmania,
2006 (Fuji)
050062-03
WG 7.5 101–207
7 1017
35 ND ND ND ND < 0.02
050062
NEW ZEALAND TRIALS, 2004/2005 SEASON
0 0.032 < 0.01 - < 0.01 0.042
3 < 0.01 ND - < 0.01 < 0.02
8 ND ND - ND < 0.02
14 ND ND - ND < 0.02
21 ND ND - ND < 0.02
28 ND ND - ND < 0.02
Hort Research,
2005 (Fuji)
040114-02
SC 2.5 52–62
4 233
36 ND ND - ND < 0.02
040114
0 0.050 0.016 - < 0.01 0.076
3 < 0.01 ND - < 0.01 < 0.02
8 < 0.01 ND - < 0.01 < 0.02
14 ND ND - < 0.01 < 0.02
21 ND ND - ND < 0.02
28 ND ND - ND < 0.02
Hort Research,
2005 (Fuji)
040114-02
SC 3.75 69–83
4 307
36 ND ND - ND < 0.02
040114
0 0.068 0.020 - < 0.01 0.098
3 0.012 ND - < 0.01 0.022
8 < 0.01 ND - < 0.01 < 0.02
14 ND ND - < 0.01 < 0.02
21 ND ND - ND < 0.02
28 ND ND - ND < 0.02
Hort Research,
2005 (Fuji)
040114-02
SC 5 122–130
4 498
36 ND ND - ND < 0.02
040114

1716 Spinetoram
Application Residue, mg/kg Location,
year (Variety)
Form
g ai/hL
g ai/ha
No
Total/ season,
g ai/ha
PHI, days XDE-
175-J XDE-175-L
ND-J NF-J Total a
Report No.
0 0.075 0.023 - < 0.01 0.108
3 0.025 < 0.01 - < 0.01 0.035
8 < 0.01 ND - < 0.01 < 0.02
14 < 0.01 ND - < 0.01 < 0.02
21 ND ND - ND < 0.02
28 ND ND - ND < 0.02
Hort Research,
2005 (Fuji)
040114-02
SC 7.5 159-180
4 681
36 ND ND - ND < 0.02
040114
0 0.021 < 0.01 - ND 0.031
3 ND ND - ND < 0.02
8 ND ND - < 0.01 < 0.02
14 ND ND - ND < 0.02
21 ND ND - ND < 0.02
28 ND ND - ND < 0.02
Hort Research,
2005 (Fuji)
040114-02
SC 2.5 62 1 62
36 ND ND - ND < 0.02
040114
0 0.046 0.015 - ND 0.071
3 0.015 ND - < 0.01 0.025
8 < 0.01 ND - ND < 0.02
14 ND ND - ND < 0.02
21 ND ND - ND < 0.02
28 ND ND - ND < 0.02
Hort Research,
2005 (Fuji)
040114-02
SC 3.75 81 1 81
36 ND ND - ND < 0.02
040114
0 0.086 0.027 - ND 0.123
3 0.016 ND - < 0.01 0.026
8 < 0.01 ND - < 0.01 < 0.02
14 ND ND - ND < 0.02
21 ND ND - ND < 0.02
28 ND ND - ND < 0.02
Hort Research,
2005 (Fuji)
040114-02
SC 5 104 1 104
36 ND ND - ND < 0.02
040114
0 0.127 0.041 - ND 0.178
3 0.026 < 0.01 - < 0.01 0.036
8 0.015 ND - < 0.01 0.025
14 ND ND - ND < 0.02
21 ND ND - ND < 0.02
28 ND ND - ND < 0.02
Hort Research,
2005 (Fuji)
040114-02
SC 7.5 147 1 147
36 ND ND - ND < 0.02
040114
NEW ZEALAND TRIALS, 2005/2006 SEASON
0 0.015 ND - ND 0.025
3 0.012 ND - ND 0.022
7 < 0.01 ND - ND < 0.02
14 ND ND - < 0.01 < 0.02
21 ND ND - ND < 0.02
Twyford, Hawkes Bay,
2006 (Braeburn) 050074-01
SC 2.5 38-39
4 154
28 ND ND - ND < 0.02
050074

Spinetoram 1717
Application Residue, mg/kg Location,
year (Variety)
Form
g ai/hL
g ai/ha
No
Total/ season,
g ai/ha
PHI, days XDE-
175-J XDE-175-L
ND-J NF-J Total a
Report No.
36 ND ND - ND < 0.02
42 ND ND - ND < 0.02
SC 5 4 307 0 0.037 < 0.01 - < 0.01 0.047 050074
75–79 3 0.038 < 0.01 - < 0.01 0.048
7 0.016 ND - 0.010 0.026
Twyford, Hawkes Bay,
2006 (Braeburn) 050074-01 14 0.011 ND - < 0.01 0.021
21 < 0.01 ND - < 0.01 < 0.02
28 ND ND - ND < 0.02
36 ND ND - ND < 0.02
42 ND ND - 0.008 0.018
0 0.035 < 0.01 - < 0.01 0.045
3 0.031 < 0.01 - ND 0.041
7 0.013 ND - < 0.01 0.023
14 0.011 ND - < 0.01 0.021
21 ND ND - ND < 0.02
28 ND ND - ND < 0.02
36 ND ND - < 0.01 < 0.02
Twyford, Hawkes Bay,
2006 (Braeburn) 050074-01
SC
3.72 55–58
4 226
42 ND ND - ND < 0.02
050074
0 0.068 0.018 - < 0.01 0.096
3 0.058 0.014 - 0.013 0.085
7 0.028 0.008 - 0.012 0.048
14 0.016 ND - 0.011 0.027
21 < 0.01 ND - < 0.01 < 0.02
28 ND ND - < 0.01 < 0.02
36 ND ND - ND < 0.02
Twyford, Hawkes Bay,
2006 (Braeburn) 050074-01
SC 7.6 112-118
4 461
42 ND ND - ND < 0.02
050074
0 0.020 < 0.01 - ND 0.030
3 < 0.01 ND - < 0.01 < 0.02
7 < 0.01 ND - < 0.01 < 0.02
14 ND ND - ND < 0.02
21 ND ND - ND < 0.02
28 ND ND - ND < 0.02
36 ND ND - ND < 0.02
Havelock North,
Hawkes Bay, 2006
(Royal Gala) 050074-02
SC
2.5 36–38
4 150
42 ND ND - ND < 0.02
050074
0 0.023 < 0.01 - < 0.01 0.033
3 < 0.01 ND - < 0.01 < 0.02
7 ND ND - < 0.01 < 0.02
14 ND ND - < 0.01 < 0.02
21 ND ND - ND < 0.02
Havelock North,
Hawkes Bay, 2006
(Royal Gala) 050074-02
SC
3.7 54–56
4 222
28 ND ND - ND < 0.02
050074

1718 Spinetoram
Application Residue, mg/kg Location,
year (Variety)
Form
g ai/hL
g ai/ha
No
Total/ season,
g ai/ha
PHI, days XDE-
175-J XDE-175-L
ND-J NF-J Total a
Report No.
36 ND ND - ND < 0.02
42 ND ND - ND < 0.02
SC 5 4 300 0 0.045 0.012 - < 0.01 0.067 050074
73–76 3 < 0.01 ND - < 0.01 < 0.02
7 < 0.01 ND - < 0.01 < 0.02
Havelock North,
Hawkes Bay, 2006
(Royal Gala) 050074-02
14 < 0.01 ND - < 0.01 < 0.02
21 ND ND - ND < 0.02
28 ND ND - ND < 0.02
36 ND ND - ND < 0.02
42 ND ND - ND < 0.02
0 0.074 0.019 - 0.012 0.105
3 0.015 ND - < 0.01 0.025
7 < 0.01 ND - < 0.01 < 0.02
14 < 0.01 ND - < 0.01 < 0.02
21 ND ND - < 0.01 < 0.02
28 ND ND - < 0.01 < 0.02
36 ND ND - < 0.01 < 0.02
Havelock North,
Hawkes Bay, 2006
(Royal Gala) 050074-02
SC
7.6 109–115
4 450
42 ND ND - ND < 0.02
050074
0 0.017 ND - < 0.01 0.027
3 ND ND - ND < 0.02
7 ND ND - ND < 0.02
14 ND ND - ND < 0.02
21 ND ND - ND < 0.02
28 ND ND - ND < 0.02
36 ND ND - ND < 0.02
Riwaka, Nelson, 2006 (Royal Gala) 050074-04
SC 2.5 38–40
4 154
42 ND ND - ND < 0.02
050074
0 0.016 ND - < 0.01 0.026
3 < 0.01 ND - ND < 0.02
7 ND ND - ND < 0.02
14 ND ND - ND < 0.02
21 ND ND - ND < 0.02
28 ND ND - ND < 0.02
36 ND ND - ND < 0.02
Riwaka, Nelson, 2006 (Royal Gala) 050074-04
SC 3.72 56–59
4 228
42 ND ND - ND < 0.02
050074
0 0.025 < 0.01 - ND 0.035
3 ND ND - ND < 0.02
7 < 0.01 ND - < 0.01 < 0.02
14 ND ND - ND < 0.02
Riwaka, Nelson, 2006 (Royal Gala) 050074-04
SC 5 76–79
4 308
21 ND ND - ND < 0.02
050074

Spinetoram 1719
Application Residue, mg/kg Location,
year (Variety)
Form
g ai/hL
g ai/ha
No
Total/ season,
g ai/ha
PHI, days XDE-
175-J XDE-175-L
ND-J NF-J Total a
Report No.
28 ND ND - ND < 0.02
36 ND ND - ND < 0.02
42 ND ND - ND < 0.02
0 0.060 0.018 - < 0.01 0.088
3 0.012 ND - < 0.01 0.022
7 < 0.01 ND - < 0.01 < 0.02
14 < 0.01 ND - < 0.01 < 0.02
21 ND ND - ND < 0.02
28 ND ND - ND < 0.02
36 ND ND - ND < 0.02
Riwaka, Nelson, 2006 (Royal Gala) 050074-04
SC 7.6 113–119
4 461
42 ND ND - ND < 0.02
050074
a Total residue = XDE-175-J + XDE-175-L + ND-J + NF-J. b Samples on Days 0, 7, and 28 are from replacement trials in Cottonvale, QLD, referred to as 050062-06 in the study.
Table 25-1 Residues of spinetoram from supervised trials on pear in Australia and New Zealand (for estimation of maximum residue level)
Application Residue, mg/kg Location, year
(Variety)
Form g ai/hL g ai/ha No
Total/ season, g ai/ha
PHI, days XDE-
175-J XDE-175-L
Total a
Report No.
GAP, New Zealand
Pome fruits
WG 2.5 4 200 7
AUSTRALIAN TRIALS, 2005/2006 SEASON
0 0.05 0.01 0.06
7 0.01 ND 0.01
14 ND ND < 0.01
28 ND ND < 0.01
Ardmona VIC, 2006
(Packham) 050062-04
WG 5 74 4 296
35 ND ND < 0.01
050062
0 0.11 0.02 0.13
7 0.03 ND 0.03
14 0.02 ND 0.02
28 < 0.01 ND < 0.01
Ardmona VIC, 2006
(Packham) 050062-04
WG 7.5 111 4 444
35 ND ND < 0.01
050062
0 0.02 ND 0.02
7 ND ND < 0.01
14 ND ND < 0.01
28 ND ND < 0.01
Paracombe, SA, 2006
(Packham) 050062-05
WG 5 97–105 4 404
35 ND ND < 0.01
050062
0 0.03 ND 0.03
7 < 0.01 ND < 0.01
14 < 0.01 ND < 0.01
Paracombe, SA, 2006
(Packham) 050062-05
WG 7.5 145–158
4 606
28 ND ND < 0.01
050062

1720 Spinetoram
Application Residue, mg/kg Location, year
(Variety)
Form
g ai/hL g ai/ha No
Total/ season,
g ai/ha
PHI, days XDE-
175-J XDE-175-L
Total a
Report No.
35 ND ND < 0.01
0 0.04 < 0.01 0.04
7 0.02 ND 0.02
14 0.01 ND 0.01
28 ND ND < 0.01
Ardmona VIC, 2006
(Packham) 050062-04
WG 5 73–74 7 517
35 ND ND < 0.01
050062
0 0.09 0.02 0.11
7 0.02 ND 0.02
14 < 0.01 ND < 0.01
28 ND ND < 0.01
Ardmona VIC, 2006
(Packham) 050062-04
WG 7.5 102–111
7 768
35 ND ND < 0.01
050062
0 0.01 ND 0.01
7 ND ND < 0.01
14 ND ND < 0.01
28 ND ND < 0.01
Paracombe, SA, 2006
(Packham) 050062-05
WG
5 91–105 7 677
35 ND ND < 0.01
050062
0 0.02 ND 0.02
7 ND ND < 0.01
14 ND ND < 0.01
28 ND ND < 0.01
Paracombe, SA, 2006
(Packham) 050062-05
WG
7.5 136–158
7 1014
35 ND ND < 0.01
050062
NEW ZEALAND TRIALS, 2005/2006 SEASON
0 0.011 ND 0.011
3 < 0.01 ND < 0.01
7 ND ND < 0.01
14 ND ND < 0.01
21 ND ND < 0.01
28 ND ND < 0.01
36 ND ND < 0.01
Hastings, Hawkes Bay,
2006 (Packham) 050074-03
SC
2.5 46–47 4 187
42 ND ND < 0.01
050074
0 0.021 < 0.01 0.021
3 ND ND < 0.01
7 ND ND < 0.01
14 ND ND < 0.01
21 ND ND < 0.01
28 ND ND < 0.01
36 ND ND < 0.01
Hastings, Hawkes Bay,
2006 (Packham) 050074-03
SC
3.72 68–70 4 275
42 ND ND < 0.01
050074

Spinetoram 1721
Application Residue, mg/kg Location, year
(Variety)
Form
g ai/hL g ai/ha No
Total/ season,
g ai/ha
PHI, days XDE-
175-J XDE-175-L
Total a
Report No.
0 0.025 < 0.01 0.025
3 0.016 ND 0.016
7 < 0.01 ND < 0.01
14 < 0.01 ND < 0.01
21 ND ND < 0.01
28 ND ND < 0.01
36 ND ND < 0.01
Hastings, Hawkes Bay,
2006 (Packham) 050074-03
SC
5 92–95 4 373
42 ND ND < 0.01
050074
0 0.037 0.011 0.048
3 0.027 ND 0.027
7 ND ND < 0.01
14 < 0.01 ND < 0.01
21 ND ND < 0.01
28 ND ND < 0.01
36 ND ND < 0.01
Hastings, Hawkes Bay,
2006 (Packham) 050074-03
SC
7.6 139–142
4 561
42 ND ND < 0.01
050074
0 0.032 ND 0.032
3 0.026 ND 0.026
7 0.015 ND 0.015
14 0.015 ND 0.015
21 < 0.01 ND < 0.01
28 < 0.01 ND < 0.01
36 ND ND < 0.01
Upper Moutere,
Nelson, 2006 (Taylor’s
Gold) 050074-05
SC 2.5 38–41 4 154
42 ND ND < 0.01
050074
0 0.043 < 0.01 0.043
3 0.053 < 0.01 0.053
7 0.041 ND 0.041
14 0.023 ND 0.023
21 0.018 ND 0.018
28 0.017 ND 0.017
36 0.012 ND 0.012
Upper Moutere,
Nelson, 2006 (Taylor’s
Gold) 050074-05
SC 3.72 56–60 4 233
42 < 0.01 ND < 0.01
050074
SC 5 76–81 4 315 0 0.064 < 0.01 0.064 050074
3 0.062 0.011 0.073
7 0.035 ND 0.035
14 0.041 < 0.01 0.041
Upper Moutere,
Nelson, 2006 (Taylor’s
Gold) 050074-05
21 0.027 ND 0.027
28 0.019 ND 0.019
36 0.016 ND 0.016
42 < 0.01 ND < 0.01

1722 Spinetoram
Application Residue, mg/kg Location, year
(Variety)
Form
g ai/hL g ai/ha No
Total/ season,
g ai/ha
PHI, days XDE-
175-J XDE-175-L
Total a
Report No.
0 0.096 0.017 0.113
3 0.066 0.010 0.076
7 0.056 < 0.01 0.056
14 0.037 ND 0.037
21 0.049 < 0.01 0.049
28 0.027 ND 0.027
36 0.013 ND 0.013
Upper Moutere,
Nelson, 2006 (Taylor’s
Gold) 050074-05
SC 7.6 115–121
4 472
42 0.010 ND 0.010
050074
a Total residue = XDE-175-J + XDE-175-L.
Table 25-2 Residues of spinetoram and metabolites from supervised trials on pear in Australia and New Zealand (for estimation of STMR)
Application Residue, mg/kg Location,
year (Variety)
Form g
ai/hL g
ai/ha No
Total/ season,
g ai/ha
PHI, days
XDE-175-J
XDE-175-L
ND-J a
NF-J Total b
Report No.
GAP, New Zealand
Pome fruit
WG 2.5 4 200 7
AUSTRALIAN TRIALS, 2005/2006 SEASON
0 0.05 0.01 ND ND 0.07
7 0.01 ND ND ND 0.02
14 ND ND ND ND < 0.02
28 ND ND ND ND < 0.02
Ardmona VIC, 2006 (Packham) 050062-04
WG 5 74 4 296
35 ND ND ND ND < 0.02
050062
0 0.11 0.02 < 0.01 ND 0.14
7 0.03 ND < 0.01 ND 0.04
14 0.02 ND < 0.01 ND 0.03
28 < 0.01 ND ND ND < 0.02
Ardmona VIC, 2006 (Packham) 050062-04
WG 7.5 111 4 444
35 ND ND ND ND < 0.02
050062
0 0.02 ND ND ND 0.03
7 ND ND ND ND < 0.02
14 ND ND ND ND < 0.02
28 ND ND ND ND < 0.02
Paracombe, SA, 2006
(Packham) 050062-05
WG 5 97–105
4 404
35 ND ND ND ND < 0.02
050062
0 0.03 ND ND ND 0.04
7 < 0.01 ND ND ND < 0.02
14 < 0.01 ND ND ND < 0.02
28 ND ND ND ND < 0.02
Paracombe, SA, 2006
(Packham) 050062-05
WG 7.5 145–158
4 606
35 ND ND ND ND < 0.02
050062

Spinetoram 1723
Application Residue, mg/kg Location,
year (Variety)
Form
g ai/hL
g ai/ha
No
Total/ season,
g ai/ha
PHI, days
XDE-175-J
XDE-175-L
ND-J a
NF-J Total b
Report No.
0 0.04 < 0.01 ND ND 0.05
7 0.02 ND ND ND 0.03
14 0.01 ND ND ND 0.02
28 ND ND ND ND < 0.02
Ardmona VIC, 2006 (Packham) 050062-04
WG 5 73–74
7 517
35 ND ND ND ND < 0.02
050062
0 0.09 0.02 ND < 0.01 0.12
7 0.02 ND ND < 0.01 0.03
14 < 0.01 ND ND ND < 0.02
28 ND ND ND ND < 0.02
Ardmona VIC, 2006 (Packham) 050062-04
WG 7.5 102–111
7 768
35 ND ND ND ND < 0.02
050062
0 0.01 ND ND ND 0.02
7 ND ND ND ND < 0.02
14 ND ND ND ND < 0.02
28 ND ND ND ND < 0.02
Paracombe, SA, 2006
(Packham) 050062-05
WG
5 91–105
7 677
35 ND ND ND ND < 0.02
050062
0 0.02 ND ND ND 0.03
7 ND ND ND ND < 0.02
14 ND ND ND ND < 0.02
28 ND ND ND ND < 0.02
Paracombe, SA, 2006
(Packham) 050062-05
WG
7.5 136–158
7 1014
35 ND ND ND ND < 0.02
050062
NEW ZEALAND TRIALS, 2005/2006 SEASON
0 0.011 ND - ND 0.021
3 < 0.01 ND - ND < 0.02
7 ND ND - ND < 0.02
14 ND ND - ND < 0.02
21 ND ND - ND < 0.02
28 ND ND - ND < 0.02
36 ND ND - ND < 0.02
Hastings, Hawkes Bay,
2006 (Packham) 050074-03
SC
2.5 46–47
4 187
42 ND ND - ND < 0.02
050074
0 0.021 < 0.01 - ND 0.031
3 ND ND - ND < 0.02
7 ND ND - ND < 0.02
14 ND ND - ND < 0.02
21 ND ND - ND < 0.02
28 ND ND - ND < 0.02
36 ND ND - ND < 0.02
Hastings, Hawkes Bay,
2006 (Packham) 050074-03
SC
3.72 68–70
4 275
42 ND ND - ND < 0.02
050074

1724 Spinetoram
Application Residue, mg/kg Location,
year (Variety)
Form
g ai/hL
g ai/ha
No
Total/ season,
g ai/ha
PHI, days
XDE-175-J
XDE-175-L
ND-J a
NF-J Total b
Report No.
0 0.025 < 0.01 - ND 0.035
3 0.016 ND - ND 0.026
7 < 0.01 ND - ND < 0.02
14 < 0.01 ND - < 0.01 < 0.02
21 ND ND - ND < 0.02
28 ND ND - ND < 0.02
36 ND ND - ND < 0.02
Hastings, Hawkes Bay,
2006 (Packham) 050074-03
SC
5 92–95
4 373
42 ND ND - ND < 0.02
050074
0 0.037 0.011 - ND 0.058
3 0.027 ND - < 0.01 0.037
7 ND ND - ND < 0.02
14 < 0.01 ND - ND < 0.02
21 ND ND - ND < 0.02
28 ND ND - ND < 0.02
36 ND ND - ND < 0.02
Hastings, Hawkes Bay,
2006 (Packham) 050074-03
SC
7.6 139–142
4 561
42 ND ND - ND < 0.02
050074
0 0.032 ND - ND 0.042
3 0.026 ND - ND 0.036
7 0.015 ND - ND 0.025
14 0.015 ND - ND 0.025
21 < 0.01 ND - ND < 0.02
28 < 0.01 ND - ND < 0.02
36 ND ND - ND < 0.02
Upper Moutere,
Nelson, 2006 (Taylor’s
Gold) 050074-05
SC 2.5 38–41
4 154
42 ND ND - ND < 0.02
050074
0 0.043 < 0.01 - ND 0.053
3 0.053 < 0.01 - ND 0.063
7 0.041 ND - ND 0.051
14 0.023 ND - ND 0.033
21 0.018 ND - ND 0.028
28 0.017 ND - ND 0.027
36 0.012 ND - ND 0.022
Upper Moutere,
Nelson, 2006 (Taylor’s
Gold) 050074-05
SC 3.72 56–60
4 233
42 < 0.01 ND - ND < 0.02
050074
0 0.064 < 0.01 - ND 0.074
3 0.062 0.011 - ND 0.083
7 0.035 ND - ND 0.045
14 0.041 < 0.01 - ND 0.051
21 0.027 ND - ND 0.037
28 0.019 ND - ND 0.029
36 0.016 ND - ND 0.026
Upper Moutere,
Nelson, 2006 (Taylor’s
Gold) 050074-05
SC 5 76–81
4 315
42 < 0.01 ND - ND < 0.02
050074

Spinetoram 1725
Application Residue, mg/kg Location,
year (Variety)
Form
g ai/hL
g ai/ha
No
Total/ season,
g ai/ha
PHI, days
XDE-175-J
XDE-175-L
ND-J a
NF-J Total b
Report No.
0 0.096 0.017 - ND 0.123
3 0.066 0.010 - ND 0.086
7 0.056 < 0.01 - ND 0.066
14 0.037 ND - ND 0.047
21 0.049 < 0.01 - ND 0.059
28 0.027 ND - ND 0.037
36 0.013 ND - ND 0.023
Upper Moutere,
Nelson, 2006 (Taylor’s
Gold) 050074-05
SC 7.6 115–121
4 472
42 0.010 ND - ND 0.020
050074
a Not determined. b Total residue = XDE-175-J + XDE-175-L + ND-J + NF-J
Stone Fruits
Supervised trials on cherry, peach, apricot and nectarine in Australia
Trials on cherries (8), peaches (7), nectarines (4) and apricots (4) were conducted during the 2005 to 2006 season in Australia (Cowles, 2006; Report 050063).
Trials were conducted in six sites (two sites for cherries, two for peaches, and one each for apricots and nectarines), each site consisting of one untreated and four treated plots. Each plot, which had 1 to 4 trees ranging from flowering to 7 cm diameter fruits, was treated with 4 or 7 applications of a WG formulation of spinetoram containing 250 g ai/kg. Two treatment regimes were used. The first treatment schedule consisted of three applications at 5-day intervals over flowering followed by four applications at 14-day intervals commencing 63 days before harvest so that the last application was 21 days before harvest. The second treatment schedule consisted of four applications at 14-day intervals commencing 63 days before harvest so that the last application was 21 days before harvest. Treatments were made as foliar spray applications at rates of 5 g ai/hL or 7.5 g ai/hL of spinetoram.
Approximately 2 kg each of whole peaches, apricots, and nectarines and 0.5 kg of cherries were collected 0, 7, 14 or 15, 21 or 22, 28 and 35 days after the last application. Samples were placed in plastic bags, labelled, and frozen at -20°C until analysed in June 2006 to August 2006.
Samples were analysed for residues of spinetoram and the metabolites using the method GRM 05.03. The LOQ for the method was 0.01 mg/kg. The LOD was 0.005 mg/kg. Recoveries were within the acceptable range of 70–120% and relative standard deviation < 20%, with the exception of apricots. The mean recovery of XDE-175-J from apricots fortified at the LOQ (66%) was lower than 70%.
Supervised trials on cherries, peach and apricot in New Zealand
Trials on cherries (12), peach (8), and apricot (8) were conducted during the 2005 to 2006 season in New Zealand (Cowles, 2006; Report 050075).
Trials were conducted in seven sites (three sites for cherries, two for peaches, and two for apricots), each site consisting of one untreated and four treated plots. Each peach and apricot site had 4 trees while the cherry plots had 2 trees each. Four applications of a SC formulation of spinetoram containing 120 g ai/L were made to each plot using high volume spray applications at rates of 2.5 g ai/hL, 3.7 g ai/hL, 5 g ai/hL, or 7.6 g ai/ha. Treatments were made at intervals of 13–15 days to the stone fruit plots containing fruits ranging from 1.1 cm to 5 cm in diameter at the first application to 1.2 cm to 6.5 cm in diameter at the fourth application.

1726 Spinetoram
Approximately 2 kg each of whole peaches and apricots, and 1 kg of cherries were collected by hand 0, 1, 3, 7, 14, 21, and 28 days after the last application. Samples were placed in plastic bags, labelled, and frozen at -20 °C until analysed.
Spinetoram and its metabolites were analysed using method GRM 05.03 with an LOQ of 0.01 mg/kg. The LOD was determined to be 0.005 mg/kg.
Table 26-1 Residues of spinetoram from supervised trials on cherry in Australia and New Zealand (for estimation of maximum residue level.
Application Residue, mg/kg Location, year
(Variety)
Form g ai/hL g ai/ha No
Total/ season,
g ai/ha
PHI, days XDE-
175-J XDE-175-L
Total a
Report No.
AUSTRALIAN TRIALS
0 0.05 0.01 0.06
7 < 0.01 ND < 0.01
14 < 0.01 ND < 0.01
21 < 0.01 ND < 0.01
Sheffield Rd, Spreyton TAS
2005 (Van)
050063-01
WG 5 54–92 4 271
28 < 0.01 ND < 0.01
050063
0 0.09 0.03 0.12
7 0.02 ND 0.02
14 ND ND < 0.01
21 < 0.01 ND < 0.01
Sheffield Rd, Spreyton TAS
2005 (Van)
050063-01
WG 7.5 93-125 4 432
28 < 0.01 ND < 0.01
050063
0 0.14 0.04 0.18
7 0.02 ND 0.02
14 0.01 ND 0.01
21 ND ND < 0.01
Sheffield Rd, Spreyton TAS
2005 (Van)
050063-01
WG 5 54–92 7 471
28 < 0.01 ND < 0.01
050063
0 0.13 0.04 0.17
7 0.02 ND 0.02
14 < 0.01 ND < 0.01
21 < 0.01 ND < 0.01
Sheffield Rd, Spreyton TAS
2005 (Van)
050063-01
WG 7.5 93–125 7 758
28 < 0.01 ND < 0.01
050063
7 < 0.01 ND < 0.01
14 ND ND < 0.01
21 ND ND < 0.01
28 ND ND < 0.01
Wilgro Orchards,
Tumut Road, Batlow, NSW,
2005 (Stella)
050063-02
WG 5 70–90 4 330
35 ND ND < 0.01
050063
7 0.01 ND 0.01
14 < 0.01 ND < 0.01
21 ND ND < 0.01
28 ND ND < 0.01
Wilgro Orchards,
Tumut Road, Batlow, NSW,
2005 (Stella)
050063-02
WG 7.5 105–135
4 495
35 ND ND < 0.01
050063
7 < 0.01 ND < 0.01
14 ND ND < 0.01
21 ND ND < 0.01
28 ND ND < 0.01
Wilgro Orchards,
Tumut Road, Batlow, NSW
2005 (Stella)
050063-02
WG 5 60–90 7 560
35 ND ND < 0.01
050063

Spinetoram 1727
Application Residue, mg/kg Location, year
(Variety)
Form
g ai/hL g ai/ha No
Total/ season,
g ai/ha
PHI, days XDE-
175-J XDE-175-L
Total a
Report No.
7 < 0.01 ND < 0.01
14 < 0.01 ND < 0.01
21 ND ND < 0.01
28 ND ND < 0.01
Wilgro Orchards,
Tumut Road, Batlow, NSW,
2005 (Stella)
050063-02
WG 7.5 90–135 7 694
35 ND ND < 0.01
050063
NEW ZEALAND TRIALS
0 0.019 < 0.01 0.019
1 0.018 ND 0.018
3 < 0.01 ND < 0.01
7 < 0.01 ND < 0.01
Tukituki, Hawke's Bay,
2005 (Stella)
050075-01
SC 2.5 38–40 4 157
14 ND ND < 0.01
050075
0 0.041 0.011 0.052
1 0.025 < 0.01 0.025
3 0.018 ND 0.018
7 < 0.01 ND < 0.01
14 ND ND < 0.01
Tukituki, Hawke's Bay,
2005 (Stella)
050075-01
SC 3.7 57–58 4 231
21 ND ND < 0.01
050075
0 0.069 0.019 0.088
1 0.048 0.013 0.061
3 0.036 < 0.01 0.036
7 0.018 ND 0.018
14 < 0.01 ND < 0.01
Tukituki, Hawke's Bay,
2005 (Stella)
050075-01
SC 5 78–79 4 313
21 < 0.01 ND < 0.01
050075
0 0.136 0.037 0.173
1 0.092 0.024 0.116
3 0.029 < 0.01 0.029
7 0.045 < 0.01 0.045
14 0.028 ND 0.028
Tukituki, Hawke's Bay,
2005 (Stella)
050075-01
SC 7.6 116–119
4 469
21 < 0.01 ND < 0.01
050075
0 0.030 < 0.01 0.030
1 0.028 < 0.01 0.028
3 0.019 ND 0.019
7 0.019 ND 0.019
14 ND ND < 0.01
21 ND ND < 0.01
Alexandra, Central Otago,
2006 (Lapins)
050075-04
SC 2.5 35–41 4 156
28 ND ND < 0.01
050075
0 0.060 0.015 0.075
1 0.032 < 0.01 0.032
3 0.019 < 0.01 0.019
7 0.019 ND 0.019
14 < 0.01 ND < 0.01
21 < 0.01 ND < 0.01
Alexandra, Central Otago,
2006 (Lapins)
050075-04
SC 3.7 52–61 4 231
28 < 0.01 ND < 0.01
050075

1728 Spinetoram
Application Residue, mg/kg Location, year
(Variety)
Form
g ai/hL g ai/ha No
Total/ season,
g ai/ha
PHI, days XDE-
175-J XDE-175-L
Total a
Report No.
0 0.102 0.027 0.129
1 0.064 0.016 0.080
3 0.045 0.012 0.057
7 0.054 0.013 0.067
14 0.015 ND 0.015
21 0.013 ND 0.013
Alexandra, Central Otago,
2006 (Lapins)
050075-04
SC 5 70–82 4 311
28 < 0.01 ND < 0.01
050075
0 0.139 0.032 0.171
1 0.100 0.026 0.126
3 0.044 0.011 0.055
7 0.059 0.013 0.072
14 0.021 < 0.01 0.021
21 0.014 ND 0.014
Alexandra, Central Otago,
2006 (Lapins)
050075-04
SC 7.6 105–123
4 467
28 < 0.01 ND < 0.01
050075
0 0.040 0.012 0.052
1 0.039 0.011 0.050
3 0.025 < 0.01 0.025
7 0.024 < 0.01 0.024
14 0.009 ND 0.009
21 0.010 ND 0.01
Earnscleugh, Central Otago
2005 (Stella)
050075-05
SC 2.5 41–49 4 187
28 ND ND < 0.01
050075
0 0.065 0.021 0.086
1 0.055 0.019 0.074
3 0.029 < 0.01 0.029
7 0.023 < 0.01 0.023
14 < 0.01 ND < 0.01
21 < 0.01 ND < 0.01
Earnscleugh, Central Otago
2005 (Stella)
050075-05
SC 3.7 60–73 4 275
28 < 0.01 ND < 0.01
050075
0 0.075 0.023 0.098
1 0.089 0.028 0.117
3 0.047 0.011 0.058
7 0.025 < 0.01 0.025
14 0.024 < 0.01 0.024
21 < 0.01 ND < 0.01
Earnscleugh, Central Otago
2005 (Stella)
050075-05
SC 5 81–99 4 374
28 ND ND < 0.01
050075
0 0.103 0.035 0.138
1 0.053 0.017 0.070
3 0.059 0.017 0.076
7 0.052 0.015 0.067
14 < 0.01 < 0.01 < 0.01
21 0.013 ND 0.013
Earnscleugh, Central Otago
2005 (Stella)
050075-05
SC 7.6 122–148
4 560
28 0.010 ND 0.010
050075
a Total residue = XDE-175-J + XDE-175-L.

Spinetoram 1729
Table 26 Residues of spinetoram and metabolites from supervised trials on cherry in Australia and New Zealand (for estimation of STMR)
Application Residue, mg/kg Location,
year (Variety)
Form g
ai/hL g
ai/ha No
Total/ season,
g ai/ha
PHI, days
XDE-175-J
XDE-175-L
ND-J NF-J Total a
Report No.
AUSTRALIAN TRIALS
0 0.05 0.01 ND < 0.01 0.07
7 < 0.01 ND ND < 0.01 < 0.02
14 < 0.01 ND ND < 0.01 < 0.02
21 < 0.01 ND ND < 0.01 < 0.02
Sheffield Rd, Spreyton TAS
2005 (Van)
050063-01
WG 5 54–92
4 271
28 < 0.01 ND ND 0.010 0.020
050063
0 0.09 0.03 ND 0.02 0.14
7 0.02 ND < 0.01 0.03 0.05
14 ND ND ND < 0.01 < 0.02
21 < 0.01 ND ND < 0.01 < 0.02
Sheffield Rd, Spreyton TAS
2005 (Van)
050063-01
WG 7.5 93-125
4 432
28 < 0.01 ND ND < 0.01 < 0.02
050063
0 0.14 0.04 < 0.01 < 0.01 0.19
7 0.02 ND ND 0.01 0.03
14 0.01 ND ND 0.01 0.02
21 ND ND ND ND < 0.02
Sheffield Rd, Spreyton TAS
2005 (Van)
050063-01
WG 5 54–92
7 471
28 < 0.01 ND ND ND < 0.02
050063
0 0.13 0.04 < 0.01 0.02 0.19
7 0.02 ND ND 0.02 0.04
14 < 0.01 ND ND < 0.01 < 0.02
21 < 0.01 ND ND < 0.01 < 0.02
Sheffield Rd, Spreyton TAS
2005 (Van)
050063-01
WG 7.5 93–125
7 758
28 < 0.01 ND ND < 0.01 < 0.02
050063
7 < 0.01 ND ND ND < 0.02
14 ND ND ND ND < 0.02
21 ND ND ND ND < 0.02
28 ND ND ND ND < 0.02
Wilgro Orchards,
Tumut Road, Batlow, NSW,
2005 (Stella)
050063-02
WG 5 70–90
4 330
35 ND ND ND ND < 0.02
050063
7 0.01 ND ND ND 0.02
14 < 0.01 ND ND ND < 0.02
21 ND ND ND ND < 0.02
28 ND ND ND ND < 0.02
Wilgro Orchards,
Tumut Road, Batlow, NSW,
2005 (Stella)
050063-02
WG 7.5 105–135
4 495
35 ND ND ND ND < 0.02
050063
7 < 0.01 ND ND ND < 0.02
14 ND ND ND ND < 0.02
21 ND ND ND ND < 0.02
28 ND ND ND ND < 0.02
Wilgro Orchards,
Tumut Road, Batlow, NSW
2005 (Stella)
050063-02
WG 5 60–90
7 560
35 ND ND ND ND < 0.02
050063
7 < 0.01 ND < 0.01 0.01 0.02
14 < 0.01 ND ND ND < 0.02
21 ND ND ND ND < 0.02
28 ND ND ND ND < 0.02
Wilgro Orchards,
Tumut Road, Batlow, NSW,
2005 (Stella)
050063-02
WG 7.5 90–135
7 694
35 ND ND ND ND < 0.02
050063

1730 Spinetoram
Application Residue, mg/kg Location,
year (Variety)
Form
g ai/hL
g ai/ha
No
Total/ season,
g ai/ha
PHI, days
XDE-175-J
XDE-175-L
ND-J NF-J Total a
Report No.
NEW ZEALAND TRIALS
0 0.019 < 0.01 - < 0.01 0.029
1 0.018 ND - 0.012 0.030
3 < 0.01 ND - 0.013 0.023
7 < 0.01 ND - < 0.01 < 0.02
Tukituki, Hawke's Bay,
2005 (Stella)
050075-01
SC 2.5 38–40
4 157
14 ND ND - < 0.01 < 0.02
050075
0 0.041 0.011 - 0.013 0.065
1 0.025 < 0.01 - 0.014 0.039
3 0.018 ND - 0.018 0.036
7 < 0.01 ND - 0.013 0.023
14 ND ND - < 0.01 < 0.02
Tukituki, Hawke's Bay,
2005 (Stella)
050075-01
SC 3.7 57–58
4 231
21 ND ND - ND < 0.02
050075
0 0.069 0.019 - 0.024 0.112
1 0.048 0.013 - 0.019 0.080
3 0.036 < 0.01 - 0.026 0.062
7 0.018 ND - 0.028 0.046
14 < 0.01 ND - 0.019 0.029
Tukituki, Hawke's Bay,
2005 (Stella)
050075-01
SC 5 78–79
4 313
21 < 0.01 ND - < 0.01 < 0.02
050075
0 0.136 0.037 - 0.027 0.200
1 0.092 0.024 - 0.020 0.136
3 0.029 < 0.01 - 0.021 0.050
7 0.045 < 0.01 - 0.027 0.072
14 0.028 ND - 0.032 0.060
Tukituki, Hawke's Bay,
2005 (Stella)
050075-01
SC 7.6 116–119
4 469
21 < 0.01 ND - 0.010 0.020
050075
0 0.030 < 0.01 - 0.015 0.045
1 0.028 < 0.01 - 0.018 0.046
3 0.019 ND - 0.025 0.044
7 0.019 ND - 0.022 0.041
14 ND ND - < 0.01 < 0.02
21 ND ND - < 0.01 < 0.02
Alexandra, Central
Otago, 2006 (Lapins)
050075-04
SC 2.5 35–41
4 156
28 ND ND - < 0.01 < 0.02
050075
0 0.060 0.015 - 0.024 0.099
1 0.032 < 0.01 - 0.019 0.051
3 0.019 < 0.01 - 0.020 0.039
7 0.019 ND - 0.018 0.037
14 < 0.01 ND - 0.012 0.022
21 < 0.01 ND - < 0.01 < 0.02
Alexandra, Central
Otago, 2006 (Lapins)
050075-04
SC 3.7 52–61
4 231
28 < 0.01 ND - < 0.01 < 0.02
050075
SC 5 4 311 0 0.102 0.027 - 0.029 0.158 050075
70–82 1 0.064 0.016 - 0.036 0.116
3 0.045 0.012 - 0.032 0.089
Alexandra, Central
Otago, 2006 (Lapins)
050075-04 7 0.054 0.013 - 0.037 0.104
14 0.015 ND - 0.016 0.031

Spinetoram 1731
Application Residue, mg/kg Location,
year (Variety)
Form
g ai/hL
g ai/ha
No
Total/ season,
g ai/ha
PHI, days
XDE-175-J
XDE-175-L
ND-J NF-J Total a
Report No.
21 0.013 ND - 0.017 0.030
28 < 0.01 ND - 0.013 0.023
0 0.139 0.032 - 0.033 0.204
1 0.100 0.026 - 0.027 0.153
3 0.044 0.011 - 0.017 0.072
7 0.059 0.013 - 0.037 0.109
14 0.021 < 0.01 - 0.026 0.047
21 0.014 ND - 0.018 0.032
Alexandra, Central
Otago, 2006 (Lapins)
050075-04
SC 7.6 105–123
4 467
28 < 0.01 ND - 0.016 0.026
050075
0 0.040 0.012 - 0.018 0.070
1 0.039 0.011 - 0.020 0.070
3 0.025 < 0.01 - 0.016 0.041
7 0.024 < 0.01 - 0.014 0.038
14 0.009 ND - 0.015 0.024
21 0.010 ND - 0.016 0.026
Earnscleugh, Central Otago
2005 (Stella)
050075-05
SC 2.5 41–49
4 187
28 ND ND - ND < 0.02
050075
0 0.065 0.021 - 0.024 0.110
1 0.055 0.019 - 0.026 0.100
3 0.029 < 0.01 - 0.019 0.048
7 0.023 < 0.01 - 0.034 0.057
14 < 0.01 ND - 0.016 0.026
21 < 0.01 ND - 0.019 0.029
Earnscleugh, Central Otago
2005 (Stella)
050075-05
SC 3.7 60–73
4 275
28 < 0.01 ND - < 0.01 < 0.02
050075
0 0.075 0.023 - 0.022 0.120
1 0.089 0.028 - 0.041 0.158
3 0.047 0.011 - 0.020 0.078
7 0.025 < 0.01 - 0.023 0.048
14 0.024 < 0.01 - 0.023 0.047
21 < 0.01 ND - 0.015 0.025
Earnscleugh, Central Otago
2005 (Stella)
050075-05
SC 5 81–99
4 374
28 ND ND - ND < 0.02
050075
0 0.103 0.035 - 0.027 0.165
1 0.053 0.017 - 0.024 0.094
3 0.059 0.017 - 0.027 0.103
7 0.052 0.015 - 0.024 0.091
14 < 0.01 < 0.01 - 0.015 0.025
21 0.013 ND - 0.024 0.037
Earnscleugh, Central Otago
2005 (Stella)
050075-05
SC 7.6 122–148
4 560
28 0.010 ND - 0.015 0.025
050075
a Total residue = XDE-175-J + XDE-175-L + ND-J + NF-J.
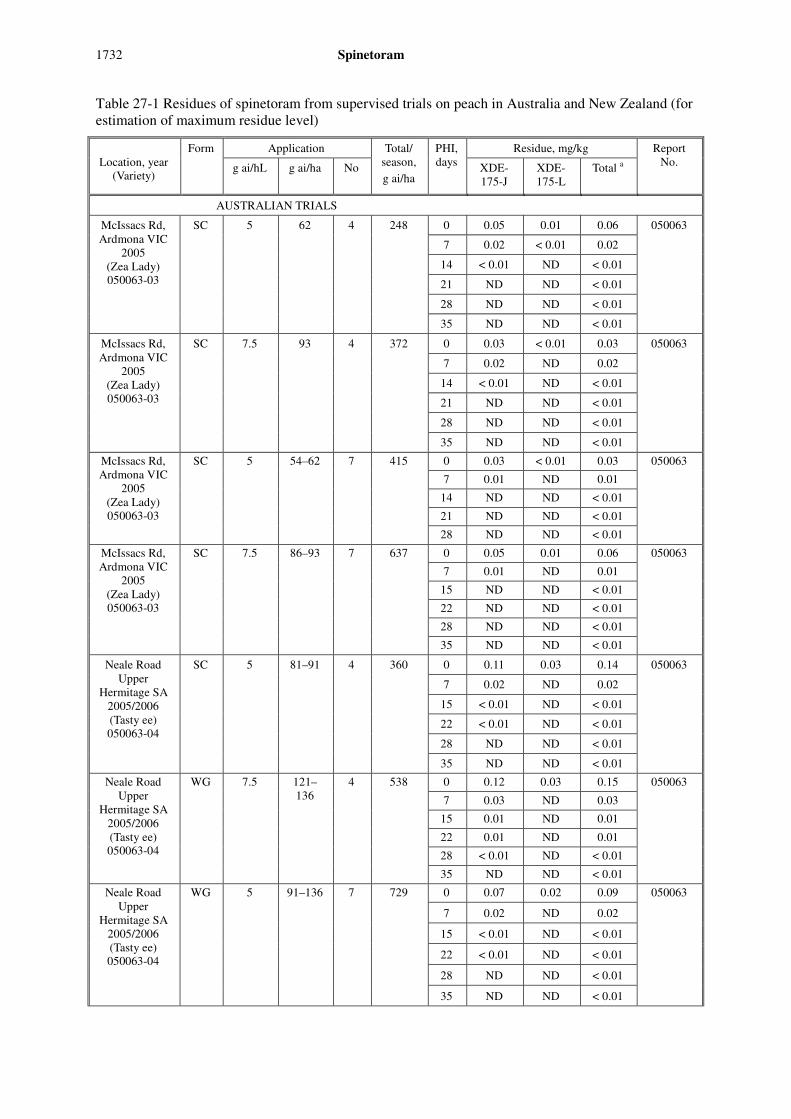
1732 Spinetoram
Table 27-1 Residues of spinetoram from supervised trials on peach in Australia and New Zealand (for estimation of maximum residue level)
Application Residue, mg/kg Location, year
(Variety)
Form
g ai/hL g ai/ha No
Total/ season,
g ai/ha
PHI, days XDE-
175-J XDE-175-L
Total a
Report No.
AUSTRALIAN TRIALS
0 0.05 0.01 0.06
7 0.02 < 0.01 0.02
14 < 0.01 ND < 0.01
21 ND ND < 0.01
28 ND ND < 0.01
McIssacs Rd, Ardmona VIC
2005 (Zea Lady) 050063-03
SC 5 62 4 248
35 ND ND < 0.01
050063
0 0.03 < 0.01 0.03
7 0.02 ND 0.02
14 < 0.01 ND < 0.01
21 ND ND < 0.01
28 ND ND < 0.01
McIssacs Rd, Ardmona VIC
2005 (Zea Lady) 050063-03
SC 7.5 93 4 372
35 ND ND < 0.01
050063
0 0.03 < 0.01 0.03
7 0.01 ND 0.01
14 ND ND < 0.01
21 ND ND < 0.01
McIssacs Rd, Ardmona VIC
2005 (Zea Lady) 050063-03
SC 5 54–62 7 415
28 ND ND < 0.01
050063
0 0.05 0.01 0.06
7 0.01 ND 0.01
15 ND ND < 0.01
22 ND ND < 0.01
28 ND ND < 0.01
McIssacs Rd, Ardmona VIC
2005 (Zea Lady) 050063-03
SC 7.5 86–93 7 637
35 ND ND < 0.01
050063
0 0.11 0.03 0.14
7 0.02 ND 0.02
15 < 0.01 ND < 0.01
22 < 0.01 ND < 0.01
28 ND ND < 0.01
Neale Road Upper
Hermitage SA 2005/2006 (Tasty ee) 050063-04
SC 5 81–91 4 360
35 ND ND < 0.01
050063
0 0.12 0.03 0.15
7 0.03 ND 0.03
15 0.01 ND 0.01
22 0.01 ND 0.01
28 < 0.01 ND < 0.01
Neale Road Upper
Hermitage SA 2005/2006 (Tasty ee) 050063-04
WG 7.5 121–136
4 538
35 ND ND < 0.01
050063
0 0.07 0.02 0.09
7 0.02 ND 0.02
15 < 0.01 ND < 0.01
22 < 0.01 ND < 0.01
28 ND ND < 0.01
Neale Road Upper
Hermitage SA 2005/2006 (Tasty ee) 050063-04
WG 5 91–136 7 729
35 ND ND < 0.01
050063

Spinetoram 1733
Application Residue, mg/kg Location, year
(Variety)
Form
g ai/hL g ai/ha No
Total/ season,
g ai/ha
PHI, days XDE-
175-J XDE-175-L
Total a
Report No.
NEW ZEALAND TRIALS
0 0.020 ND 0.020
1 0.010 ND 0.010
3 0.011 ND 0.011
7 < 0.01 ND < 0.01
14 ND ND < 0.01
21 ND ND < 0.01
Havelock North, Hawke's
Bay, 2006 (Golden Queen)
050075-02
SC 2.5 46 4 184
28 ND ND < 0.01
050075
0 0.038 < 0.01 0.038
1 0.018 ND 0.018
3 0.020 ND 0.020
7 < 0.01 ND < 0.01
14 < 0.01 ND < 0.01
21 < 0.01 ND < 0.01
Havelock North, Hawke's
Bay, 2006 (Golden Queen)
050075-02
SC 3.7 67–68 4 269
28 ND ND < 0.01
050075
0 0.049 0.012 0.061
1 0.032 < 0.01 0.032
3 0.026 < 0.01 0.026
7 0.024 < 0.01 0.024
14 < 0.01 ND < 0.01
21 ND ND < 0.01
Havelock North, Hawke's
Bay, 2006 (Golden Queen)
050075-02
SC 5 91–92 4 365
28 ND ND < 0.01
050075
0 0.058 0.016 0.074
1 0.041 < 0.01 0.041
3 0.036 < 0.01 0.036
7 0.039 < 0.01 0.039
14 0.023 ND 0.023
21 0.012 ND 0.012
Havelock North, Hawke's
Bay, 2006 (Golden Queen)
050075-02
SC 7.6 137–138
4 549
28 0.014 ND 0.014
050075
0 0.060 0.014 0.074
1 0.094 0.024 0.118
3 0.032 < 0.01 0.032
7 0.013 ND 0.013
14 < 0.01 ND < 0.01
21 0.019 ND 0.019
Earnscleugh, Central Otago
2006 (Southern Ice)
050075-06
SC 2.5 49- 52
4 199
28 0.027 ND 0.027
050075
0 0.078 0.019 0.097
1 0.053 0.012 0.065
3 0.052 0.010 0.062
7 0.030 < 0.01 0.030
14 < 0.01 ND < 0.01
21 0.014 ND 0.014
Earnscleugh, Central Otago
2006 (Southern Ice)
050075-06
SC 3.7 72–76 4 293
28 < 0.01 ND < 0.01
050075
Earnscleugh, SC 5 98–103 4 397 0 0.154 0.032 0.186 050075

1734 Spinetoram
Application Residue, mg/kg Location, year
(Variety)
Form
g ai/hL g ai/ha No
Total/ season,
g ai/ha
PHI, days XDE-
175-J XDE-175-L
Total a
Report No.
1 0.053 0.012 0.065
3 0.071 0.013 0.084
7 0.039 < 0.01 0.039
14 0.015 ND 0.015
21 0.014 ND 0.014
Central Otago 2006
(Southern Ice) 050075-06
28 0.020 ND 0.020
0 0.106 0.027 0.133
1 0.111 0.029 0.140
3 0.088 0.014 0.102
7 0.027 < 0.01 0.027
14 0.019 ND 0.019
21 0.020 ND 0.020
Earnscleugh, Central Otago
2006 (Southern Ice)
050075-06
SC 7.6 147- 155
4 596
28 0.034 ND 0.034
050075
a Total residue = XDE-175-J + XDE-175-L.
Table 27-2 Residues of spinetoram and metabolites from supervised trials on peach in Australia and New Zealand (for estimation of STMR)
Application Residue, mg/kg Location,
year (Variety)
Form
g ai/hL
g ai/ha
No
Total/ season,
g ai/ha
PHI, days XDE-
175-J XDE-175-L
ND-J NF-J Total a
Report No.
AUSTRALIAN TRIALS
0 0.05 0.01 ND ND 0.07
7 0.02 < 0.01 ND ND 0.03
14 < 0.01 ND ND ND < 0.02
21 ND ND ND ND < 0.02
28 ND ND ND ND < 0.02
McIssacs Rd, Ardmona VIC 2005 (Zea Lady) 050063-03
SC 5 62 4 248
35 ND ND ND ND < 0.02
050063
0 0.03 < 0.01 ND ND 0.04
7 0.02 ND ND ND 0.03
14 < 0.01 ND ND ND < 0.02
21 ND ND ND ND < 0.02
28 ND ND ND ND < 0.02
McIssacs Rd, Ardmona VIC 2005 (Zea Lady) 050063-03
SC 7.5 93 4 372
35 ND ND ND ND < 0.02
050063
0 0.03 < 0.01 ND ND 0.04
7 0.01 ND ND ND 0.02
14 ND ND ND ND < 0.02
21 ND ND ND ND < 0.02
McIssacs Rd, Ardmona VIC 2005 (Zea Lady) 050063-03
SC 5 54–62
7 415
28 ND ND ND ND < 0.02
050063

Spinetoram 1735
Application Residue, mg/kg Location,
year (Variety)
Form
g ai/hL
g ai/ha
No
Total/ season,
g ai/ha
PHI, days XDE-
175-J XDE-175-L
ND-J NF-J Total a
Report No.
0 0.05 0.01 < 0.01 < 0.01 0.07
7 0.01 ND ND ND 0.02
15 ND ND ND ND < 0.02
22 ND ND ND ND < 0.02
28 ND ND ND ND < 0.02
McIssacs Rd, Ardmona VIC 2005 (Zea Lady) 050063-03
SC 7.5 86–93
7 637
35 ND ND ND ND < 0.02
050063
0 0.11 0.03 < 0.01 < 0.01 0.15
7 0.02 ND ND < 0.01 0.03
15 < 0.01 ND ND ND < 0.02
22 < 0.01 ND ND ND < 0.02
28 ND ND ND ND < 0.02
Neale Road Upper
Hermitage SA
2005/2006 (Tasty ee) 050063-04
SC 5 81–91
4 360
35 ND ND ND ND < 0.02
050063
0 0.12 0.03 0.01 0.02 0.18
7 0.03 ND ND 0.01 0.04
15 0.01 ND ND < 0.01 0.02
22 0.01 ND ND < 0.01 0.02
28 < 0.01 ND ND < 0.01 < 0.02
Neale Road Upper
Hermitage SA
2005/2006 (Tasty ee) 050063-04
WG 7.5 121–136
4 538
35 ND ND ND ND < 0.02
050063
0 0.07 0.02 < 0.01 < 0.01 0.010
7 0.02 ND ND 0.01 0.03
15 < 0.01 ND ND ND < 0.02
22 < 0.01 ND ND ND < 0.02
28 ND ND ND ND < 0.02
Neale Road Upper
Hermitage SA
2005/2006 (Tasty ee) 050063-04
WG 5 91–136
7 729
35 ND ND ND ND < 0.02
050063
NEW ZEALAND TRIALS
0 0.020 ND - 0.011 0.031
1 0.010 ND - < 0.01 0.020
3 0.011 ND - 0.011 0.022
7 < 0.01 ND - < 0.01 < 0.02
14 ND ND - ND < 0.02
21 ND ND - ND < 0.02
Havelock North,
Hawke's Bay, 2006
(Golden Queen)
050075-02
SC 2.5 46 4 184
28 ND ND - ND < 0.02
050075
0 0.038 < 0.01 - 0.013 0.051
1 0.018 ND - 0.011 0.029
3 0.020 ND - 0.016 0.036
7 < 0.01 ND - < 0.01 < 0.02
14 < 0.01 ND - < 0.01 < 0.02
21 < 0.01 ND - < 0.01 < 0.02
Havelock North,
Hawke's Bay, 2006
(Golden Queen)
050075-02
SC 3.7 67–68
4 269
28 ND ND - < 0.01 < 0.02
050075

1736 Spinetoram
Application Residue, mg/kg Location,
year (Variety)
Form
g ai/hL
g ai/ha
No
Total/ season,
g ai/ha
PHI, days XDE-
175-J XDE-175-L
ND-J NF-J Total a
Report No.
0 0.049 0.012 - 0.017 0.078
1 0.032 < 0.01 - 0.013 0.045
3 0.026 < 0.01 - 0.015 0.041
7 0.024 < 0.01 - 0.015 0.039
14 < 0.01 ND - 0.011 0.021
21 ND ND - ND < 0.02
Havelock North,
Hawke's Bay, 2006
(Golden Queen)
050075-02
SC 5 91–92
4 365
28 ND ND - < 0.01 < 0.02
050075
0 0.058 0.016 - 0.018 0.092
1 0.041 < 0.01 - 0.016 0.057
3 0.036 < 0.01 - 0.027 0.063
7 0.039 < 0.01 - 0.025 0.064
14 0.023 ND - 0.017 0.040
21 0.012 ND - 0.017 0.029
Havelock North,
Hawke's Bay, 2006
(Golden Queen)
050075-02
SC 7.6 137–138
4 549
28 0.014 ND - 0.020 0.034
050075
0 0.060 0.014 - 0.022 0.096
1 0.094 0.024 - 0.038 0.156
3 0.032 < 0.01 - 0.023 0.055
7 0.013 ND - < 0.01 0.023
14 < 0.01 ND - < 0.01 < 0.02
21 0.019 ND - < 0.01 0.029
Earnscleugh, Central Otago 2006
(Southern Ice)
050075-06
SC 2.5 49- 52
4 199
28 0.027 ND - 0.010 0.037
050075
0 0.078 0.019 - 0.013 0.11
1 0.053 0.012 - 0.020 0.085
3 0.052 0.010 - 0.025 0.087
7 0.030 < 0.01 - 0.017 0.047
14 < 0.01 ND - < 0.01 < 0.02
21 0.014 ND - 0.011 0.025
Earnscleugh, Central Otago 2006
(Southern Ice)
050075-06
SC 3.7 72–76
4 293
28 < 0.01 ND - < 0.01 < 0.02
050075
0 0.154 0.032 - 0.041 0.227
1 0.053 0.012 - 0.026 0.091
3 0.071 0.013 - 0.033 0.117
7 0.039 < 0.01 - 0.036 0.075
14 0.015 ND - 0.014 0.029
21 0.014 ND - 0.017 0.031
Earnscleugh, Central Otago 2006
(Southern Ice)
050075-06
SC 5 98–103
4 397
28 0.020 ND - 0.020 0.04
050075
0 0.106 0.027 - 0.017 0.150
1 0.111 0.029 - 0.035 0.175
3 0.088 0.014 - 0.041 0.143
7 0.027 < 0.01 - 0.019 0.046
14 0.019 ND - 0.014 0.033
21 0.020 ND - 0.012 0.032
Earnscleugh, Central Otago 2006
(Southern Ice)
050075-06
SC 7.6 147-
155
4 596
28 0.034 ND - 0.021 0.055
050075
a Total residue = XDE-175-J + XDE-175-L + ND-J + NF-J.

Spinetoram 1737
Table 28-1 Residues of spinetoram from supervised trials on nectarine in Australia (for estimation of maximum residue level)
Application Residue, mg/kg Location, year
(Variety)
Form
g ai/hL g ai/ha No
Total/ season,
g ai/ha
PHI, days XDE-
175-J XDE-175-L
Total a
Report No.
NECTARINES–AUSTRALIAN TRIALS
0 0.01 ND 0.02
7 ND ND < 0.02
14 ND ND < 0.02
21 ND ND < 0.02
28 ND ND < 0.02
McIssacs Rd, Ardmona VIC
2005 (Fire Pearl) 050063-06
WG 5 62 4 248
35 ND ND < 0.02
050063
0 0.02 ND 0.03
7 < 0.01 ND < 0.02
14 ND ND < 0.02
21 ND ND < 0.02
28 ND ND < 0.02
McIssacs Rd, Ardmona VIC
2005 (Fire Pearl) 050063-06
WG 7.5 93 4 372
35 ND ND < 0.02
050063
0 0.02 < 0.01 0.03
7 < 0.01 ND < 0.02
14 ND ND < 0.02
21 ND ND < 0.02
28 ND ND < 0.02
McIssacs Rd, Ardmona VIC
2005 (Fire Pearl) 050063-06
WG 5 59–62 7 427
050063
0 0.01 ND 0.03
7 < 0.01 ND < 0.02
14 ND ND < 0.02
21 ND ND < 0.02
28 ND ND < 0.02
McIssacs Rd, Ardmona VIC
2005 (Fire Pearl) 050063-06
WG 7.5 77–93 7 629
35 ND ND < 0.02
050063
a Total residue = XDE-175-J + XDE-175-L.
Table 28-2 Residues of spinetoram and metabolites from supervised trials on nectarine in Australia (for estimation of STMR)
Application Residue, mg/kg Location, year
(Variety)
Form
g ai/hL
g ai/ha
No
Total/ season, g ai/ha
PHI, days
XDE-175-J
XDE-175-L
ND-J NF-J Total a
Report No.
NECTARINES–AUSTRALIAN TRIALS
0 0.01 ND ND ND 0.02
7 ND ND ND ND < 0.02
14 ND ND ND ND < 0.02
21 ND ND ND ND < 0.02
McIssacs Rd, Ardmona VIC
2005 (Fire Pearl) 050063-06
WG 5 62 4 248
28 ND ND ND ND < 0.02
050063

1738 Spinetoram
Application Residue, mg/kg Location, year
(Variety)
Form
g ai/hL
g ai/ha
No
Total/ season,
g ai/ha
PHI, days
XDE-175-J
XDE-175-L
ND-J NF-J Total a
Report No.
NECTARINES–AUSTRALIAN TRIALS
35 ND ND ND ND < 0.02
0 0.02 ND ND ND 0.03
7 < 0.01 ND ND ND < 0.02
14 ND ND ND ND < 0.02
21 ND ND ND ND < 0.02
28 ND ND ND ND < 0.02
McIssacs Rd, Ardmona VIC
2005 (Fire Pearl) 050063-06
WG 7.5 93 4 372
35 ND ND ND ND < 0.02
050063
0 0.02 < 0.01 ND ND 0.03
7 < 0.01 ND ND ND < 0.02
14 ND ND ND ND < 0.02
21 ND ND ND ND < 0.02
28 ND ND ND ND < 0.02
McIssacs Rd, Ardmona VIC
2005 (Fire Pearl) 050063-06
WG 5 59–62
7 427
050063
0 0.01 ND ND ND 0.03
7 < 0.01 ND ND ND < 0.02
14 ND ND ND ND < 0.02
21 ND ND ND ND < 0.02
28 ND ND ND ND < 0.02
McIssacs Rd, Ardmona VIC
2005 (Fire Pearl) 050063-06
WG 7.5 77–93
7 629
35 ND ND ND ND < 0.02
050063
a Total residue = XDE-175-J + XDE-175-L + ND-J + NF-J.
Table 29-1 Residues of spinetoram from supervised trials on apricot in Australia and New Zealand (for estimation of maximum residue level)
Application Residue, mg/kg Location, year
(Variety)
Form
g ai/hL
g ai/ha No
Total/ season,
g ai/ha
PHI, days
XDE-175-J XDE-175-L
Total a
Report No.
AUSTRALIAN TRIALS
0 0.08 0.02 0.10
7 0.02 ND 0.02
14 < 0.01 < 0.01 < 0.01
21 < 0.01 ND < 0.01
28 ND ND < 0.01
McIssacs Rd, Ardmona VIC
2005 (Francesco) 050063-05
WG 5 51 4 204
35 ND ND < 0.01
050063
0 0.08 0.02 0.10
7 0.02 ND 0.02
14 0.01 ND 0.01
21 < 0.01 ND < 0.01
28 < 0.01 ND < 0.01
McIssacs Rd, Ardmona VIC
2005 (Francesco) 050063-05
WG 7.5 76 4 304
35 ND ND < 0.01
050063

Spinetoram 1739
Application Residue, mg/kg Location, year
(Variety)
Form
g ai/hL
g ai/ha No
Total/ season,
g ai/ha
PHI, days
XDE-175-J XDE-175-L
Total a
Report No.
0 0.07 0.02 0.09
7 0.02 ND 0.02
14 0.01 ND 0.01
21 ND ND < 0.01
28 ND ND < 0.01
McIssacs Rd, Ardmona VIC
2005 (Francesco) 050063-05
WG 5 51–52 7 358
35 ND ND < 0.01
050063
0 0.16 0.04 0.20
7 0.02 ND 0.02
14 0.02 ND 0.02
21 0.01 ND 0.01
28 < 0.01 ND < 0.01
McIssacs Rd, Ardmona VIC
2005 (Francesco) 050063-05
WG 7.5 76–79 7 536
35 < 0.01 ND < 0.01
050063
NEW ZEALAND TRIALS
0 0.038 < 0.01 0.038
1 0.048 0.012 0.06
3 0.031 < 0.01 0.031
7 0.016 ND 0.016
Bay View, Hawke's Bay,
2005 (Castlebright)
050075-03
SC 2.5 31–33 4 129
14 0.010 ND 0.01
050075
0 0.057 0.015 0.072
1 0.048 0.012 0.06
3 0.032 < 0.01 0.032
7 0.041 < 0.01 0.041
Bay View, Hawke's Bay,
2005 (Castlebright)
050075-03
SC 3.7 46–48 4 189
14 0.014 ND 0.014
050075
0 0.080 0.019 0.099
1 0.091 0.022 0.113
3 0.063 0.015 0.078
7 0.055 0.012 0.067
Bay View, Hawke's Bay,
2005 (Castlebright)
050075-03
SC 5 62–65 4 256
14 0.017 ND 0.017
050075
0 0.185 0.043 0.228
1 0.208 0.052 0.26
3 0.153 0.033 0.186
7 0.080 0.017 0.097
Bay View, Hawke's Bay,
2005 (Castlebright)
050075-03
SC 7.6 93–98
4 385
14 0.030 < 0.01 0.03
050075
0 0.035 0.055 0.09
1 0.039 0.012 0.051
3 0.018 ND 0.018
7 0.019 ND 0.019
Earnscleugh, Central Otago
2006 (Sundrop) 050075-07
SC 2.5 36–40 4 150
14 < 0.01 ND < 0.01
050075
0 0.126 0.039 0.165
1 0.124 0.037 0.161
3 0.063 0.018 0.081
7 0.041 0.011 0.052
Earnscleugh, Central Otago
2006 (Sundrop) 050075-07
SC 3.7 53–59 4 221
14 0.022 < 0.01 0.022
050075

1740 Spinetoram
Application Residue, mg/kg Location, year
(Variety)
Form
g ai/hL
g ai/ha No
Total/ season,
g ai/ha
PHI, days
XDE-175-J XDE-175-L
Total a
Report No.
0 0.101 0.031 0.132
1 0.080 0.023 0.103
3 0.081 0.025 0.106
7 0.064 0.017 0.081
Earnscleugh, Central Otago
2006 (Sundrop) 050075-07
SC 5 72–79 4 298
14 0.024 ND 0.024
050075
0 0.222 0.067 0.289
1 0.213 0.062 0.275
3 0.139 0.038 0.177
7 0.084 0.022 0.106
Earnscleugh, Central Otago
2006 (Sundrop) 050075-07
SC 7.6 107–119
4 447
14 0.034 < 0.01 0.034
050075
a Total residue = XDE-175-J + XDE-175-L.
Table 29-2 Residues of spinetoram and metabolites from supervised trials on apricot in Australia and New Zealand (for estimation of STMR)
Application Residue, mg/kg Location, year
(Variety)
Form g
ai/hL g
ai/ha No
Total/ season,
g ai/ha
PHI, days XDE-
175-J XDE-175-L
ND-J NF-J Total a
Report No.
AUSTRALIAN TRIALS
0 0.08 0.02 0.01 < 0.01 0.12
7 0.02 ND 0.01 < 0.01 0.04
14 < 0.01 < 0.01 ND ND < 0.02
21 < 0.01 ND ND ND < 0.02
28 ND ND ND ND < 0.02
McIssacs Rd, Ardmona VIC
2005 (Francesco) 050063-05
WG 5 51 4 204
35 ND ND ND ND < 0.02
050063
0 0.08 0.02 0.02 < 0.01 0.13
7 0.02 ND < 0.01 < 0.01 0.03
14 0.01 ND < 0.01 < 0.01 0.02
21 < 0.01 ND ND ND < 0.02
28 < 0.01 ND ND ND < 0.02
McIssacs Rd, Ardmona VIC
2005 (Francesco) 050063-05
WG 7.5 76 4 304
35 ND ND ND ND < 0.02
050063
0 0.07 0.02 0.01 < 0.01 0.11
7 0.02 ND 0.01 0.010 0.04
14 0.01 ND < 0.01 < 0.01 0.02
21 ND ND ND ND < 0.02
28 ND ND ND ND < 0.02
McIssacs Rd, Ardmona VIC
2005 (Francesco) 050063-05
WG 5 51–52
7 358
35 ND ND ND ND < 0.02
050063

Spinetoram 1741
Application Residue, mg/kg Location, year
(Variety)
Form
g ai/hL
g ai/ha
No
Total/ season,
g ai/ha
PHI, days XDE-
175-J XDE-175-L
ND-J NF-J Total a
Report No.
WG 536 0 0.16 0.04 0.02 0.01 0.23 050063
7 0.02 ND 0.010 < 0.01 0.04
14 0.02 ND 0.010 < 0.01 0.04
McIssacs Rd, Ardmona VIC
2005 (Francesco) 050063-05
21 0.01 ND < 0.01 < 0.01 0.02
28 < 0.01 ND < 0.01 < 0.01 < 0.02
7.5 76–79
7
35 < 0.01 ND ND ND < 0.02
NEW ZEALAND TRIALS
0 0.038 < 0.01 - 0.018 0.056
1 0.048 0.012 - 0.023 0.083
3 0.031 < 0.01 - 0.023 0.054
7 0.016 ND - 0.015 0.031
Bay View, Hawke's Bay, 2005
(Castlebright) 050075-03
SC 2.5 31–33
4 129
14 0.010 ND - 0.013 0.023
050075
0 0.057 0.015 - 0.020 0.092
1 0.048 0.012 - 0.021 0.081
3 0.032 < 0.01 - 0.021 0.053
7 0.041 < 0.01 - 0.028 0.069
Bay View, Hawke's Bay, 2005
(Castlebright) 050075-03
SC 3.7 46–48
4 189
14 0.014 ND - 0.017 0.031
050075
0 0.080 0.019 - 0.026 0.125
1 0.091 0.022 - 0.036 0.149
3 0.063 0.015 - 0.032 0.11
7 0.055 0.012 - 0.042 0.109
Bay View, Hawke's Bay, 2005
(Castlebright) 050075-03
SC 5 62–65
4 256
14 0.017 ND - 0.020 0.037
050075
0 0.185 0.043 - 0.045 0.273
1 0.208 0.052 - 0.058 0.318
3 0.153 0.033 - 0.065 0.251
7 0.080 0.017 - 0.055 0.152
Bay View, Hawke's Bay, 2005
(Castlebright) 050075-03
SC 7.6 93–98
4 385
14 0.030 < 0.01 - 0.030 0.06
050075
0 0.035 0.055 - 0.010 0.1
1 0.039 0.012 - 0.013 0.064
3 0.018 ND - < 0.01 0.028
7 0.019 ND - < 0.01 0.029
Earnscleugh,Central Otago 2006 (Sundrop) 050075-07
SC 2.5 36–40
4 150
14 < 0.01 ND - 0.004 0.014
050075
0 0.126 0.039 - 0.024 0.189
1 0.124 0.037 - 0.036 0.197
3 0.063 0.018 - 0.028 0.109
7 0.041 0.011 - 0.023 0.075
Earnscleugh,Central Otago 2006 (Sundrop) 050075-07
SC 3.7 53–59
4 221
14 0.022 < 0.01 - 0.016 0.038
050075
0 0.101 0.031 - 0.025 0.157
1 0.080 0.023 - 0.019 0.122
3 0.081 0.025 - 0.031 0.137
7 0.064 0.017 - 0.034 0.115
Earnscleugh,Central Otago 2006 (Sundrop) 050075-07
SC 5 72–79
4 298
14 0.024 ND - 0.021 0.045
050075

1742 Spinetoram
Application Residue, mg/kg Location, year
(Variety)
Form
g ai/hL
g ai/ha
No
Total/ season,
g ai/ha
PHI, days XDE-
175-J XDE-175-L
ND-J NF-J Total a
Report No.
0 0.222 0.067 - 0.038 0.327
1 0.213 0.062 - 0.046 0.321
3 0.139 0.038 - 0.038 0.215
7 0.084 0.022 - 0.036 0.142
Earnscleugh,Central Otago 2006 (Sundrop) 050075-07
SC 7.6 107–119
4 447
14 0.034 < 0.01 - 0.017 0.051
050075
a Total residue = XDE-175-J + XDE-175-L + ND-J + NF-J.
Fruiting Vegetables other than Cucurbits
Supervised trials on tomato in the USA
Six supervised trials on tomatoes were conducted in major tomato growing areas in the USA in 2004 and 2007 (Dolder and Wendelburg, 2005; Report 040063; McKellar, 2008; Report ARAP 07D-001).
Trials were conducted in six sites, each site consisting of a control plot and a treated plot. Each treated plot received five applications of a suspension concentrate (SC) formulation containing either 100 g/L or 120 g/L of spinetoram. The initial application was made at a nominal rate of 20 g ai/ha, followed by four additional applications at the higher rate of 70 g ai/ha for a seasonal maximum of approximately 300 g ai/ha. The applications were made as low volume spray applications at 4-day intervals. Mature tomatoes were collected at the PHI of 1 day. In one trial, samples were also taken on days 0, 1, 3, 7, and 14 days after the last treatment.
Approximately 2 kg of mature whole tomato fruits were collected by hand. At each sampling, a single composite sample was taken from the control plot while duplicate, composite samples were taken independently from each treated plot. Samples were frozen within 4 hours of collection, placed in plastic bags, labelled, shipped frozen, and kept in temperature-monitored freezers at -20 °C until analysis.
Spinetoram and its metabolites were analysed using the method GRM 05.04 with an LOQ and LOD of 0.01 mg/kg and 0.003 mg/kg, respectively. Samples from the 2007 trials were analysed using method GRM 05.03 with the same LOQ and LOD as GRM 05.04.
Table 30-1 Residues of spinetoram from supervised trials on tomato in the USA (for estimation of maximum residue level)
Application Residue, mg/kg Location, year
(Variety)
Form
g ai/hL g ai/ha No
Total/ season,
g ai/ha
PHI, days
XDE-175-J
XDE-175-L
Total a
Report No.
GAP, USA Fruiting
vegetables
SC 44-88 6 298 1
0.010 ND 0.010 North Rose, NY, 2004
(Floradade)
SC 5, initial, + 21, 4 appl.
21, initial, + 70-71, 4 appl.
5 304 1
< 0.01 ND < 0.01
040063
ND ND < 0.01 Lake Park, GA, 2004 (Sonoma
Roam)
SC 5, initial, + 17-19, 4 appl.
20, initial, + 71-72, 4 appl.
5 306 1
ND ND < 0.01
040063

Spinetoram 1743
Application Residue, mg/kg Location, year
(Variety)
Form
g ai/hL g ai/ha No
Total/ season,
g ai/ha
PHI, days
XDE-175-J
XDE-175-L
Total a
Report No.
< 0.01 ND < 0.01 Jennings, FL, 2004
(Florida)
SC 5, initial, + 17-19, 4 appl.
20, initial, + 70-76, 4 appl.
5 308 1
ND ND < 0.01
040063
0.025 < 0.01 0.025 Paynesville, MN, 2004 (Olinda)
SC 7, initial, +24, 4 appl.
20, initial, + 70-71, 4 appl.
5 301 1
0.022 < 0.01 0.022
040063
0.043 0.015 0.058 0
0.020 < 0.01 0.02
0.015 < 0.01 0.015 1
0.012 < 0.01 0.012
< 0.01 ND < 0.01 3
< 0.01 ND < 0.01
ND ND < 0.01 7
< 0.01 ND < 0.01
ND ND < 0.01
Porterville, CA, 2004
(Early Girl)
SC 22-25 70-71 4 281
14
ND ND < 0.01
040063
0.022 < 0.01 0.022 GA, 2007 (Not
specified)
SC 5, initial, + 14-16, 4 appl.
21, initial, + 68-70, 4 appl.
5 295 1
0.024 < 0.01 0.024
040063
a Total residue = XDE-175-J + XDE-175-L.
Table 30-2 Residues of spinetoram and metabolites from supervised trials on tomato in the USA (for estimation of STMR)
Application Residue, mg/kg Location,
year (Variety)
Form g
ai/hL g
ai/ha No
Total/ season, g ai/ha
PHI, days XDE-
175-J XDE-175-L
ND-J NF-J Total a
Report No.
GAP, USA Fruiting
vegetables SC 44-88 6 298 1
0.010 ND < 0.01 0.010 0.020 North Rose, NY, 2004
(Floradade)
SC
5, initial, + 21,
4 appl.
21, initial, + 70-71, 4 appl.
5 304 1 < 0.01 ND < 0.01 < 0.01 < 0.02
040063
ND ND ND < 0.01 < 0.02 Lake Park, GA, 2004 (Sonoma
Roam)
SC
5, initial, + 17-19, 4 appl.
20, initial, + 71-72, 4 appl.
5 306 1 ND ND ND < 0.01 < 0.02
040063
< 0.01 ND ND < 0.01 < 0.02 Jennings, FL, 2004 (Florida)
SC
5, initial, + 17-19, 4 appl.
20, initial, + 70-76, 4 appl.
5 308 1 ND ND ND < 0.01 < 0.02
040063

1744 Spinetoram
Application Residue, mg/kg Location,
year (Variety)
Form
g ai/hL
g ai/ha
No
Total/ season,
g ai/ha
PHI, days XDE-
175-J XDE-175-L
ND-J NF-J Total a
Report No.
0.025 < 0.01 < 0.01 < 0.01 0.035 Paynesville, MN, 2004 (Olinda)
SC
7, initial, +24, 4 appl.
20, initial, + 70-71, 4 appl.
5 301 1 0.022 < 0.01 < 0.01 < 0.01 0.032
040063
0.043 0.015 < 0.01 0.011 0.069 0
0.020 < 0.01 < 0.01 < 0.01 0.030
0.015 < 0.01 < 0.01 < 0.01 0.025 1
0.012 < 0.01 < 0.01 < 0.01 0.022
< 0.01 ND ND < 0.01 < 0.02 3
< 0.01 ND < 0.01 < 0.01 < 0.02
ND ND ND < 0.01 < 0.02 7
< 0.01 ND < 0.01 < 0.01 < 0.02
ND ND ND ND < 0.02
Porterville, CA, 2004
(Early Girl)
SC 22-25 70-71 4 281
14 ND ND ND < 0.01 < 0.02
040063
0.022 < 0.01 ND < 0.01 0.032 GA, 2007
(Not specified)
SC
5, initial, + 14-16, 4 appl.
21, initial, + 68-70, 4 appl.
5 295 1 0.024 < 0.01 ND < 0.01 0.034
040063
a Total residue = XDE-175-J + XDE-175-L + ND-J + NF-J.
Leafy Vegetables
Supervised trials on lettuce in the US
Six supervised trials on leaf lettuce were conducted in major lettuce growing areas in the US in 2004 and 2007 (Dolder and Wendelburg, 2005; Report 040063; McKellar, 2008; Report ARAP 07D-001).
Trials were conducted in six sites, each site consisting of a control plot and a treated plot. Each treated plot received five applications of a suspension concentrate (SC) formulation containing either 100 g/L or 120 g/L of spinetoram. The initial application was made at a nominal rate of 20 g ai/ha, followed by four additional applications at the higher rate of 70 g ai/ha for a seasonal total of approximately 300 g ai/ha. The applications were made as low volume spray applications at 4-day intervals. Mature lettuce samples were collected at the PHI of 1 day. In one trial, samples were also taken on days 0, 1, 3, 7, and 14 after the last application.
Approximately 1 kg of mature lettuce leaves was collected by hand. At each sampling, a single composite sample was taken from the control plot while duplicate, composite samples were taken independently from each treated plot. Samples were frozen within 4 h of collection, placed in plastic bags, labelled, shipped frozen, and kept in temperature-monitored freezers at –20 °C until analysis.
Spinetoram and its metabolites were analysed using the method GRM 05.04 with an LOQ and limit of detection LOD of 0.01 mg/kg and 0.003 mg/kg, respectively. Samples from the 2007 trials were analysed using method GRM 05.03 with the same LOQ and LOD values as GRM 05.04.

Spinetoram 1745
Table 31-1 Residues of spinetoram from supervised trials on leaf lettuce in the USA (for estimation of maximum residue level)
Application Residue, mg/kg
Location, year
(Variety)
Form
g ai/hL g ai/ha No
Total/ season,
g ai/ha
PHI,
days
XDE-175-J
XDE-175-L
Total a
Report No.
GAP, USA Leafy
vegetables
WG or SC
44–88 6 298 1
0.226 0.057 0.283 North Rose, NY, 2004
(Black Seeded Simpson)
WG 6 initial and 22, 4 appl.
21 initial
and 71-73, 4 appl.
5 309 1
0.247 0.067 0.314
040063
0.120 0.010 0.130 Chula, GA,
2004 (Tehama)
WG 7 initial and 23, 4 appl.
21 initial
and 70-71, 4 appl.
5 305 1
0.142 0.012 0.154
040063
0.222 0.060 0.282 Jennings, FL,
2004 (Tehama)
WG 6 initial and 21-
22, 4 appl.
20 initial
and 70-74, 4 appl.
5 305 1
0.265 0.076 0.341
040063
0.153 0.043 0.196 King City, CA,
2004 (Sunbelt)
WG 7 initial and 22-
24, 4 appl.
21 initial
and 67-71, 4 appl.
5 299 1
0.245 0.075 0.320
040063
0.97 0.31 1.28 0
1.42 0.44 1.86
040063
0.42 0.12 0.54 1
0.43 0.12 0.55
040063
0.11 0.03 0.14
Porterville, CA, 2004
(Shining Star)
WG 6 initial and 19-
20, 4 appl.
20 initial
and 70, 4 appl.
5 300
3
0.12 0.03 0.15
040063
0.05 0.01 0.06 7
0.07 0.02 0.09
040063
0.02 < 0.01 0.02
14
0.02 < 0.01 0.02
040063
5.62 1.40 7.02 GA, 2007 (Not specified)
WG 4 initial and 15, 4 appl.
21 initial
and 70, 4 appl.
5 305 1
6.26 1.54 7.80
040063
a Total residue = XDE-175-J + XDE-175-L.

1746 Spinetoram
Table 31-2 Residues of spinetoram and metabolites from supervised trials on leaf lettuce in the USA (for estimation of STMR)
Application Residue, mg/kg Location,
year (Variety)
Form g
ai/hL g
ai/ha No
Total/ season,
g ai/ha
PHI, days XDE-
175-J XDE-175-L
ND-J NF-J Total a
Report No.
GAP, USA Leafy
vegetables
WG or SC
44–88
6 298 1
0.226 0.057 0.183 0.094 0.560 North Rose, NY, 2004
(Black Seeded
Simpson)
WG 6 initial and
22, 4 appl.
21 initial and 71-
73, 4 appl.
5 309 1
0.247 0.067 0.208 0.121 0.643
040063
0.120 0.010 0.056 0.077 0.263 Chula, GA,
2004 (Tehama)
WG 7 initial and
23, 4 appl.
21 initial and 70-
71, 4 appl.
5 305 1
0.142 0.012 0.055 0.070 0.279
040063
0.222 0.060 0.141 0.700 1.123 Jennings, FL,
2004 (Tehama)
WG 6 initial and
21-22, 4 appl.
20 initial and 70-
74, 4 appl.
5 305 1
0.265 0.076 0.151 0.858 1.350
040063
0.153 0.043 0.076 0.056 0.328 King City,
CA, 2004
(Sunbelt)
WG 7 initial and
22-24, 4 appl.
21 initial and 67-
71, 4 appl.
5 299 1
0.245 0.075 0.146 0.092 0.558
040063
0.97 0.31 0.31 0.19 1.78 0
1.42 0.44 0.42 0.22 2.50
040063
0.42 0.12 0.32 0.25 1.11 1
0.43 0.12 0.35 0.26 1.16
040063
0.11 0.03 0.13 0.10 0.37
Porterville, CA, 2004 (Shining
Star)
WG 6 initial and
19-20, 4 appl.
20 initial and
70, 4 appl.
5 300
3
0.12 0.03 0.16 0.12 0.43
040063
0.05 0.01 0.08 0.08 0.22 7
0.07 0.02 0.09 0.09 0.27
040063
0.02 < 0.01 0.02 0.02 0.06
14
0.02 < 0.01 0.02 0.03 0.07
040063
5.62 1.40 0.66 0.94 8.62 GA, 2007 (Not
specified)
WG 4 initial and
15, 4 appl.
21 initial and
70, 4 appl.
5 305 1
6.26 1.54 0.75 1.00 9.55
040063
a Total residue = XDE-175-J + XDE-175-L + ND-J + NF-J.

Spinetoram 1747
Root and Tuber Vegetables
Supervised trials sugar beet in the USA
Six supervised trials on sugar beet were conducted in major sugar beet growing areas in the US in 2004 and 2007 (Dolder and Wendelburg, 2005; Report 040063; McKellar, 2008; Report ARAP 07D-001).
Trials were conducted in six sites, each site consisting of a control plot and a treated plot. Each treated plot received four applications of a suspension concentrate (SC) formulation containing either 100 g/L or 120 g/L of spinetoram at a nominal rate of 70 g ai/ha for a seasonal maximum of 280 g ai/ha. The applications were made as low volume spray applications at 4-day intervals. Mature roots and tops were collected 3 days after the last application. In one trial, samples were also taken on days 0, 1, 3, 7, and 14 days after the last treatment.
Approximately 2.3 kg of mature roots and 2.8 kg of tops were collected by hand. At each sampling, a single composite sample was taken from the control plot while duplicate, composite samples were taken independently from each treated plot. Due to the large size of the sugar beet, the root portion was quartered longitudinally and only one quarter from each of 12 beets were retained as a sample. Samples were frozen within 4 h of collection, placed in plastic bags, labelled, shipped frozen, and kept in temperature-monitored freezers at –20 °C until analysis.
Spinetoram and its metabolites were analysed using the method GRM 05.04 with an LOQ and LOD of 0.01 mg/kg and 0.003 mg/kg, respectively. Samples from the 2007 trials were analysed using method GRM 05.03 with the same LOQ and LOD values as GRM 05.04.
Table 32-1 Residues of spinetoram from supervised trials on sugar beet in the USA (for estimation of maximum residue level)
Application Residue, mg/kg Location, year (Variety)
Form
g ai/hL g ai/ha No
Total/ season,
g ai/ha
PHI, days XDE-
175-J XDE-175-L
Total a
Report No.
GAP, US, Tuberous vegetables
SC 53-70 4 281 7
SUGAR BEET ROOTS
ND ND < 0.01 Olivia, MN, 2004 (Beta)
SC 24–25
70–71 4 282 3
ND ND < 0.01
040063
ND ND < 0.01 Edgeley, ND, 2004
(Beta)
SC 24–25
70–71 4 281 3
ND ND < 0.01
040063
ND ND < 0.01 Levelland, TX, 2004
(Wrangler)
SC 19 70–72 4 284 3
ND ND < 0.01
040063
ND ND < 0.01 Porterville, CA, 2004
(Beta 4030R)
SC 19 70–71 4 283 3
ND ND < 0.01
040063
< 0.01 ND < 0.01 SC 21 70–71 4 283 0
< 0.01 ND < 0.01
040063
ND ND < 0.01
Ephrata, WA, 2004
(Blazer) 1
ND ND < 0.01
< 0.01 ND < 0.01 3
ND ND < 0.01
ND ND < 0.01 7
ND ND < 0.01

1748 Spinetoram
Application Residue, mg/kg Location, year (Variety)
Form
g ai/hL g ai/ha No
Total/ season,
g ai/ha
PHI, days XDE-
175-J XDE-175-L
Total a
Report No.
ND ND < 0.01 14
ND ND < 0.01
< 0.01 ND < 0.01 GA, 2007 (Not specified)
SC 21-22 69-72 4 283 3
< 0.01 ND < 0.01
ARAP 07D-001
a Total residue = XDE-175-J + XDE-175-L.
Table 32-2 Residues of spinetoram and metabolites from supervised trials on sugar beet in the USA (for estimation of STMR)
Application Residue, mg/kg Location, year
(Variety)
Form g
ai/hL g
ai/ha No
Total/ season,
g ai/ha
PHI, days XDE-
175-J XDE-175-
L
ND-J NF-J Total a
Report No.
GAP, US, Root
vegetables
SC 53-70 4 281 7
SUGAR BEET ROOTS
ND ND ND ND < 0.02 Olivia, MN, 2004 (Beta)
SC 24–25
70–71
4 282 3
ND ND ND ND < 0.02
040063
ND ND ND ND < 0.02 Edgeley, ND, 2004
(Beta)
SC 24–25
70–71
4 281 3
ND ND ND ND < 0.02
040063
ND ND ND < 0.01 < 0.02 Levelland, TX, 2004
(Wrangler)
SC 19 70–72
4 284 3
ND ND ND ND < 0.02
040063
ND ND < 0.01 < 0.01 < 0.02 Porterville, CA, 2004
(Beta 4030R)
SC 19 70–71
4 283 3
ND ND ND ND < 0.02
040063
< 0.01 ND < 0.01 < 0.01 < 0.02 0
< 0.01 ND < 0.01 < 0.01 < 0.02
ND ND ND ND < 0.02 1
ND ND ND < 0.01 < 0.02
< 0.01 ND < 0.01 < 0.01 < 0.02 3
ND ND ND ND < 0.02
ND ND ND < 0.01 < 0.02 7
ND ND ND ND < 0.02
ND ND < 0.01 < 0.01 < 0.02
Ephrata, WA, 2004
(Blazer)
SC 21 70–71
4 283
14
ND ND < 0.01 ND < 0.02
040063
< 0.01 ND < 0.01 ND < 0.02 GA, 2007 (Not
specified)
SC 21-22
69-72 4 283 3
< 0.01 ND < 0.01 ND < 0.02
ARAP 07D-001
a Total residue = XDE-175-J + XDE-175-L + ND-J + NF-J.

Spinetoram 1749
Tree Nuts
Supervised trials on almond and pecan in the USA
Six supervised trials on almond and six on pecan were conducted in the USA in 2007 (Dolder and Schelle, 2008; Report 070069).
Trials on almond were conducted in six sites in California, while trials on pecan were conducted in six different States in the USA. Each site consisted of a control plot and a treated plot, with at least six trees in each plot. Each treated plot received four applications of WG formulation containing either 250 g/kg of spinetoram at a nominal rate of 123 g ai/ha for a seasonal maximum of 500g ai/ha. The applications were made at intervals of 7 days, using airblast sprayers with four to seven nozzles. Spray volumes ranged from 889 to 1074 L/ha. Whole nuts were collected 7 days after the last application. In decline trials (one each for almond and pecan), samples were taken on days 0, 1, 3, 7 and 14 days after the last treatment.
For each commodity at each site, a single, composite sample was taken from the control plot while duplicate, composite samples were taken independently from the treated plot. At each sampling the nuts were knocked or shaken from the trees. Trees at the ends of plots were not sampled. The whole nuts were collected and, within approximately 24 hours, were cracked using a nut cracker and the nutmeat (and hulls in the case of almonds) was collected by hand or with a sheller. A minimum of 1 kg was collected for each sample. Samples were placed in sample bags, labelled and frozen within approximately 24 h of sampling and remained frozen up through shipment overnight to the analytical laboratory. All samples were received frozen and were stored in temperature-monitored freezers at approximately –20 °C.
Spinetoram and its metabolites were analysed using the method GRM 05.04 with an LOQ and LOD of 0.01 mg/kg and 0.003 mg/kg, respectively.
Table 33-1 Residues of spinetoram from supervised trials on almonds in the USA (for estimation of maximum residue level)
Application Residue, mg/kg Location, year
(Variety)
Form
g ai/hL
g ai/ha No
Total/ year
g ai/ha
PHI, days XDE-175-J XDE-
175-L Total a
Report No.
GAP, USA, Tree Nuts
WG 26–123
4 490 14
< 0.01 ND < 0.01 Terra Bella, CA, 2007
070069CA1 (Carmel)
WG 13 117–144
4 532 7
< 0.01 ND < 0.01
070069
< 0.01 ND < 0.01 Wasco, CA,
2007 070069CA2
(Price)
WG 13 117–130
4 501 7
< 0.01 ND < 0.01
070069
ND ND < 0.01 Earlimart, CA,
2007 070069CA3
(Fritz)
WG 13 117–133
4 491 7
ND ND < 0.01
070069
< 0.01 ND < 0.01 Sultana, CA,
2007 070069CA4
(Carmel)
WG 13 123–124
4 494 7
< 0.01 ND < 0.01
070069
ND ND < 0.01 Sanger, CA,
2007 070069CA5
(Neplus)
WG 13 110–124
4 480 7
ND ND < 0.01
070069

1750 Spinetoram
Application Residue, mg/kg Location, year
(Variety)
Form
g ai/hL
g ai/ha No
Total/ year
g ai/ha
PHI, days XDE-175-J XDE-
175-L Total a
Report No.
0.011 ND 0.011 WG 13 123–123
4 495 0
0.011 < 0.01 0.011
070069
< 0.01 ND < 0.01 1
0.011 ND 0.011
< 0.01 ND < 0.01 3
0.011 ND 0.011
< 0.01 ND < 0.01 7
< 0.01 ND < 0.01
070069
< 0.01 ND < 0.01
Sanger, CA, 2007
070069CA6 (Nonpareil)
14
< 0.01 ND < 0.01
070069
a Total residue = XDE-175-J + XDE-175-L.
Table 33-2 Residues of spinetoram and metabolites from supervised trials on almonds in the USA (for estimation of STMR)
Application Residue, mg/kg Location,
year (Variety)
Form
g ai/hL
g ai/ha No
Total/ year
g ai/ha
PHI, days
XDE-175-J
XDE-175-L
ND-J
NF-J Total a
Report No.
GAP, USA, Tree Nuts
WG 26–123
4 490 14
< 0.01 ND ND ND < 0.02 Terra Bella, CA, 2007
070069CA1 (Carmel)
WG 13 117–144
4 532 7
< 0.01 ND ND ND < 0.02
070069
< 0.01 ND ND ND < 0.02 Wasco, CA,
2007 070069CA2
(Price)
WG 13 117–130
4 501 7
< 0.01 ND ND ND < 0.02
070069
ND ND ND ND < 0.02 Earlimart, CA, 2007
070069CA3 (Fritz)
WG 13 117–133
4 491 7
ND ND ND ND < 0.02
070069
< 0.01 ND ND ND < 0.02 Sultana, CA,
2007 070069CA4
(Carmel)
WG 13 123–124
4 494 7
< 0.01 ND ND ND < 0.02
070069
ND ND ND ND < 0.02 Sanger, CA,
2007 070069CA5
(Neplus)
WG 13 110–124
4 480 7
ND ND ND ND < 0.02
070069
0.011 ND ND ND 0.021 WG 13 123–123
4 495 0
0.011 < 0.01 ND ND 0.021
070069
< 0.01 ND ND ND < 0.02 1
0.011 ND ND ND 0.021
< 0.01 ND ND ND < 0.02
Sanger, CA, 2007
070069CA6 (Nonpareil)
3
0.011 ND ND ND 0.021

Spinetoram 1751
Application Residue, mg/kg Location,
year (Variety)
Form
g ai/hL
g ai/ha No
Total/ year
g ai/ha
PHI, days
XDE-175-J
XDE-175-L
ND-J
NF-J Total a
Report No.
< 0.01 ND ND ND < 0.02 7
< 0.01 ND ND ND < 0.02
070069
< 0.01 ND ND ND < 0.02 14
< 0.01 ND ND ND < 0.02
070069
a Total residue = XDE-175-J + XDE-175-L + ND-J + NF-J.
Table 34-1 Residues of spinetoram from supervised trials on pecan in the USA (for estimation of maximum residue level)
Application Residue, mg/kg Location, year
(Variety)
Form
g ai/hL g ai/ha No
Total/ season,
g ai/ha
PHI, days XDE-
175-J XDE-175-L
Total a
Report No.
GAP, USA, Tree Nuts
WG 26–123 4 490 14
ND ND < 0.01 Scott, AR,
2007 070069AR
(Stuart)
WG 13 123–126
4 495 7
ND ND < 0.01
070069
ND ND < 0.01 Albany, GA,
2007 070069GA2
(Sumner)
WG 13 122–126
4 495 7
ND ND < 0.01
070069
0.011 ND 0.011 Madill, OK,
2007 070069OK1
(Graking)
WG 13 123 4 492 7
0.010 ND 0.010
070069
0.012 ND 0.012 Mannsville, OK, 2007
070069OK2 (Beckett)
WG 13 122–123
4 491 7
0.010 ND 0.010
070069
0.011 ND 0.011 Claytonville,
TX, 2007 070069TX (Beckett)
WG 13 123–124
4 493 7
0.011 ND 0.011
070069
< 0.01 ND < 0.01 0
0.011 ND 0.011
0.010 ND 0.010 1
0.011 ND 0.011
< 0.01 ND < 0.01 3
< 0.01 ND < 0.01
ND ND < 0.01 7
ND ND < 0.01
ND ND < 0.01
Chula, GA, 2007
070069GA1 (Sumner)
WG 13 123–125
4 496
14
ND ND < 0.01
070069
a Total residue = XDE-175-J + XDE-175-L.

1752 Spinetoram
Table 34-2 Residues of spinetoram and metabolites from supervised trials on pecan in the USA (for estimation of STMR)
Application Residue, mg/kg Location,
year (Variety)
Form g
ai/hL g ai/ha No
Total/ season,
g ai/ha
PHI, days XDE-
175-J XDE-175-
L
ND-J
NF-J Total a
Report No.
GAP, USA, Tree Nuts
WG 26–123
4 490 14
ND ND ND ND < 0.02 Scott, AR,
2007 070069AR
(Stuart)
WG 13 123–126
4 495 7
ND ND ND ND < 0.02
070069
ND ND ND ND < 0.02 Albany, GA,
2007 070069GA2
(Sumner)
WG 13 122–126
4 495 7
ND ND ND ND < 0.02
070069
0.011 ND ND ND 0.021 Madill, OK,
2007 070069OK1
(Graking)
WG 13 123 4 492 7
0.010 ND ND ND 0.020
070069
0.012 ND ND ND 0.022 Mannsville, OK, 2007
070069OK2 (Beckett)
WG 13 122-123
4 491 7
0.010 ND ND ND 0.020
070069
0.011 ND ND ND 0.021 Claytonville,
TX, 2007 070069TX (Beckett)
WG 13 123–124
4 493 7
0.011 ND ND ND 0.021
070069
< 0.01 ND ND ND < 0.02 0
0.011 ND ND ND 0.021
0.010 ND ND ND 0.02 1
0.011 ND ND ND 0.021
< 0.01 ND ND ND < 0.02 3
< 0.01 ND ND ND < 0.02
ND ND ND ND < 0.02 7
ND ND ND ND < 0.02
ND ND ND ND < 0.02
Chula, GA, 2007
070069GA1 (Sumner)
WG 13 123–125
4 496
14
ND ND ND ND < 0.02
070069
a Total residue = XDE-175-J + XDE-175-L + ND-J + NF-J.

Spinetoram 1753
Animal Feedstuffs
Table 35-1 Residues of spinetoram in sugar beet leaves or tops from supervised trials on sugar beet in the USA (for estimation of maximum residue level)
Application Residue, mg/kg Location, year (Variety)
Form
g ai/hL g ai/ha No
Total/ season,
g ai/ha
PHI, days XDE-175-J XDE-
175-L Total a
Report No.
GAP, US, Root
vegetables
SC 53-70 4 281 7
SUGAR BEET TOPS/LEAVES
0.089 0.025 0.114 Olivia, MN, 2004
(Beta)
SC 24–25
70–71 4 282 3
0.055 0.016 0.071
040063
0.153 0.047 0.200 Edgeley, ND, 2004
(Beta)
SC 24–25
70–71 4 281 3
0.097 0.029 0.126
040063
0.073 0.013 0.086 Levelland, TX, 2004
(Wrangler)
SC 19 70–72 4 284 3
0.062 0.013 0.075
040063
0.063 0.013 0.076 Porterville, CA, 2004
(Beta 4030R)
SC 19 70–71 4 283 3
0.081 0.018 0.099
040063
0.589 0.190 0.779 0
0.542 0.172 0.714
0.129 0.038 0.167 1
0.175 0.054 0.229
0.111 0.033 0.144 3
0.122 0.035 0.157
0.024 < 0.01 0.024 7
0.019 < 0.01 0.019
< 0.01 ND < 0.01
Ephrata, WA, 2004
(Blazer)
SC 21 70–71 4 283
14
0.011 ND 0.011
040063
0.085 0.016 0.101 Michigan, 2007 (Not
specified)
SC 21–22 69–72 4 283 3
0.168 0.031 0.199
ARAP 07D-001
a Total residue = XDE-175-J + XDE-175-L.
Table 35-2 Residues of spinetoram and metabolites in sugar beet leaves or tops from supervised trials on sugar beet in the USA (for estimation of STMR)
Application Residue, mg/kg Location, year
(Variety)
Form g
ai/hL g ai/ha No
Total/ season,
g ai/ha
PHI, days XDE-
175-J XDE-175-L
ND-J NF-J Totala
Report No.
GAP, US, Root
vegetables
SC 53-70 4 281 7
SUGAR BEET TOPS/LEAVES
Olivia, MN, SC 24– 70–71 4 282 3 0.089 0.025 0.052 0.069 0.235 040063

1754 Spinetoram
Application Residue, mg/kg Location, year
(Variety)
Form
g ai/hL
g ai/ha No
Total/ season,
g ai/ha
PHI, days XDE-
175-J XDE-175-L
ND-J NF-J Totala
Report No.
2004 (Beta)
25
0.055 0.016 0.046 0.046 0.163
0.153 0.047 0.095 0.101 0.396 Edgeley, ND, 2004
(Beta)
SC 24–25
70–71 4 281 3
0.097 0.029 0.072 0.067 0.265
040063
0.073 0.013 0.101 0.167 0.354 Levelland, TX, 2004
(Wrangler)
SC 19 70–72 4 284 3
0.062 0.013 0.090 0.141 0.306
040063
0.063 0.013 0.175 0.231 0.482 Porterville, CA, 2004
(Beta 4030R)
SC 19 70–71 4 283 3
0.081 0.018 0.165 0.204 0.468
040063
0.589 0.190 0.249 0.144 1.172 0
0.542 0.172 0.214 0.111 1.039
0.129 0.038 0.161 0.271 0.599 1
0.175 0.054 0.165 0.316 0.71
0.111 0.033 0.125 0.343 0.612 3
0.122 0.035 0.125 0.347 0.629
0.024 < 0.01 0.038 0.171 0.233 7
0.019 < 0.01 0.032 0.133 0.184
< 0.01 ND 0.016 0.048 0.074
Ephrata, WA, 2004
(Blazer)
SC 21 70–71 4 283
14
0.011 ND 0.019 0.049 0.079
040063
0.085 0.016 0.174 0.121 0.396 Michigan, 2007 (Not
specified)
SC 21–22
69–72 4 283 3
0.168 0.031 0.261 0.214 0.674
ARAP 07D-001
a Total residue = XDE-175-J + XDE-175-L + ND-J + NF-J.
Table 36-1 Residues of spinetoram and metabolites in almond hulls from supervised trials on almond in the USA
Application Residue, mg/kg Location, year
(Variety)
Form
g ai/hL g ai/ha No
Total/ year
g ai/ha
PHI, days XDE-
175-J XDE-175-L
Total a
Report No.
GAP, USA, Tree Nuts
WG 26–123 4 490 14
0.695 0.135 0.830 Terra Bella, CA, 2007
070069CA1 (Carmel)
WG 13 117–144
4 532 7
0.500 0.101 0.601
070069
0.378 0.083 0.461 Wasco, CA,
2007 070069CA2
(Price)
WG 13 117–130
4 501 7
0.457 0.109 0.566
070069
0.705 0.146 0.851 Earlimart, CA,
2007 070069CA3
(Fritz)
WG 13 117–133
4 491 7
0.358 0.076 0.434
070069

Spinetoram 1755
Application Residue, mg/kg Location, year
(Variety)
Form
g ai/hL g ai/ha No
Total/ year
g ai/ha
PHI, days XDE-
175-J XDE-175-L
Total a
Report No.
1.901 0.419 2.320 Sultana, CA,
2007 070069CA4
(Carmel)
WG 13 123–124
4 494 7
1.394 0.306 1.700
070069
0.737 0.137 0.874 Sanger, CA,
2007 070069CA5
(Neplus)
WG 13 110–124
4 480 7
0.702 0.129 0.831
070069
1.326 0.246 1.572 0
1.366 0.281 1.647
070069
1.182 0.216 1.398 1
1.270 0.234 1.504
070069
0.875 0.173 1.048 3
0.883 0.171 1.054
070069
0.858 0.190 1.048 7
0.883 0.202 1.085
070069
0.525 0.107 0.632
Sanger, CA, 2007
070069CA6 (Nonpareil)
WG 13 123–123
4 495
14
0.616 0.134 0.750
070069
a Total residue = XDE-175-J + XDE-175-L.
Table 36-2 Residues of spinetoram and metabolites in almond hulls from supervised trials on almond in the USA (for estimation of STMR)
Application Residue, mg/kg Location, year
(Variety)
Form
g ai/hL
g ai/ha No
Total/ year
g ai/ha
PHI, days XDE-
175-J XDE-175-
L
ND-J NF-J Total a
Report No.
GAP, USA, Tree Nuts
WG 26–123
4 490 14
0.695 0.135 0.128 0.308 1.27 Terra Bella, CA, 2007
070069CA1 (Carmel)
WG 13 117–144
4 532 7
0.500 0.101 0.086 0.191 0.88
070069
0.378 0.083 0.040 0.051 0.55 Wasco, CA,
2007 070069CA2
(Price)
WG 13 117–130
4 501 7
0.457 0.109 0.046 0.050 0.66
070069
0.705 0.146 0.086 0.102 1.04 Earlimart, CA, 2007
070069CA3 (Fritz)
WG 13 117–133
4 491 7
0.358 0.076 0.039 0.045 0.52
070069
1.901 0.419 0.152 0.177 2.65 Sultana, CA,
2007 070069CA4
(Carmel)
WG 13 123–124
4 494 7
1.394 0.306 0.113 0.124 1.94
070069
0.737 0.137 0.094 0.105 1.07 Sanger, CA,
2007 070069CA5
(Neplus)
WG 13 110–124
4 480 7
0.702 0.129 0.084 0.108 1.02
070069
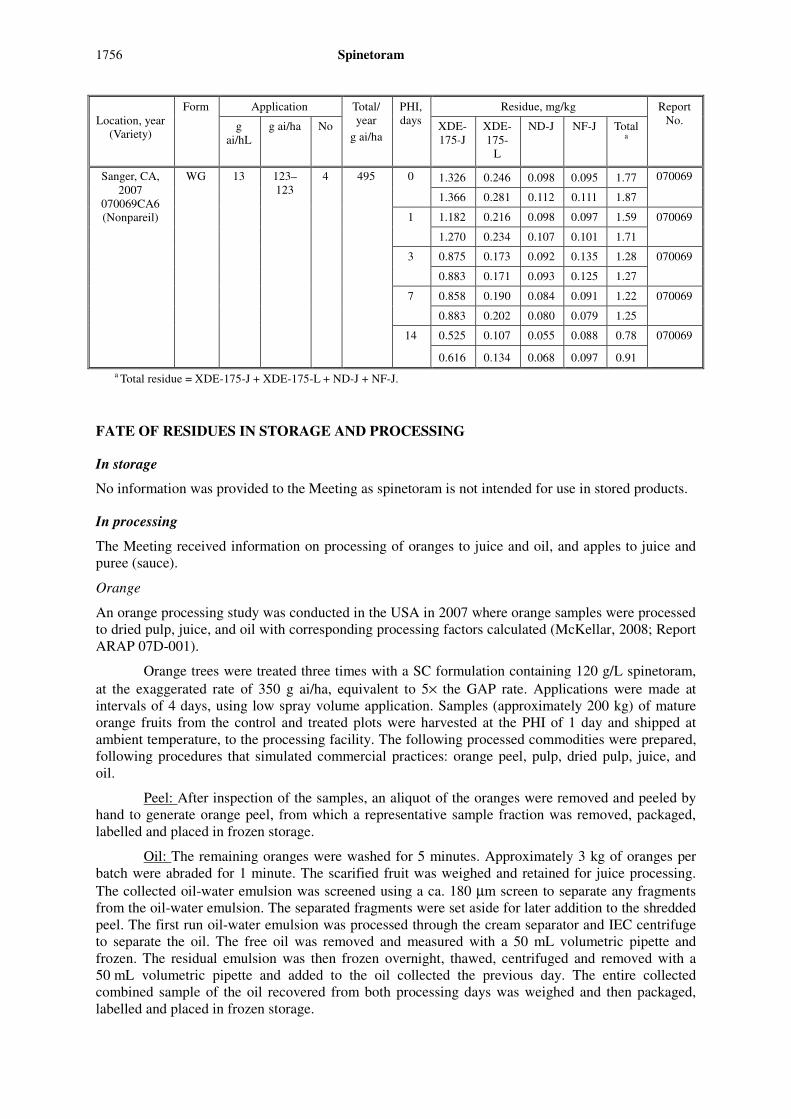
1756 Spinetoram
Application Residue, mg/kg Location, year
(Variety)
Form
g ai/hL
g ai/ha No
Total/ year
g ai/ha
PHI, days XDE-
175-J XDE-175-
L
ND-J NF-J Total a
Report No.
1.326 0.246 0.098 0.095 1.77 0
1.366 0.281 0.112 0.111 1.87
070069
1.182 0.216 0.098 0.097 1.59 1
1.270 0.234 0.107 0.101 1.71
070069
0.875 0.173 0.092 0.135 1.28 3
0.883 0.171 0.093 0.125 1.27
070069
0.858 0.190 0.084 0.091 1.22 7
0.883 0.202 0.080 0.079 1.25
070069
0.525 0.107 0.055 0.088 0.78
Sanger, CA, 2007
070069CA6 (Nonpareil)
WG 13 123–123
4 495
14
0.616 0.134 0.068 0.097 0.91
070069
a Total residue = XDE-175-J + XDE-175-L + ND-J + NF-J.
FATE OF RESIDUES IN STORAGE AND PROCESSING
In storage
No information was provided to the Meeting as spinetoram is not intended for use in stored products.
In processing
The Meeting received information on processing of oranges to juice and oil, and apples to juice and puree (sauce).
Orange
An orange processing study was conducted in the USA in 2007 where orange samples were processed to dried pulp, juice, and oil with corresponding processing factors calculated (McKellar, 2008; Report ARAP 07D-001).
Orange trees were treated three times with a SC formulation containing 120 g/L spinetoram, at the exaggerated rate of 350 g ai/ha, equivalent to 5× the GAP rate. Applications were made at intervals of 4 days, using low spray volume application. Samples (approximately 200 kg) of mature orange fruits from the control and treated plots were harvested at the PHI of 1 day and shipped at ambient temperature, to the processing facility. The following processed commodities were prepared, following procedures that simulated commercial practices: orange peel, pulp, dried pulp, juice, and oil.
Peel: After inspection of the samples, an aliquot of the oranges were removed and peeled by hand to generate orange peel, from which a representative sample fraction was removed, packaged, labelled and placed in frozen storage.
Oil: The remaining oranges were washed for 5 minutes. Approximately 3 kg of oranges per batch were abraded for 1 minute. The scarified fruit was weighed and retained for juice processing. The collected oil-water emulsion was screened using a ca. 180 µm screen to separate any fragments from the oil-water emulsion. The separated fragments were set aside for later addition to the shredded peel. The first run oil-water emulsion was processed through the cream separator and IEC centrifuge to separate the oil. The free oil was removed and measured with a 50 mL volumetric pipette and frozen. The residual emulsion was then frozen overnight, thawed, centrifuged and removed with a 50 mL volumetric pipette and added to the oil collected the previous day. The entire collected combined sample of the oil recovered from both processing days was weighed and then packaged, labelled and placed in frozen storage.

Spinetoram 1757
Juice and peel/pulp: An aliquot of the scarified oranges were weighed and transferred to the juice extractor to recover the juice from the peel. The juice and peel/pulp recovered were weighed and a representative orange pulp sample fraction was removed, packaged, labelled and placed in frozen storage.
The collected juice was transferred to the pulper finisher and screened using ca. 1.19 mm screen to remove vesicular membranes, seeds, segment membranes and peel fragments from the juice. The collected rag and seeds were set aside for later addition to the shredded peel. A representative sample of the fresh filtered juice was removed, packaged, labelled and placed in frozen storage for the required sample fraction. The remaining juice was discarded.
Dried pulp: The peel from the juice extractor was shredded and the shredded peel was combined with the scarified flavedo from the scarification process and the rag and seeds from the juice finisher extraction process to generate wet peel. Lime was added to the wet peel and mixed for 17 minutes. The limed peel was pressed in a fruit press and the expressed liquid weighed, checked for pH and Brix and discarded. The wet peel/pulp was placed on the air drier and dried to below 10% moisture. The dried pulp was milled using a hammermill. A representative sample of the dried pomace was removed, packaged, labelled and placed in frozen storage. The remaining dried pomace was discarded.
All samples were stored up to 87 days before analysis, which is within the storage time of the stability study conducted separately.
Residues of spinetoram and its metabolites were determined in whole orange samples collected from plots treated at 5× the GAP, and each processed fraction prepared, using the method GRM 05.04, with an LOQ and LOD of 0.01 mg/kg and 0.003 mg/kg, respectively.
Residues in orange and processed fractions are summarized in Table 37. Residues are reported as the sum of residues of XDE-175-J, XDE-175-L, N-demethyl-175-J and N-formyl-175-J.
Table 37 Residues of spinetoram and its metabolites in orange and orange processed products
Spinetoram residue Spinetoram + two metabolites Processed
Product Residues
mg/kg
Processing factor
Residues
mg/kg
Processing factor
Reference
Orange (RAC) 0.201 0.280
Peel 0.279 1.4 0.384 1.4
Pulp after juicing 0.061 0.30 0.091 0.33
Dried pulp 0.478 2.4 0.478 2.3
Juice < 0.01 < 0.05 < 0.02 < 0.07
Oil 28.8 143 32.23 115
McKellar, 2008
Report ARAP 07D-001
Apple
Two processing trials on apples were carried out in France in 2005 (Dolder and Schelle, 2006; Report No. 050028). Apple trees were treated with four applications of the WG formulation containing 250 g/kg spinetoram at the rate of 100 g ai/ha. Applications were made at approximately 7-day intervals with a calibrated sprayer simulating a commercial application. Water volumes used were approximately 800–1200 L/ha for apples. Samples were collected 7 days after the last application.
About 60 kg of mature apples were sent to the processing facility for processing into dry pomace, juice, sauce and canned apples. Processing procedures simulated commercial practices. The fruits were washed manually with tap water. The following processed samples were prepared:
Apple juice: The washed apples were crushed in an apple mill and thereafter pressed in a fruit pack press to get wet pomace and raw juice. A part of the wet pomace was dried overnight in an oven and the sample of dry pomace was weighed to determine the dry weight.

1758 Spinetoram
The raw juice was filtered and enzymes were added to the filtered juice. The time and temperature during enzyme treatment was recorded. The cleared juice was filtered once or twice and, after filtration, the clear juice was filled in glass bottles which were closed airtight and pasteurized at 81–89 °C and cooled down. The cooled clear juice samples were stored deep frozen until analysis.
Apple puree: Washed fruits were cut in small pieces before putting them into a stainless steel pot. After adding water to the apples (about 150–200 mL per kg of apples), the mixture was heated until the fruits were soft. The fruits were then passed through a food mill-sieve combination in order to remove the peel and cores. A part of the raw stewed sauce was filled in preserving glass bottles. The glass bottles were closed airtight and pasteurized at 80–89 °C for 30 minutes. After cooling down, the apple puree samples were stored deep frozen until analysis.
Canned apples: Washed fruits were peeled manually with a knife and the peel and cores weighed and removed. The peeled fruits were cut into halves or quarters and filled in suitable glass containers. A heated sugar-water solution was put into the container filled with fruits. The glass containers were then closed airtight and pasteurized for 30–35 minutes at 80–85 °C. After heating, the glass containers were opened and sample of canned fruits taken. After cooling down, the samples were stored deep frozen until analysis.
Residues of spinetoram and metabolites were determined using method GRM 05.04 with an LOQ of 0.01 mg/kg and an LOD of 0.003 mg/kg. The results are summarized in Table 37. Residues reported are the sum of residues of XDE-175-J, XDE-175-L, N-demethyl-175-J, and N-formyl-175-J.
Table 38 Residues of spinetoram and metabolites in apples and processed fractions
Spinetoram residue Spinetoram + two metabolites Processed
product Residues
mg/kg
Processing factor Residues
mg/kg
Processing factor Reference
Apple (RAC) 0.020 0.041
Juice < 0.01 < 0.50 < 0.02 < 0.48
Dry pomace 0.212 10.6 0.331 7.9
Puree (sauce) 0.012 0.60 0.022 0.53
Canned apples < 0.01 < 0.50 < 0.02 < 0.48
Dolder and Schelle, 2008
Report 050028
Apple (RAC) 0.041 0.051
Juice < 0.01 < 0.24 < 0.02 < 0.39
Dry pomace 0.173 5.6 0.210 4.1
Puree (sauce) 0.015 0.29 0.022 0.42
Canned apples < 0.01 < 0.24 < 0.02 < 0.39
Dolder and Schelle, 2008
Report 050028
Mean Mean
Juice < 0.37 < 0.44
Dry pomace 8.1 6.0
Puree (sauce) 0.45 0.47
Canned apples < 0.50 < 0.44
RESIDUES I ANIMAL COMMODITIES
Farm animal feeding studies
Lactating cows
Six groups of lactating Holstein dairy cows (3–5 years old; body weight 474-656 kg at receipt) were dosed daily for 29 consecutive days via gelatine capsules containing spinetoram (Dolder and Schelle, 2007; Report 060052) (Table 39). Each group consisted of at least 3 cows. Four of the groups were dosed with test substance A, containing 26% XDE-175-J, 6% XDE-175-L, 30% N-formyl-175-J and

Spinetoram 1759
28% N-demethyl-175-J. One group was given test substance B containing only XDE-175-J and XDE-175-L (86% total). The remaining group was the control group which was dosed with empty gelatine capsules.
Table 39 Animal Dosing Groups
Dose, ppm in diet
Test Substance A Test Substance B Dose Level Number of
Cows Total a Spinetoram Spinetoram
Control 4 - - -
0.3× 3 1.2 0.4 -
1× 12 3.7 1.3 -
3× 3 11.5 3.8 -
10× 3 38.6 12.9 -
10× 3 - 37.6
a Total dose= sum of XDE-175-J, XDE-175-L, N-demethyl-175-J, and N-formyl-175-J.
Milk was collected twice daily (AM and PM) via surge milking machines and placed into labelled collection containers. The milk from AM and PM milking of each treated animal was pooled in proportion to the amount of milk collected at each of the two daily milkings. Milk samples from the control animals were also pooled in this manner. Only milk from the same cow for a given study day’s AM and PM milking was combined to form a pooled sample. The calculated amounts of PM and AM milk were combined to form the pooled 250 g sample. The average daily milk production in dose groups ranged between 26 and 29 kg during the dosing period.
Milk samples from Days 14 and 28 were separated into cream and skim milk from the three cows each in the control and 1× dose groups that were not designated for use in the depletion phase and the three cows in each of the 10×-A and 10×-B dose groups.
Three cows from each group were sacrificed at the end of a 29-day dosing period in order to determine residue levels in tissues (muscle, fat, liver and kidney). One extra cow in the control group along with nine extra cows in the 1X dose group were used to evaluate residue depletion in milk and tissues during a withdrawal period following the completion of the dosing period. Of the nine cows in the 1× dose group, three cows were assigned to each of three sacrifice dates following completion of the dosing period. The three sacrifice dates in the depletion phase were 14, 28 and 56 days after completion of dosing. The one extra cow in the control group used in the withdrawal phase of the study was sacrificed at 56 days after completion of the dosing period. Samples of liver, kidney, muscle and fat (approximately 1 kg each, if available, of mesenterial, perirenal and subcutaneous) were collected from all animals, cubed, and frozen until analysis. Samples were analysed within 20 days of collection; therefore, no storage stability studies were conducted.
Milk and tissue samples were analysed for residues of XDE-175-J, XDE-175-L, N-formyl-175-J and N-demethyl-175-J by method GRM 6.08 with LOQ of 0.01 mg/kg for each of the analytes.
Residues found in milk samples collected during the dosing phase of the study are summarized in Table 40. No residue was detected in any of the control samples throughout the dosing phase. Residues in the 0.3× dose group were generally between the LOD (0.003 mg/kg) and LOQ (0.01 mg/kg) throughout the dosing period. The average spinetoram residues in milk for study days 10–28 for the 0.3×, 1×, 3×, 10×-A and 10×-B dose groups were < 0.01, 0.018, 0.072, 0.253, and 0.711 mg/kg, respectively. Residues found in milk from cows given the parent compounds only were about three times higher than those in milk from cows given a mixture of the parent, N-demethyl-175-J and N-formyl-175-J, reflecting the ratio of the parent in the test substances.

1760 Spinetoram
Table 40 Mean spinetoram residues in milk during dosing phase
Residues of XDE-175-J and XDE-175-L in milk on specific dosing day (mg/kg) Dose
Group -2 3 7 10 14 16 18 20 22 24 26 28
Control a < 0.01 < 0.01 < 0.01 < 0.01 < 0.01 < 0.01 < 0.01 < 0.01 < 0.01 < 0.01 < 0.01 < 0.01
0.3× < 0.01 < 0.01 < 0.01 < 0.01 < 0.01 < 0.01 < 0.01 < 0.01 < 0.01 < 0.01 < 0.01 < 0.01
1× < 0.01 0.013 0.022 0.021 0.019 0.017 0.019 0.017 0.018 0.018 0.019 0.017
3× < 0.01 0.049 0.065 0.076 0.077 0.071 0.070 0.067 0.076 0.087 0.076 0.080
10×-A < 0.01 0.21 0.20 0.23 0.23 0.17 0.25 0.25 0.37 0.28 0.30 0.29
10×-B < 0.01 0.059 0.69 0.70 0.70 0.69 0.72 0.71 0.73 1.01 0.94 0.87
Residues of XDE-J, XDE-L, N-demethyl-175-J and N-formy-175-J in milk on specific dosing day (mg/kg) Dose
Group -2 3 7 10 14 16 18 20 22 24 26 28
Control a < 0.02 < 0.02 < 0.02 < 0.02 < 0.02 < 0.02 < 0.02 < 0.02 < 0.02 < 0.02 < 0.02 < 0.02
0.3× < 0.02 < 0.02 < 0.02 < 0.02 < 0.02 < 0.02 < 0.02 < 0.02 < 0.02 < 0.02 < 0.02 < 0.02
1× < 0.02 0.023 0.032 0.031 0.027 0.027 0.029 0.027 0.028 0.028 0.029 0.027
3× < 0.02 0.059 0.075 0.086 0.087 0.081 0.080 0.077 0.086 0.097 0.086 0.090
10×-A < 0.02 0.22 0.22 0.26 0.26 0.19 0.28 0.26 0.40 0.30 0.32 0.32
10×-B < 0.02 0.60 0.70 0.71 0.71 0.70 0.73 0.72 0.74 1.02 0.95 0.88 a Includes cows designated for the depletion phase.
Samples from milk collected on days 14 and 28 were separated into skim milk and cream. Table 41 shows a summary of the residues. No residues were detected in skim milk from the 1× dose group. In the 10×-A and 10×-B dose groups average total residues in skim milk ranged from just below the LOQ to 0.075mg/kg. In all of the dose groups on both study days residues in cream were much higher than the residues in skim milk. Mean total residues from the 1× dose group in cream were 0.187 and 0.231 mg/kg. Mean total residues in the 10×-A and 10×-B groups ranged 0.64–1.95 and 3.11–5.84 mg/kg. These results indicate that residues of spinetoram in whole milk preferentially partition into cream. The median ratio of spinetoram residues in cream to those in whole milk is 6.6.
Table 41 Mean spinetoram residues in skim milk and cream
Residues of XDE-175-J and XDE-175-L on specific dosing day (mg/kg)
Whole Milk Cream Skim Milk Dose
Group Day 14 Day 28 Day 14 Day 28 Day 14 Day 28
1X 0.027 0.023 0.177 0.221 < 0.01 < 0.01
10X-A 0.12 0.29 0.616 1.84 < 0.01 0.028
10X-B 0.70 0.87 3.09 5.81 0.060 0.065
Residues of XDE-J, XDE-L, N-demethyl-175-J and N-formy-175-J on specific dosing day (mg/kg)
Whole Milk Cream Skim Milk Dose
Group Day 14 Day 28 Day 14 Day 28 Day 14 Day 28
1X 0.037 0.033 0.187 0.231 < 0.02 < 0.02
10X-A 0.13 0.32 0.642 1.95 < 0.02 0.038
10X-B 0.71 0.88 3.11 5.84 0.070 0.075

Spinetoram 1761
Residues found in kidney, liver, muscle, and fat samples collected from animals sacrificed upon completion of the dosing phase are presented in Table 42. With one exception, no residues were detected in the control samples. One kidney control sample contained residues below the LOQ possibly due to contamination. All tissues from treated cows contained residues and they increased from the lowest to highest dose groups. Residue concentrations were lowest in the muscle followed by kidney, liver, and fat. Residues in fat were significantly higher than residues in the other tissues. Across all the dose levels the mesenterial and perirenal fat samples had similar residue concentrations which were roughly twice the concentrations found in the subcutaneous fat. As expected, the composite fat samples, which consisted of equal parts of the three fats collected, yielded residues very close to the average residue concentration found in the three fats. These results indicate that residues of spinetoram tend to accumulate in fatty tissue.
Table 42 Spinetoram residues in kidney, liver, muscle and fat following a dosing period of 29 days
Residues of XDE-J and XDE-L on specific dosing day (mg/kg) Dose
Group Kidney Liver Muscle Subcutaneous
Fat
Mesenterial
Fat
Perirenal
Fat
Composite
Fat1
Control < 0.01 < 0.01 < 0.01 < 0.01 < 0.01 < 0.01 < 0.01
< 0.01 < 0.01 < 0.01 < 0.01 < 0.01 < 0.01 < 0.01
< 0.01 < 0.01 < 0.01 < 0.01 < 0.01 < 0.01 < 0.01
0.3× < 0.01 < 0.01 < 0.01 0.077 0.093 0.10 0.082
< 0.01 < 0.01 < 0.01 0.063 0.10 0.11 0.11
< 0.01 < 0.01 < 0.01 0.021 0.10 0.091 0.075
Maximum < 0.01 < 0.01 < 0.01 0.077 0.10 0.11 0.11
Mean < 0.01 < 0.01 < 0.01 0.054 0.10 0.10 0.090
1× 0.016 0.057 < 0.01 0.087 0.44 0.50 0.38
0.040 0.052 0.043 0.52 0.59 0.69 0.55
0.011 0.040 < 0.01 0.14 0.29 0.34 0.26
Maximum 0.040 0.057 0.043 0.52 0.59 0.69 0.55
Mean 0.022 0.050 0.021 0.25 0.44 0.51 0.39
3× 0.074 0.11 0.086 0.74 1.22 1.41 1.25
0.068 0.11 0.019 0.57 0.83 0.64 0.39
0.048 0.11 0.010 0.035 0.25 0.20 0.13
Maximum 0.074 0.11 0.086 0.74 1.22 1.41 1.25
Mean 0.063 0.11 0.038 0.45 0.76 0.75 0.59
10×-A 0.29 0.47 0.082 0.15 0.29 0.84 0.35
0.25 0.41 0.13 1.14 3.54 3.07 2.68
0.30 0.21 0.24 2.96 3.69 3.64 3.26
Maximum 0.30 0.47 0.24 2.96 3.69 3.64 3.26
Mean 0.28 0.36 0.15 1.42 2.51 2.52 2.10
10×B 1.74 1.29 0.53 8.69 11.23 16.52 15.29
0.81 0.62 0.49 4.69 8.37 11.04 9.72
1.01 2.39 0.41 2.32 9.22 14.77 8.85
Maximum 1.74 2.39 0.53 8.69 11.23 16.52 15.29
Mean 1.19 1.43 0.48 5.24 9.61 14.14 11.28

1762 Spinetoram
Residues of XDE-J, XDE-L, N-demethyl-175-J and N-formy-175-J on specific dosing day (mg/kg) Dose
Group Kidney Liver Muscle Subcutaneous
Fat
Mesenterial
Fat
Perirenal
Fat
Composite
Fat a
Control < 0.02 < 0.02 < 0.02 < 0.02 < 0.02 < 0.02 < 0.02
< 0.02 < 0.02 < 0.02 < 0.02 < 0.02 < 0.02 < 0.02
< 0.02 < 0.02 < 0.02 < 0.02 < 0.02 < 0.02 < 0.02
0.3× < 0.02 < 0.02 < 0.02 0.087 0.10 0.11 0.092
< 0.02 0.010 < 0.02 0.073 0.11 0.12 0.12
< 0.02 < 0.02 < 0.02 0.031 0.11 0.10 0.085
Maximum < 0.02 < 0.02 < 0.02 0.087 0.11 0.12 0.12
Mean < 0.02 < 0.02 < 0.02 0.064 0.10 0.11 0.10
1× 0.043 0.10 < 0.02 0.097 0.46 0.53 0.40
0.075 0.095 0.053 0.54 0.61 0.72 0.57
0.036 0.092 < 0.02 0.15 0.30 0.36 0.27
Maximum 0.075 0.10 0.053 0.54 0.61 0.72 0.57
Mean 0.052 0.097 0.031 0.26 0.46 0.54 0.41
3× 0.13 0.22 0.11 0.81 1.29 1.49 1.32
0.12 0.19 0.029 0.60 0.86 0.66 0.40
0.091 0.21 0.033 0.045 0.27 0.23 0.15
Maximum 0.13 0.22 0.11 0.81 1.29 1.49 1.33
Mean 0.12 0.20 0.057 0.48 0.81 0.79 0.63
10×-A 0.57 0.93 0.17 0.18 0.34 0.95 0.42
0.44 0.73 0.18 1.22 3.72 3.23 2.80
0.40 0.36 0.29 3.12 3.89 3.84 3.44
Maximum 0.57 0.93 0.29 3.12 3.89 3.84 3.44
Mean 0.47 0.68 0.21 1.51 2.65 2.67 2.22
10×-B 1.80 1.37 0.54 8.75 11.29 16.61 15.36
0.84 0.66 0.50 4.71 8.41 11.08 9.76
1.08 2.57 0.44 2.36 9.30 14.84 8.92
Maximum 1.80 2.57 0.54 8.75 11.29 16.61 15.36
Mean 1.24 1.54 0.50 5.28 9.67 14.18 11.34 a Contained equal parts of subcutaneous, mesenterial, and perirenal fats.
Residues found in milk samples collected from cows during the depletion phase are shown in Table 43. With one exception, residues were not detectable in milk by the fourth day after the last dose was administered. Concentrations just above the LOD were detected in one cow through the ninth day after the final dose. No further residue was detected beyond that point. No residue was ever detected in milk from the cow in the control group.
Table 43 Residues of spinetoram in milk during the depletion phase
Residues of XDE-J, XDE-L, N-demethyl-175-J and N-formy-175-J on days after final dose (mg/kg)
0 2 4 6 9 13 20 27 34 41 48 55 Dose
Group (29) (31) (33) (35) (38) (42) (49) (56) (63) (70) (77) (84)
Control < 0.02 < 0.02 < 0.02 < 0.02 < 0.02 < 0.02 < 0.02 < 0.02 < 0.02 < 0.02 < 0.02 < 0.02
1X 0.036 < 0.02 < 0.02 < 0.02 < 0.02 < 0.02 - - - - - -
0.029 < 0.02 < 0.02 < 0.02 < 0.02 < 0.02 - - - - - -
0.020 < 0.02 < 0.02 < 0.02 < 0.02 < 0.02 - - - - - -

Spinetoram 1763
Residues of XDE-J, XDE-L, N-demethyl-175-J and N-formy-175-J on days after final dose (mg/kg)
0 2 4 6 9 13 20 27 34 41 48 55 Dose
Group (29) (31) (33) (35) (38) (42) (49) (56) (63) (70) (77) (84)
0.025 < 0.02 < 0.02 < 0.02 < 0.02 < 0.02 < 0.02 < 0.02 - - - -
0.024 < 0.02 < 0.02 < 0.02 < 0.02 < 0.02 < 0.02 < 0.02 - - - -
0.027 < 0.02 < 0.02 < 0.02 < 0.02 < 0.02 < 0.02 < 0.02 - - - -
0.024 < 0.02 < 0.02 < 0.02 < 0.02 < 0.02 < 0.02 < 0.02 < 0.02 < 0.02 < 0.02 < 0.02
0.029 < 0.02 < 0.02 < 0.02 < 0.02 < 0.02 < 0.02 < 0.02 < 0.02 < 0.02 < 0.02 < 0.02
0.026 < 0.02 < 0.02 < 0.02 < 0.02 < 0.02 < 0.02 < 0.02 < 0.02 < 0.02 < 0.02 < 0.02
Mean 0.027 < 0.02 < 0.02 < 0.02 < 0.02 < 0.02 < 0.02 < 0.02 < 0.02 < 0.02 < 0.02 < 0.02
Days in parentheses are days after the beginning of dosing period.
Residues found in kidney, liver, muscle, and fat samples collected during the depletion phase are presented in Table 44. Residue concentrations were lowest in the muscle followed by kidney, liver, and fat. On the day the last dose was given, the mesenterial and perirenal fat samples had similar residue concentrations which were roughly twice the concentrations found in the subcutaneous fat. However, in the fat samples taken 14 days after the last dose was given, the residue in the subcutaneous fat was higher than in the other two fat samples. As expected, the composite fat samples, which consisted of equal parts of the three fats collected, yielded residues very close to the average residue concentration found in the three fats. Residue decline continued through 28-days after the last dose. No residue was detected in kidney, liver or muscle from any cow by 28 days after the final dose or in fat 56 days following the final dose.
Table 44 Residues of spinetoram in tissues during the depletion phase
Residues of XDE-J, XDE-L, N-demethyl-175-J and N-formy-175-J on days after final dose (mg/kg) Days After
Final Dose
Study
Day Kidney
Liver
Muscle
Sub. Fat
Mes. Fat
Per. Fat
Comp. Fat
0 29 0.043 0.103 0.020 0.097 0.46 0.53 0.40
0 29 0.075 0.095 0.053 0.55 0.61 0.72 0.57
0 29 0.036 0.092 0.023 0.15 0.30 0.36 0.27
Mean 0.052 0.097 0.032 0.26 0.46 0.54 0.41
14 43 < 0.02 < 0.02 < 0.02 0.26 0.23 0.14 0.22
14 43 < 0.02 < 0.02 < 0.02 0.051 < 0.02 0.021 < 0.02
14 43 < 0.02 < 0.02 < 0.02 0.10 0.055 0.026 0.063
Mean < 0.02 < 0.02 < 0.02 0.14 0.10 0.062 0.10
28 57 < 0.02 < 0.02 < 0.02 0.022 0.022 < 0.02 < 0.02
28 57 < 0.02 < 0.02 < 0.02 < 0.02 < 0.02 < 0.02 < 0.02
28 57 < 0.02 < 0.02 < 0.02 0.044 0.024 0.023 0.037
Mean < 0.02 < 0.02 < 0.02 0.029 0.022 < 0.02 0.025S
56 85 < 0.02 < 0.02 < 0.02 < 0.02 < 0.02 < 0.02 < 0.02
56 85 < 0.02 < 0.02 < 0.02 < 0.02 < 0.02 < 0.02 < 0.02
56 85 < 0.02 < 0.02 < 0.02 < 0.02 < 0.02 < 0.02 < 0.02
Mean < 0.02 < 0.02 < 0.02 < 0.02 < 0.02 < 0.02 < 0.02
Control
56 85 < 0.02 < 0.02 < 0.02 < 0.02 < 0.02 < 0.02 < 0.02
Cattle, except those in the control group, were dosed with a total dose of 3.7 ppm in the diet.
Note: Residues are reported as sum of XDE-175-J, XDE-175-L, N-demethyl-175-J and N-formyl-175-J concentrations. All concentrations are reported in mg/kg.

1764 Spinetoram
Laying hens
The Meeting received no information on poultry feeding studies.
ADDITIONAL INFORMATION
The currently existing national residue definitions for plant and animal commodities are:
Australia: XDE-175-J and XDE-175-L;
Canada: XDE-175-J, XDE-175-L, N-demethyl-175-J and N-formyl-175-J (for risk assessment in poultry commodities, 3’-O-deethyl-175-J and L, and O-demethyl-175-L are added) ;
New Zealand: XDE-175-J and XDE-175-L; and
USA: XDE-175-J, XDE-175-L, N-demethyl-175-J and N-formyl-175-J ;
APPRAISAL
Spinetoram, a multi-component tetracyclic macrolide in the class of spinosyn insecticides, consists of two components shown below, present approximately in a three to one ratio. It was identified as a priority new compound at the 39th Session of the CCPR in 2007 (ALINORM 07/30/24—Rev.1) for evaluation by the 2008 JMPR. The Meeting received information on physical and chemical properties, animal and plant metabolism, environmental fate, analytical methods, storage stability, use patterns, supervised trials, processing and farm animal feeding.
H
O
O
O O H
C H 3
H H H
O
O
O
O
O
O
N
O
O
O
O
H
O
O
O
O H
CH3
H HH
O
O
N
XDE-175-J (Major component) XDE-175-L (Minor component)
In this appraisal, the following abbreviated names were used for metabolites:
H
O
O
O
O H
CH3
H HH
O
O
O
O
O
O
N
H
H
O
O
O
O H
CH3
H HH
O
O
O
O
O
O
N
O
H
H
O
O
O
O H
CH3
H HH
O
O
O
O
OH
O
N
N-demethyl-175-J N-formyl-175-J 3’-O-deethyl-175-J

Spinetoram 1765
OH
O
H
O
O
O
O H
CH3
H HH
O
O
O
O
N
H
O
O
O
O H
CH3
H HH
O
O
O
OH
O
O
N
H
O
O
O
O H
CH3
H HH
O
O
O
O
O
O
N
H
2’-O-demethyl-175-J 4’-O-demethyl-175-J N-demethyl-175-L
H
O
O
O
O H
CH3
H HH
O
O
O
O
O
O
N
O
H
O
O
OH
O
OH
O
O
O
O H
CH3
H HH
O
N
O
O
O
OH
OH
O
O
O
O H
CH3
H HH
O
N
N-formyl -175-L 3’-O-deethyl-175-L 2’-O-demethyl-175-L
O
OH
O
O
H
O
O
O
O H
CH3
H HH
O
O
N
4’-O-demethyl-175-L
Animal metabolism
The Meeting received information on the fate of orally-dosed spinetoram in lactating goats and laying hens.
When either 14C-XDE-175-J or 14C-XDE-175-L, uniformly labelled with 14C in the macrolide ring, was administered orally at a dose equivalent to a dietary concentration of 10–11 ppm to a lactating goat once a day for five consecutive days, 51% or 78% of the administered dose of 14C-XDE-175-J or 14C-XDE-175-L, respectively, were recovered in faeces. Radioactivity recovered in urine was insignificant; less than 0.2% of the administered dose.
Radioactivity started to appear in milk within 24 hours after the first application but cumulative milk sample contained only about 0.3% of the total administered dose of 14C-XDE-175-J or 0.2% of that of 14C-XDE-175-L. The maximum total radioactive residues were 0.047 mg/kg in parent equivalents for 14C-XDE-175-L and 0.039 mg/kg 14C-XDE-175-L.
Total radioactive residues (TRR) in tissues after sacrifice (21 h after the last dose) showed the tendency to be higher in fatty tissues, with 0.235 mg/kg and 0.119 mg/kg in parent equivalents in fat (after the administration of 14C -XDE-175-J and 14C-XDE-175-L, respectively), and 0.116 mg/kg and 0.099 mg/kg in liver. TRR in kidney, muscle and milk were much lower.
The primary residue was XDE-175-J or XDE-175-L (42–84% of TRR) in all tissues and milk, except liver, indicating that minimal metabolism had occurred. In liver, XDE-175-J or XDE-175-L was the primary residue but at lower levels (30 or 26% of TRR) with N-demethyl-175-J or -L at very low levels (< 2% of the TRR), and an unidentified metabolite. No residue components other than the unchanged parent compounds were identified in milk, kidney or fat. Radioactive residues in muscle

1766 Spinetoram
also consisted primarily of XDE-175-J or XDE-175-L and much lesser amounts of what seemed to be the same unidentified metabolite as found in liver. There were many minor metabolites detected but all were less than 10% of the TRR. Unextracted radioactivity was less than 15% of the TRR in all samples except liver in which it was around 25%.
When either 14C-XDE-175-J or 14C-XDE-175-L, (uniformly labelled with 14C in the macrolide ring), was administered orally at a dose equivalent to a dietary concentration of 10 ppm to a group of laying hens once a day for seven consecutive days, 93% or 91% of the administered dose of 14C-XDE-175-J or 14C-XDE-175-L, respectively, were recovered in excreta.
Eggs and tissues contained a low proportion of the administered dose (< 3%) for both 14C-XDE-175–J and 14C-XDE-175-L. TRR in eggs increased over the experimental period and reached a maximum of 0.20 and 0.49 mg/kg for 14C-XDE-175-J and 14C-XDE-175-L, respectively, on day 7. TRR in the tissues were highest in abdominal fat (1.04 mg/kg for XDE-175-J, and 2.46 mg/kg for XDE-175-L), followed by skin with subcutaneous fat, liver, eggs and muscle. There is a tendency for radioactivity to be found at higher levels in tissues with higher fat content.
Unchanged XDE-175-J or XDE-175-L remained as the primary residue in the egg (58–49%) and tissues (45–70% of TRR) other than liver (13–12%). 3’-O-deethyl-175-J was detected in abdominal fat (1.8% of TRR) and in liver (18%) and O-demethyl-175-J was present in all tissues (3.2–6.5% of TRR) while 3’-O-deethyl-175-L and O-demethyl-175-L were found in all tissues and eggs (5.2–13% and 13–20% of TRR respectively). Unextracted radioactivity was less than 7% of the TRR in all samples except muscle and eggs in which it was 12–20%.
Limited metabolism of spinetoram was observed in ruminants and hens as the unchanged parent compound was the primary residue component in milk and all ruminant tissues as well as eggs and all avian tissues except liver for both XDE-175-J and XDE-175-L. Metabolism of spinetoram appears to be primarily through demethylation of the N-dimethyl moiety on the forosamine sugar to give the N-demethyl metabolite (goat) and dealkylation of the rhamnose sugar to give the O-deethyl and/or O-demethyl (two possible isomers) metabolites (hen).
Plant metabolism
The Meeting received information on the fate of spinetoram after foliar applications of 14C-XDE-175-J or 14C-XDE-175-L, uniformly labelled with 14C in the macrolide ring, on apple, lettuce and turnip representing the fruits, leafy crops and root crops respectively.
In all three crops tested, applied parent compounds decreased over test period. Among the two spinetoram components, XDE-175-L tended to be metabolized faster than XDE-175-J.
Apple
When a branch of apple tree with immature fruits was treated with single foliar application of either 14C-XDE-175-J or 14C-XDE-175-L at the rate of 1.8 kg ai/ha (4.8×) or 1.1 kg ai/ha (8.9×), respectively, apple fruits harvested seven days (PHI in US GAP) after the application contained 1.2 mg/kg or 0.36 mg/kg of radioactive residues. Washing of fruits (0–30 DAT) with acetonitrile and then dichloromethane removed 63–97% of TRR.
In the case of XDE-175-J application, in apples taken seven DAT, the parent compound was the major residue at 43% of the TRR with N-demethyl-175-J at 9.5% and N-formyl-175-J at 5.1% of the TRR. After the treatment with XDE-175-L, the parent compound was extensively degraded and metabolized and only 1.3% of the TRR remained as the parent compound with 1.0% of the TRR as N-demethyl-175-L and another 1.0% as N-formyl-175-L.
In the washed fruits obtained from the 14C-XDE-175-J treated branch, peels contained 2–11% of TRR while pulp contained less than 1% (≤ 0.007 mg/kg). In washed fruits from 14C-XDE-175-L treated branch, peel contained 6–33% of TRR while pulp contained less than 4%.
Unextractable radioactive residues were < 10% of TRR in or on all samples after extraction with a mixture of acetonitrile and water (80:20, v/v). Several minor metabolites were also detected in

Spinetoram 1767
the treated apples and leaves, each at ≤ 7.5% of TRR. A multi-component mixture of extensively degraded compounds represented up to 39–77% of TRR but each component was less than 1% of TRR.
Comparison of radioactivity in treated fruits and shielded fruits indicates that translocation was negligible.
Lettuce
Red leaf lettuce was treated with either single or multiple foliar spray applications of 14C-XDE-175-J or 14C-XDE-175-L. For 14C-XDE-175-J, single applications were made at rates equivalent to 0.90 kg ai/ha while the same amount of the test compound was sprayed in three separate applications with the equal rate at weekly intervals. For 14C-XDE-175-L, plants were treated in a similar fashion but at a rate equivalent to 0.30 kg ai/ha. For both compounds, the applied amounts approximately correspond to four times the maximum seasonal rate on the label and reflect the ratio between XDE-175-J and XDE-175-L in spinetoram formulations.
Washing leaves (0-7 DAT) with dichloromethane and then acetonitrile removed 76–96% of TRR.
The lettuce samples taken one day (PHI in US GAP) after the single application of XDE-175-J or XDE-175-L contained 34 mg/kg in parent equivalents or 7.6 mg/kg of radioactive residues, respectively. For treatment with XDE-175-J, the parent was 31%, N-demethyl-175-J was 20% and N-formyl-175-J was 11% of the TRR. For treatment with XDE-175-L, the parent was 12%, N-demethyl-175-L was 7.2% and N-formyl-175-L was 4.0% of the TRR. With the multiple applications, both TRR and percentage of these three compounds tended to be lower than with single applications of the same total rate for both parent compounds. Only 0.2–5.2% of TRR remained unextractable in all treated lettuce samples after extraction with acetonitrile/water (75:25, v/v).
Several minor metabolites were observed in the 14C-XDE-175-J and 14C-XDE-175-L treated lettuce at ≤ 6% of TRR. A multi-component mixture of extensively degraded compounds represented up to 13–78% of TRR, each component at less than 3% of TRR.
Turnip
Turnips were treated with either a single or multiple foliar applications of 14C-XDE-175-J or 14C-XDE-175-L in the same manner as in the lettuce study. In turnip roots harvested three days after the application, TRR was quite low at 0.12 mg/kg for XDE-175-J treatment and 0.031 mg/kg for XDE-175-L treatment.
In 14C-XDE-175-J treated turnip tops, 59–91% of TRR were surface residues found in the dichloromethane and acetonitrile washings. In 14C-XDE-175-L treated turnip tops, surface residues were 39–80% of TRR.
Major components identified at three DAT were the parent compounds (XDE-175-J and -L), N-dimethyl-175-J and N-formyl-175-J in roots and tops but all less than 25% of the TRR.
Several minor metabolites assumed to be structurally similar to the parent compound were also observed in treated turnip roots and tops, each less than 4% of TRR. A multi-component mixture of extensively degraded compounds represented 10–74% of TRR; each compound at less than 1% TRR.
Metabolism of spinetoram was observed to be similar in the three crops studied—apple, lettuce and turnip—indicating that a common metabolism is expected for not only fruits, leafy vegetables and root vegetables but also other plants. It appears that three metabolic pathways are responsible for the breakdown of spinetoram in plants. The first one involves changes to the N-demethyl moiety on the forosamine sugar to give the N-demethyl and N-formyl metabolites. N-formyl metabolites were found only in plants. The second involves cleavage of the macrolide ring system at one or more positions, ultimately resulting in a complex residue mixture consisting of numerous components. The third, (applicable only to XDE-175-J), involves changes to the rhamnose sugar

1768 Spinetoram
producing the 3-O-deethyl and C9-pseudoaglycone-175-J metabolites. All the metabolites occurring as a result of changes in forosamine and rhamnose are further degraded via the second pathway.
Environmental fate in soil
The Meeting reviewed information on aerobic soil metabolism, aqueous photolysis and hydrolysis, and rotational crop study, as spinetoram was intended for protection of root vegetables.
Aerobic soil metabolism
Aerobic soil metabolism studies were conducted using 14C-XDE-175-J or 14C-XDE-175-L, uniformly labelled with 14C in the macrolide ring applied to various soils and incubated under aerobic conditions at 25, 20 or 10 °C. Under aerobic conditions, spinetoram applied to soil was degraded relatively rapidly. In all soils tested, XDE-175-L was degraded faster than XDE-175-J. After one year of incubation at 25 °C, 1.2–2.8% and 0.3–2.9% of applied XDE-175-J and XDE-175-L respectively, remained as the parent in US soils tested. In European soils (except the loamy sand), after 127 days of incubation at 20 °C, 2.0–4.9% and 1.4–5.0% of applied XDE-175-J and XDE-175-L respectively remained as the parent. Carbon dioxide was evolved slowly from all soils and accounted for 5.0–35% and 9.5–32% of the applied XDE-175-J and XDE-175-L respectively after one year at 25 °C, and 0.8–1.1% and 1.2–3.2% of the applied XDE-175-J and XDE-175-L respectively after 127 days at 20 °C.
Major degradation products, N-demethyl-175-J and N-demethyl-175-L were formed and then degraded during the study periods. As minor products (at or less than 10% of the applied dose), N-demethyl-N-nitroso-175-J, N-demethyl-N-nitroso-175-L, N-succinyl-175-J and N-succinyl-175-L were also formed and degraded. Many other degradates were formed but at very low concentrations.
While extractable radioactivity decreased, non-extractable radioactivity steadily increased to reach 22–29% and 32–37% of the applied XDE-175-J and XDE-175-L respectively after one year at 25 °C; and 5–15% and 11–24% of the applied XDE-175-J and XDE-175-L respectively after 127 days at 20 and 10 °C.
Aqueous photolysis
Under xenon light (simulating 40°N latitude summer sunlight) in aqueous buffer solution at pH 7 at 25 °C, XDE-175-J and XDE-175-L degraded rapidly with DT50 of 0.5 days and 0.3 days respectively. Numerous (more than 70) minor degradates were observed after irradiation of XDE-175-J and -L. N-demethyl-175-L was observed as a major photodegradation product of XDE-175-L.
At test termination, greater than 90% of the applied amount remained as parent in the dark controls indicating that negligible transformation of the parent compounds occurred in the dark. No degradates were observed in the dark controls.
Aqueous hydrolysis
In sterile aqueous buffer solutions at pH 5 and 7, no degradation was observed for both XDE-J and XDE-175-L for 30 days at 20 °C. At pH 9, a degradate of XDE-175-J was observed but the concentration of XDE-175-J did not decrease below 89% and therefore, XDE-175-J can be regarded to be relatively stable, also at pH 9. After 30 days at pH 9, XDE-175-L decreased from 92% to 82% with N-demethyl-175-L as the major degrade at 12% at the end of the testing period. No minor degradates were detected. DT50 of XDE-175-L at pH 9 was calculated to be 154 days.
Residues in succeeding crops
In an outdoor confined rotation study, radish, lettuce and wheat were planted at 30, 120 and 365 days after the application of 14C-XDE-175-J or 14C-XDE-175-L at rate of 405 or 135 g ai/ha respectively to soil corresponding to the maximum seasonal rate and reflecting the ratio of these two active ingredients in spinetoram formulations.

Spinetoram 1769
TRRs were very low for all samples at all plant back intervals with the maximum at 0.085 mg/kg in parent equivalents. Unextractable residues in crops were less than 0.019 mg/kg.
Extraction of residues indicated that no greater than 0.065, 0.004 and 0.007 mg/kg were found in the neutral organic phases, acidic organic phases, and in the extracted aqueous phase, respectively. In any immature or mature sample, no single component exceeded 0.025 mg/kg or 0.007 mg/kg, respectively. At 120 DAT and 365 DAT, no radioactive residues were associated with any of XDE-175-L, N-demethyl-175-L or N-formyl-175-L. Of the XDE-175-J treated 120 DAT and 365 DAT crop samples, radish (immature tops and mature tops), lettuce (immature), and wheat forage, hay, and straw contained TRR greater than 0.010 mg/kg, but the concentrations were too low for identification. The lower residues in 30 DAT samples were characterized, but could not be identified.
The levels of radioactivity taken up from soil treated with [14C]spinetoram into the three succeeding crops (radish, lettuce, and wheat) planted 30, 120, or 365 days after treatment, were below 0.085 mg/kg spinetoram equivalents. Since such low radioactive residues were found in analysed fractions of these rotational crop samples, spinetoram is unlikely to be taken up readily by succeeding crops.
Methods of analysis
Analytical methods for determination of residues of spinetoram and its metabolites were developed for a wide range of matrices of plant and animal origin. In general, these methods employ extraction of spinetoram and its metabolites with a mixture of acetonitrile and water (80:20, v/v), addition of a stable isotope internal standard solution containing XDE-175 and metabolites, and then, without any clean-up or with solid phase clean-up using a C18 cartridge, analysis with HPLC with positive-ion electrospray tandem mass spectrometry (LC-MS/MS). Three methods, two for plant matrices and one for animal matrices, are capable of determining XDE-175-J, XDE-175-L, N-demethyl-175-J and -L, and N-formyl-175-J and -L. One method for animal matrices, however, determines XDE-175-J, XDE-175-L, N-demethyl-175-J and -L, and 3’-O-deethyl-175-J and -L.
The methods for plant matrices were validated for each analyte at 0.01–1.0 mg/kg, and in the case of lettuce at 0.01–10 mg/kg. Mean recovery was in a range of 82–111%. The validated limit of quantification was 0.01 mg/kg for all matrices.
The methods for animal matrices were validated for each analyte at 0.01–15 mg/kg in bovine muscle and kidney; 0.01–0.10 mg/kg in poultry muscle; 0.01–50 mg/kg in liver, milk and cream, and eggs; and 0.01–150 mg/kg in fat. Mean recovery ranged between 83 and 119%. The validated limit of quantification was 0.01 mg/kg for all matrices.
The existing multi-residue enforcement methods, FDA PAM I screen methods, were found to be unsuitable for the determination of spinetoram and its metabolites in plant and animal matrices. The DFG S19 multi-residue method was validated successfully only for the determination of spinetoram and its N-demethyl and N-formyl metabolites in apples, grapes and oranges.
Stability of pesticide residues in stored analytical samples
Stability of spinetoram and its N-demethyl and N-formyl metabolites (each at a fortification level of 0.10 ppm) in homogenized orange, lettuce, sugar beet, soya bean and wheat grain stored in deep freezer at –20 °C was investigated over 12 months. No significant decrease of spinetoram was observed in all samples, except lettuce, during the test period. In lettuce, remaining XDE-175-L and N-dimethyl-175-L were 60 and 65% respectively (unadjusted for procedural recovery) at 372 days after initiation of the study.
The Meeting concluded that at –20 °C, spinetoram and its N-demethyl and N-formyl metabolites were stable for 12 months in orange, sugar beet, soya bean and wheat. In lettuce, XDE-175-J, the major component, and its N-demethyl and N-formyl metabolites were also stable for 12 months but XDE-175-L and N-dimethyl-175-L were stable only up to eight months.

1770 Spinetoram
As samples of animal tissues, milk and eggs from the metabolism and feeding studies were analysed within 20 days of sample collection in supervised trials, no information was provided to the Meeting on storage stability of spinetoram in animal commodities.
Residue definition
Spinetoram consists of two closely related active ingredients, XDE-175-J and XDE-175-L, present approximately in a three to one ratio.
In apple, lettuce and turnip receiving 4× to 9× the rate of either of the two active ingredients, major metabolites were the parent compounds (XDE-175-J and XDE-175-L), N-demethyl-175-J and N-formyl-175-J. In most cases, PHI XDE-175-J was the primary component of residues. N-demethyl-175-L and N-formyl-175-L were also detected but no more than 7.2% and 4.0% respectively of TRR on one DAT or thereafter.
In goats and hens, metabolism of spinetoram was limited. The parent compounds remained as major components in milk and all ruminant tissues as well as eggs, and all avian tissues except liver, in which 3’-O-deethyl metabolites were detected at similar levels as the parent, but less than 20%.
Sufficiently validated LC-MS/MS methods were available for determining the parent compounds and their N-demethyl and N-formyl metabolites in a wide range of plant commodities and animal tissues, milk and eggs.
Based on the above findings, the Meeting considered that the two parent compounds, XDE-175-J and XDE-175-L, were suitable residues for enforcement. However, as N-demethyl-175-J is a major metabolite in both plants and animals and covered by the ADI, and N-formyl-175-J, a major metabolite in plants, is also found in crops after application of spinetoram, the Meeting decided to include these two metabolites as well as the two spinetoram components in the residue definition for estimation of dietary intake.
XDE-175-J and XDE-175-L have logPow of 4.09 and 4.49 respectively at pH 7 at 20 °C, implying that spinetoram may be fat-soluble. In animal metabolism studies, residue concentrations were found to be higher in tissues with higher fat content. In addition, an animal feeding study with lactating cows indicates that spinetoram residue concentrations in milk fat were 4.4–9.5 times higher than those in whole milk and those in composite fat were 14–24 times higher than in muscle. The Meeting agreed that spinetoram residue is fat-soluble.
The Meeting recommended the following residue definition for plant and animal commodities:
− Definition of the residue (for compliance with the MRL):Spinetoram.
− Definition of the residue (for estimation of dietary intake):Spinetoram and N-demethyl and N-
formyl metabolites of the major spinetoram component.
− The residue is fat-soluble.
− Note: Spinetoram consists of two related components.
Results of supervised residue trials on crops
The Meeting received supervised trial data for spinetoram on orange, pome fruits, stone fruits, leaf lettuce, tomato, sugar beet and tree nuts.
For all analytes and matrices, the LOQ was 0.01 mg/kg. The LOD was reported to be 0.003 mg/kg for trials conducted in the USA and 0.005 mg/kg for trials conducted in Australia.
Citrus fruits
Twelve supervised trials were conducted on oranges in the USA.
Six trials conducted using low spray volume applications (approximately 700 L/ha) were in accordance with US GAP for citrus fruits (maximum rate of 103 g ai/ha, three applications, maximum

Spinetoram 1771
seasonal rate of 210 g ai/ha, PHI one day). Spinetoram residues from these trials in rank order were: < 0.01 (2), 0.012, 0.022, 0.028 and 0.03 mg/kg.
Corresponding total residues of spinetoram and the two metabolites in rank order were: < 0.02, 0.022, 0.03, 0.052, 0.052 and 0.066 mg/kg.
Six other trials conducted using high spray volume applications (approximately 3300 L/ha) were in accordance with US GAP. Residues from these trials in rank order were: < 0.01, 0.012, 0.015, 0.018, 0.021 and 0.02 mg/kg.
Corresponding total residues of spinetoram and the two metabolites in rank order were: < 0.02, 0.039, 0.041, 0.046, 0.047 and 0.069 mg/kg.
The Meeting considered that these two sets of trials conducted in the same locations could not be regarded as independent from each other and decided to use one data set for the estimation of maximum residue level. Taking into consideration the results of the two data sets being mutually supportive, the Meeting estimated a maximum residue level based on spinetoram residues and an STMR based on the total residues of spinetoram and the two metabolites for oranges at 0.07 and 0.0435 mg/kg.
Pome fruits
Numerous supervised trials were conducted on apple in Australia (20), Canada (8), New Zealand (20) and the USA (12).
Six trials conducted in the USA using low spray volume applications (approximately700 L/ha) were in accordance with US GAP for pome fruits (maximum rate of 123 g ai/ha, five applications, maximum seasonal rate of 500 g ai/ha, PHI seven days). Spinetoram residues from these trials in rank order were: < 0.01 (3), 0.01, 0.013 and 0.028 mg/kg.
Corresponding total residues of spinetoram and the two metabolites in rank order were < 0.02 (3), 0.023, 0.036 and 0.038 mg/kg.
Six other trials conducted in the USA using high spray volume applications (approximately 3300 L/ha) were in accordance with US GAP. Spinetoram residues from these trials in rank order were < 0.01 (4), 0.012 and 0.02 mg/kg.
Corresponding total residues of spinetoram and the two metabolites in rank order were < 0.02 (2), 0.022, 0.022, 0.026 and 0.037 mg/kg.
Supervised trials were conducted in four locations in Canada and in the USA in accordance with Canadian GAP for pome fruits (maximum rate of 103 g ai/ha, three applications, maximum seasonal rate of 315 g ai/ha, PHI seven days). Since two plots were in each location, only higher residues were selected for each location. Spinetoram residues from these trials in rank order were < 0.01, 0.015, 0.017 and 0.028 mg/kg. These trials were also in compliance with US GAP. Corresponding total residues of spinetoram and the two metabolites in rank order were < 0.02, 0.025, 0.038 and 0.038 mg/kg.
Two trials conducted in Australia and five trials in New Zealand were according to GAP in New Zealand for pome fruits (maximum 2.5 g ai/hL, minimum 50 g ai/ha, four applications and PHI seven days). Spinetoram residues from these trials in rank order were < 0.01 (7) mg/kg. Corresponding total residues of spinetoram and the two metabolites in rank order were < 0.02 (7) mg/kg.
Although application rates were different (PHI in all related GAPs is seven days), results of trials matching three different GAPs were mutually supportive. In ten trials conducted in the USA and Canada following US GAP, which would lead to the highest residues, spinetoram residues were in rank order: < 0.01 (4), 0.01 0.013 0.015 0.017 and 0.028 ( 2) mg/kg. Corresponding total residues of spinetoram and the two metabolites in rank order were: <0.02 (3), 0.023, 0.025, 0.036, 0.038 (3) mg/kg.

1772 Spinetoram
Eight trials were conducted on pear in Australia and eight other in New Zealand. No trials in Australia matched GAP of New Zealand for pome fruits. Spinetoram residues from two trials conducted in New Zealand in accordance with GAP of New Zealand in rank order were < 0.01 and 0.02 mg/kg. Corresponding total residues of spinetoram and the two metabolites in rank order were < 0.02 and 0.03 mg/kg.
Since the results from trials on apple and pear were similar, the Meeting estimated a maximum residue level based on spinetoram residues and an STMR based on the total residues of spinetoram and the two metabolites, for pome fruits on a basis of apple trials, at 0.05 and 0.025 mg/kg respectively.
Stone fruits
A large number of supervised trials were conducted on cherry, peach and apricot in Australia and New Zealand. A few trials on nectarines were also conducted in Australia.
However, since proposed GAP in Australia for stone fruits has not been approved, no maximum residue level could be estimated.
Tomato
Six supervised trials conducted in the USA were according to US GAP for fruiting vegetables (maximum rate of 88 g ai/ha, six applications, maximum seasonal rate of 298 g ai/ha and PHI one day). Residues from these trials in rank order were < 0.01 (2), 0.01, 0.0156, 0.024 and 0.025 mg/kg.
Corresponding total residues of spinetoram and the two metabolites in rank order were < 0.02 (3), 0.02, 0.025, 0.034 and 0.035 mg/kg.
The Meeting estimated a maximum residue level based on spinetoram residues and an STMR based on the total residue of spinetoram and the two metabolites in tomato at 0.06 and 0.02 mg/kg respectively.
Lettuce
Six supervised trials were conducted on leaf lettuce in the USA in accordance with US GAP for leafy vegetables (maximum rate of 88 g ai/ha, six applications, maximum seasonal rate of 298 g ai/ha and PHI one day). Residues in rank order were 0.15, 0.31, 0.32, 0.34, 0.55 and 7.80 mg/kg.
Corresponding total residues of spinetoram and the two metabolites in rank order were 0.28, 0.56, 0.64, 1.16, 1.35 and 9.55 mg/kg.
The residue values of 7.80 and 9.55 mg/kg were very high compared to the rest of results. The study report indicates that the trial was conducted in the same manner as the other trials and there was no indication for this trial being invalid. Using all the residue values, the Meeting estimated a maximum residue level based on spinetoram residues and an STMR for spinetoram in lettuce at 10 and 0.895 mg/kg.
As foliar applications on leaf lettuce were expected to result in higher residues than those on head lettuce, the Meeting agreed that these maximum residue level and STMR are applicable also to head lettuce.
Sugar beet
Six supervised trials were conducted in the USA. In one trial according to US GAP (maximum rate of 70 g ai/ha, four applications, maximum seasonal rate of 281 g ai/ha and PHI seven days) for tuberous vegetables, e.g., potato and sugar beet, the residue was < 0.01 mg/kg. In the other five trials, root samples were taken three days after the last application, earlier than the required PHI of seven days in GAP. Residues in these five trials were < 0.01 mg/kg (5).
Corresponding total residues of spinetoram and the two metabolites in rank order were < 0.02 (6) mg/kg.
The Meeting estimated a maximum residue level based on spinetoram residues and an STMR for spinetoram in sugar beet at 0.01 (*) and 0.02 mg/kg respectively.

Spinetoram 1773
Tree nuts
Six supervised trials were conducted on almonds in the USA. One trial was in accordance with US GAP for tree nuts (maximum rate of 123 g ai/ha, four applications, maximum seasonal rate of 490 g ai/ha and PHI 14 days), and residues were < 0.01 mg/kg. In the other five trials, nut samples were taken seven days after the last application rather than the required PHI of 14 days in GAP. Residues in these five trials were < 0.01 mg/kg (5).
Corresponding total residues of spinetoram and the two metabolites in rank order were < 0.02 (6) mg/kg.
Six supervised trials were also conducted on pecan in the USA. In one trial according to US GAP for tree nuts, residues were < 0.01 mg/kg. In the other five trials, nut samples were taken seven days after the last application rather than the required PHI of 14 days in GAP. Residues in these five trials were < 0.01 mg/kg (2) and 0.01 (3) mg/kg. A decline study indicates that it is likely that residues would be less than 0.01 mg/kg if samples were taken on the required PHI of 14 days and in general residues were not expected to occur in edible portions of tree nuts due to negligible translocation of spinetoram.
From the results of trials on almonds and pecan, the Meeting estimated a maximum residue level based on spinetoram residues and an STMR based on the total residue of spinetoram and the two metabolites in tree nuts at 0.01 and 0.02 mg/kg.
Sugar beet leaves or tops
Among six supervised trials conducted in the USA, only one was in compliance with US GAP and residues were 0.024 mg/kg. In other trials, samples were collected only three days after the last application instead of the required PHI of seven days and they contained finite level of residues. However, these trials were in compliance with US GAP for leaf of root and tuberous vegetables for forage (maximum rate of 80 g ai/ha, four applications, maximum seasonal rate of 281 g ai/ha and PHI of three days). Residues from these trials were 0.086, 0.099, 0.11, 0.16 and 0.20 (2) mg/kg.
The Meeting estimated an STMR and a highest residue in sugar beet leaves or tops based on spinetoram residues for calculation of animal burden at 0.135 and 0.20 mg/kg.
Almond hulls
Among six supervised trials conducted in the USA, only one trial was in accordance with US GAP and residues are 0.75 mg/kg. In other trials, samples were collected seven days after the last application instead of the required PHI of 14 days and they contained finite level of residues. The Meeting concluded that it was not possible to estimate a maximum residue level for spinetoram in almond hulls from the results of these trials.
Fate of residues during processing
The Meeting received information on processing of oranges to juice and oil, and apples to juice and puree (sauce).
Processing factors were calculated for oranges (juice, peel and pulp after juicing, dried pulp and oil) and for apples (juice, dry pomace and puree (sauce)).
Processing factor Processed Orange
Product Spinetoram residues Spinetoram+2 metabolites
STMR/STMR-P
(mg/kg)
Orange - - 0.045
Juice < 0.05 < 0.07 0.003
Dried pulp 2.4 2.3 0.105
Apple - - 0.025
Juice < 0.37 < 0.44 0.011
Dry pomace 8.1 6.0 0.15

1774 Spinetoram
Processing factor Processed Orange
Product Spinetoram residues Spinetoram+2 metabolites
STMR/STMR-P
(mg/kg)
Puree (sauce) 0.45 0.47 0.012
For the purpose of calculating animal dietary burden for estimating maximum residue levels for commodities of animal origin, STMR-P for citrus pulp, dry and apple pomace, dry were calculated based on spinetoram residues to be 0.048 and 0.081 mg/kg.
Farm animal dietary burden
Dry apple pomace, dry citrus pulp and sugar leaves or tops may be fed to dairy cattle and beef cattle but not as a major ingredient. The dietary burdens were calculated from the highest residue and STMR of sugar beet leaves or tops, and the STMRs of apple pomace, dry, using the OECD feedstuffs tables (Annex 6 of the 2006 Report of the JMPR).
Summary of livestock dietary burdens (ppm of dry matter diet)
US-Canada EU Australia
max mean max mean max mean
Beef cattle 0.018 0.018 0.192a 0.135b 0.018 0.018
Dairy cattle 0.0089 0.0089 0.270c 0.185d 0.0089 0.0089
a Suitable for estimating maximum residue levels for meat and edible offal. b Suitable for estimating STMRs for meat and edible offal. c Suitable for estimating a maximum residue level for milk and fat. d Suitable for estimating an STMR for milk and fat.
Residues in milk and cattle tissues
Lactating dairy cows were dosed daily for 29 consecutive days via gelatin capsules containing a mixture of spinetoram and N-demethyl and N-formyl metabolites of XDE-175-J (1.2–38.6 ppm in diet) or spinetoram only (37.6 ppm).
Residues in the milk in 1.2 ppm (equivalent to 0.4 mg XDE-175-J and -L) dose group were generally between the LOD (0.003 mg/kg) and LOQ (0.01 mg/kg) throughout the dosing period.
No or low concentration residues were detected in skim milk; even in 11.5 and 38.6 ppm (total) doses groups, mean total residues of the four compounds in skim milk ranged from just below the LOQ to 0.075 mg/kg. In all of the dose groups on day 14 and 28, total residues in cream were much higher than the residues in skim milk at 0.187 and 0.237 mg/kg in the 1.2 ppm doses groups. The mean total residues in cream from the 11.5 and 38.6 ppm doses groups ranged from 0.64 to 5.84 mg/kg. The average ratio of residues in cream to those in whole milk is 6:6.
All tissues from treated cows contained residues and they increased from the lowest to highest dose groups. Residue concentrations were lowest in the muscle followed by kidney, liver, and fat. Residues in fat were significantly higher than residues in the other tissues. These results indicate that residues of spinetoram tend to accumulate in fatty tissue.
With one exception, residues were not detectable in milk by the fourth day after the last dose was administered. Concentrations just above the LOD were detected in one cow through day nine after the final dose. No further residue was detected beyond that point.
Residues in tissues continuously declined through 28-day depletion period after the last dose. No residue was detected in kidney, liver or muscle from any cow by 28 days after the final dose or in fat 56 days following the final dose.

Spinetoram 1775
The dietary burdens for beef and dairy cattle are both lower than the lowest feeding level (1.2 ppm, equivalent to 0.4 ppm of spinetoram only) in the feeding study. Therefore the MRL and STMR were estimated using the residue concentrations in milk and tissues at the lowest feeding level and the dietary burden. The calculated residues in cattle tissues and milk are summarized below.
Spinetoram residues, mg/kg Dietary burden mg/kg
Feeding level [mg/kg]
Milk Muscle Liver Kidney Fat
MRL highest highest highest highest highest
0.270/0.192 < 0.00675 < 0.00480 < 0.00480 < 0.00480 0.0743
[0.4] [< 0.01] [< 0.01] [< 0.01] [< 0.01] [0.11]
Spinetoram, N-demethyl-175-J and N-formyl-175-J, mg/kg
STMR mean mean mean mean mean
0.185/0.135 < 0.00925 < 0.00625 < 0.00625 < 0.00625 0.0463
[0.4] [< 0.02] [< 0.02] [< 0.02] [< 0.02] [0.10]
The Meeting estimated a maximum residue level for spinetoram in edible offal (mammalian) and whole milk at 0.01(*) mg/kg and in mammalian fats at 0.2 mg/kg. STMRs were estimated to be 0.00925 mg/kg for whole milk, 0.00625 mg/kg for meat (muscle) and edible offal (mammalian), and 0.046 mg/kg for mammalian fats.
The Meeting estimated a maximum residue level for spinetoram and an STMR for spinetoram and the two metabolites in milk fat, using the median ratio between residues in cream and whole milk of 6:6 and assuming that cream contains 50% fat, at 0.1 mg/kg and 0.12 mg/kg respectively.
Poultry
No data were provided on poultry feeding study. Since there was no treated commodities that can be fed to hens, the Meeting considered that it was unnecessary to estimate maximum residue levels for poultry tissues or eggs.
RECOMMENDATIONS
On the basis of the data from supervised trials, the Meeting concluded that the residue levels listed below are suitable for establishing maximum residue limits and for IEDI assessment. Spinetoram is considered to be fat soluble.
Definition of the residue (for compliance with the MRL): Spinetoram.
Definition of the residue (for estimation of dietary intake): Spinetoram and N-demethyl and
N-formyl metabolites of the major spinetoram component.
The residue is fat-soluble.
Note: Spinetoram consists of two related components.
Recommended MRL, mg/kg CCN Commodity New Previous
STMR or STMR-P (mg/kg)
MO 0105 Edible offal, mammalian 0.01* - 0.00625 VL 0482 Lettuce, Head 10 - 0.895 VL 0483 Lettuce, Leaf 10 0.895 MM 0095 Meat (from mammals other than
marine mammals) 0.2 (fat) - 0.00625 (muscle)
0.042 (fat) FM 0183 Milk fats 0.1 - 0.12 ML 0106 Milks 0.01* - 0.00925

1776 Spinetoram
Recommended MRL, mg/kg CCN Commodity New Previous
STMR or STMR-P (mg/kg)
FC 0004 Oranges, Sweet, Sour 0.07 - 0.0435 JF 0004 Orange juice 0.003 FP 0009 Pome fruits 0.05 0.025 JF 0226 Apple juice 0.011
Apple puree or sauce 0.012 VR 0596 Sugar beet 0.01* - 0.02 VO 0448 Tomato 0.06 - 0.02 TN 0085 Tree nuts 0.01 - 0.02 AB 0001 Citrus pulp, dry 0.048 a AB 0226 Apple pomace, dry 0.081 a AV 0596 Sugar beet leaves or tops 0.135 a
a For dietary burden calculation. based on spinetoram residues only.
DIETARY RISK ASSESSMENT
Long-term intake
The International Estimated Dietary Intakes (IEDIs) of spinetoram were calculated for the 13 GEMS/Food cluster diets using STMRs estimated by the current Meeting (see Annex 3 of the 2008 Report of the JMPR). The ADI is 0–0.05 mg/kg bw and the calculated IEDIs were 0–1% of the maximum ADI. The Meeting concluded that the long-term intake of residues of spinetoram resulting from the uses considered by the current JMPR is unlikely to present a public health concern.
Short-term intake
The 2008 JMPR decided that an ARfD is unnecessary. The Meeting therefore concluded that the short-term intake of residues of spinetoram is unlikely to present a public health concern.
REFERENCES
Code. Author(s) Year Title, Institution, Report reference
040048 Magnussen, J.D.; Balcer, J.L.; Linder, S.J.,
2005 A Nature of the Residue Study with 14C-XDE-175 Applied to Lettuce. Dow AgroSciences. DAS Ref. No. 040048. GLP. Unpublished. 11 October 2005.
040049 Graper, L.K.; Balcer, J.L.; Linder, S.J., A
2005 Nature of the Residue Study with 14C XDE-175 Applied to Turnips. DAS Ref. No. 040049. GLP. Unpublished. 27 October 2005.
040050 Byrne, S.L.; Butz, J.L.; Balcer, J.L.; Linder, S.J., A
2005 Nature of the Residue Study with 14C -XDE-175 Applied to Apples. Dow AgroSciences. DAS Ref. No. 040050. GLP. Unpublished. 21 September 2005.
040063 Dolder, S.C.; Wendelburg, B.M.,
2005 Magnitude of the Residues of XDE-175 and Spinosad in Apples, Leaf Lettuce, Oranges, Sugar Beets, and Tomatoes. Dow AgroSciences, USA. DAS Ref. No. 040063. GLP. Unpublished. 14 October 2005.
040068 Yoder, R.N.; Meitl, T.J.; Balcer, J.L.; Linder, S.J.
2005 Aerobic Soil Degradation of XDE-175 in Four US Soils. Dow AgroSciences. DAS Ref. No. 040068. GLP. Unpublished. 9 September 2005.
040079 Yoder, R.N.; Balcer, J.L.; Linder, S.J.
2005 Aqueous Photolysis of XDE-175 in pH 7 Buffer under Xenon Light. Dow AgroSciences. DAS Ref. No. 040079. GLP. Unpublished. 24 August 2005.
040086.01 Graper, L.K.; Smith, K.P.,
2008 A Confined Rotational Crop Study with14C - XDE-175. Dow AgroSciences, USA. DAS Ref. No. 040086.01. GLP Unpublished. 11 February 2008.
040087 Smith-Drake, J.K.; Riccio, R.; Balcer, J.L.; Lindner, S.J.; Magnussen, J.D
2005 Nature of Residue in Laying Hen Using 14C -XDE-175. Dow AgroSciences. DAS Ref. No. 040087. GLP. Unpublished. 6 October 2005.

Spinetoram 1777
Code. Author(s) Year Title, Institution, Report reference
040088 Magnussen, J.D.; Smith-Drake, J.K.; Balcer, J.L.; Lindner, S.J.; Riccio, R.M
2005 Nature of the Residue Study in the Ruminant Using 14C XDE-175. Dow AgroSciences. DAS Ref. No. 040088. GLP. Unpublished. 26 October 2005.
040108 Rutherford, L.A.; Balcer, J.L.; Lindner, S.J.
2005 Hydrolysis of XDE-175-J and XDE-175-L. Dow AgroSciences. DAS Ref. No. 040108. 27 July 2005.
040114 Cowles, J. 2006 Residues of XDE-175 in Australian and New Zealand Apples after One or Four Applications of GF-968 in the 2005 Season. Dow AgroSciences, Australia. DAS Ref. No. 040114. GLP. Unpublished. 3 October 2006.
041020 Hastings, M.J. 2005 Method Validation Report for the Determination of XDE-175 and its Metabolites in Soil and Sediment using Dow AgroSciences Methods GRM 05.01 and GRM 05.02. Dow AgroSciences. DAS Ref. No. 041020. GLP. Unpublished. 26 May 2005.
041021 Hastings, M.J. 2005 Method Validation Report for the Determination of XDE-175 and its Metabolites in Agricultural Commodities using Dow AgroSciences Methods GRM 05.03 and GRM 05.04. Dow AgroSciences. DAS Ref. No. 041021. GLP. Unpublished. 6 July 2005.
050027.01 Wendelburg, B.M. 2006 Frozen Storage Stability of XDE-175 and Relevant Metabolites in Agricultural Commodities. Dow AgroSciences. DAS Ref. No. 050027.01. GLP. Unpublished. 13 September 2006.
050028 Dolder, S.C.; Schelle, G.E.
2006 Magnitude of the Residue of XDE-175 in Apples, Table Grapes, and Wine Grapes from Europe–2005. Dow AgroSciences, USA. DAS Ref. No. 050028. GLP. Unpublished. 25 September 2006.
050041 Dolder, S.C.; Schelle, G.E.
2006 Magnitude of the Residue of XDE-175 in Apples. Dow AgroSciences, USA. DAS Ref. No. 050041. GLP. Unpublished. 6 July 2006.
050049 Richter, M. 2005 Independent Laboratory Validation of Dow AgroSciences LLC Method GRM 05.15–Determination of Residues of XDE-175 and its Metabolites in Bovine and Poultry Tissues by High Performance Liquid Chromatography with Tandem Mass Spectrometry. PTRL Europe GmbH. Report No. P 864 G. Dow AgroSciences. DAS Ref. No. 050049. GLP. Unpublished. 23 September 2005.
050051 Richter, M. 2005 Independent Laboratory Validation of Dow AgroSciences LLC Method GRM 05.03–Determination of Residues of XDE-175 and its Metabolites in Agricultural Commodities by Liquid Chromatography with Tandem Mass Spectrometry. PTRL Europe GmbH. Report No. P 863 G. DAS Ref. No. 050051. GLP. Unpublished. 24 August 2005.
050062 Cowles, J. 2006 Residues of XDE-175 in Australian Apples and Pears after Multiple Applications of GF-1640 in the 2005–2006 Season. Dow AgroSciences, Australia. DAS Ref. No. 050062. GLP. Unpublished. 14 December 2006.
050063 Cowles, J. 2006 Residues of DE-175 in Australian Stone Fruit after Multiple Applications of GF-1640 in the 2005-2006 Season. Dow AgroSciences, Australia. DAS Ref. No. 050063. GLP. Unpublished. 18 September 2006.
050074 Cowles, J 2006 Residues of DE 175 in New Zealand Apples and Pears after Four Applications of GF 1587 in the 2005–2006 Season. Dow AgroSciences, Australia. DAS Ref. No. 050074. GLP. Unpublished. 18 December 2006.
050075 Cowles, J. 2007 Residues of XDE-175 in New Zealand Stone Fruit after Four Applications of GF-1587 in the 2005–2006 Season. Dow AgroSciences, Australia. DAS Ref. No. 050075. GLP. Unpublished. 2 February 2007.
050076 Smith-Drake, J.K.; Balcer, J.L.; Stephon, A.G.
2007 Degradation of XDE-175 in European Soils Under Aerobic Conditions at 20 ºC, Aerobic Conditions at 10 ºC, Anaerobic Conditions and Sterile Conditions at 20 ºC. Dow AgroSciences. DAS Ref. No. 050076.1. GLP. Unpublished. 30 August 2007.
051013 Peyton, C. 2005 PAM I Multiresidue Protocol Testing for XDE-175-J, XDE-175-L and their Metabolites N-demethyl-175-J, N-demethyl-175-L, N-formyl-175-J and N-formyl-175-L. Pyxant Labs, Inc. DAS Ref. No. 051013. GLP. Unpublished. 19 July 2005.
051022 Shackelford, D.D. 2005 Method Validation Study for the Determination of Residues of XDE-175 and its Metabolites in Bovine and Poultry Tissues, Milk, Cream, and Eggs by Liquid Chromatography with Tandem Mass Spectrometry. Dow AgroSciences. DAS Ref. No. 051022. GLP. Unpublished. 9 September 2005.

1778 Spinetoram
Code. Author(s) Year Title, Institution, Report reference
060052 Dolder, S.C.; Schelle, G.E.
2007 XDE-175 Livestock Feeding Study; Magnitude of Residue in Milk, Muscle, Fat, Liver, and Kidney of Lactating Dairy Cattle. Dow AgroSciences, USA. DAS Ref. No. 060052. GLP. Unpublished. 5 January 2007.
061023 Shackelford, D.D. 2007 Method Validation Report for Method GRM 06.08–Determination of Residues of XDE-175 and its Metabolites in Bovine and Poultry Tissues, Milk, Cream, and Eggs by Liquid Chromatography with Tandem Mass Spectrometry. Dow AgroSciences. DAS Ref. No. 061023. GLP. Unpublished. 2 March 2007.
061066 Class, T. XDE-175: Assessment and Validation of European Multi-Residue Enforcement Method(s) for the Determination of XDE-175 and its Metabolites in Plant Materials and in Foodstuffs of Animal Origin. PTRL Europe GmbH. DAS Ref. No. 061066.
070069 Dolder, S.C.; Schelle, G.E.
2008 Residues of Spinetoram in Almonds and Pecans. Dow AgroSciences, USA. DAS Ref. No. 070069. GLP Unpublished. 5 February 2008.
ARAP 07D-001
McKellar, R.L. 2008 Magnitude of the Residues of Spinetoram in Apples, Leaf Lettuce, Tomatoes, Sugar Beet Tops and Roots and Oranges and Orange Processing Fractions. Dow AgroSciences, USA. DAS Ref. No. ARAP 07D-001. GLP Unpublished. March 2008.
NAFST-05-142
Madsen, S 2005 Physical and Chemical Properties of XDE-175. Dow AgroSciences. DAS Ref No. NAFST-05-142. GLP. Unpublished. 13 October 2005.