Spills in the Northwest Territories 2015 · • Mining spills reported have increased by 14% from...
2
Inuvik Sahtu Deh Cho North Slave South Slave NWT ENR Administration Regions (Approx.) 0 10 20 30 40 50 60 70 2014 2015 2010 2011 2012 2013 Deh Cho Inuvik North Slave Sahtu South Slave 2011 2012 2013 2014 2015 0 50 100 150 200 Produced by: NWT Centre for Geomacs Spills in the Northwest Territories 2015 “Prevenng a spill is more desirable than even the best clean up!” Where did the spills occur? In 2015, 279 spills were reported to the 24-hour Spill Report Line in the NWT. Just over half (57%) of the reported spills occurred in the North Slave Region. Inuvik (16%), Sahtu (11%), Deh Cho (11%) and South Slave (5%). Mining industry spills (42%) have shown an overall increase from 2014. This is attributed to construction activities at new and existing mine sites. There was a decrease in spills from government – municipal/ territorial/federal (17%) and petroleum companies (5%). Spills from private individuals (10%), transportation companies (3%), unknown parties (10%) and others (13%) have remained unchanged. Residential oil tank spills Since the release of the Homeowner’s Guide to Oil Tanks in 2010 there continues to be an overall decreasing trend in the number of spills reported in the NWT from residential- size steel oil tanks (1,135 litres) due to corrosion. It is believed the guide has assisted in reducing these spills. The Department of Environment and Natural Resources (ENR) maintains a database of hazardous material spills reported in the Northwest Territories (NWT) since 1971. This report briefly summarizes the data collected for spills reported in 2015. • 279 spills were reported in 2015, 42 more than 2014. • 57% of the reported spills were small, less than 100 litres. • 54% of the spills reported were in the North Slave Region. • Mining spills reported have increased by 14% from 2014. • 35% of all spills reported involved fuel oil. • 1,035,625 litres of wastewater was spilled, which is 541,452 litres less than the five-year average. Figure 1 – Number of Reported Spills by Region Figure 2 – Number of Spills by Residenal Oil Tanks
Transcript of Spills in the Northwest Territories 2015 · • Mining spills reported have increased by 14% from...
Inuvik
Sahtu
Deh Cho North Slave
South SlaveNWTENR Administration Regions (Approx.)
0
10
20
30
40
50
60
70
2014 20152010 2011 2012 2013Deh Cho Inuvik North Slave Sahtu South Slave
20112012201320142015
0
50
100
150
200
Prod
uced
by:
NW
T Ce
ntre
for G
eom
atics
Spills in the Northwest Territories 2015
“Preventing a spill is more desirable than even the best clean up!”
Where did the spills occur?In 2015, 279 spills were reported to the 24-hour Spill Report Line in the NWT. Just over half (57%) of the reported spills occurred in the North Slave Region. Inuvik (16%), Sahtu (11%), Deh Cho (11%) and South Slave (5%).
Mining industry spills (42%) have shown an overall increase from 2014. This is attributed to construction activities at new and existing mine sites. There was a decrease in spills from government – municipal/territorial/federal (17%) and petroleum companies (5%). Spills from private individuals (10%), transportation companies (3%), unknown parties (10%) and others (13%) have remained unchanged.
Residential oil tank spillsSince the release of the Homeowner’s Guide to Oil Tanks in 2010 there continues to be an overall decreasing trend in the number of spills reported in the NWT from residential-size steel oil tanks (1,135 litres) due to corrosion. It is believed the guide has assisted in reducing these spills.
The Department of Environment and Natural Resources (ENR) maintains a database of hazardous material spills reported in the Northwest Territories (NWT) since 1971. This report briefly summarizes the data collected for spills reported in 2015.
• 279 spills were reported in 2015, 42 more than 2014.• 57% of the reported spills were small, less than 100 litres.• 54% of the spills reported were in the North Slave Region.• Mining spills reported have increased by 14% from 2014. • 35% of all spills reported involved fuel oil.• 1,035,625 litres of wastewater was spilled, which is 541,452 litres less than the
five-year average.
Figure 1 – Number of Reported Spills by Region
Figure 2 – Number of Spills by Residential Oil Tanks
Wastewater 18%
Gasoline 2%
Lube Oil 21%
Fuel Oil 35%
Crude Oil 1%Drill Mud 1%
Other 3%
Unknown 6%
Chemicals 12%
2011 2012 2013 2014 2015
< 100 litres101 - 1,000 litres> 1,000 litres
0
50
100
150
200
250
300
350
For more information on spills, contact:Environment DivisionDepartment of Environment and Natural ResourcesGovernment of the Northwest TerritoriesP.O. Box 1320Yellowknife, NT X1A 2L9Telephone: (867) 767-9236 Ext. 53176
To report a spill, call the24-hour Spill Report Line
(867) 920-8130(Collect calls accepted.)
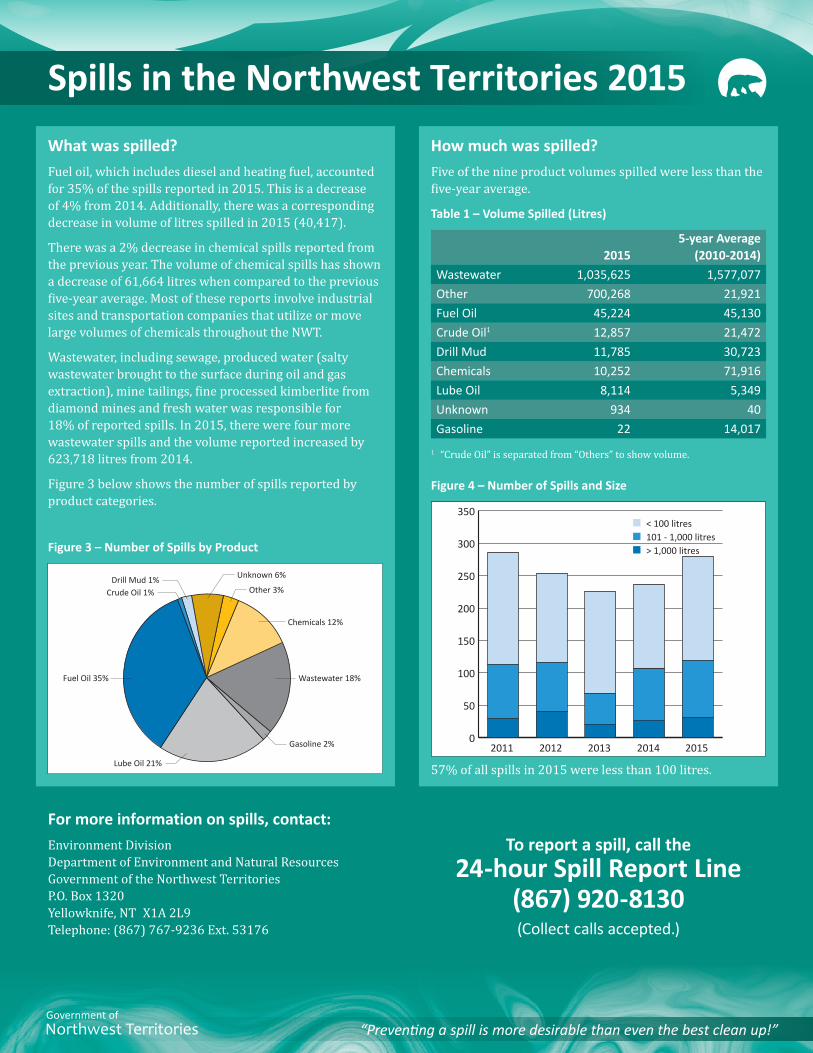
57% of all spills in 2015 were less than 100 litres.
Spills in the Northwest Territories 2015
“Preventing a spill is more desirable than even the best clean up!”
What was spilled?Fuel oil, which includes diesel and heating fuel, accounted for 35% of the spills reported in 2015. This is a decrease of 4% from 2014. Additionally, there was a corresponding decrease in volume of litres spilled in 2015 (40,417).
There was a 2% decrease in chemical spills reported from the previous year. The volume of chemical spills has shown a decrease of 61,664 litres when compared to the previous five-year average. Most of these reports involve industrial sites and transportation companies that utilize or move large volumes of chemicals throughout the NWT.
Wastewater, including sewage, produced water (salty wastewater brought to the surface during oil and gas extraction), mine tailings, fine processed kimberlite from diamond mines and fresh water was responsible for 18% of reported spills. In 2015, there were four more wastewater spills and the volume reported increased by 623,718 litres from 2014.
Figure 3 below shows the number of spills reported by product categories.
How much was spilled?Five of the nine product volumes spilled were less than the five-year average.
Table 1 – Volume Spilled (Litres)
20155-year Average
(2010-2014)Wastewater 1,035,625 1,577,077Other 700,268 21,921Fuel Oil 45,224 45,130Crude Oil1 12,857 21,472Drill Mud 11,785 30,723Chemicals 10,252 71,916 Lube Oil 8,114 5,349Unknown 934 40Gasoline 22 14,017
1 “Crude Oil” is separated from “Others” to show volume.
Figure 4 – Number of Spills and Size
Figure 3 – Number of Spills by Product