SPI, 2014-15: Public Use Tape...
39
SURVEY OF PERSONAL INCOMES PUBLIC USE TAPE DOCUMENTATION Contents Information about the Survey of Personal Incomes 2 Introduction 2 Sample Design 2 Coverage of the SPI 3 Taxes confidentiality 5 Steps taken to anonymise the 2014-15 SPI File 5 Annexes A – List of variables on Public Use Tape 14/15 B – List of composite records on Public Use Tape 14/15 C – Income Tax Personal Allowances and Reliefs, 1990-91 to 2016-17 D – Rates of Income Tax, 1990-91 to 2016-17 UK Data Archive Study Number 8239 - Survey of Personal Incomes, 2014-2015: Public Use Tape
Transcript of SPI, 2014-15: Public Use Tape...
SURVEY OF PERSONAL INCOMES PUBLIC USE TAPE DOCUMENTATION
Contents Information about the Survey of Personal Incomes 2 Introduction 2 Sample Design 2 Coverage of the SPI 3 Taxes confidentiality 5 Steps taken to anonymise the 2014-15 SPI File 5
Annexes
A – List of variables on Public Use Tape 14/15 B – List of composite records on Public Use Tape 14/15 C – Income Tax Personal Allowances and Reliefs, 1990-91 to 2016-17 D – Rates of Income Tax, 1990-91 to 2016-17
UK Data Archive Study Number 8239 - Survey of Personal Incomes, 2014-2015: Public Use Tape
Information about the Survey of Personal Incomes Introduction What is the Survey of Personal Incomes? The Survey of Personal Incomes (SPI) is based on information held by HMRC on individuals who could be liable to UK income tax. It is carried out annually by HMRC and covers income assessable to tax for each tax year. Uses of the SPI The SPI is compiled to provide a quantified evidence base from which to cost proposed changes to tax rates, personal allowances and other tax reliefs for Treasury Ministers. It is used to inform policy decisions within HMRC and the Treasury, as well as for tax modelling and forecasting purposes. In addition, it is used to provide summary information for the National Accounts that are prepared by the Office for National Statistics. Finally, it is used to provide information to Members of Parliament, other Government Departments, companies, organisations and individuals. Sample Design HMRC holds information about individuals who could be liable to UK income tax in three operational computer systems. 1. The National Insurance and PAYE Service (NPS) system covers all employees and occupational pension recipients with a Pay-As-You-Earn (PAYE) record. NPS replaced the Computerisation of PAYE (COP) system. 2. The Computerised Environment for Self Assessment (CESA) system covers people with self-employment, rental or untaxed investment income. It also covers those with higher incomes and other people with complex tax affairs. Where people have both NPS and CESA records, their CESA record is selected because it provides a more complete picture of their taxable income. 3. The Claims system covers people without NPS or CESA records who have had too much tax deducted at source and claim a repayment. Separate samples were drawn from each of these systems and different sampling strategies were used for each. The samples were structured as follows:
(a) The PAYE population from NPS was stratified by gender and by the sum of pay plus occupational pension income for the previous tax year. Where the previous year’s income was not available cases were stratified by gender and by whether they were a higher rate or additional rate taxpayer for the current tax year based on information available at the time the sample was drawn. The sampling fractions varied from 1 in 10 for individuals with high incomes and rare allowances to about 1 in 200 for people with low combined pay and pensions. In all, about 411,600 individuals were selected from NPS for inclusion in the 2014-15 SPI.
(b) For the SA population from CESA, the main source of income (self employment or employment/occupational pension) and ranges of income and tax were used to stratify the sample, with the sampling fraction varying from 1 in 1 for cases with very high income or tax up to about 1 in 200 for employees and occupational

pensioners with smaller income or tax for 2014-15. In all, about 309,100 individuals were selected from SA for inclusion in the 2014-15 SPI.
(c) For claims cases, a random sample of about 1 in 20 was selected for inclusion in the SPI. This led to around 10,000 cases being selected for the survey.
Once data was collected for the three constituent parts of the sample, the data sets were joined together. After allowing for non-response and for records that failed data validation tests, there were about 730,700 valid cases on the 2014-15 final SPI file. Coverage of the SPI Not all of the individuals in the SPI sample are taxpayers. About 21 per cent have no income tax liability because deductions and reliefs and personal allowances exceed their total income. Where income exceeds the threshold for the operation of PAYE (£10,000 for 2014-15), the SPI provides the most comprehensive and accurate official source of data on personal incomes. However, as HMRC does not hold information for all people with personal incomes below the tax threshold, the SPI is not a representative data source for this part of the population and no attempt has been made to estimate the numbers of cases below the tax threshold or the amount of their incomes. Therefore the National Statistics in this publication - with the exception of Tables 3.9 and 3.10 - only cover individuals liable to UK income tax (taxpayers) and their incomes. An individual with income below the personal allowance can still be a taxpayer in some circumstances. This can arise where individuals who have income liable to UK tax do not qualify for a personal allowance under the residence and /or domicile rules. Some people who do qualify for the personal allowance choose to give up their personal allowance as part of the qualifying conditions for having their income taxed under the “remittance basis”. These taxpayers may only have a small amount of income liable to UK tax (i.e. below where the personal allowance is set), but this income is still liable to tax and is charged at the starting, and/or basic rates.
Most sources of income are liable for income tax and adding all these sources together will give an individual’s total income assessable for tax for the tax year. There are some sources of income that are not liable for tax. As they do not contribute towards an individual’s taxable income; they are excluded from the SPI; these sources include some social security benefits and income from some tax efficient savings vehicles (e.g. Individual Savings Accounts and some National Savings & Investment products). Capital Gains arising from the disposal of assets are subject to Capital Gains Tax (CGT) and are not treated as income for income tax purposes, so gains from the disposal of assets are not included in the SPI. The coverage of investment income for the sample drawn from NPS is incomplete. This is because in order to operate the PAYE system for most individuals HMRC does not need information on interest from which tax has been deducted at source, nor on dividends and associated tax credit. In order to create a full picture of total income for this survey, it is necessary to impute values of bank and building society interest and dividends to some sample cases. For interest and dividends imputation, the amount for each SPI case:
is known for cases in Self Assessment from the amount declared on the Self Assessment Return
can be inferred or estimated reasonably for NPS cases where there is an adjustment to the tax code for higher rate taxpayers
is supplemented with information from interest paying institutions
is unknown for NPS cases where there is no coding adjustment - typically no liability at the higher rate.
Where no information at case level is available from HMRC administrative systems, estimated values are imputed to cases so that the population as a whole has amounts consistent with evidence from other sources (for example, amounts of tax accounted for by deposit takers and the propensity to hold interest bearing accounts as indicated by household surveys). For interest income, starting from control totals at UK level, for the number of cases with interest and the total amount of that interest, the numbers of cases and amounts of interest in Self Assessment cases and those NPS cases with coding adjustments are deducted to leave targets for the remainder of the taxpayer population. These targets are at UK level – no attempt is made to control the targets to sub-UK geographical units. The cases to which amounts are attached by the imputation process and the amounts attached are determined by probabilistic methods with just the UK targets and distributions in mind. For dividend income, the number of non SA cases with dividend income and distribution of imputed amounts were inferred from Family Resources Survey data for 2014-15. As with investment income, HMRC does not have complete information about superannuation or personal pension contributions.
Under PAYE, tax is paid on pay after the deduction of superannuation contributions and therefore HMRC does not need to record the contributions deducted from gross pay. For a small proportion of individuals, the superannuation contribution has been taken directly from an end of year return submitted by employers. For others, their total amount of superannuation contributions has been estimated and has been distributed among earners in the SPI sample, based on information from the Annual Survey of Hours and Earnings produced by the Office for National Statistics. Relief at basic rate is given at source for employee contributions to personal pensions. As this is the correct amount of relief for basic rate taxpayer employees, HMRC does not need to collect personal pensions data for this group of taxpayers. To compile complete estimates for personal pensions and total income for the SPI, a significant proportion of the amount of personal pension contributions has been imputed using data from external data sources. The estimated value for this and for superannuation contributions has been combined with other pension reliefs and included in these statistics. Taxes confidentiality The Taxes Acts impose special responsibilities on HMRC to safeguard the confidentiality of information on identifiable taxpayers. The legislation specified that such information can only be released outside the department in a very limited number of circumstances. We are allowed to pass employer names and addresses to the Office for National Statistics because this is specifically allowed by statute, but we are not allowed to give out any other information, which might be attributable to any identifiable individual, for statistical purposes, even to other Government departments. We have hence had to go through a number of stages to ensure that the data is suitably anonymised. In deciding how to do this we have had to take account of information on individuals’ incomes which is already known to third parties, such as employers. Steps taken to anonymise the 2014-15 SPI File Stage 1 The first step is to round all sources of income, deductions and reliefs to three significant figures and use the dataset as input in the Personal Tax Model to calculate the tax amounts with rounded figures. Stage 2 In the next stage, some variables are combined together to further ensure anonymity. For example, the original SPI file contains several variables relating to different types of pension relief. These variables are all combined into one variable holding all pension relief information. Details of the variables on the public use tape are given in Annex A. Stage 3 The next stage of the anonymisation process is to identify all of the strata that were sampled more heavily than 1 in 60 in the original survey, and had populations less than 10,000. Further samples are then drawn from these strata to reduce the sampling fraction to no more than 1 in 60. Stage 4
Composite records are created for the following reasons:
Individuals with very large total incomes within each income stratum (Generally well in excess of £1,000,000 for taxpayers and above £150,000 for non taxpayers).
Stratums where sampling in close to 1 in 1, which would be disclosive.
Stratums where sample size is less than 30. This is done by combining cases with similar characteristics and taking an average for each variable on the file. Taxpayer cases are combined according to their stratum and gender status, whereas non taxpayers are combined by PAYE/SA classification and gender status due to insufficient samples within stratums to create viable composite records. The designatory variables contain the value “-1”, enabling easy recognition of the composite records. Each composite record is given a description and a summary of information about each case has been provided at Annex B. Stage 5 As a final step, all the remaining income figures are rounded to the nearest £5. Please note that although we make our best efforts to anonymise the SPI file for the PUT release, it may still be possible that the dataset holds enough information to make a case distinct from all others cases. The SPI file is based on a sample of the UK population. There is no guarantee that an individual that a user may believe they have identified is actually the correct representation of that person. Please refer to the SPI usage agreement for the legal agreement for condition of use.

Annex A List of variables on Public Use Tape 14/15
Item Description Code/Item range
AGERANGE Age range indicator 1 Under 25 2 25 – 34 3 35 – 44 4 45 – 54 5 55 – 64 6 65 – 74 7 75 and over
BPADUE Blind persons allowance due (including any surplus allowance transferred from spouse)
0 – 4,460
CAPALL Capital allowances used for all sources of self-employment income less balancing charges (negative values indicate a net balancing charge)
-261,100 – 1,899,490
COVNTS Covenanted payments to charities 0 – 543,000
DEFICIEN Deficiency relief amount 0 – 148,000
DIVIDENDS Dividend Income from shares in UK companies and units trusts
0 – 22,796,695
DSHIPS Directorship Indicator 1 Director of a close company 2 Director but not of any close company 3 Not a director 4 Director recorded from PAYE
Data
EIDF Earned income deductions due at full relief (same as PENSRLF)
0 – 238,000
EPB Gross expenses payments and benefits 0 – 885,000
EXPS Deductions for expenses from employment
0 – 288,000
FACT Grossing factor – This variable must be applied to the sample in order to obtain figures for the whole UK population
8.6307 – 323.2885
GIFTAID Gift aid payments to charities 0 – 4,350,630
GIFTINV Gifts of qualifying investment and property to charities
0 – 6,000,000
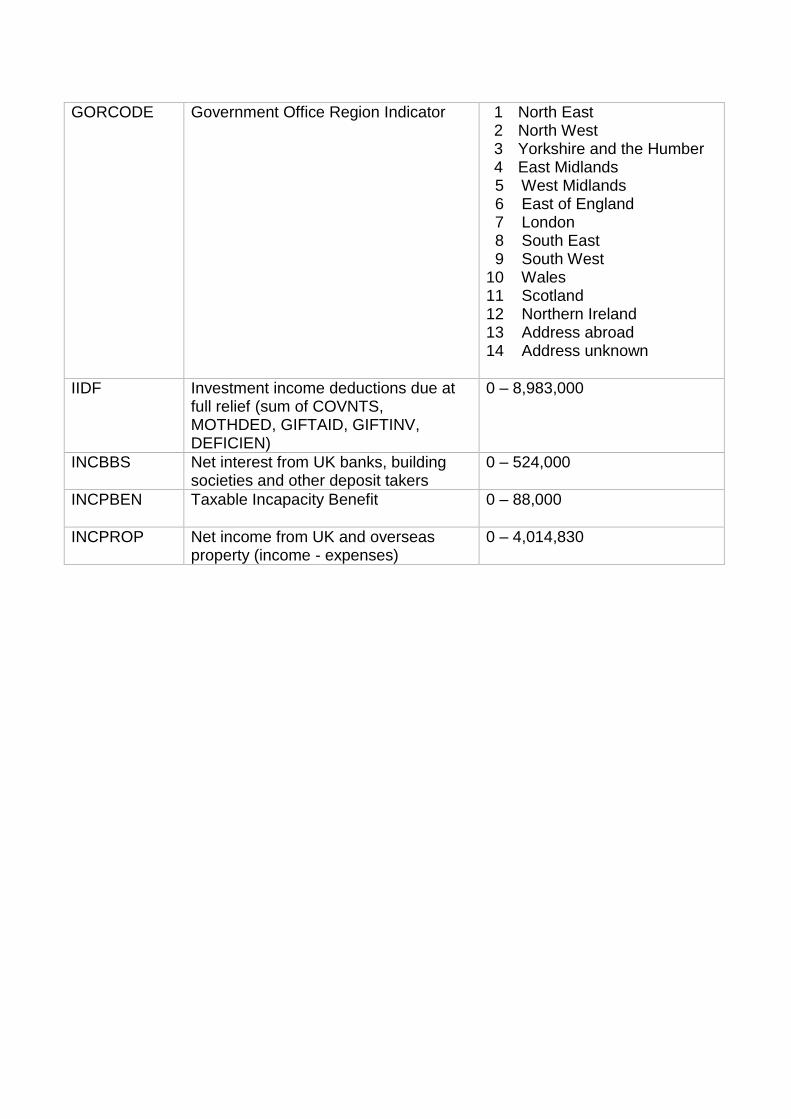
GORCODE Government Office Region Indicator 1 North East 2 North West 3 Yorkshire and the Humber 4 East Midlands
5 West Midlands 6 East of England 7 London 8 South East 9 South West 10 Wales 11 Scotland 12 Northern Ireland 13 Address abroad 14 Address unknown
IIDF Investment income deductions due at full relief (sum of COVNTS, MOTHDED, GIFTAID, GIFTINV, DEFICIEN)
0 – 8,983,000
INCBBS Net interest from UK banks, building societies and other deposit takers
0 – 524,000
INCPBEN Taxable Incapacity Benefit 0 – 88,000
INCPROP Net income from UK and overseas property (income - expenses)
0 – 4,014,830
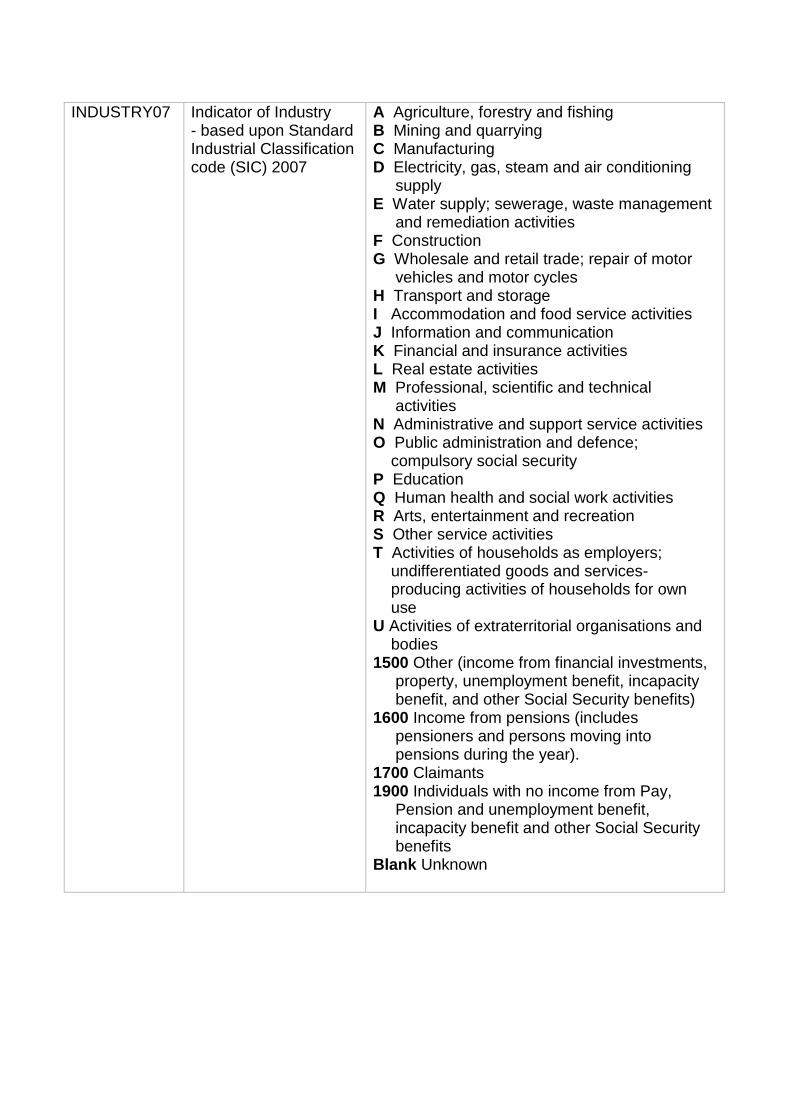
INDUSTRY07 Indicator of Industry - based upon Standard Industrial Classification code (SIC) 2007
A Agriculture, forestry and fishing B Mining and quarrying C Manufacturing D Electricity, gas, steam and air conditioning supply E Water supply; sewerage, waste management and remediation activities F Construction G Wholesale and retail trade; repair of motor vehicles and motor cycles H Transport and storage I Accommodation and food service activities J Information and communication K Financial and insurance activities L Real estate activities M Professional, scientific and technical activities N Administrative and support service activities O Public administration and defence; compulsory social security P Education Q Human health and social work activities R Arts, entertainment and recreation S Other service activities T Activities of households as employers; undifferentiated goods and services- producing activities of households for own use U Activities of extraterritorial organisations and bodies 1500 Other (income from financial investments, property, unemployment benefit, incapacity benefit, and other Social Security benefits) 1600 Income from pensions (includes pensioners and persons moving into pensions during the year). 1700 Claimants 1900 Individuals with no income from Pay, Pension and unemployment benefit, incapacity benefit and other Social Security benefits Blank Unknown
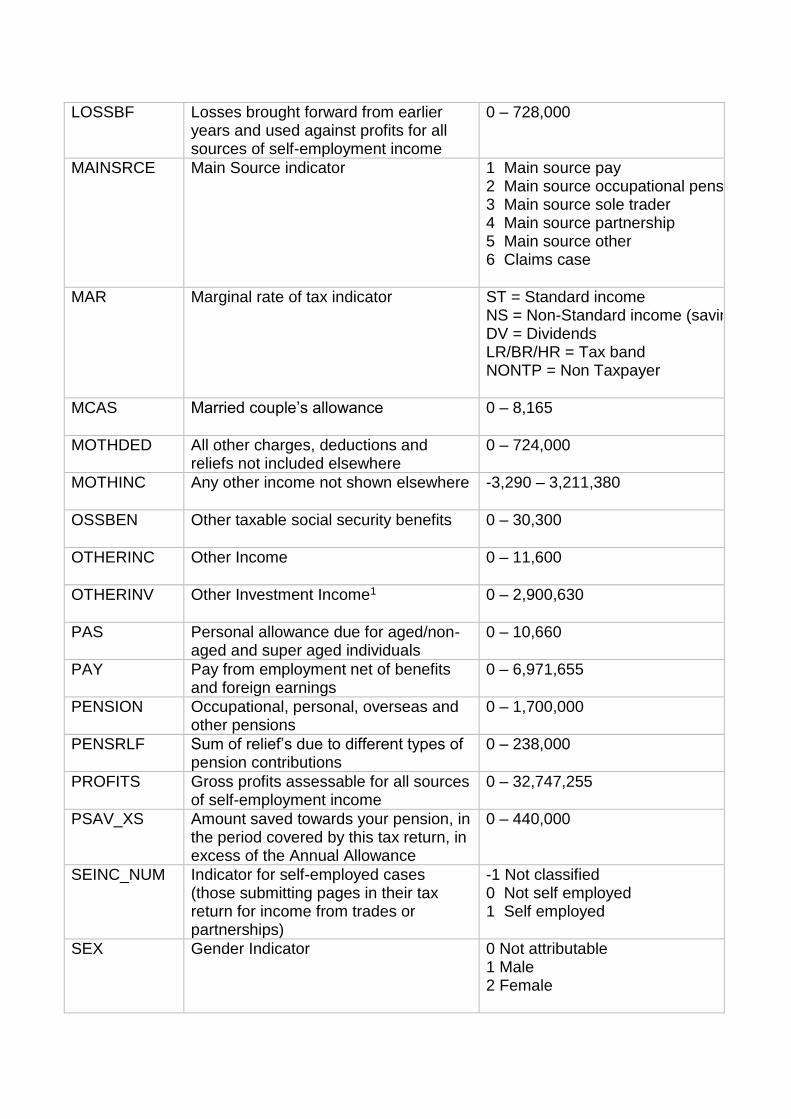
LOSSBF Losses brought forward from earlier years and used against profits for all sources of self-employment income
0 – 728,000
MAINSRCE Main Source indicator 1 Main source pay 2 Main source occupational pension 3 Main source sole trader 4 Main source partnership 5 Main source other 6 Claims case
MAR Marginal rate of tax indicator ST = Standard income NS = Non-Standard income (savings) DV = Dividends LR/BR/HR = Tax band NONTP = Non Taxpayer
MCAS Married couple’s allowance 0 – 8,165
MOTHDED All other charges, deductions and reliefs not included elsewhere
0 – 724,000
MOTHINC Any other income not shown elsewhere -3,290 – 3,211,380
OSSBEN Other taxable social security benefits 0 – 30,300
OTHERINC
Other Income 0 – 11,600
OTHERINV Other Investment Income1 0 – 2,900,630
PAS Personal allowance due for aged/non-aged and super aged individuals
0 – 10,660
PAY Pay from employment net of benefits and foreign earnings
0 – 6,971,655
PENSION Occupational, personal, overseas and other pensions
0 – 1,700,000
PENSRLF Sum of relief’s due to different types of pension contributions
0 – 238,000
PROFITS Gross profits assessable for all sources of self-employment income
0 – 32,747,255
PSAV_XS
Amount saved towards your pension, in the period covered by this tax return, in excess of the Annual Allowance
0 – 440,000
SEINC_NUM Indicator for self-employed cases (those submitting pages in their tax return for income from trades or partnerships)
-1 Not classified 0 Not self employed 1 Self employed
SEX Gender Indicator 0 Not attributable 1 Male 2 Female

SPA State Pension Age indicator -1 Not classified 0 Non-state pension age 1 State pension age
SREF Statistical Reference 1 – 10,537,256
SRP State retirement pension (includes state retirement pension lump sum payment2) & widow’s pension
0 – 133,000
TAXINC Amount of taxable income 0 – 52,587,540
TAXPAYER Taxpayer status indicator (rounding reduces some figures under 5 to zero, this indicates those with some tax liability before rounding)
1 Taxpayer 2 Non-taxpayer
TAXTERM Taxable pay on termination of employment
0 – 864,000
TAX_CRED
Total tax credits excluding MCAS (tax covered/relief value)
0 – 1,230,000
TEI Total earned income 0 – 34,872,815
TI Total income (sum of TEI and TII) 0 – 58,145,170
TII Total investment income 0 – 23,272,355
TOTTAX Total tax liability (including pension tax charge)3 less tax credits4
0 – 21,276,450
UBISJA Unemployment benefit, income support payments and jobseeker’s allowance
0 – 27,400
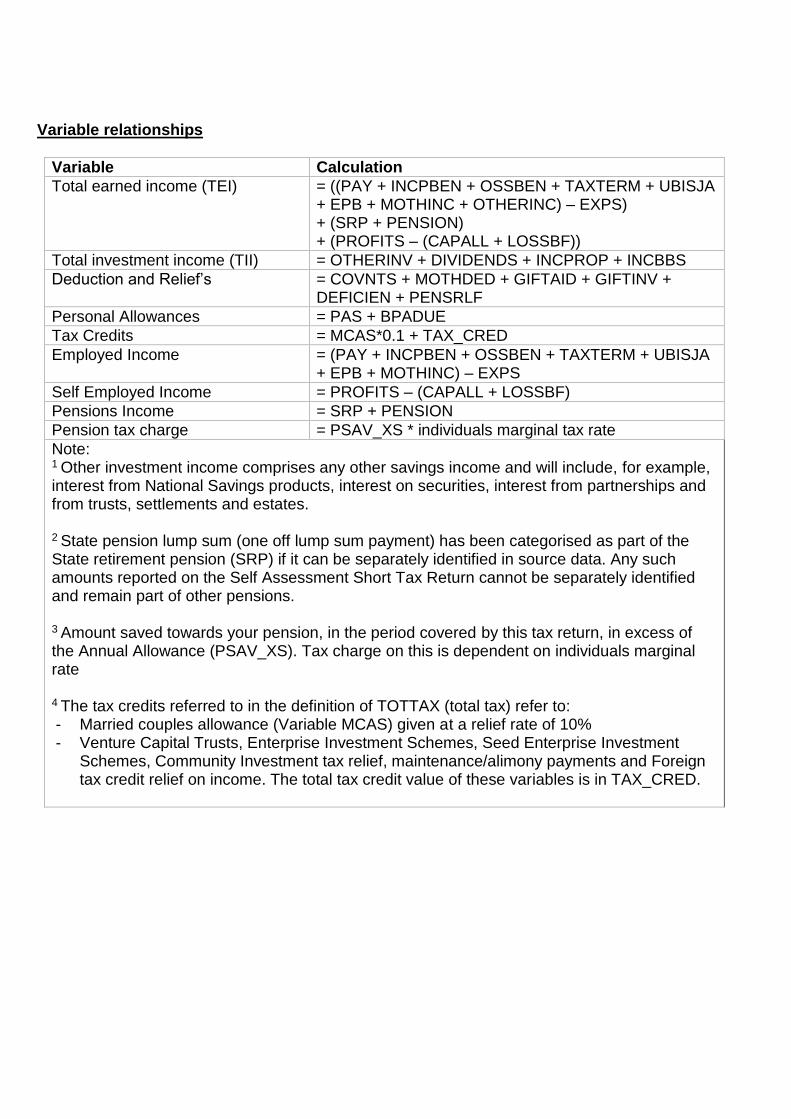
Variable relationships
Variable Calculation
Total earned income (TEI) = ((PAY + INCPBEN + OSSBEN + TAXTERM + UBISJA + EPB + MOTHINC + OTHERINC) – EXPS) + (SRP + PENSION) + (PROFITS – (CAPALL + LOSSBF))
Total investment income (TII) = OTHERINV + DIVIDENDS + INCPROP + INCBBS
Deduction and Relief’s = COVNTS + MOTHDED + GIFTAID + GIFTINV + DEFICIEN + PENSRLF
Personal Allowances = PAS + BPADUE
Tax Credits = MCAS*0.1 + TAX_CRED
Employed Income = (PAY + INCPBEN + OSSBEN + TAXTERM + UBISJA + EPB + MOTHINC) – EXPS
Self Employed Income = PROFITS – (CAPALL + LOSSBF)
Pensions Income = SRP + PENSION
Pension tax charge = PSAV_XS * individuals marginal tax rate
Note: 1 Other investment income comprises any other savings income and will include, for example, interest from National Savings products, interest on securities, interest from partnerships and from trusts, settlements and estates. 2 State pension lump sum (one off lump sum payment) has been categorised as part of the State retirement pension (SRP) if it can be separately identified in source data. Any such amounts reported on the Self Assessment Short Tax Return cannot be separately identified and remain part of other pensions. 3 Amount saved towards your pension, in the period covered by this tax return, in excess of the Annual Allowance (PSAV_XS). Tax charge on this is dependent on individuals marginal rate 4 The tax credits referred to in the definition of TOTTAX (total tax) refer to: - Married couples allowance (Variable MCAS) given at a relief rate of 10% - Venture Capital Trusts, Enterprise Investment Schemes, Seed Enterprise Investment
Schemes, Community Investment tax relief, maintenance/alimony payments and Foreign tax credit relief on income. The total tax credit value of these variables is in TAX_CRED.

ANNEX B: LIST OF COMPOSITE RECORDS ON PUBLIC USE TAPE Composite Record Number 1 Source: SA
Gender Male
Stratum 101
Income Over £1.2m
Grossing Factor 49.16
Number of original cases 3
Code % Of Record
Breakdown Of Composite Record Code Description With Code
7 London 33% 8 South East 33% 11 Scotland 33% N Administrative and support service activities 33% 1600 Those with any income from pensions 67% % Of Record
Income or Deductions status Variable Name Category With Code
TI Total Income 100% TOTTAX Total Tax 100% TEI Earned Income 100% TII Investment Income 100% See Annex A Deductions and Reliefs 67% See Annex A Self Employed 33% See Annex A Employed 67% PENSION Other Pensions 67% INCPROP Property 33% INCBBS Bank and Building Society 33% DIVIDENDS Dividends 100%
Composite Record Number 2 Source: SA
Gender Male Stratum 103 Income Over £6m Grossing Factor 65.18 Number of original cases 6
Code % Of Record Breakdown Of Composite Record Code Description With Code
2 North West 17% 6 East of England 17% 7 London 50% 9 South West 17% G Wholesale and retail trade; repair of motor vehicles and motor cycles 17% K Financial and insurance activities 17% L Real estate activities 17% 1600 Those with any income from pensions 17% blank Unknown 33%
% Of Record
Income or Deductions status Variable Name Category With Code
TI Total Income 100%
TOTTAX Total Tax 100%
TEI Earned Income 100%
TII Investment Income 100%
See Annex A Deductions and Reliefs 50%
See Annex A Self Employed 17%
See Annex A Employed 100%
SRP State Pension 17%
PENSION Other Pensions 17%
INCPROP Property 33%
INCBBS Bank and Building Society 67%
DIVIDENDS Dividends 100%
OTHERINV Other Investment 67%
Composite Record Number 3 Source: SA
Gender Male Stratum 109 Income Over £5.1m Grossing Factor 55.52 Number of original cases 5
Code % Of Record Breakdown Of Composite Record Code Description With Code
2 North West 20% 3 Yorkshire & the Humber 20% 7 London 60%
K Financial and insurance activities 40% 1600 Those with any income from pensions 40% blank Unknown 20%
% Of Record
Income or Deductions status Variable Name Category With Code
TI Total Income 100%
TOTTAX Total Tax 100%
TEI Earned Income 100%
TII Investment Income 100%
See Annex A Deductions and Reliefs 100%
See Annex A Self Employed 100%
See Annex A Employed 80%
SRP State Pension 40%
PENSION Other Pensions 40%
INCPROP Property 60%
INCBBS Bank and Building Society 100%
DIVIDENDS Dividends 60%
OTHERINV Other Investment 80%
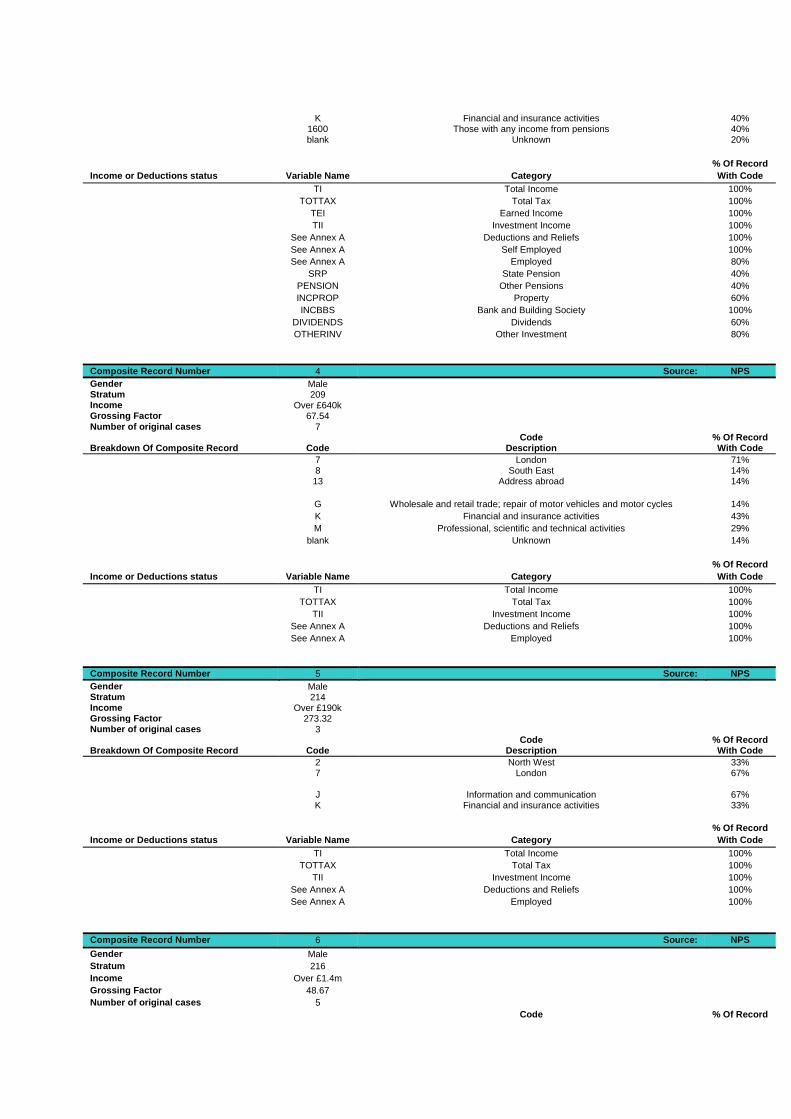
Composite Record Number 4 Source: NPS
Gender Male Stratum 209 Income Over £640k Grossing Factor 67.54 Number of original cases 7
Code % Of Record Breakdown Of Composite Record Code Description With Code
7 London 71% 8 South East 14% 13 Address abroad 14%
G Wholesale and retail trade; repair of motor vehicles and motor cycles 14%
K Financial and insurance activities 43%
M Professional, scientific and technical activities 29%
blank Unknown 14%
% Of Record
Income or Deductions status Variable Name Category With Code
TI Total Income 100%
TOTTAX Total Tax 100%
TII Investment Income 100%
See Annex A Deductions and Reliefs 100%
See Annex A Employed 100%
Composite Record Number 5 Source: NPS
Gender Male Stratum 214 Income Over £190k Grossing Factor 273.32 Number of original cases 3
Code % Of Record Breakdown Of Composite Record Code Description With Code
2 North West 33% 7 London 67% J Information and communication 67% K Financial and insurance activities 33%
% Of Record
Income or Deductions status Variable Name Category With Code
TI Total Income 100%
TOTTAX Total Tax 100%
TII Investment Income 100%
See Annex A Deductions and Reliefs 100%
See Annex A Employed 100%
Composite Record Number 6 Source: NPS
Gender Male
Stratum 216
Income Over £1.4m
Grossing Factor 48.67
Number of original cases 5
Code % Of Record
Breakdown Of Composite Record Code Description With Code
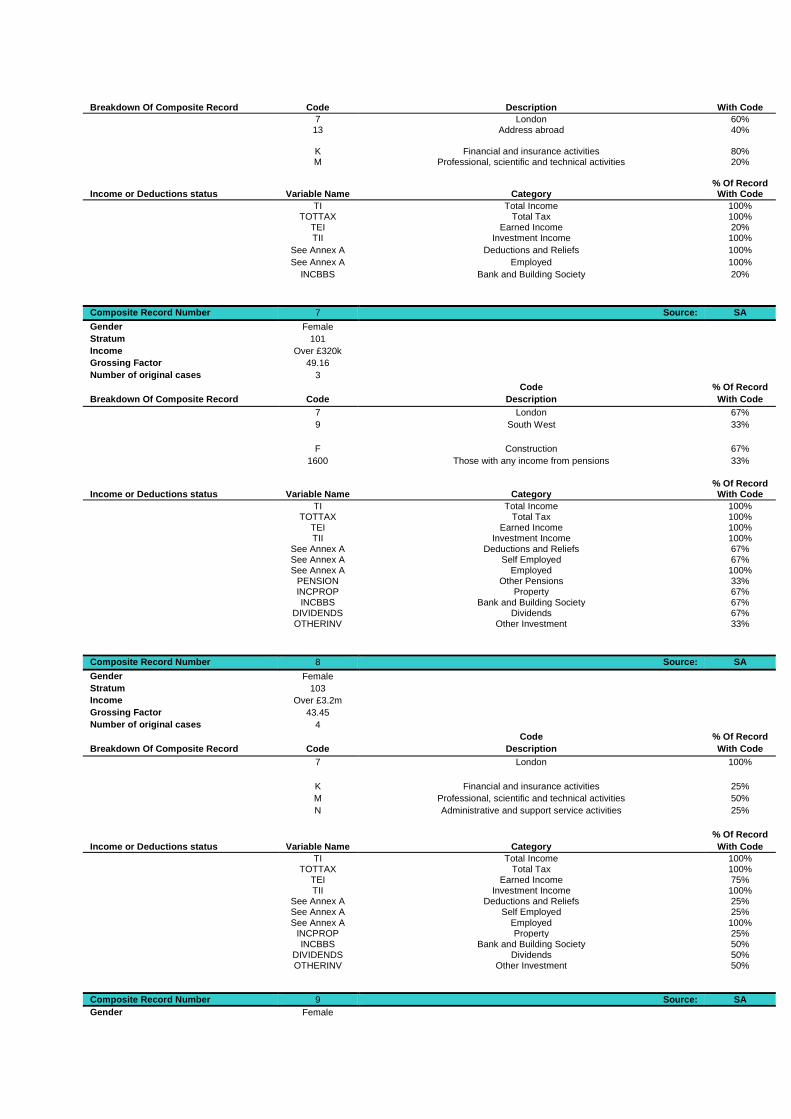
7 London 60% 13 Address abroad 40% K Financial and insurance activities 80% M Professional, scientific and technical activities 20% % Of Record
Income or Deductions status Variable Name Category With Code
TI Total Income 100% TOTTAX Total Tax 100% TEI Earned Income 20% TII Investment Income 100%
See Annex A Deductions and Reliefs 100%
See Annex A Employed 100%
INCBBS Bank and Building Society 20%
Composite Record Number 7 Source: SA
Gender Female
Stratum 101
Income Over £320k
Grossing Factor 49.16
Number of original cases 3
Code % Of Record
Breakdown Of Composite Record Code Description With Code
7 London 67%
9 South West 33%
F Construction 67%
1600 Those with any income from pensions 33%
% Of Record
Income or Deductions status Variable Name Category With Code
TI Total Income 100% TOTTAX Total Tax 100% TEI Earned Income 100% TII Investment Income 100% See Annex A Deductions and Reliefs 67% See Annex A Self Employed 67% See Annex A Employed 100% PENSION Other Pensions 33% INCPROP Property 67% INCBBS Bank and Building Society 67% DIVIDENDS Dividends 67% OTHERINV Other Investment 33%
Composite Record Number 8 Source: SA
Gender Female
Stratum 103
Income Over £3.2m
Grossing Factor 43.45
Number of original cases 4
Code % Of Record
Breakdown Of Composite Record Code Description With Code
7 London 100%
K Financial and insurance activities 25%
M Professional, scientific and technical activities 50%
N Administrative and support service activities 25%
% Of Record
Income or Deductions status Variable Name Category With Code
TI Total Income 100% TOTTAX Total Tax 100% TEI Earned Income 75% TII Investment Income 100% See Annex A Deductions and Reliefs 25% See Annex A Self Employed 25% See Annex A Employed 100% INCPROP Property 25% INCBBS Bank and Building Society 50% DIVIDENDS Dividends 50% OTHERINV Other Investment 50%
Composite Record Number 9 Source: SA
Gender Female

Stratum 109 Income Over £2.5m Grossing Factor 66.62 Number of original cases 6
Code % Of Record
Breakdown Of Composite Record Code Description With Code
2 North West 17%
7 London 33%
8 South East 17%
9 South West 17%
11 Scotland 17%
G Wholesale and retail trade; repair of motor vehicles and motor cycles 17%
K Financial and insurance activities 33%
N Administrative and support service activities 17%
R Arts, entertainment and recreation 17%
blank Unknown 17%
% Of Record
Income or Deductions status Variable Name Category With Code
TI Total Income 100%
TOTTAX Total Tax 100%
TEI Earned Income 100%
TII Investment Income 100%
See Annex A Deductions and Reliefs 50% See Annex A Self Employed 83% See Annex A Employed 33% INCPROP Property 33% INCBBS Bank and Building Society 100% DIVIDENDS Dividends 83% OTHERINV Other Investment 83%
Composite Record Number 10 Source: NPS
Gender Female Stratum 232 Income Over £380k Grossing Factor 34.52 Number of original cases 4
Code % Of Record Breakdown Of Composite Record Code Description With Code
Government Office Region 1 North East 25% 2 North West 25% 7 London 50%
J Information and communication 25%
K Financial and insurance activities 50%
M Professional, scientific and technical activities 25%
% Of Record
Income or Deductions status Variable Name Category With Code
TI Total Income 100%
TOTTAX Total Tax 100%
TII Investment Income 100%
See Annex A Deductions and Reliefs 100%
See Annex A Employed 100%
Composite Record Number 11 Source: SA
Gender Male
Stratum 116
Income Over £32m
Grossing Factor 31.28
Number of original cases 28
Code % Of Record
Breakdown Of Composite Record Code Description With Code
4 East Midlands 7% 6 East of England 7% 7 London 68% 8 South East 4% 9 South West 14% F Construction 4% G Wholesale and retail trade; repair of motor vehicles and motor cycles 4% J Information and communication 7% K Financial and insurance activities 54% M Professional, scientific and technical activities 4% N Administrative and support service activities 4% P Education 4%
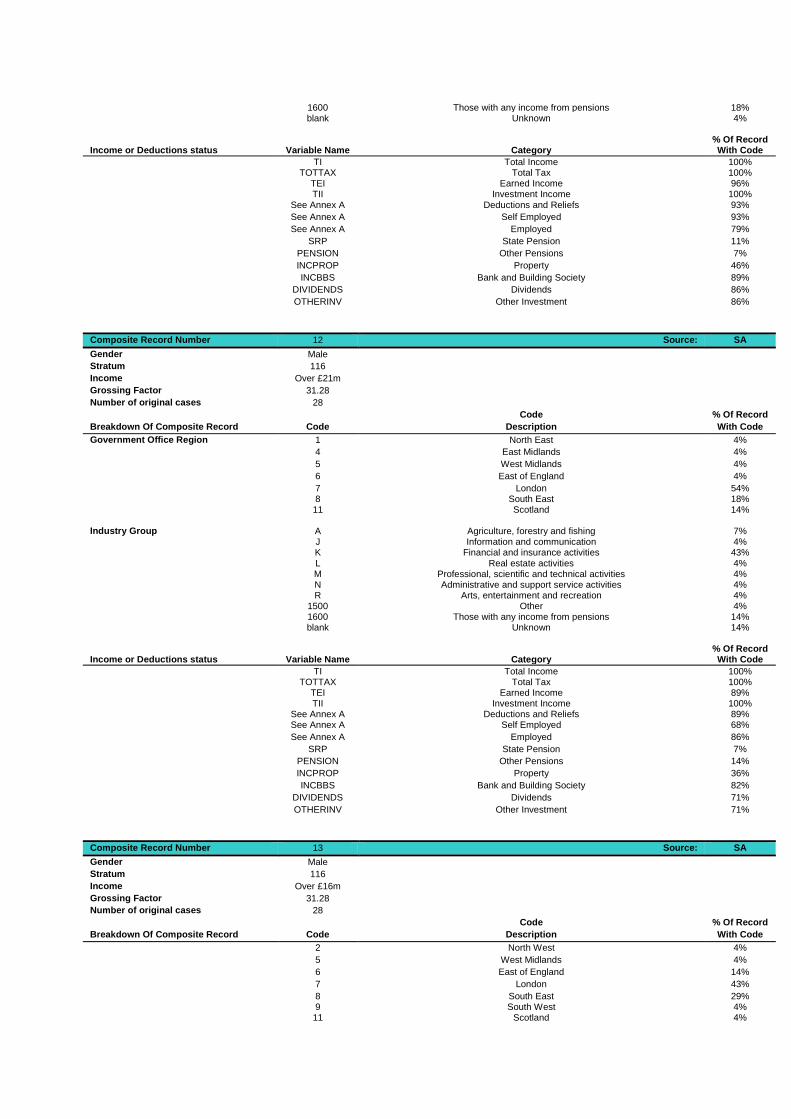
1600 Those with any income from pensions 18% blank Unknown 4% % Of Record
Income or Deductions status Variable Name Category With Code
TI Total Income 100% TOTTAX Total Tax 100% TEI Earned Income 96% TII Investment Income 100% See Annex A Deductions and Reliefs 93%
See Annex A Self Employed 93%
See Annex A Employed 79%
SRP State Pension 11%
PENSION Other Pensions 7%
INCPROP Property 46%
INCBBS Bank and Building Society 89%
DIVIDENDS Dividends 86%
OTHERINV Other Investment 86%
Composite Record Number 12 Source: SA
Gender Male
Stratum 116
Income Over £21m
Grossing Factor 31.28
Number of original cases 28
Code % Of Record
Breakdown Of Composite Record Code Description With Code
Government Office Region 1 North East 4%
4 East Midlands 4%
5 West Midlands 4%
6 East of England 4%
7 London 54% 8 South East 18% 11 Scotland 14%
Industry Group A Agriculture, forestry and fishing 7% J Information and communication 4% K Financial and insurance activities 43% L Real estate activities 4% M Professional, scientific and technical activities 4% N Administrative and support service activities 4% R Arts, entertainment and recreation 4% 1500 Other 4% 1600 Those with any income from pensions 14% blank Unknown 14% % Of Record
Income or Deductions status Variable Name Category With Code
TI Total Income 100% TOTTAX Total Tax 100% TEI Earned Income 89% TII Investment Income 100% See Annex A Deductions and Reliefs 89% See Annex A Self Employed 68%
See Annex A Employed 86%
SRP State Pension 7%
PENSION Other Pensions 14%
INCPROP Property 36%
INCBBS Bank and Building Society 82%
DIVIDENDS Dividends 71%
OTHERINV Other Investment 71%
Composite Record Number 13 Source: SA
Gender Male
Stratum 116
Income Over £16m
Grossing Factor 31.28
Number of original cases 28
Code % Of Record
Breakdown Of Composite Record Code Description With Code
2 North West 4%
5 West Midlands 4%
6 East of England 14%
7 London 43%
8 South East 29% 9 South West 4% 11 Scotland 4%
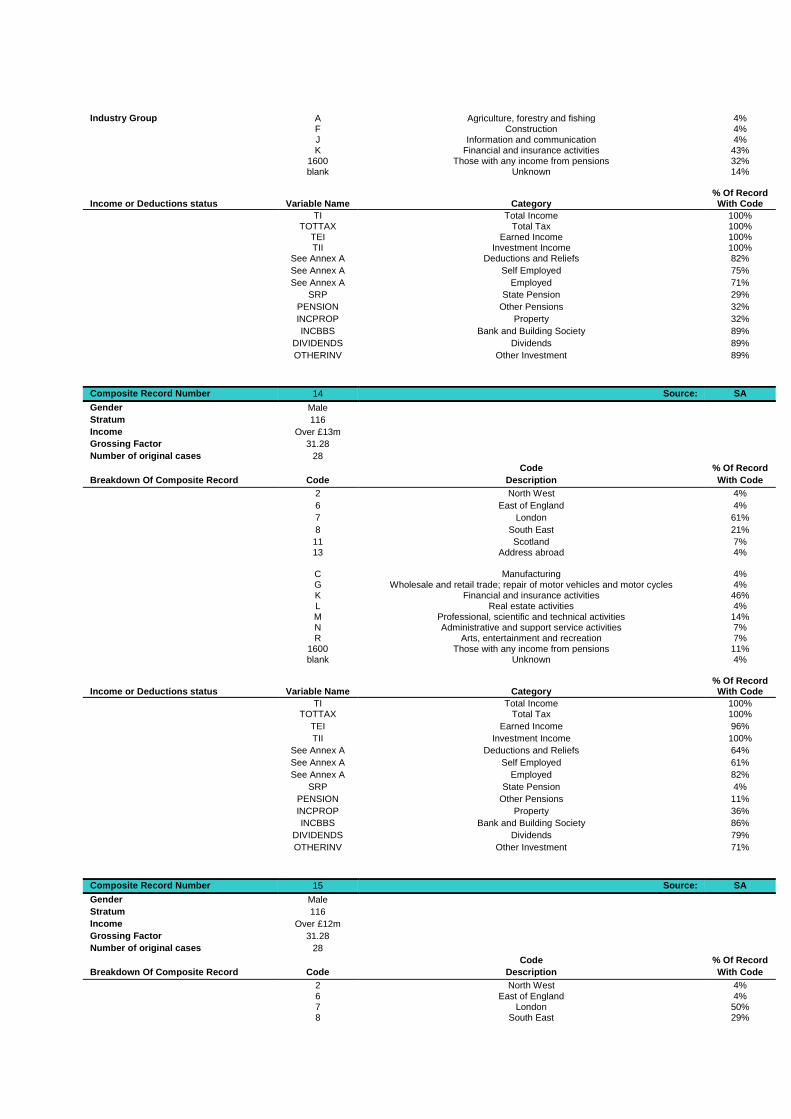
Industry Group A Agriculture, forestry and fishing 4%
F Construction 4% J Information and communication 4% K Financial and insurance activities 43% 1600 Those with any income from pensions 32% blank Unknown 14% % Of Record
Income or Deductions status Variable Name Category With Code
TI Total Income 100% TOTTAX Total Tax 100% TEI Earned Income 100% TII Investment Income 100% See Annex A Deductions and Reliefs 82%
See Annex A Self Employed 75%
See Annex A Employed 71%
SRP State Pension 29%
PENSION Other Pensions 32%
INCPROP Property 32%
INCBBS Bank and Building Society 89%
DIVIDENDS Dividends 89%
OTHERINV Other Investment 89%
Composite Record Number 14 Source: SA
Gender Male
Stratum 116
Income Over £13m
Grossing Factor 31.28
Number of original cases 28
Code % Of Record
Breakdown Of Composite Record Code Description With Code
2 North West 4%
6 East of England 4%
7 London 61%
8 South East 21%
11 Scotland 7% 13 Address abroad 4% C Manufacturing 4% G Wholesale and retail trade; repair of motor vehicles and motor cycles 4% K Financial and insurance activities 46% L Real estate activities 4% M Professional, scientific and technical activities 14% N Administrative and support service activities 7% R Arts, entertainment and recreation 7% 1600 Those with any income from pensions 11% blank Unknown 4% % Of Record
Income or Deductions status Variable Name Category With Code
TI Total Income 100% TOTTAX Total Tax 100%
TEI Earned Income 96%
TII Investment Income 100%
See Annex A Deductions and Reliefs 64%
See Annex A Self Employed 61%
See Annex A Employed 82%
SRP State Pension 4%
PENSION Other Pensions 11%
INCPROP Property 36%
INCBBS Bank and Building Society 86%
DIVIDENDS Dividends 79%
OTHERINV Other Investment 71%
Composite Record Number 15 Source: SA
Gender Male
Stratum 116
Income Over £12m
Grossing Factor 31.28
Number of original cases 28
Code % Of Record
Breakdown Of Composite Record Code Description With Code
2 North West 4% 6 East of England 4% 7 London 50% 8 South East 29%

9 South West 11% 11 Scotland 4% J Information and communication 11% K Financial and insurance activities 50% M Professional, scientific and technical activities 14% N Administrative and support service activities 4% 1600 Those with any income from pensions 14% blank Unknown 7% % Of Record
Income or Deductions status Variable Name Category With Code
TI Total Income 100% TOTTAX Total Tax 100%
TEI Earned Income 96%
TII Investment Income 100%
See Annex A Deductions and Reliefs 86%
See Annex A Self Employed 46%
See Annex A Employed 100%
SRP State Pension 11%
PENSION Other Pensions 11%
INCPROP Property 32%
INCBBS Bank and Building Society 86%
DIVIDENDS Dividends 71%
OTHERINV Other Investment 79%
Composite Record Number 16 Source: SA
Gender Male
Stratum 116
Income Over £10m
Grossing Factor 31.28
Number of original cases 28
Code % Of Record
Breakdown Of Composite Record Code Description With Code
2 North West 11%
3 Yorkshire & the Humber 7% 5 West Midlands 4% 6 East of England 4% 7 London 39% 8 South East 11% 9 South West 4% 11 Scotland 14% 13 Address abroad 7% G Wholesale and retail trade; repair of motor vehicles and motor cycles 4% H Transport and storage 4% J Information and communication 7% K Financial and insurance activities 36% L Real estate activities 4% M Professional, scientific and technical activities 7% R Arts, entertainment and recreation 4% 1500 Other 4% 1600 Those with any income from pensions 21% blank Unknown 11% % Of Record
Income or Deductions status Variable Name Category With Code
TI Total Income 100% TOTTAX Total Tax 100%
TEI Earned Income 100%
TII Investment Income 100%
See Annex A Deductions and Reliefs 75%
See Annex A Self Employed 36%
See Annex A Employed 93%
SRP State Pension 7%
PENSION Other Pensions 21%
INCPROP Property 18%
INCBBS Bank and Building Society 93%
DIVIDENDS Dividends 79%
OTHERINV Other Investment 64%
Composite Record Number 17 Source: SA
Gender Male
Stratum 116
Income Over £10m
Grossing Factor 31.28
Number of original cases 28

Code % Of Record
Breakdown Of Composite Record Code Description With Code
2 North West 14%
3 Yorkshire & the Humber 4% 6 East of England 11% 7 London 36% 8 South East 29% 9 South West 4% 11 Scotland 4% F Construction 7% G Wholesale and retail trade; repair of motor vehicles and motor cycles 4% J Information and communication 7% K Financial and insurance activities 25% L Real estate activities 7% M Professional, scientific and technical activities 4% R Arts, entertainment and recreation 18% 1600 Those with any income from pensions 7% blank Unknown 21% % Of Record
Income or Deductions status Variable Name Category With Code
TI Total Income 100%
TOTTAX Total Tax 100%
TEI Earned Income 100%
TII Investment Income 100%
See Annex A Deductions and Reliefs 79%
See Annex A Self Employed 64%
See Annex A Employed 75%
SRP State Pension 4%
PENSION Other Pensions 7%
INCPROP Property 29%
INCBBS Bank and Building Society 96%
DIVIDENDS Dividends 86%
OTHERINV Other Investment 79%
Composite Record Number 18 Source: SA
Gender Male
Stratum 116
Income Over £9.3m
Grossing Factor 31.28
Number of original cases 28 Code % Of Record
Breakdown Of Composite Record Code Description With Code
2 North West 4% 3 Yorkshire & the Humber 4% 4 East Midlands 4% 6 East of England 4% 7 London 57% 8 South East 18% 9 South West 7% 13 Address abroad 4% C Manufacturing 7% F Construction 4% G Wholesale and retail trade; repair of motor vehicles and motor cycles 7% J Information and communication 7% K Financial and insurance activities 32% M Professional, scientific and technical activities 4% R Arts, entertainment and recreation 14% 1500 Other 4% 1600 Those with any income from pensions 18%
blank Unknown 4%
% Of Record
Income or Deductions status Variable Name Category With Code
TI Total Income 100%
TOTTAX Total Tax 96%
TEI Earned Income 96%
TII Investment Income 100%
See Annex A Deductions and Reliefs 57%
See Annex A Self Employed 46%
See Annex A Employed 79%
SRP State Pension 14%
PENSION Other Pensions 11%
INCPROP Property 36%
INCBBS Bank and Building Society 64%
DIVIDENDS Dividends 75%
OTHERINV Other Investment 64%
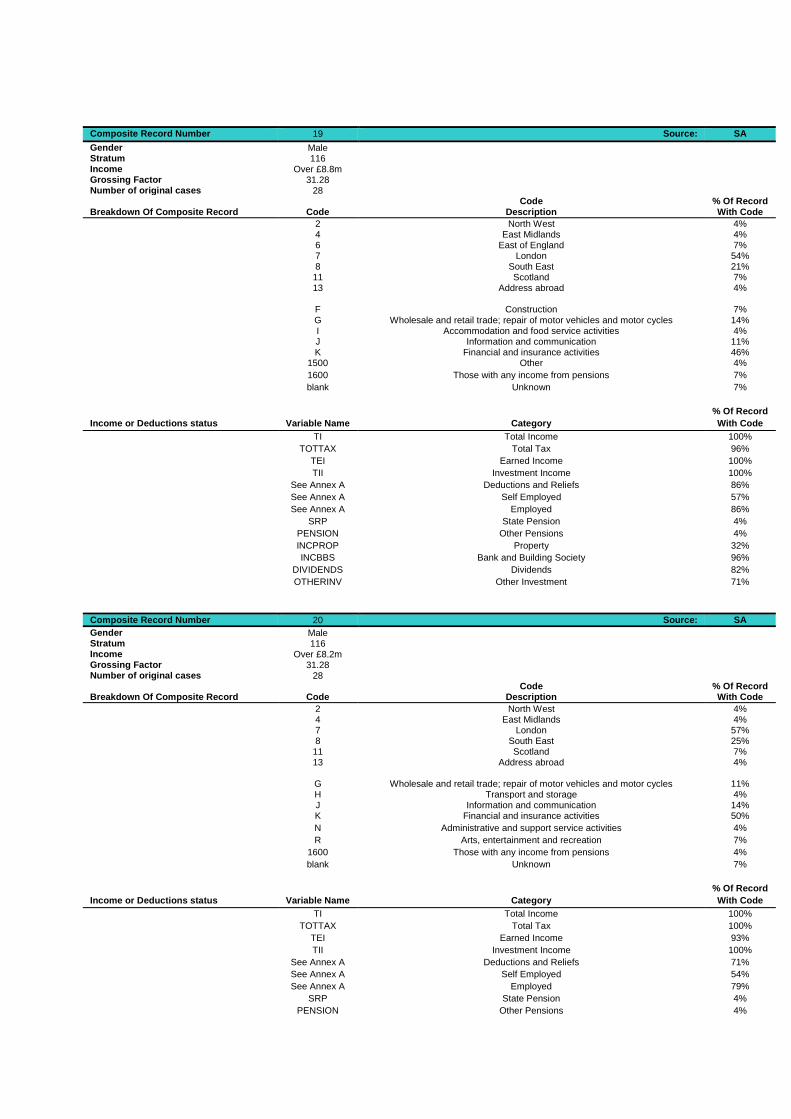
Composite Record Number 19 Source: SA
Gender Male Stratum 116 Income Over £8.8m Grossing Factor 31.28 Number of original cases 28
Code % Of Record Breakdown Of Composite Record Code Description With Code
2 North West 4% 4 East Midlands 4% 6 East of England 7% 7 London 54% 8 South East 21% 11 Scotland 7% 13 Address abroad 4% F Construction 7% G Wholesale and retail trade; repair of motor vehicles and motor cycles 14% I Accommodation and food service activities 4% J Information and communication 11% K Financial and insurance activities 46% 1500 Other 4%
1600 Those with any income from pensions 7%
blank Unknown 7%
% Of Record
Income or Deductions status Variable Name Category With Code
TI Total Income 100%
TOTTAX Total Tax 96%
TEI Earned Income 100%
TII Investment Income 100%
See Annex A Deductions and Reliefs 86%
See Annex A Self Employed 57%
See Annex A Employed 86%
SRP State Pension 4%
PENSION Other Pensions 4%
INCPROP Property 32%
INCBBS Bank and Building Society 96%
DIVIDENDS Dividends 82%
OTHERINV Other Investment 71%
Composite Record Number 20 Source: SA
Gender Male Stratum 116 Income Over £8.2m Grossing Factor 31.28 Number of original cases 28
Code % Of Record Breakdown Of Composite Record Code Description With Code
2 North West 4% 4 East Midlands 4% 7 London 57% 8 South East 25% 11 Scotland 7% 13 Address abroad 4% G Wholesale and retail trade; repair of motor vehicles and motor cycles 11% H Transport and storage 4% J Information and communication 14% K Financial and insurance activities 50%
N Administrative and support service activities 4%
R Arts, entertainment and recreation 7%
1600 Those with any income from pensions 4%
blank Unknown 7%
% Of Record
Income or Deductions status Variable Name Category With Code
TI Total Income 100%
TOTTAX Total Tax 100%
TEI Earned Income 93%
TII Investment Income 100%
See Annex A Deductions and Reliefs 71%
See Annex A Self Employed 54%
See Annex A Employed 79%
SRP State Pension 4%
PENSION Other Pensions 4%
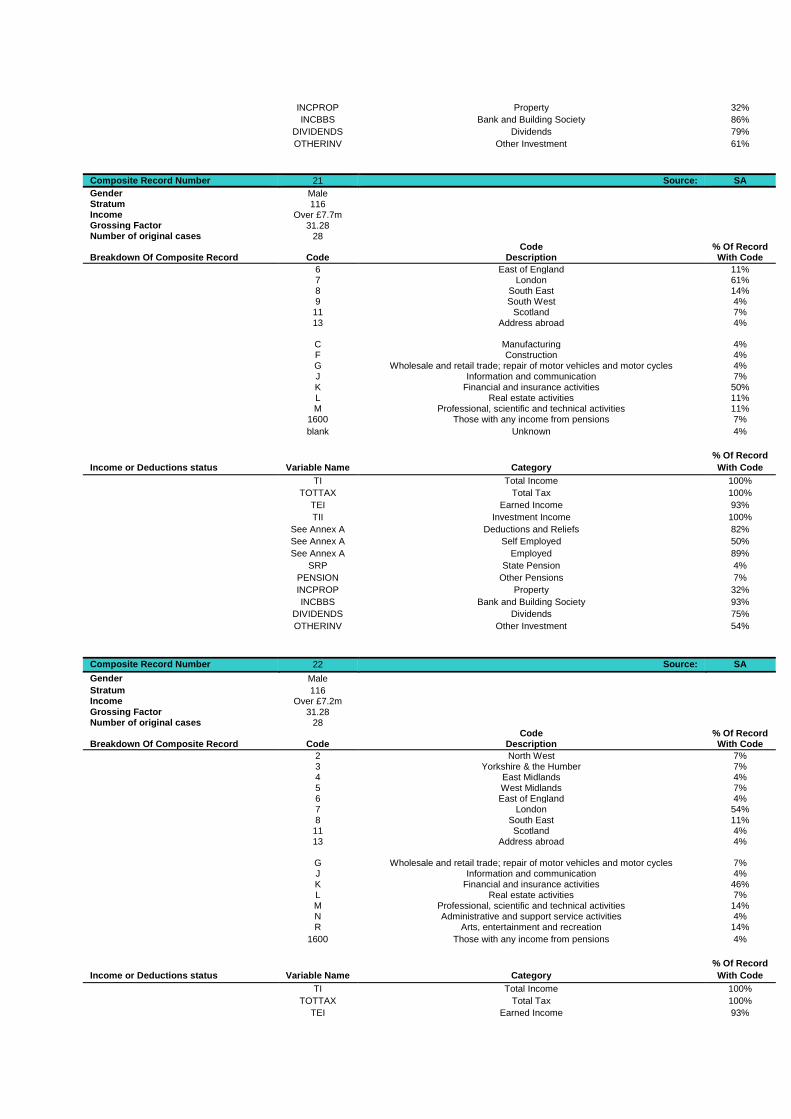
INCPROP Property 32%
INCBBS Bank and Building Society 86%
DIVIDENDS Dividends 79%
OTHERINV Other Investment 61%
Composite Record Number 21 Source: SA
Gender Male Stratum 116 Income Over £7.7m Grossing Factor 31.28 Number of original cases 28
Code % Of Record Breakdown Of Composite Record Code Description With Code
6 East of England 11% 7 London 61% 8 South East 14% 9 South West 4% 11 Scotland 7% 13 Address abroad 4% C Manufacturing 4% F Construction 4% G Wholesale and retail trade; repair of motor vehicles and motor cycles 4% J Information and communication 7% K Financial and insurance activities 50% L Real estate activities 11% M Professional, scientific and technical activities 11% 1600 Those with any income from pensions 7%
blank Unknown 4%
% Of Record
Income or Deductions status Variable Name Category With Code
TI Total Income 100%
TOTTAX Total Tax 100%
TEI Earned Income 93%
TII Investment Income 100%
See Annex A Deductions and Reliefs 82%
See Annex A Self Employed 50%
See Annex A Employed 89%
SRP State Pension 4%
PENSION Other Pensions 7%
INCPROP Property 32%
INCBBS Bank and Building Society 93%
DIVIDENDS Dividends 75%
OTHERINV Other Investment 54%
Composite Record Number 22 Source: SA
Gender Male
Stratum 116 Income Over £7.2m Grossing Factor 31.28 Number of original cases 28
Code % Of Record Breakdown Of Composite Record Code Description With Code
2 North West 7% 3 Yorkshire & the Humber 7% 4 East Midlands 4% 5 West Midlands 7% 6 East of England 4% 7 London 54% 8 South East 11% 11 Scotland 4% 13 Address abroad 4% G Wholesale and retail trade; repair of motor vehicles and motor cycles 7% J Information and communication 4% K Financial and insurance activities 46% L Real estate activities 7% M Professional, scientific and technical activities 14% N Administrative and support service activities 4% R Arts, entertainment and recreation 14%
1600 Those with any income from pensions 4%
% Of Record
Income or Deductions status Variable Name Category With Code
TI Total Income 100%
TOTTAX Total Tax 100%
TEI Earned Income 93%
TII Investment Income 100%
See Annex A Deductions and Reliefs 54%
See Annex A Self Employed 43%
See Annex A Employed 89%
SRP State Pension 4%
PENSION Other Pensions 4%
INCPROP Property 25%
INCBBS Bank and Building Society 93%
DIVIDENDS Dividends 61%
OTHERINV Other Investment 54%
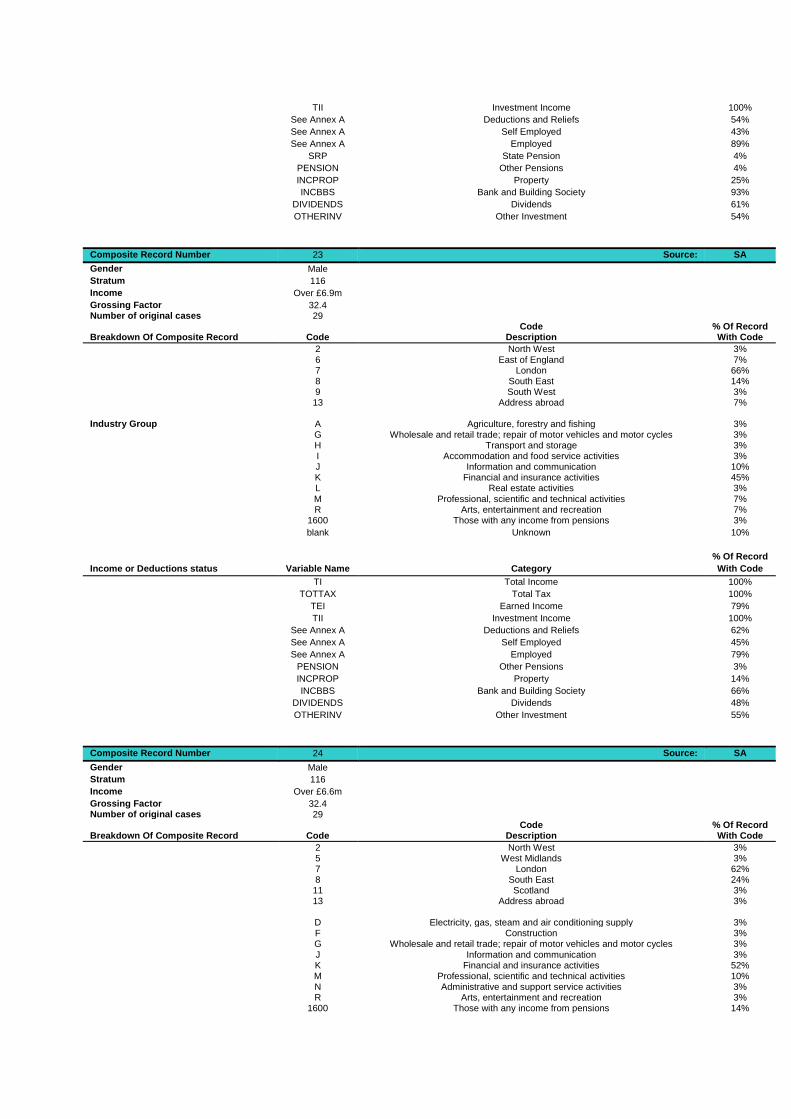
Composite Record Number 23 Source: SA
Gender Male
Stratum 116
Income Over £6.9m
Grossing Factor 32.4 Number of original cases 29
Code % Of Record Breakdown Of Composite Record Code Description With Code
2 North West 3% 6 East of England 7% 7 London 66% 8 South East 14% 9 South West 3% 13 Address abroad 7%
Industry Group A Agriculture, forestry and fishing 3% G Wholesale and retail trade; repair of motor vehicles and motor cycles 3% H Transport and storage 3% I Accommodation and food service activities 3% J Information and communication 10% K Financial and insurance activities 45% L Real estate activities 3% M Professional, scientific and technical activities 7% R Arts, entertainment and recreation 7% 1600 Those with any income from pensions 3%
blank Unknown 10%
% Of Record
Income or Deductions status Variable Name Category With Code
TI Total Income 100%
TOTTAX Total Tax 100%
TEI Earned Income 79%
TII Investment Income 100%
See Annex A Deductions and Reliefs 62%
See Annex A Self Employed 45%
See Annex A Employed 79%
PENSION Other Pensions 3%
INCPROP Property 14%
INCBBS Bank and Building Society 66%
DIVIDENDS Dividends 48%
OTHERINV Other Investment 55%
Composite Record Number 24 Source: SA
Gender Male
Stratum 116
Income Over £6.6m
Grossing Factor 32.4 Number of original cases 29
Code % Of Record Breakdown Of Composite Record Code Description With Code
2 North West 3% 5 West Midlands 3% 7 London 62% 8 South East 24% 11 Scotland 3% 13 Address abroad 3% D Electricity, gas, steam and air conditioning supply 3% F Construction 3% G Wholesale and retail trade; repair of motor vehicles and motor cycles 3% J Information and communication 3% K Financial and insurance activities 52% M Professional, scientific and technical activities 10% N Administrative and support service activities 3% R Arts, entertainment and recreation 3% 1600 Those with any income from pensions 14%
blank Unknown 3%
% Of Record
Income or Deductions status Variable Name Category With Code
TI Total Income 100%
TOTTAX Total Tax 100%
TEI Earned Income 79%
TII Investment Income 100%
See Annex A Deductions and Reliefs 55%
See Annex A Self Employed 31%
See Annex A Employed 93%
SRP State Pension 3%
PENSION Other Pensions 14%
INCPROP Property 21%
INCBBS Bank and Building Society 69%
DIVIDENDS Dividends 62%
OTHERINV Other Investment 48%
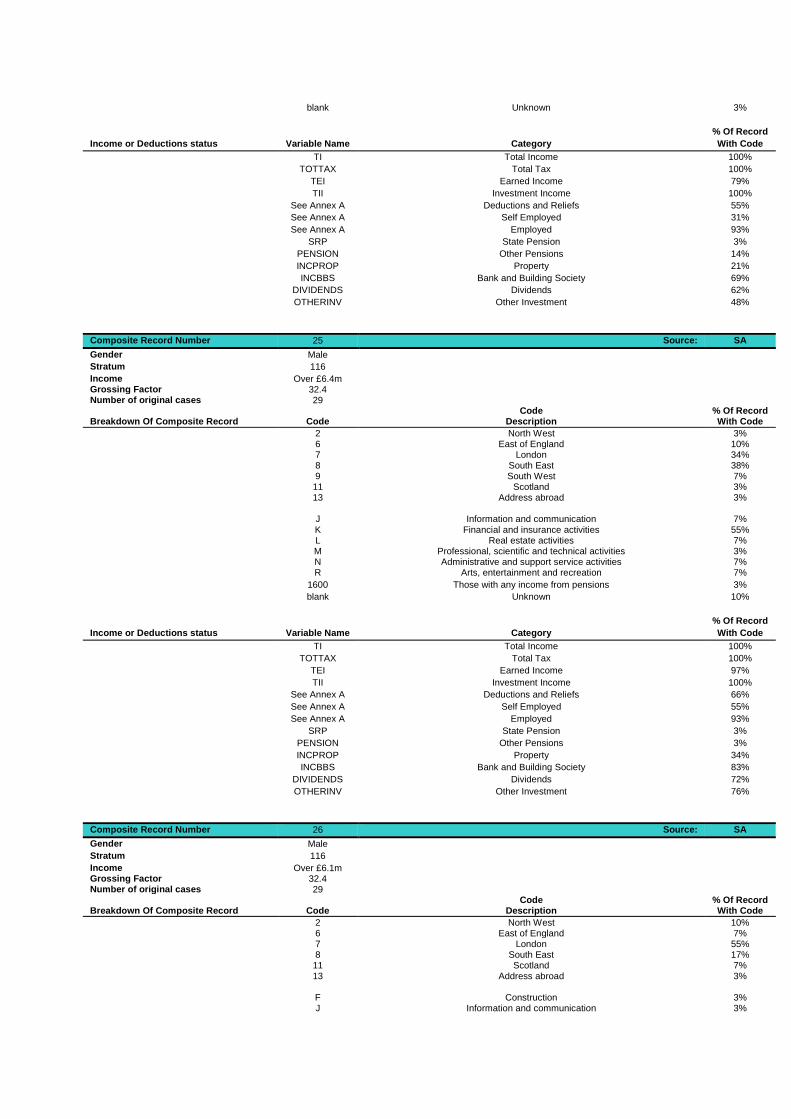
Composite Record Number 25 Source: SA
Gender Male
Stratum 116
Income Over £6.4m Grossing Factor 32.4 Number of original cases 29
Code % Of Record Breakdown Of Composite Record Code Description With Code
2 North West 3% 6 East of England 10% 7 London 34% 8 South East 38% 9 South West 7% 11 Scotland 3% 13 Address abroad 3% J Information and communication 7% K Financial and insurance activities 55% L Real estate activities 7% M Professional, scientific and technical activities 3% N Administrative and support service activities 7% R Arts, entertainment and recreation 7%
1600 Those with any income from pensions 3%
blank Unknown 10%
% Of Record
Income or Deductions status Variable Name Category With Code
TI Total Income 100%
TOTTAX Total Tax 100%
TEI Earned Income 97%
TII Investment Income 100%
See Annex A Deductions and Reliefs 66%
See Annex A Self Employed 55%
See Annex A Employed 93%
SRP State Pension 3%
PENSION Other Pensions 3%
INCPROP Property 34%
INCBBS Bank and Building Society 83%
DIVIDENDS Dividends 72%
OTHERINV Other Investment 76%
Composite Record Number 26 Source: SA
Gender Male
Stratum 116
Income Over £6.1m Grossing Factor 32.4 Number of original cases 29
Code % Of Record Breakdown Of Composite Record Code Description With Code
2 North West 10% 6 East of England 7% 7 London 55% 8 South East 17% 11 Scotland 7% 13 Address abroad 3% F Construction 3% J Information and communication 3%

K Financial and insurance activities 59% M Professional, scientific and technical activities 17% R Arts, entertainment and recreation 10% 1600 Those with any income from pensions 3% blank Unknown 3%
% Of Record
Income or Deductions status Variable Name Category With Code
TI Total Income 100%
TOTTAX Total Tax 100%
TEI Earned Income 97%
TII Investment Income 100%
See Annex A Deductions and Reliefs 66%
See Annex A Self Employed 45%
See Annex A Employed 93%
SRP State Pension 3%
PENSION Other Pensions 3%
INCPROP Property 31%
INCBBS Bank and Building Society 83%
DIVIDENDS Dividends 72%
OTHERINV Other Investment 52%
Composite Record Number 27 Source: SA
Gender Male
Stratum 116
Income Over £5.9m Grossing Factor 32.4 Number of original cases 29
Code % Of Record Breakdown Of Composite Record Code Description With Code
2 North West 10% 4 East Midlands 3% 6 East of England 3% 7 London 52% 8 South East 14% 11 Scotland 7% 13 Address abroad 10% F Construction 3% G Wholesale and retail trade; repair of motor vehicles and motor cycles 7% I Accommodation and food service activities 3% K Financial and insurance activities 41% L Real estate activities 3% M Professional, scientific and technical activities 3%
N Administrative and support service activities 3%
R Arts, entertainment and recreation 17%
1500 Other 3%
1600 Those with any income from pensions 7%
blank Unknown 7%
% Of Record
Income or Deductions status Variable Name Category With Code
TI Total Income 100%
TOTTAX Total Tax 100%
TEI Earned Income 83%
TII Investment Income 100%
See Annex A Deductions and Reliefs 55%
See Annex A Self Employed 48%
See Annex A Employed 76%
PENSION Other Pensions 7%
INCPROP Property 21%
INCBBS Bank and Building Society 72%
DIVIDENDS Dividends 69%
OTHERINV Other Investment 62%
Composite Record Number 28 Source: SA
Gender Male Stratum 116 Income Over £5.5m Grossing Factor 32.4 Number of original cases 29
Code % Of Record Breakdown Of Composite Record Code Description With Code
2 North West 10% 6 East of England 3% 7 London 72% 8 South East 10%

13 Address abroad 3% F Construction 3% J Information and communication 3% K Financial and insurance activities 41%
L Real estate activities 3%
M Professional, scientific and technical activities 17%
N Administrative and support service activities 3%
R Arts, entertainment and recreation 14%
1500 Other 3%
1600 Those with any income from pensions 7%
blank Unknown 3%
% Of Record
Income or Deductions status Variable Name Category With Code
TI Total Income 100%
TOTTAX Total Tax 100%
TEI Earned Income 86%
TII Investment Income 100%
See Annex A Deductions and Reliefs 41%
See Annex A Self Employed 48%
See Annex A Employed 86%
PENSION Other Pensions 7%
INCPROP Property 21%
INCBBS Bank and Building Society 62%
DIVIDENDS Dividends 45%
OTHERINV Other Investment 55%
Composite Record Number 29 Source: SA
Gender Female Stratum 116 Income Over £5.6m Grossing Factor 54.75 Number of original cases 49
Code % Of Record Breakdown Of Composite Record Code Description With Code
2 North West 6% 5 West Midlands 2% 6 East of England 12% 7 London 51% 8 South East 10% 9 South West 2% 10 Wales 4% 11 Scotland 10% 13 Address abroad 2%
Industry Group A Agriculture, forestry and fishing 4% G Wholesale and retail trade; repair of motor vehicles and motor cycles 10% H Transport and storage 2% I Accommodation and food service activities 4% J Information and communication 2%
K Financial and insurance activities 33%
L Real estate activities 2%
M Professional, scientific and technical activities 4%
N Administrative and support service activities 2%
P Education 2%
Q Human health and social work activities 2%
R Arts, entertainment and recreation 6%
1500 Other 8%
1600 Those with any income from pensions 16%
blank Unknown 2%
% Of Record
Income or Deductions status Variable Name Category With Code
TI Total Income 100%
TOTTAX Total Tax 96%
TEI Earned Income 90%
TII Investment Income 100%
See Annex A Deductions and Reliefs 67%
See Annex A Self Employed 41%
See Annex A Employed 76%
SRP State Pension 12%
PENSION Other Pensions 10%
INCPROP Property 24% INCBBS Bank and Building Society 82% DIVIDENDS Dividends 76% OTHERINV Other Investment 69%
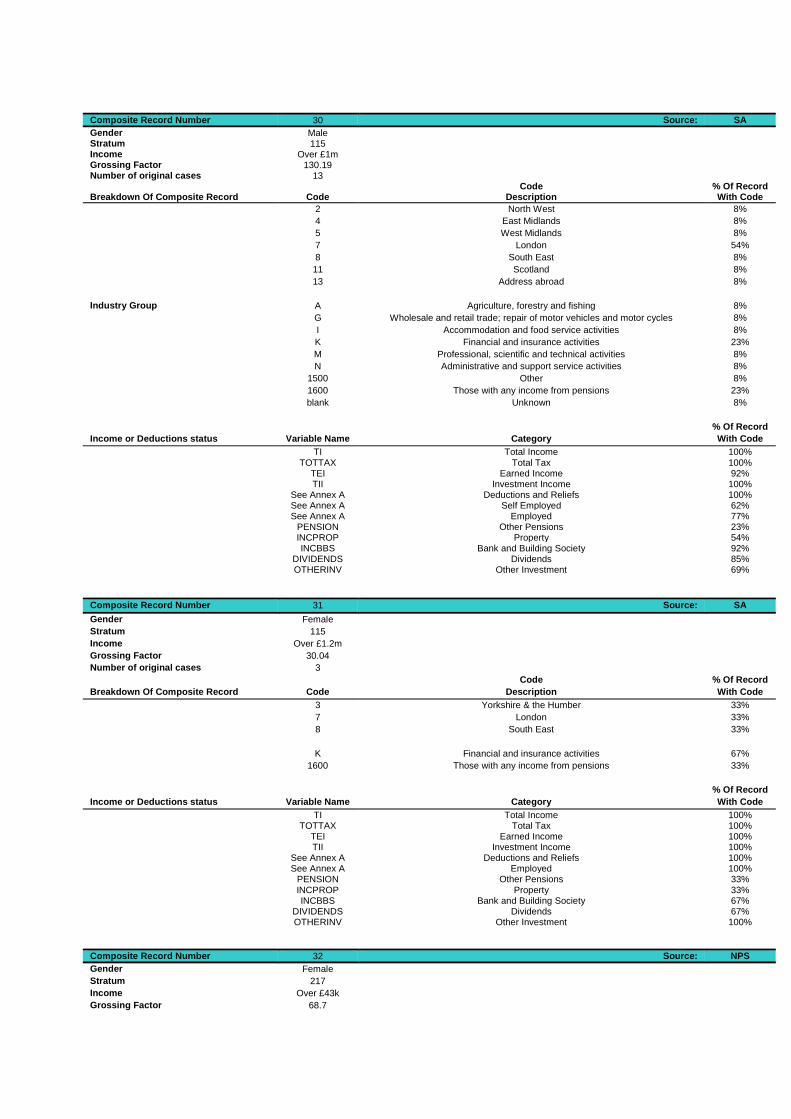
Composite Record Number 30 Source: SA
Gender Male Stratum 115 Income Over £1m Grossing Factor 130.19 Number of original cases 13
Code % Of Record Breakdown Of Composite Record Code Description With Code
2 North West 8%
4 East Midlands 8%
5 West Midlands 8%
7 London 54%
8 South East 8%
11 Scotland 8%
13 Address abroad 8%
Industry Group A Agriculture, forestry and fishing 8%
G Wholesale and retail trade; repair of motor vehicles and motor cycles 8%
I Accommodation and food service activities 8%
K Financial and insurance activities 23%
M Professional, scientific and technical activities 8%
N Administrative and support service activities 8%
1500 Other 8%
1600 Those with any income from pensions 23%
blank Unknown 8%
% Of Record
Income or Deductions status Variable Name Category With Code
TI Total Income 100% TOTTAX Total Tax 100% TEI Earned Income 92% TII Investment Income 100% See Annex A Deductions and Reliefs 100% See Annex A Self Employed 62% See Annex A Employed 77% PENSION Other Pensions 23% INCPROP Property 54% INCBBS Bank and Building Society 92% DIVIDENDS Dividends 85% OTHERINV Other Investment 69%
Composite Record Number 31 Source: SA
Gender Female
Stratum 115
Income Over £1.2m
Grossing Factor 30.04
Number of original cases 3
Code % Of Record
Breakdown Of Composite Record Code Description With Code
3 Yorkshire & the Humber 33%
7 London 33%
8 South East 33%
K Financial and insurance activities 67%
1600 Those with any income from pensions 33%
% Of Record
Income or Deductions status Variable Name Category With Code
TI Total Income 100% TOTTAX Total Tax 100% TEI Earned Income 100% TII Investment Income 100% See Annex A Deductions and Reliefs 100% See Annex A Employed 100% PENSION Other Pensions 33% INCPROP Property 33% INCBBS Bank and Building Society 67% DIVIDENDS Dividends 67% OTHERINV Other Investment 100%
Composite Record Number 32 Source: NPS
Gender Female
Stratum 217
Income Over £43k
Grossing Factor 68.7
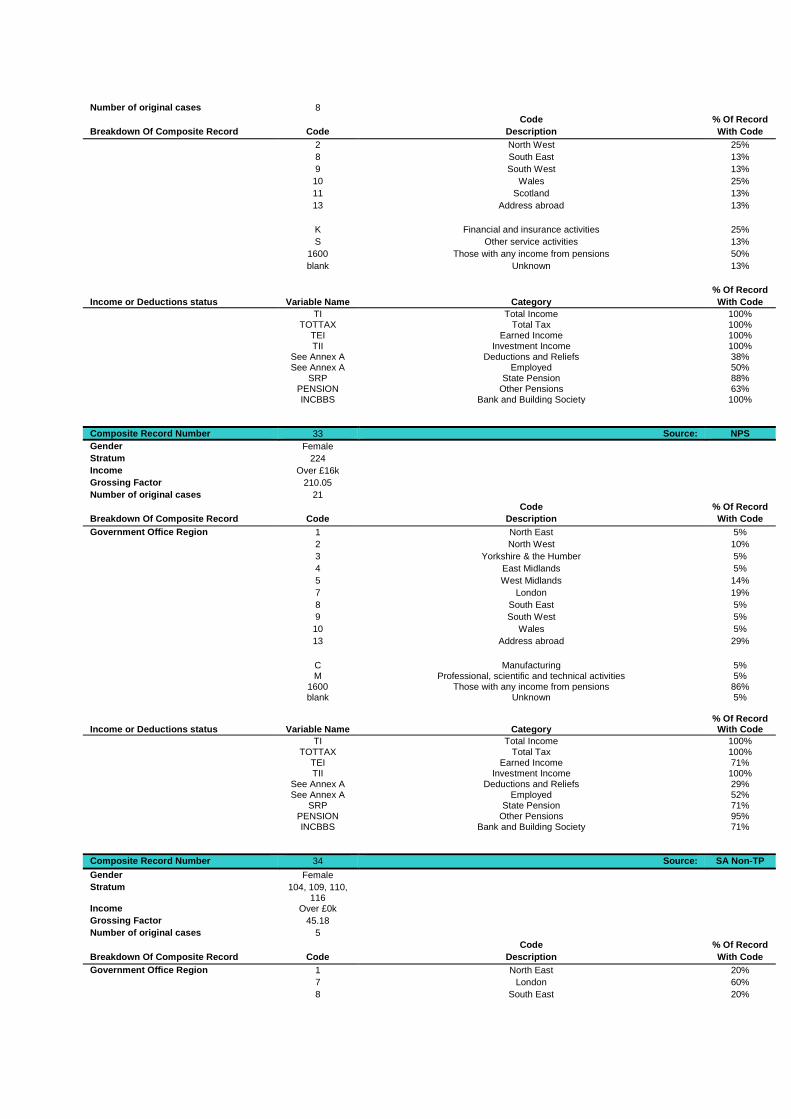
Number of original cases 8
Code % Of Record
Breakdown Of Composite Record Code Description With Code
2 North West 25%
8 South East 13%
9 South West 13%
10 Wales 25%
11 Scotland 13%
13 Address abroad 13%
K Financial and insurance activities 25%
S Other service activities 13%
1600 Those with any income from pensions 50%
blank Unknown 13%
% Of Record
Income or Deductions status Variable Name Category With Code
TI Total Income 100% TOTTAX Total Tax 100% TEI Earned Income 100% TII Investment Income 100% See Annex A Deductions and Reliefs 38% See Annex A Employed 50% SRP State Pension 88% PENSION Other Pensions 63% INCBBS Bank and Building Society 100%
Composite Record Number 33 Source: NPS
Gender Female
Stratum 224
Income Over £16k
Grossing Factor 210.05
Number of original cases 21
Code % Of Record
Breakdown Of Composite Record Code Description With Code
Government Office Region 1 North East 5%
2 North West 10%
3 Yorkshire & the Humber 5%
4 East Midlands 5%
5 West Midlands 14%
7 London 19%
8 South East 5%
9 South West 5%
10 Wales 5%
13 Address abroad 29%
C Manufacturing 5% M Professional, scientific and technical activities 5% 1600 Those with any income from pensions 86% blank Unknown 5% % Of Record
Income or Deductions status Variable Name Category With Code
TI Total Income 100% TOTTAX Total Tax 100% TEI Earned Income 71% TII Investment Income 100% See Annex A Deductions and Reliefs 29% See Annex A Employed 52% SRP State Pension 71% PENSION Other Pensions 95% INCBBS Bank and Building Society 71%
Composite Record Number 34 Source: SA Non-TP
Gender Female
Stratum 104, 109, 110, 116
Income Over £0k
Grossing Factor 45.18
Number of original cases 5
Code % Of Record
Breakdown Of Composite Record Code Description With Code
Government Office Region 1 North East 20%
7 London 60%
8 South East 20%
G Wholesale and retail trade; repair of motor vehicles and motor cycles 20%
1500 Other 20%
1600 Those with any income from pensions 60%
% Of Record
Income or Deductions status Variable Name Category With Code
TI Total Income 80%
TOTTAX Total Tax 80%
TEI Earned Income 60%
See Annex A Deductions and Reliefs 80%
See Annex A Self Employed 40% See Annex A Employed 80% SRP State Pension 60% PENSION Other Pensions 40% INCPROP Property 40% INCBBS Bank and Building Society 60% DIVIDENDS Dividends 60% OTHERINV Other Investment 60%
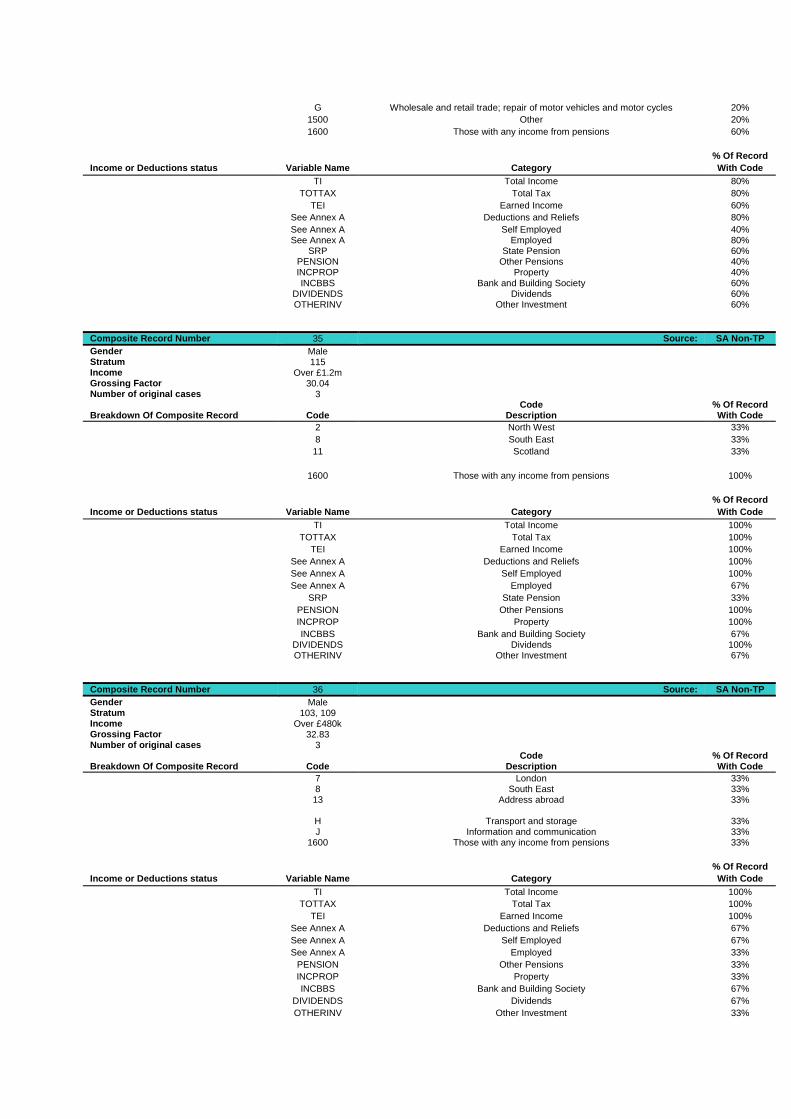
Composite Record Number 35 Source: SA Non-TP
Gender Male Stratum 115 Income Over £1.2m Grossing Factor 30.04 Number of original cases 3
Code % Of Record Breakdown Of Composite Record Code Description With Code
2 North West 33%
8 South East 33%
11 Scotland 33%
1600 Those with any income from pensions 100%
% Of Record
Income or Deductions status Variable Name Category With Code
TI Total Income 100%
TOTTAX Total Tax 100%
TEI Earned Income 100%
See Annex A Deductions and Reliefs 100%
See Annex A Self Employed 100%
See Annex A Employed 67%
SRP State Pension 33%
PENSION Other Pensions 100%
INCPROP Property 100%
INCBBS Bank and Building Society 67% DIVIDENDS Dividends 100% OTHERINV Other Investment 67%
Composite Record Number 36 Source: SA Non-TP
Gender Male Stratum 103, 109 Income Over £480k Grossing Factor 32.83 Number of original cases 3
Code % Of Record Breakdown Of Composite Record Code Description With Code
7 London 33% 8 South East 33% 13 Address abroad 33% H Transport and storage 33% J Information and communication 33% 1600 Those with any income from pensions 33%
% Of Record
Income or Deductions status Variable Name Category With Code
TI Total Income 100%
TOTTAX Total Tax 100%
TEI Earned Income 100%
See Annex A Deductions and Reliefs 67%
See Annex A Self Employed 67%
See Annex A Employed 33%
PENSION Other Pensions 33%
INCPROP Property 33%
INCBBS Bank and Building Society 67%
DIVIDENDS Dividends 67%
OTHERINV Other Investment 33%
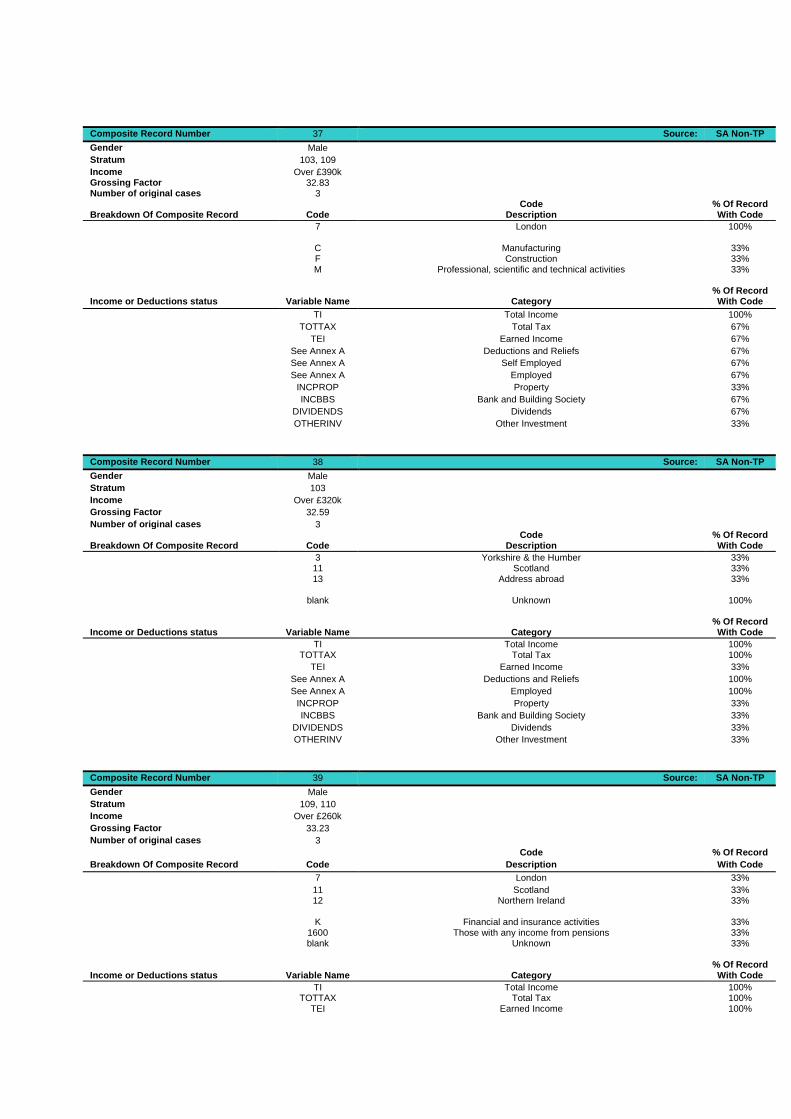
Composite Record Number 37 Source: SA Non-TP
Gender Male
Stratum 103, 109
Income Over £390k Grossing Factor 32.83 Number of original cases 3
Code % Of Record Breakdown Of Composite Record Code Description With Code
7 London 100% C Manufacturing 33% F Construction 33% M Professional, scientific and technical activities 33% % Of Record
Income or Deductions status Variable Name Category With Code
TI Total Income 100%
TOTTAX Total Tax 67%
TEI Earned Income 67%
See Annex A Deductions and Reliefs 67%
See Annex A Self Employed 67%
See Annex A Employed 67%
INCPROP Property 33%
INCBBS Bank and Building Society 67%
DIVIDENDS Dividends 67%
OTHERINV Other Investment 33%
Composite Record Number 38 Source: SA Non-TP
Gender Male
Stratum 103
Income Over £320k
Grossing Factor 32.59
Number of original cases 3 Code % Of Record
Breakdown Of Composite Record Code Description With Code
3 Yorkshire & the Humber 33% 11 Scotland 33% 13 Address abroad 33% blank Unknown 100% % Of Record
Income or Deductions status Variable Name Category With Code
TI Total Income 100% TOTTAX Total Tax 100%
TEI Earned Income 33%
See Annex A Deductions and Reliefs 100%
See Annex A Employed 100%
INCPROP Property 33%
INCBBS Bank and Building Society 33%
DIVIDENDS Dividends 33%
OTHERINV Other Investment 33%
Composite Record Number 39 Source: SA Non-TP
Gender Male
Stratum 109, 110
Income Over £260k
Grossing Factor 33.23
Number of original cases 3
Code % Of Record
Breakdown Of Composite Record Code Description With Code
7 London 33%
11 Scotland 33% 12 Northern Ireland 33% K Financial and insurance activities 33% 1600 Those with any income from pensions 33% blank Unknown 33% % Of Record
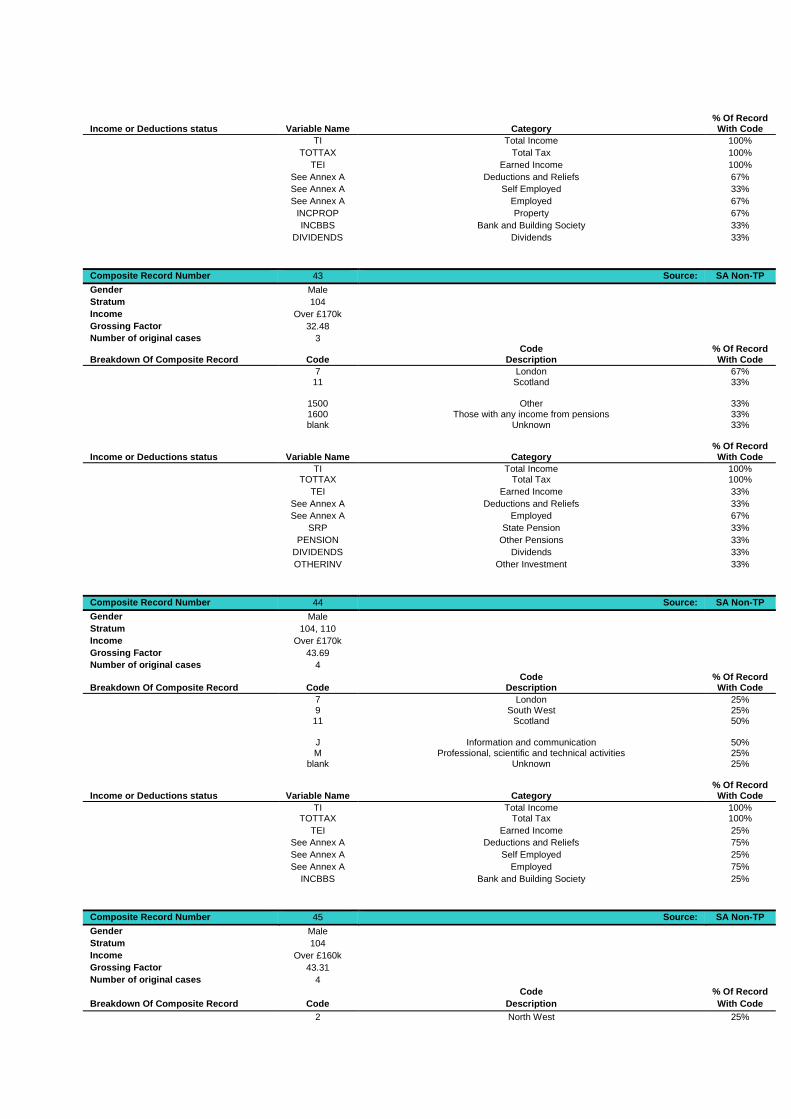
Income or Deductions status Variable Name Category With Code
TI Total Income 100% TOTTAX Total Tax 100% TEI Earned Income 100%

See Annex A Deductions and Reliefs 67%
See Annex A Self Employed 33%
See Annex A Employed 100%
SRP State Pension 33%
PENSION Other Pensions 33%
INCPROP Property 33%
INCBBS Bank and Building Society 100%
DIVIDENDS Dividends 33%
OTHERINV Other Investment 33%
Composite Record Number 40 Source: SA Non-TP
Gender Male
Stratum 110
Income Over £230k
Grossing Factor 33.05 Number of original cases 3
Code % Of Record Breakdown Of Composite Record Code Description With Code
7 London 67% 8 South East 33% R Arts, entertainment and recreation 33% 1500 Other 33% blank Unknown 33% % Of Record
Income or Deductions status Variable Name Category With Code
TI Total Income 100% TOTTAX Total Tax 67%
TEI Earned Income 100%
See Annex A Deductions and Reliefs 33%
See Annex A Self Employed 33%
See Annex A Employed 33%
INCBBS Bank and Building Society 67%
OTHERINV Other Investment 100%
Composite Record Number 41 Source: SA Non-TP
Gender Male
Stratum 104, 110
Income Over £200k
Grossing Factor 32.87
Number of original cases 3
Code % Of Record Breakdown Of Composite Record Code Description With Code
7 London 67% 13 Address abroad 33% D Electricity, gas, steam and air conditioning supply 33% J Information and communication 33% K Financial and insurance activities 33% % Of Record
Income or Deductions status Variable Name Category With Code
TI Total Income 100%
TOTTAX Total Tax 100%
TEI Earned Income 33%
See Annex A Deductions and Reliefs 100%
See Annex A Self Employed 100%
See Annex A Employed 33%
INCBBS Bank and Building Society 33%
OTHERINV Other Investment 33%
Composite Record Number 42 Source: SA Non-TP
Gender Male
Stratum 101, 104, 110
Income Over £190k Grossing Factor 38.24 Number of original cases 3
Code % Of Record Breakdown Of Composite Record Code Description With Code
5 West Midlands 67% 13 Address abroad 33% M Professional, scientific and technical activities 67% blank Unknown 33%
% Of Record
Income or Deductions status Variable Name Category With Code
TI Total Income 100%
TOTTAX Total Tax 100%
TEI Earned Income 100%
See Annex A Deductions and Reliefs 67%
See Annex A Self Employed 33%
See Annex A Employed 67%
INCPROP Property 67%
INCBBS Bank and Building Society 33%
DIVIDENDS Dividends 33%
Composite Record Number 43 Source: SA Non-TP
Gender Male
Stratum 104
Income Over £170k
Grossing Factor 32.48
Number of original cases 3 Code % Of Record
Breakdown Of Composite Record Code Description With Code
7 London 67% 11 Scotland 33% 1500 Other 33% 1600 Those with any income from pensions 33% blank Unknown 33% % Of Record
Income or Deductions status Variable Name Category With Code
TI Total Income 100% TOTTAX Total Tax 100%
TEI Earned Income 33%
See Annex A Deductions and Reliefs 33%
See Annex A Employed 67%
SRP State Pension 33%
PENSION Other Pensions 33%
DIVIDENDS Dividends 33%
OTHERINV Other Investment 33%
Composite Record Number 44 Source: SA Non-TP
Gender Male
Stratum 104, 110
Income Over £170k
Grossing Factor 43.69
Number of original cases 4
Code % Of Record Breakdown Of Composite Record Code Description With Code
7 London 25% 9 South West 25% 11 Scotland 50% J Information and communication 50% M Professional, scientific and technical activities 25% blank Unknown 25% % Of Record
Income or Deductions status Variable Name Category With Code
TI Total Income 100% TOTTAX Total Tax 100%
TEI Earned Income 25%
See Annex A Deductions and Reliefs 75%
See Annex A Self Employed 25%
See Annex A Employed 75%
INCBBS Bank and Building Society 25%
Composite Record Number 45 Source: SA Non-TP
Gender Male
Stratum 104
Income Over £160k
Grossing Factor 43.31
Number of original cases 4
Code % Of Record
Breakdown Of Composite Record Code Description With Code
2 North West 25%
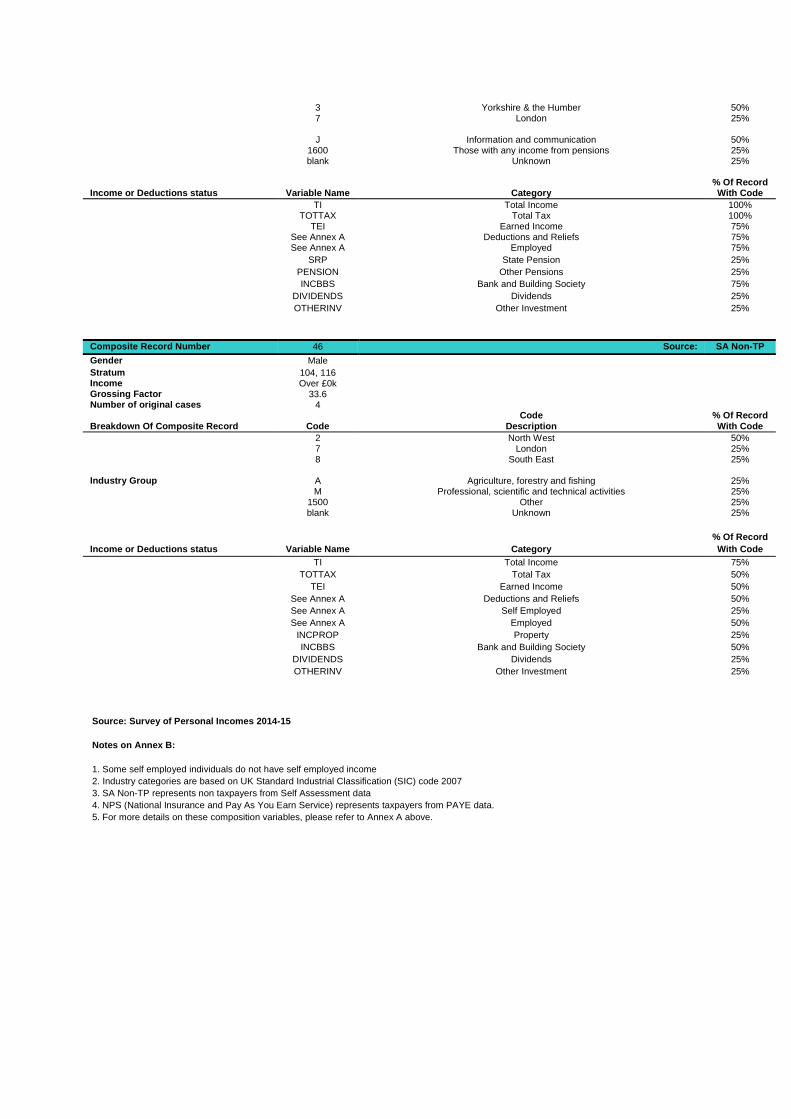
3 Yorkshire & the Humber 50% 7 London 25% J Information and communication 50% 1600 Those with any income from pensions 25% blank Unknown 25% % Of Record
Income or Deductions status Variable Name Category With Code
TI Total Income 100% TOTTAX Total Tax 100% TEI Earned Income 75% See Annex A Deductions and Reliefs 75% See Annex A Employed 75%
SRP State Pension 25%
PENSION Other Pensions 25%
INCBBS Bank and Building Society 75%
DIVIDENDS Dividends 25%
OTHERINV Other Investment 25%
Composite Record Number 46 Source: SA Non-TP
Gender Male
Stratum 104, 116 Income Over £0k Grossing Factor 33.6 Number of original cases 4
Code % Of Record Breakdown Of Composite Record Code Description With Code
2 North West 50% 7 London 25% 8 South East 25%
Industry Group A Agriculture, forestry and fishing 25% M Professional, scientific and technical activities 25% 1500 Other 25% blank Unknown 25%
% Of Record
Income or Deductions status Variable Name Category With Code
TI Total Income 75%
TOTTAX Total Tax 50%
TEI Earned Income 50%
See Annex A Deductions and Reliefs 50%
See Annex A Self Employed 25%
See Annex A Employed 50%
INCPROP Property 25%
INCBBS Bank and Building Society 50%
DIVIDENDS Dividends 25%
OTHERINV Other Investment 25%
Source: Survey of Personal Incomes 2014-15
Notes on Annex B:
1. Some self employed individuals do not have self employed income
2. Industry categories are based on UK Standard Industrial Classification (SIC) code 2007
3. SA Non-TP represents non taxpayers from Self Assessment data
4. NPS (National Insurance and Pay As You Earn Service) represents taxpayers from PAYE data.
5. For more details on these composition variables, please refer to Annex A above.
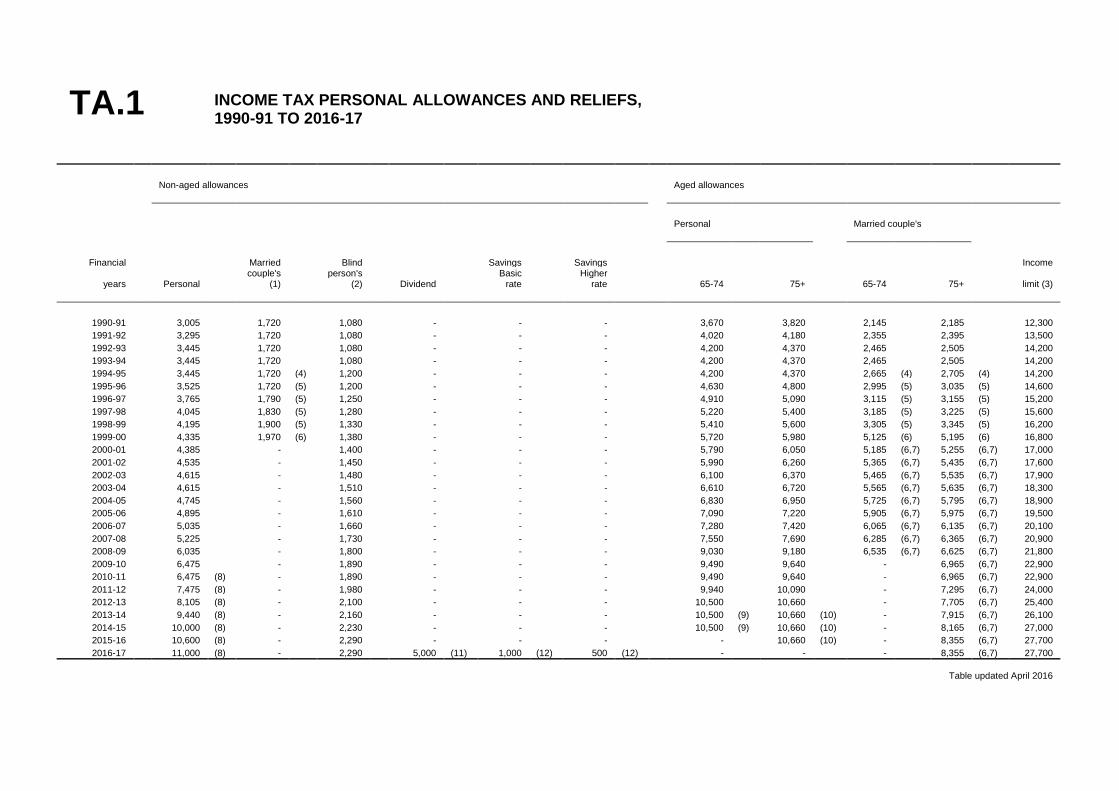
INCOME TAX PERSONAL ALLOWANCES AND RELIEFS,
1990-91 TO 2016-17
Non-aged allowances Aged allowances
Personal Married couple's
Financial Married Blind Savings Savings Income
years Personal couple's
(1) person's
(2) Dividend Basic
rate Higher
rate 65-74 75+ 65-74 75+ limit (3)
1990-91 3,005 1,720 1,080 - - - 3,670 3,820 2,145 2,185 12,300
1991-92 3,295 1,720 1,080 - - - 4,020 4,180 2,355 2,395 13,500
1992-93 3,445 1,720 1,080 - - - 4,200 4,370 2,465 2,505 14,200
1993-94 3,445 1,720 1,080 - - - 4,200 4,370 2,465 2,505 14,200
1994-95 3,445 1,720 (4) 1,200 - - - 4,200 4,370 2,665 (4) 2,705 (4) 14,200
1995-96 3,525 1,720 (5) 1,200 - - - 4,630 4,800 2,995 (5) 3,035 (5) 14,600
1996-97 3,765 1,790 (5) 1,250 - - - 4,910 5,090 3,115 (5) 3,155 (5) 15,200
1997-98 4,045 1,830 (5) 1,280 - - - 5,220 5,400 3,185 (5) 3,225 (5) 15,600
1998-99 4,195 1,900 (5) 1,330 - - - 5,410 5,600 3,305 (5) 3,345 (5) 16,200
1999-00 4,335 1,970 (6) 1,380 - - - 5,720 5,980 5,125 (6) 5,195 (6) 16,800
2000-01 4,385 - 1,400 - - - 5,790 6,050 5,185 (6,7) 5,255 (6,7) 17,000
2001-02 4,535 - 1,450 - - - 5,990 6,260 5,365 (6,7) 5,435 (6,7) 17,600
2002-03 4,615 - 1,480 - - - 6,100 6,370 5,465 (6,7) 5,535 (6,7) 17,900
2003-04 4,615 - 1,510 - - - 6,610 6,720 5,565 (6,7) 5,635 (6,7) 18,300
2004-05 4,745 - 1,560 - - - 6,830 6,950 5,725 (6,7) 5,795 (6,7) 18,900
2005-06 4,895 - 1,610 - - - 7,090 7,220 5,905 (6,7) 5,975 (6,7) 19,500
2006-07 5,035 - 1,660 - - - 7,280 7,420 6,065 (6,7) 6,135 (6,7) 20,100
2007-08 5,225 - 1,730 - - - 7,550 7,690 6,285 (6,7) 6,365 (6,7) 20,900
2008-09 6,035 - 1,800 - - - 9,030 9,180 6,535 (6,7) 6,625 (6,7) 21,800
2009-10 6,475 - 1,890 - - - 9,490 9,640 - 6,965 (6,7) 22,900
2010-11 6,475 (8) - 1,890 - - - 9,490 9,640 - 6,965 (6,7) 22,900
2011-12 7,475 (8) - 1,980 - - - 9,940 10,090 - 7,295 (6,7) 24,000
2012-13 8,105 (8) - 2,100 - - - 10,500 10,660 - 7,705 (6,7) 25,400
2013-14 9,440 (8) - 2,160 - - - 10,500 (9) 10,660 (10) - 7,915 (6,7) 26,100
2014-15 10,000 (8) - 2,230 - - - 10,500 (9) 10,660 (10) - 8,165 (6,7) 27,000
2015-16 10,600 (8) - 2,290 - - - - 10,660 (10) - 8,355 (6,7) 27,700
2016-17 11,000 (8) - 2,290 5,000 (11) 1,000 (12) 500 (12) - - - 8,355 (6,7) 27,700
Table updated April 2016
TA.1
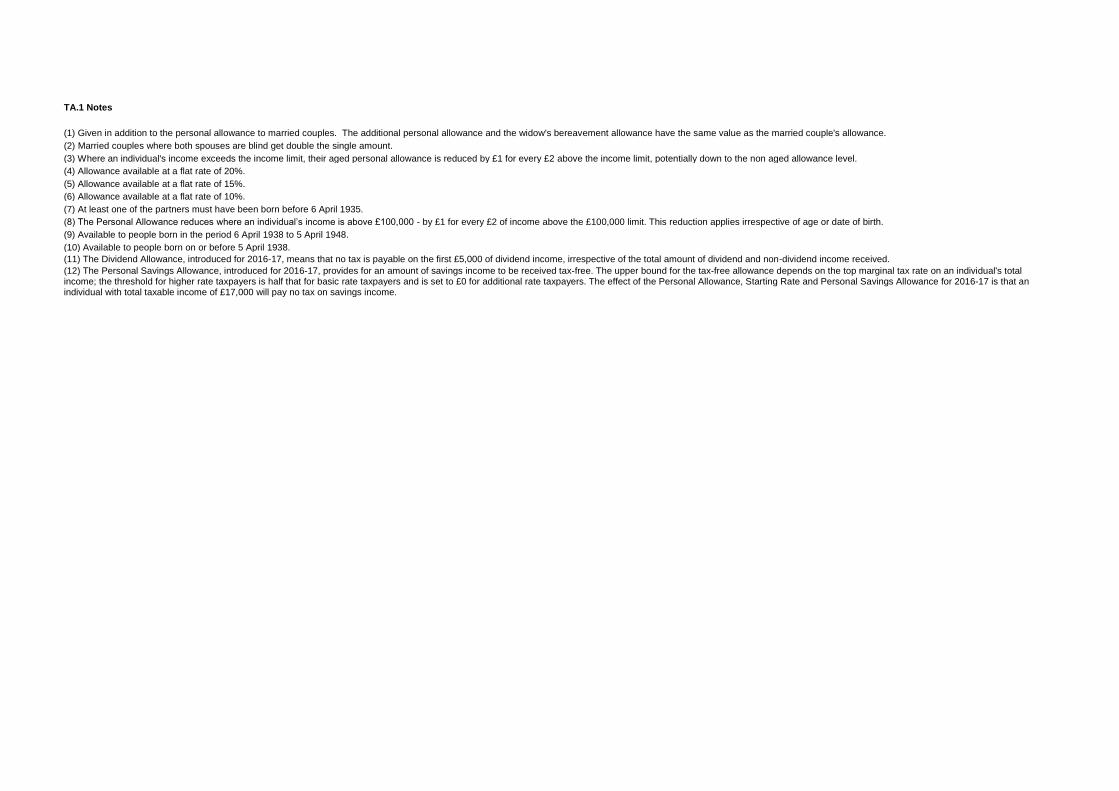
TA.1 Notes
(1) Given in addition to the personal allowance to married couples. The additional personal allowance and the widow's bereavement allowance have the same value as the married couple's allowance.
(2) Married couples where both spouses are blind get double the single amount.
(3) Where an individual's income exceeds the income limit, their aged personal allowance is reduced by £1 for every £2 above the income limit, potentially down to the non aged allowance level.
(4) Allowance available at a flat rate of 20%.
(5) Allowance available at a flat rate of 15%.
(6) Allowance available at a flat rate of 10%.
(7) At least one of the partners must have been born before 6 April 1935.
(8) The Personal Allowance reduces where an individual’s income is above £100,000 - by £1 for every £2 of income above the £100,000 limit. This reduction applies irrespective of age or date of birth.
(9) Available to people born in the period 6 April 1938 to 5 April 1948.
(10) Available to people born on or before 5 April 1938.
(11) The Dividend Allowance, introduced for 2016-17, means that no tax is payable on the first £5,000 of dividend income, irrespective of the total amount of dividend and non-dividend income received.
(12) The Personal Savings Allowance, introduced for 2016-17, provides for an amount of savings income to be received tax-free. The upper bound for the tax-free allowance depends on the top marginal tax rate on an individual's total income; the threshold for higher rate taxpayers is half that for basic rate taxpayers and is set to £0 for additional rate taxpayers. The effect of the Personal Allowance, Starting Rate and Personal Savings Allowance for 2016-17 is that an individual with total taxable income of £17,000 will pay no tax on savings income.
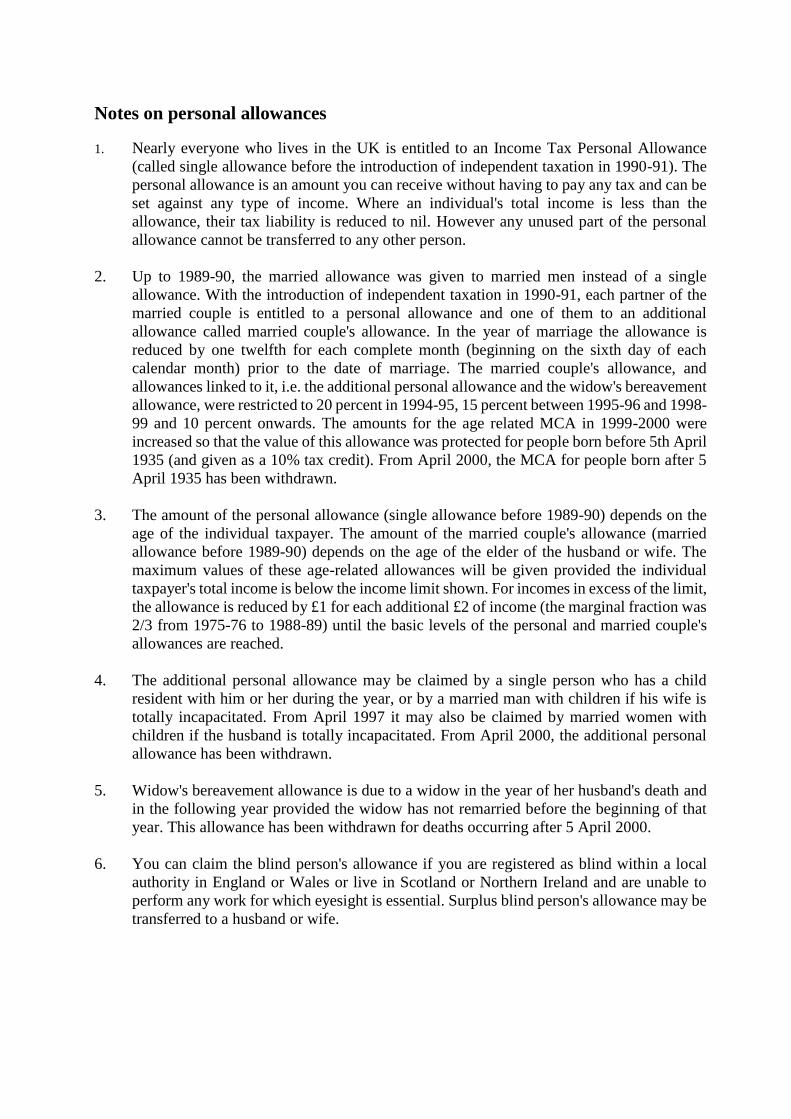
Notes on personal allowances
1. Nearly everyone who lives in the UK is entitled to an Income Tax Personal Allowance
(called single allowance before the introduction of independent taxation in 1990-91). The
personal allowance is an amount you can receive without having to pay any tax and can be
set against any type of income. Where an individual's total income is less than the
allowance, their tax liability is reduced to nil. However any unused part of the personal
allowance cannot be transferred to any other person.
2. Up to 1989-90, the married allowance was given to married men instead of a single
allowance. With the introduction of independent taxation in 1990-91, each partner of the
married couple is entitled to a personal allowance and one of them to an additional
allowance called married couple's allowance. In the year of marriage the allowance is
reduced by one twelfth for each complete month (beginning on the sixth day of each
calendar month) prior to the date of marriage. The married couple's allowance, and
allowances linked to it, i.e. the additional personal allowance and the widow's bereavement
allowance, were restricted to 20 percent in 1994-95, 15 percent between 1995-96 and 1998-
99 and 10 percent onwards. The amounts for the age related MCA in 1999-2000 were
increased so that the value of this allowance was protected for people born before 5th April
1935 (and given as a 10% tax credit). From April 2000, the MCA for people born after 5
April 1935 has been withdrawn.
3. The amount of the personal allowance (single allowance before 1989-90) depends on the
age of the individual taxpayer. The amount of the married couple's allowance (married
allowance before 1989-90) depends on the age of the elder of the husband or wife. The
maximum values of these age-related allowances will be given provided the individual
taxpayer's total income is below the income limit shown. For incomes in excess of the limit,
the allowance is reduced by £1 for each additional £2 of income (the marginal fraction was
2/3 from 1975-76 to 1988-89) until the basic levels of the personal and married couple's
allowances are reached.
4. The additional personal allowance may be claimed by a single person who has a child
resident with him or her during the year, or by a married man with children if his wife is
totally incapacitated. From April 1997 it may also be claimed by married women with
children if the husband is totally incapacitated. From April 2000, the additional personal
allowance has been withdrawn.
5. Widow's bereavement allowance is due to a widow in the year of her husband's death and
in the following year provided the widow has not remarried before the beginning of that
year. This allowance has been withdrawn for deaths occurring after 5 April 2000.
6. You can claim the blind person's allowance if you are registered as blind within a local
authority in England or Wales or live in Scotland or Northern Ireland and are unable to
perform any work for which eyesight is essential. Surplus blind person's allowance may be
transferred to a husband or wife.
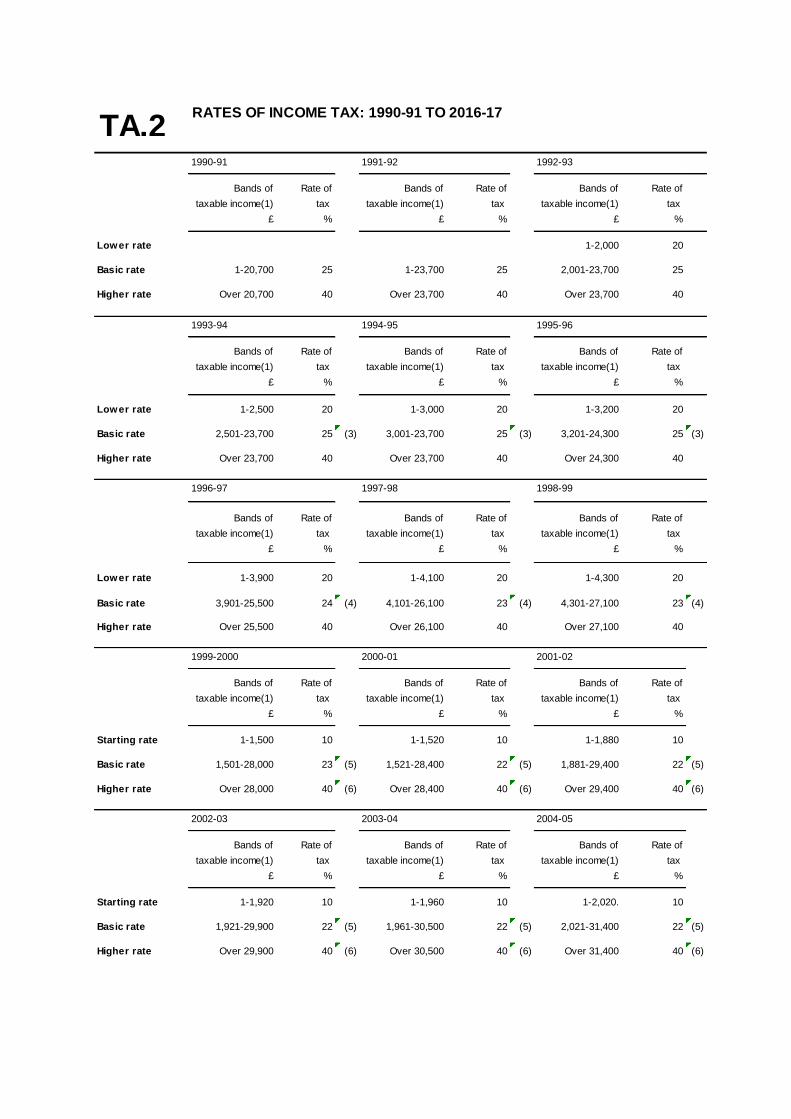
RATES OF INCOME TAX: 1990-91 TO 2016-17
1990-91 1991-92 1992-93
Bands of Rate of Bands of Rate of Bands of Rate of
taxable income(1) tax taxable income(1) tax taxable income(1) tax
£ % £ % £ %
Lower rate 1-2,000 20
Basic rate 1-20,700 25 1-23,700 25 2,001-23,700 25
Higher rate Over 20,700 40 Over 23,700 40 Over 23,700 40
1993-94 1994-95 1995-96
Bands of Rate of Bands of Rate of Bands of Rate of
taxable income(1) tax taxable income(1) tax taxable income(1) tax
£ % £ % £ %
Lower rate 1-2,500 20 1-3,000 20 1-3,200 20
Basic rate 2,501-23,700 25 (3) 3,001-23,700 25 (3) 3,201-24,300 25 (3)
Higher rate Over 23,700 40 Over 23,700 40 Over 24,300 40
1996-97 1997-98 1998-99
Bands of Rate of Bands of Rate of Bands of Rate of
taxable income(1) tax taxable income(1) tax taxable income(1) tax
£ % £ % £ %
Lower rate 1-3,900 20 1-4,100 20 1-4,300 20
Basic rate 3,901-25,500 24 (4) 4,101-26,100 23 (4) 4,301-27,100 23 (4)
Higher rate Over 25,500 40 Over 26,100 40 Over 27,100 40
1999-2000 2000-01 2001-02
Bands of Rate of Bands of Rate of Bands of Rate of
taxable income(1) tax taxable income(1) tax taxable income(1) tax
£ % £ % £ %
Starting rate 1-1,500 10 1-1,520 10 1-1,880 10
Basic rate 1,501-28,000 23 (5) 1,521-28,400 22 (5) 1,881-29,400 22 (5)
Higher rate Over 28,000 40 (6) Over 28,400 40 (6) Over 29,400 40 (6)
2002-03 2003-04 2004-05
Bands of Rate of Bands of Rate of Bands of Rate of
taxable income(1) tax taxable income(1) tax taxable income(1) tax
£ % £ % £ %
Starting rate 1-1,920 10 1-1,960 10 1-2,020. 10
Basic rate 1,921-29,900 22 (5) 1,961-30,500 22 (5) 2,021-31,400 22 (5)
Higher rate Over 29,900 40 (6) Over 30,500 40 (6) Over 31,400 40 (6)
TA.2

RATES OF INCOME TAX: 1990-91 TO 2016-17 (Continued)
2005-06 2006-07 2007-08
Bands of Rate of Bands of Rate of Bands of Rate of
taxable income(1) tax taxable income(1) tax taxable income(1) tax
£ % £ % £ %
Starting rate 1-2.090 10 1-2,150 10 1-2,230 10
Basic rate 2,091-32,400 22 (5) 2,151-33,300 22 (5) 2,231-34,600 22 (5)
Higher rate Over 32,400 40 (6) Over 33,300 40 (6) Over 34,600 40 (6)
2008-09 2009-10 2010-11
Bands of Rate of Bands of Rate of Bands of Rate of
taxable income(1) tax taxable income(1) tax taxable income(1) tax
£ % £ % £ %
Basic rate (7) 1-34,800 20 (8) 1-37,400 20 (8) 1-37,400 20 (8)
Higher rate Over 34,800 40 (6) Over 37,400 40 (6) Over 37,400 40 (6)
Additional Rate Not Applicable Not Applicable Over 150,000 50 (9)
2011-12 2012-13 2013-14
Bands of Rate of Bands of Rate of Bands of Rate of
taxable income(1) tax taxable income(1) tax taxable income(1) tax
£ % £ % £ %
Basic rate (7) 1-35,000 20 (8) 1-34,370 20 (8) 1-32,010 20 (8)
Higher rate Over 35,000 40 (6) Over 34,370 40 (6) Over 32,010 40 (6)
Additional Rate Over 150,000 50 (9) Over 150,000 50 (9) Over 150,000 45 (10)
2014-15 2015-16 2016-17
Bands of Rate of Bands of Rate of Bands of Rate of
taxable income(1) tax taxable income(1) tax taxable income(1) tax
£ % £ % £ %
Basic rate (7) 1-31,865 20 (8) 1-31,785 20 (8) 1-32,000 20 (11)
Higher rate Over 31,865 40 (6) Over 31,785 40 (6) Over 32,000 40 (12)
Additional Rate Over 150,000 45 (10) Over 150,000 45 (10) Over 150,000 45 (13)
Table updated April 2016
(3) The basic rate of tax on gross dividend income is 20%.
(4) The basic rate of tax on gross dividends and savings income is 20%.
(5) The basic rate of tax on gross dividends is 10% and savings income is 20%.
(6) The higher rate of tax on gross dividends is 32.5%.
(8) The basic rate of tax on gross dividends is 10%.
(9) The additional rate of tax on gross dividends is 42.5%.
(10) The additional rate of tax on gross dividends is 37.5%.
(11) The basic rate of tax on net dividends is 7.5%.
(12) The higher rate of tax on net dividends is 32.5%.
(13) The additional rate of tax on net dividends is 38.1%.
(1) Taxable income is defined as gross income for income tax purposes less any allow ances and reliefs available at the taxpayer's
marginal rate.
(2) Applies to the income of discretionary and accumulation trusts. Prior to 1993-94 trusts paid tax at the basic rate, w ith an additional rate
of 10%.
(7) From 2008-09 the starting rate is abolished for all non-savings income (e.g. employment, self-employed trading profits, pensions and
property income), w hich is the f irst slice of income to be charged to income tax. The starting rate and the starting rate limit for savings is
show n in the table below . Where taxable non-savings income does not fully occupy the starting rate limit the remainder of the starting rate
limit is available for savings income.
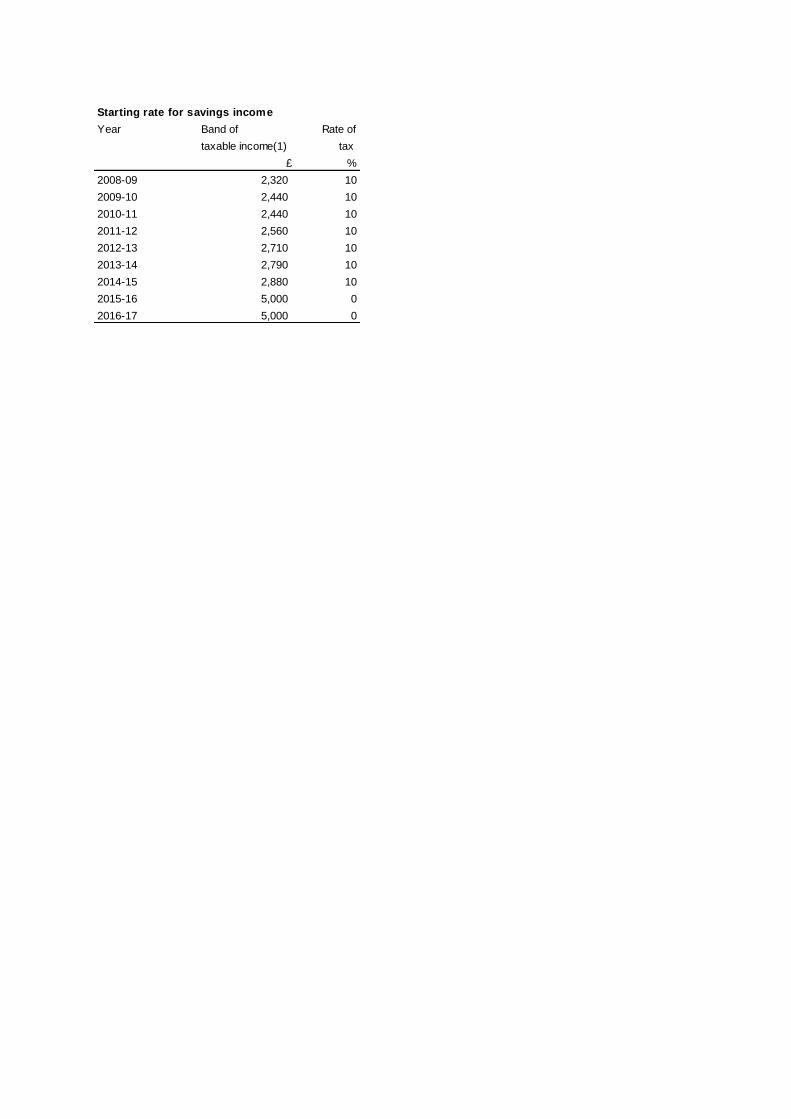
Starting rate for savings income
Year Band of Rate of
taxable income(1) tax
£ %
2008-09 2,320 10
2009-10 2,440 10
2010-11 2,440 10
2011-12 2,560 10
2012-13 2,710 10
2013-14 2,790 10
2014-15 2,880 10
2015-16 5,000 0
2016-17 5,000 0