SPHERICAL FLY ASH PARTICLES
15
Oil Shale, 2005, Vol. 22, No. 4 Special ISSN 0208-189X pp. 547-561 © 2005 Estonian Academy Publishers SPHERICAL FLY ASH PARTICLES FROM OIL SHALE FIRED POWER PLANTS IN ATMOSPHERIC PRECIPITATIONS. POSSIBILITIES OF QUANTITATIVE TRACING M. KAASIK *1(a) , T. ALLIKSAAR *2(b) J. IVASK *3(b) , J. LOOSAAR *4(c) (a) Institute of Environmental Physics, University of Tartu 18 Ülikooli St., 50090 Tartu, Estonia (b) Institute of Geology, Tallinn University of Technology 7 Estonia Blvd., 10143 Tallinn, Estonia (c) Department of Thermal Engineering, Tallinn University of Technology 116 Kopli St., 11712 Tallinn, Estonia Concentration of spherical particles in oil shale fly ash and their deposition onto areas surrounding Narva power plants and far (background) sites in South-eastern Estonia was studied. It was found that due to their relatively low background values, spherical particles are more sensitive indicators of oil shale combustion emissions than chemical components, especially calcium, of oil- shale ash. As the concentration of spherical particles in fly ash was determined to be highly variable depending on combustion technologies and regimes, their use for quantitative tracing is complicated in practice. The same variability, however, leaves us a chance to refine the backward-tracing methods for fly ash, distinguishing different types of combustion devices by their source signatures. It was found that wintertime (snow-based) field campaigns are preferred to the warm season (based on rainwater sampling) ones owing to their relatively lower background concentrations, but both campaigns are needed to quantify yearly influxes of fly ash to the ecosystems. Introduction Anthropogenic emissions into the atmosphere have major impacts on the environmental change, fossil-fuel combustion being one of the most important anthropogenic sources of several pollutants affecting ecosystems. Oil-shale-fired power plants in North-East Estonia are the biggest pollution sources in Estonia, emit annually thousands of tonnes of gaseous additives and particulates into the atmosphere and cause enrichment of the landscape with alkaline pollutants in their near vicinity. This process, due to the *1 [email protected]; *2 [email protected]; *3 [email protected]; *4 [email protected]
Transcript of SPHERICAL FLY ASH PARTICLES
Oil Shale, 2005, Vol. 22, No. 4 Special ISSN 0208-189X pp. 547-561 © 2005 Estonian Academy Publishers
SPHERICAL FLY ASH PARTICLES FROM OIL SHALE FIRED POWER PLANTS IN ATMOSPHERIC PRECIPITATIONS. POSSIBILITIES OF QUANTITATIVE TRACING
M. KAASIK*1(a), T. ALLIKSAAR*2(b) J. IVASK*3(b), J. LOOSAAR*4(c) (a) Institute of Environmental Physics, University of Tartu
18 Ülikooli St., 50090 Tartu, Estonia (b) Institute of Geology, Tallinn University of Technology
7 Estonia Blvd., 10143 Tallinn, Estonia (c) Department of Thermal Engineering, Tallinn University of Technology
116 Kopli St., 11712 Tallinn, Estonia
Concentration of spherical particles in oil shale fly ash and their deposition onto areas surrounding Narva power plants and far (background) sites in South-eastern Estonia was studied. It was found that due to their relatively low background values, spherical particles are more sensitive indicators of oil shale combustion emissions than chemical components, especially calcium, of oil-shale ash. As the concentration of spherical particles in fly ash was determined to be highly variable depending on combustion technologies and regimes, their use for quantitative tracing is complicated in practice. The same variability, however, leaves us a chance to refine the backward-tracing methods for fly ash, distinguishing different types of combustion devices by their source signatures. It was found that wintertime (snow-based) field campaigns are preferred to the warm season (based on rainwater sampling) ones owing to their relatively lower background concentrations, but both campaigns are needed to quantify yearly influxes of fly ash to the ecosystems.
Introduction
Anthropogenic emissions into the atmosphere have major impacts on the environmental change, fossil-fuel combustion being one of the most important anthropogenic sources of several pollutants affecting ecosystems. Oil-shale-fired power plants in North-East Estonia are the biggest pollution sources in Estonia, emit annually thousands of tonnes of gaseous additives and particulates into the atmosphere and cause enrichment of the landscape with alkaline pollutants in their near vicinity. This process, due to the *1 [email protected]; *2 [email protected]; *3 [email protected]; *4 [email protected]
548 M. Kaasik et al.
presence of alkaline oxides in the mineral part of kukersite oil shale, has been quite unique among enterprises of fossil-fuel combustion, and their emissions neutralize acidic fly ash in flue gases not allowing acid rains in the area.
However, because of this nature of the emissions from oil shale power plants other factors influence ecosystems. Due to the excess of nutrients and increased alkalinity, water pH of bogs has raised remarkably decelerating or even interrupting the Sphagnum growth at many sites. Therefore information is required about the extent and severity of the impact of emissions originating from these major industrial sources of North-Eastern Estonia.
Most of the chemical compounds emitted during combustion processes, especially gaseous but also several particulate pollutants, have a tendency to transform in the air or mobilize while deposited on the ground and this is why they do not leave a reliable record. Therefore it is important to find chemically stable tracers for investigating atmospheric emissions. Determination of spreading, distribution and deposition of airborne pollutants deserve special attention when the deposited contaminant can be unambiguously identified as being derived from a specific source and unequivocally from atmospheric deposition. Spherical fly ash particles, which are formed and emitted to the atmosphere in the high-temperature combustion process of fossil fuels, are such kind of tracers.
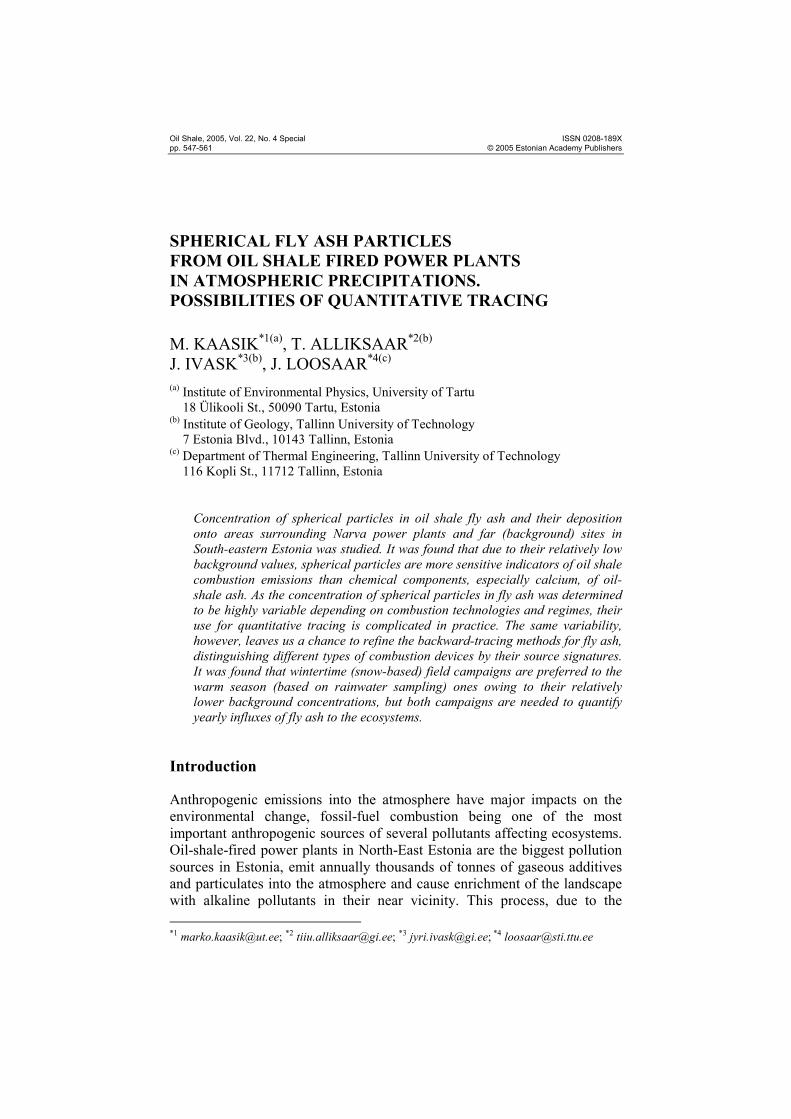
The proportions and composition of components in fly ash may vary in a quite large scale depending on the type of fuel used and the characteristics of the thermal process. In the case of high temperature in the furnace, two types of spherical particles in fly ash of power plants can be found. In fly ash of solid fuels, e.g. coal, oil shale, peat etc., are dominating particles, which consist mainly of aluminosilicate glassy material and have formed by fusion of inorganic minerals within the fuel [1]. Large particles of that type are often empty and contain smaller ones (called plerospheres, Fig. 1).
Fig. 1. Glassy plerospheres in the fly ash (under scanning electron microscope)
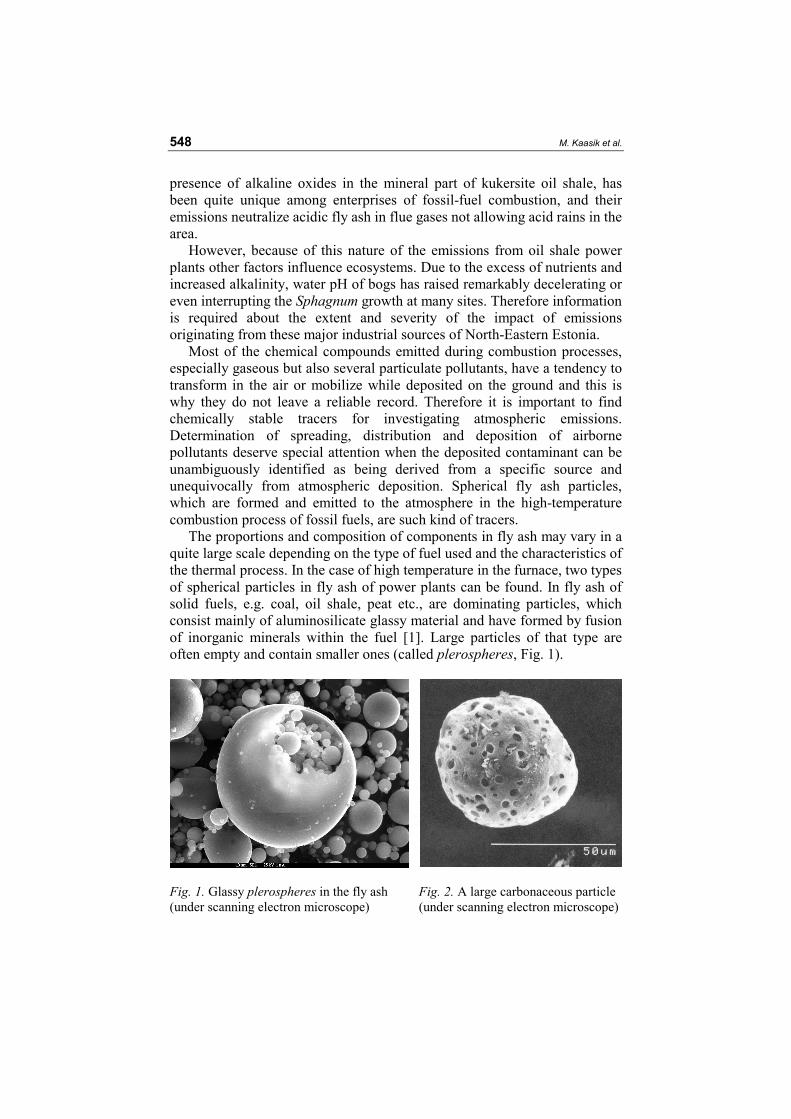
Fig. 2. A large carbonaceous particle (under scanning electron microscope)
Spherical Fly Ash Particles from Oil-Shale-Fired Power Plants in Atmospheric Precipitations… 549
The second type of particles is typical for liquid fuels like heavy and light
fuel oils, but is also present in the emissions of solid fuels. They are formed during incomplete combustion of the organic part in the fuel and are therefore composed mainly of elemental carbon [2] (Fig. 2).
Studies have shown [3] that due to very high mineral matter content of the fuel and pulverized combustion technology, glassy inorganic particles (size up to 25 µm) dominate in oil shale fly ash. They vary from black and orange to colorless depending on iron content of the particles.
Particles of both types are released into the atmosphere along with the plume of flue gases, dispersed by air currents and atmospheric turbulence depending on the meteorological conditions and deposited in various media by both wet and dry means even thousands of kilometres from the source [4]. Due to their composition spherical particles are resistant to chemical degradation and preserve well in both terrestrial and aquatic environments for centuries. This makes them a good tool for historical monitoring and palaeoecological study of industrially derived atmospheric contamination.
This paper aims at presenting the first attempt of using spherical fly ash particles for determining quantitatively the atmospheric deposition of particulates from Narva Power Plants. The results obtained are compared with those obtained by other possible methods allowing quantifying the fly ash accumulation. Furthermore, the components of oil shale fly ashes in different combustion technologies and regimes are analyzed.
Spherical Particles in Oil-Shale Fly Ashes
Methods
Fly ash samples from the flue gas tract of the Eesti Power Plant (EPP) were taken applying quartz filters. Three samples were taken in November 2002 from energy block No. 2 (pulverized oil shale combustion, renewed electrostatic precipitators) and three samples in January 2004 from energy block No. 8 (circulating fluidized bed combustion). Both series included one sample from the section after the precipitators, i.e. ashes to be emitted directly to the atmosphere. The hygroscopic filters were weighted before and after the sampling at temperature 200 °C to measure the mass of the sample.
The chemical composition of samples and their concentration of spherical fly ash particles (diameter larger than 5 µm) were analyzed. Ion-coupled plasma atomic emission spectrometry was applied for analyses of Ca, Mg, K and Na, and turbidity method for -2
4SO measurements. The treatment with concentrated nitric acid in the autoclave (120 °C) was applied for preprocessing the ash samples. Analyses were performed by Tartu Environmental Research Ltd.
For assessing the concentration of spherical particles, the pre-weighed ash samples were first treated with 3M HCl to dissolve carbonates and then,

550 M. Kaasik et al.
after washing them several times with distilled water, the known amount of Lycopodium marker-spores were added. Particles together with spores were counted on coverslips at ×125 magnification using the light microscope. A number of particles in ashes were calculated from the known concentration of exotic spores in the samples.
The results were compared with the analyses carried out on ashes from electrostatic precipitators of Soviet origin from the Eesti Power Plant and the Ahtme Power Plant (both samples taken in 1992, only spherical particles investigated). Another comparison with earlier combustion technology is based on the measurements made by Pets et al. in the Balti Power Plant (BPP) (only metals, derived from the measured concentrations of corresponding oxides) [5].
Results The microscopic investigation of recently taken fly ash samples shows that fly ash from the smoke tract of pulverized oil shale furnaces of the Eesti PP contain 1,400–2,000 spherical particles per milligram of ash, and they are predominantly of glassy type. There is no significant difference between the ashes before and after the electrostatic precipitators, i.e. except high purification efficiency, the electrostatic precipitators are not selective in respect to the spherical particles.
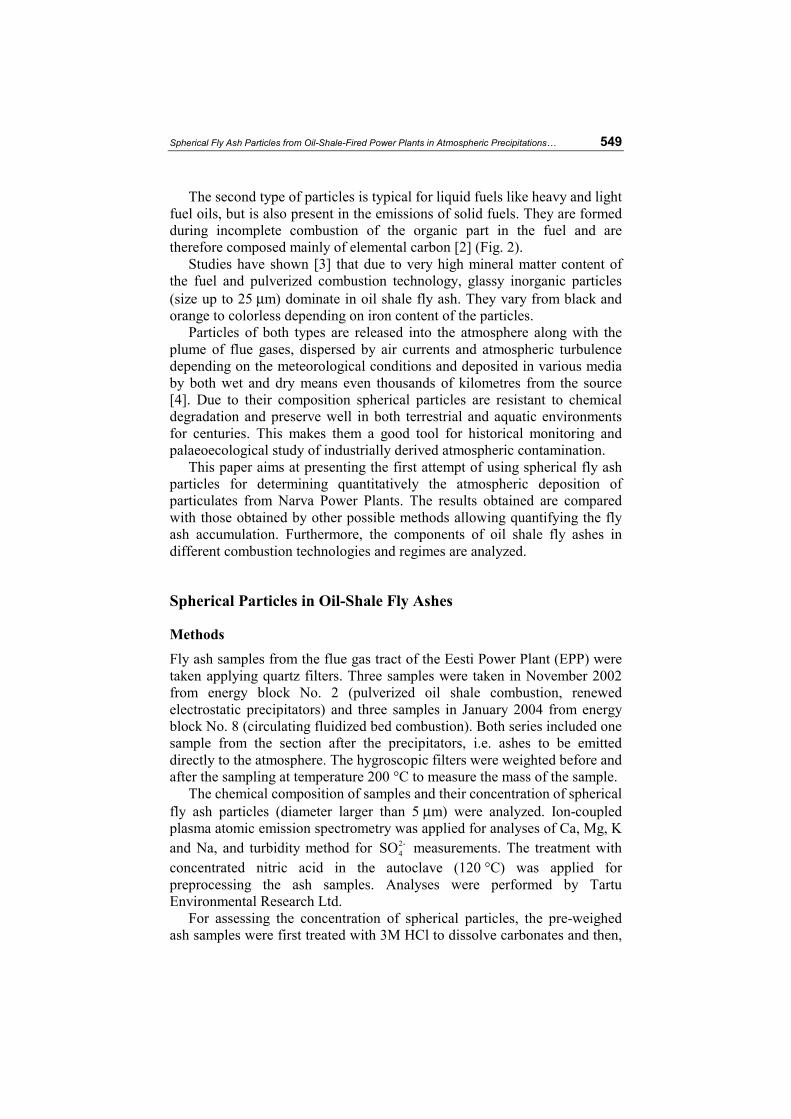
In contrary, there were no spherical glassy particles and very few large carbonaceous particles found in the fly ash of circulating fluidized-bed furnaces (Table 1). This result was expected, as the temperature in fluidized-bed furnace (about 800 °C instead of 1400 °C in pulverized oil shale furnace) is not high enough to melt the aluminosilicate matter. According to the analysis of ash samples taken in 1992, the older pulverized oil shale furnaces in the Eesti PP and the Ahtme PP emit several times less spherical particles than the renewed ones in the Eesti PP: about 300 per milligram.
Measurements of fly ash concentrations in flue gas indicate effective removal of solid emissions by precipitators and especially the efficiency of purification systems of circulating fluidized bed combustion furnace. The chemical analyses of ash samples show a rather uniform composition, except the sample of 27.11.2002 from the Eesti PP after electrostatic precipitators (see Table 1).
That experiment, unfortunately, was carried out under a non-optimal combustion regime. Gas velocity through the furnace was considered too high, what might leave a part of organic matter unburned increasing the total concentration of ashes in flue gas in that way and decreasing the concentration of metals in fly ash. Calcium content of other samples is roughly similar to the earlier results for the Balti PP [5], although the construction of furnaces and, consequently, the combustion regime, is different.
Spherical Fly Ash Particles from Oil-Shale-Fired Power Plants in Atmospheric Precipitations… 551
Table 1. Concentrations of Some Metals, Sulphate and Spherical Ash Particles in Oil-Shale Fly Ashes
Concentration, g/kg Sampling date or reference
Sampling location Concentration of fly ash in dry flue gas at 6% O2 content, mg/m3
Ca Mg Na K -24SO
Concentration of spherical particles, 1/mg
1992 EPP, electrostatic precipitator – – – – – – 258 1992 Ahtme PP, electrostatic precipitator – – – – – – 302 27.11.2002 EPP, before precipitator D 38,600 230 27 0.7 3.0 73 2,002 27.11.2002 EPP, before precipitator C 42,900 235 19 0.7 3.2 79 1,420 27.11.2002 EPP, after precipitators 483 47 6 0.4 1.7 34 1,632 20.01.2004 EPP, before precipitator B 83,900 199 28 0.7 1.7 44 0 20.01.2004 EPP, before precipitator A 74,900 206 28 0.7 1.7 57 0 20.01.2004 EPP, after precipitators 29 159 30.3 1.5 2 23 0 Pets et al., 1985 [X1] BPP, after precipitators – 220 11 0.1 28 – –

552 M. Kaasik et al.
The results on Mg fit with those of Pets et al. [5] within an order of
magnitude, but Na and K concentrations are completely dissimilar. Discrepancies due to different construction of the furnace, different fuel (may depend on the mining area) and different methods of analysis are possible. Lower concentration of sulphate in the circulating fluidized bed combustion furnaces (found especially after precipitators) was expected, because the binding of sulphur dioxide in the bottom ash of the furnace is more efficient at lower temperatures.
Spherical Particles in Atmospheric Precipitations
Methods The investigations of deposition of fly ash components from the atmosphere are based on the precipitation samples taken in several campaigns during 2002–2004 (Fig. 3).
The wintertime samples were taken from natural snow cover. The time interval of accumulation was identified comparing the vertical structure of snow package (ice crusts between accumu-lated layers corresponding to thawing episodes) with temperature data and precipitation amounts from meteoro-logical observations [6]. Snow samples were taken from recent well-identified layer applying a plastic tube, each sample consisted of 4–10 sub-samples (depending on the water storage of the layer) at 5–10 m distance from each other for correct representation of the sampling site. Each sample was taken into a plastic bag (sub-samples together in one volume), thawed in the same bag and stored in a plastic bottle at temperature about +5 °C until analyses (typically a few weeks).
For precipitation sampling during warm season the principle of EMEP precipitation sampler [7] (consisting of plastic bottle with plastic funnel mount-ed onto bottleneck) was used, but with significant modifications focused to sampling both particles caught by raindrops and falling directly to the surface in the course of gravitational
Meenikunno: 06.-11.08.2002 (2)
31.03-14.04.2004 (2)02.-15.12.2002 (5)
20.04.-10.05.2003 (2)15.-24.02.2004 (4)
Valgjärve: 26.01.-02.02.2002 (2)
Northern Puhatu etc.: 26.01.-01.02.2002 (6) 29.03.-15.04.2002 (4)
02.-15.12.2002 (12) 25.01.-08.02.2003 (10) 17.04.-08.05.2003 (6)
Central Puhatu: 18.-30.08.2003 (6)
30.08.-20.09.2003 (6)
Agusalu: 02.-12.08.2002 (4)
Along Narva river: 12.-16.03.2003 (8)South-Eastern
Puhatu: 15.-21.02.2004
(10)
TARTU
NARVA KOHTLA-JÄRVE
Fig. 3. Campaigns of precipitation sampling – sampling sites and dates

Spherical Fly Ash Particles from Oil-Shale-Fired Power Plants in Atmospheric Precipitations… 553
settling. The sampler’s bottle was mounted directly to the ground in order to avoid the aerodynamic distortions due to elevated position. The risk of contamination from soil was minimized by choosing the landscape: bog (no mineral ground) or under the forest with dense moss cover. The funnel of each sampler was washed with deionized water at the end of sampling period to collect into bottle the matter settled on the surface of funnel after last rainfall. This method does not enable us to estimate the concentrations of analyzed components in the precipitation water (like original EMEP method), but the total (wet and dry) deposition fluxes to the surface.
Sampling sites were chosen at compact areas separately for each campaign, according to the dominating wind direction (from Narva power plants to the sampling area). A few background sites in Põlva district (South-East Estonia) were investigated along with the oil-shale region. In all campaigns the open and forested sites were represented nearly equally.
Each water sample was divided into two parts: for chemical analysis and microscopic study. The ion chromatographic method was applied to measure the concentrations of Ca2+, Mg2+, Na+, K+, -2
4SO and Cl– in precipitation water. The suspended mineral matter in precipitation was determined after organic debris had been removed (treatment with 32% H2O2) when necessary, the residue filtrated and then weighed. The spherical particles on the filterpaper were counted under stereomicroscope at ×125 magnification.
Results
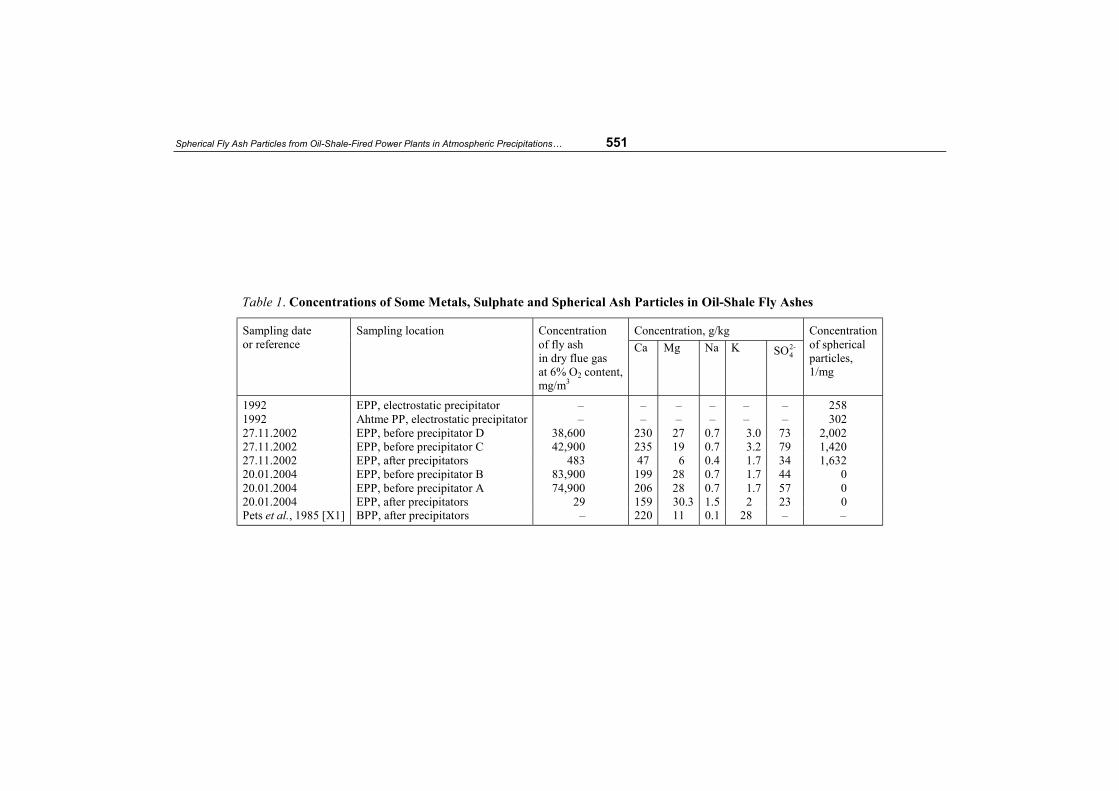
All campaigns show remarkably higher deposition fluxes of spherical fly ash particles in the oil-shale processing region than in the background area (Table 2). The difference between these regions is found to be larger during cold season than during warm one, reaching almost two decimal orders in December 2002 (Fig. 4).
Fig. 4. Average deposition fluxes of fly ash, estimated from snow samples (December 2–14, 2002) by three methods: based on calcium, spherical particles and total deposited matter
0
5
10
15
20
25
30
35
40
45
50
Ca particles matter
Basis of estimation
Estim
ated
fly
ash
flux,
mg/
m2 per
day oil-shale region
background

554 M. Kaasik et al.
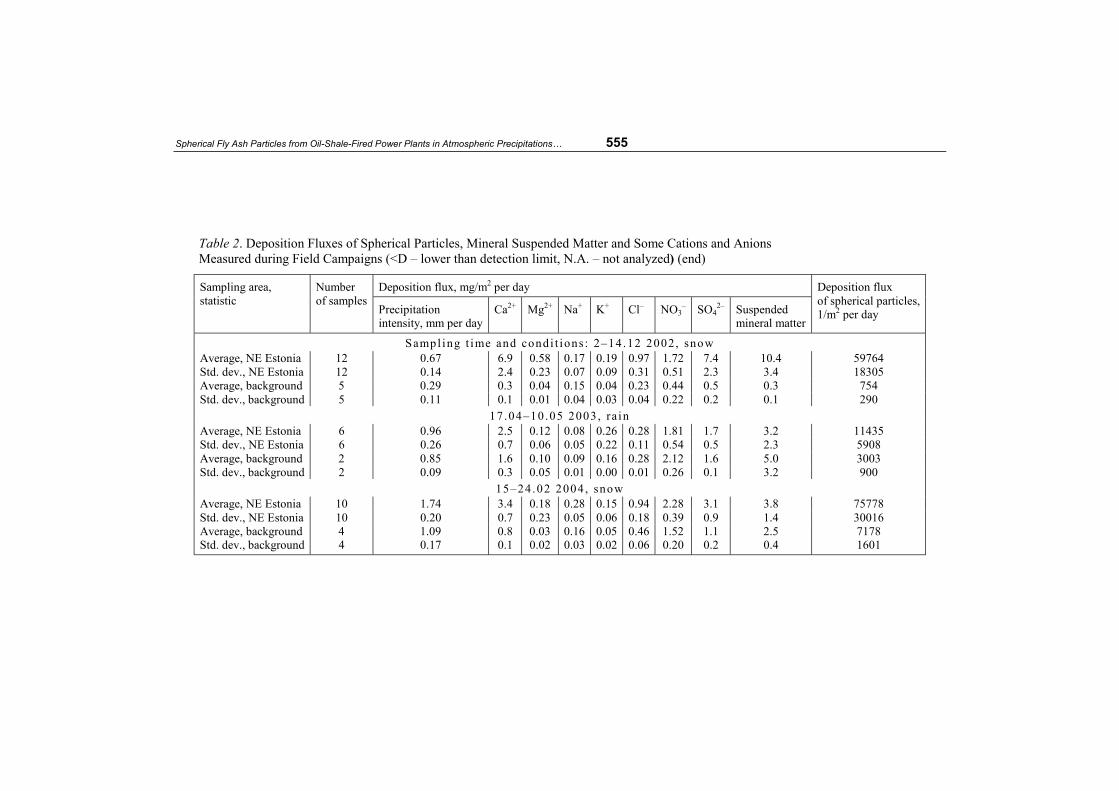
Table 2. Deposition Fluxes of Spherical Particles, Mineral Suspended Matter and Some Cations and Anions Measured during Field Campaigns (<D – lower than detection limit, N.A. – not analyzed)
Deposition flux, mg/m2 per day Sampling area, statistic
Number of samples
Precipitation intensity, mm per day
Ca2+ Mg2+ Na+ K+ Cl– NO3– SO4
2– Suspended mineral matter
Deposition flux of spherical particles, 1/m2 per day
Sampl ing t ime and condi t ions: 26 .01–02 .02 2002 , snow Average, NE Estonia 4 2.93 9.8 1.22 2.65 <D 5.27 1.82 4.8 N.A. 33276 Std. dev., NE Estonia 4 0.42 3.3 0.54 0.49 <D 0.87 0.32 1.9 N.A. 15356 Average, background 2 2.69 1.8 <D 0.35 <D 0.94 1.58 0.9 N.A. 500 Std. dev., background 2 0.16 0.9 <D 0.38 <D 0.89 0.97 0.8 N.A. 383
29 .03–15 .04 2002 , ra in Average, NE Estonia 4 0.23 18.9 1.70 0.24 1.86 1.83 N.A. 17.5 12.2 19257 Std. dev., NE Estonia 4 0.05 7.6 1.14 0.27 2.30 2.00 N.A. 12.7 0.5 4458 Average, background 2 0.19 5.2 0.51 0.09 0.37 0.42 N.A. 1.7 8.1 1632 Std. dev., background 2 0.02 0.2 0.20 0.00 0.20 0.13 N.A. 0.9 3.1 476
2–12 .08 2002 , d ry Average, NE Estonia 4 0.00 12.9 1.02 0.11 0.59 0.46 N.A. 4.3 9.5 2974 Std. dev., NE Estonia 4 0.00 1.9 0.24 0.03 0.22 0.13 N.A. 1.4 1.7 910 Average, background 2 0.00 14.3 1.10 0.27 1.03 0.89 N.A. <D 14.4 580 Std. dev., background 2 0.00 0.7 0.58 0.00 0.49 0.09 N.A. <D 4.9 385
Spherical Fly Ash Particles from Oil-Shale-Fired Power Plants in Atmospheric Precipitations… 555
Table 2. Deposition Fluxes of Spherical Particles, Mineral Suspended Matter and Some Cations and Anions Measured during Field Campaigns (<D – lower than detection limit, N.A. – not analyzed) (end)
Deposition flux, mg/m2 per day Sampling area, statistic
Number of samples
Precipitation intensity, mm per day
Ca2+ Mg2+ Na+ K+ Cl– NO3– SO4
2– Suspended mineral matter
Deposition flux of spherical particles, 1/m2 per day
Sampl ing t ime and condi t ions: 2–14 .12 2002 , snow Average, NE Estonia 12 0.67 6.9 0.58 0.17 0.19 0.97 1.72 7.4 10.4 59764 Std. dev., NE Estonia 12 0.14 2.4 0.23 0.07 0.09 0.31 0.51 2.3 3.4 18305 Average, background 5 0.29 0.3 0.04 0.15 0.04 0.23 0.44 0.5 0.3 754 Std. dev., background 5 0.11 0.1 0.01 0.04 0.03 0.04 0.22 0.2 0.1 290
17 .04–10 .05 2003 , ra in Average, NE Estonia 6 0.96 2.5 0.12 0.08 0.26 0.28 1.81 1.7 3.2 11435 Std. dev., NE Estonia 6 0.26 0.7 0.06 0.05 0.22 0.11 0.54 0.5 2.3 5908 Average, background 2 0.85 1.6 0.10 0.09 0.16 0.28 2.12 1.6 5.0 3003 Std. dev., background 2 0.09 0.3 0.05 0.01 0.00 0.01 0.26 0.1 3.2 900
15–24 .02 2004 , snow Average, NE Estonia 10 1.74 3.4 0.18 0.28 0.15 0.94 2.28 3.1 3.8 75778 Std. dev., NE Estonia 10 0.20 0.7 0.23 0.05 0.06 0.18 0.39 0.9 1.4 30016 Average, background 4 1.09 0.8 0.03 0.16 0.05 0.46 1.52 1.1 2.5 7178 Std. dev., background 4 0.17 0.1 0.02 0.03 0.02 0.06 0.20 0.2 0.4 1601

556 M. Kaasik et al.
Deposition fluxes of calcium, magnesium, sodium, potassium, sulphate,
chloride and suspended mineral matter are also higher in oil-shale processing region, as a rule, but not in all campaigns and never by so high factor than the flux of spherical particles. Deposition flux of nitrate is not clearly indicative of oil shale combustion at contemporary emission levels. Thus, at least in qualitative sense spherical particles serve as best indicators of oil-shale fly ash within the components represented in Table 2.
Discussion
Different Methods of Tracing the Deposited Fly Ash According to the relatively high deposition fluxes in oil shale processing region, the spherical particles might be good tracers of oil shale fly ash in atmospheric precipitations, if their concentration in precipitated fly ash is stable enough. Thus, we have to study quantitative relations between spherical particles and other possible tracers of fly ash in the precipitation samples.
Calcium ion has been used as a “classical” indicator of oil shale fly ash in several studies [8, 6, 9] before, but, due to diminishing emissions and relatively high background fluxes, its indicative value has decreased during recent years. According to Table 1, the 22% calcium content of fly ash can be assumed when calculating the deposition of fly ash.
Another possibility to estimate the fly ash deposition flux is to summarize the fluxes of components expected to originate mainly from oil-shale fly ash, i.e. ions presented in Table 2 (except nitrate) and suspended mineral matter. According to the analyses of filter ashes [5], silicon dioxide SiO2 (insoluble in natural rainwater, probably main constituent of suspended mineral matter as quartz and also clay minerals and feldspars are bearers of Si in oil shale) constitutes about 32% of ash, Ca about 22% and Mg, Na, K together about 5–6%.
Fraction of sulphate and chloride is not well known, but according to Table 1 it may be about three times less than Ca content. Thus, our analyses cover about 70% of the total mass of ashes. The actual share may be even larger, according to several hard-soluble salts within suspended mineral matter. However, we miss several soluble anions (carbonates in first order), but that lack of mass is probably partially compensated (in some cases, may-be even overcompensated) by uptake and sulphatisation of SO3 from the flue gas in and after the stack, in the atmosphere. Thus, we have a reason to think that the sum of fluxes of ions and suspended matter in Table 2 might be close to the total flux of fly ash.
When the average concentration of spherical particles in fly ash is taken equal to 1,600 particles per one milligram of ash (see Table 1, data for 2002), then, following the considerations above, we can estimate the deposition fluxes of fly ash by three different ways: (1) based on calcium

Spherical Fly Ash Particles from Oil-Shale-Fired Power Plants in Atmospheric Precipitations… 557
flux, (2) based on the flux of spherical particles and (3) based on the total flux of deposited matter.
Let us examine first the results of the largest campaign, which resulted also in the most explicit impact of Narva Power Plants [10] (see Fig. 4). In this particular case these three methods to estimate the fly ash flux agree well within the limits of standard deviation. The lowest values based on the total matter are expected due to several components missing in the analyzed set. Differences between different estimation methods of fly ash flux at background sites are much larger, which is actually a proof that the impact of oil-shale-related pollution is there low indeed: proportions between the analyzed components differ from those than expected on the basis of the composition of ashes.
When analyzing all the results of different campaigns together, we have to keep in mind that conditions during these were not uniform: research areas were not exactly the same (and thus, distances from power plants), season and weather conditions (affecting both the working regime of power plants and atmospheric deposition of the ash particles) were dramatically different. Therefore, the average deposition fluxes even within the oil-shale processing region vary more than ten times. Thus, due to enormous variance, we cannot compare directly the total averages of fluxes estimated using different methods. We must find statistics to compare the estimated fluxes sample-wise.
A well-applied method of such type is the linear (Pearson) correlation. On the other hand, correlation coefficient measures only the proportionality (with the precision of constant additive) of two variables, not the closeness of their values. We can calculate the ratio of two estimated fluxes, but the meaning of ordinary ratio (the first variable divided to the second one) is distorted, when taking the arithmetic average. Therefore the normalized ratio (widely used in air pollution science, often also named “fractional bias” [11]) was applied, defined as:
)(5.0 YXYXRn +
−= (1) where X and Y are two variables to be compared.
The advantage of normalized ratio is its symmetric behavior in respect of both variables: i.e. ordinary ratios 1/2 and 2 correspond to normalized ratios –2/3 and 2/3 respectively, the normalized ratio of equal values is zero. Thus, the averaging of normalized ratios is symmetrical in respect of variables, only sign (plus or minus) is changed when changing the order of variables in the Equation (1).
The overall results of comparison of fly ash fluxes estimated by three different ways are much more complicated than those for December 2002 campaign. Due to different deposition conditions and working regime of power plants, the entire ensemble of results is divided into cold and warm

558 M. Kaasik et al.
season and, naturally, into samples from oil-shale-processing region and background.
In general, deposition fluxes estimated from spherical particles are neither well correlated nor close by the value to the fluxes based on Ca and total matter. Although the correlations of fluxes in oil-shale processing region are positive, these values are far from good proportionality. The normalized ratios show that the particle-based method overestimates in cold season and underestimates in warm season the deposition fluxes in respect to other two methods (Table 3).
Table 3. Correlations and Normalized Ratios of Fly Ash Deposition Fluxes Estimated from Precipitation Samples by Three Different Methods: Based on the Flux of Spherical Particles, Calcium Ion and Total (Solved and Suspended) Matter
Statistic Particles resp. matter Particles resp. Ca2+ Matter resp. Ca2+
Sampl ing condi t ions : to ta l Number of samples 82 Correlation 0.24 0.06 0.87 Average normalized ratio –0.18 –0.12 0.00 Std. dev. of normalized ratio 0.95 1.03 0.49
Warm season , o i l shale region Number of samples 26 Correlation 0.38 0.27 0.97 Average normalized ratio –0.76 –0.76 –0.12 Std. dev. of normalized ratio 0.62 0.80 0.51
Cold season , o i l shale region Number of samples 40 Correlation 0.29 0.14 0.62 Average normalized ratio 0.57 0.66 0.08 Std. dev. of normalized ratio 0.54 0.57 0.52
Warm season , background Number of samples 6 Correlation –0.82 0.21 0.94 Average normalized ratio –1.66 –1.66 –0.30 Std. dev. of normalized ratio 0.38 0.41 0.42
Cold season , background Number of samples 10 Correlation 0.43 0.06 0.84 Average normalized ratio –0.80 –0.64 0.20 Std. dev. of normalized ratio 0.64 0.76 0.19
The average discrepancy is nearly in factor two in both cases. The fit
between the methods based on calcium and total matter is almost perfect in both cases, in terms of normalized ratio even at background sites. It should be kept in mind that those two methods are not independent: calcium constitutes a remarkable part in the total mass of matter analyzed in samples, often more than a half (see Table 2).
Spherical Fly Ash Particles from Oil-Shale-Fired Power Plants in Atmospheric Precipitations… 559
Why the Concentration of Spherical Particles in Deposited Mineral Matter Varies? Although the sensitivity of spherical fly ash particles indicating the oil-shale-related atmospheric pollution is clear, the exact mechanisms forming different concentrations of these particles among deposited components of fly ash remain unclear. We refer to a few possible reasons of discrepancies below. Nowadays four different types of oil shale boilers are used in Narva power plants, emitting fly ash of different characteristics and in various amounts: 1. TP 17 (eight boilers) and TP 67 (four boilers) – pulverized firing oil shale
boilers with old (Soviet production), relatively inefficient electrostatic precipitators in the Balti PP
2. TP 67 (two boilers) and TP 101 (seven boilers) – pulverized firing oil shale boilers with new (since 1997–2002), more efficient electrostatic precipitators in the Balti and the Eesti PP
3. Foster Wheeler CFB boilers – first one in the Eesti PP (since January 2004) and the second one in Balti PP, with air emissions compliant to EC Large Combustion Plant Directive (2001/80/EC) Emissions of spherical particles from each type are very different and
vary even within one type, depending on combustion regime, as we see from Table 1. Contributions of different sources of particles at a certain site vary with source intensity and wind direction.
Concentration of spherical glassy particles in fly ash depends mainly on furnace temperature. Much more research on ashes from the smoke tract (including detail investigations of glassy and carbonaceous particles) is needed to understand the relations between boiler type, combustion regime and emission of spherical particles. We see here a chance to follow the “traces” of different types of furnaces, leaving new possibilities to investigate transport mechanisms of solid particles in the atmosphere.
It is possible that atmospheric deposition mechanisms are somewhat selective in respect of different types of ash particles. The rate of wet deposition depends on the solubility of particles: soluble particles can be better scavenged by the cloud droplets than insoluble (like spherical particles), but wintertime washout by snowflakes can be rather intense and unselective in respect of particle properties [12]. That mechanism may be at least partially responsible on higher (relative to the total particulate matter) deposition fluxes during wintertime.
Dry deposition of particles of super-micron size order is governed by gravitational settling and turbulent transfer. Turbulent transfer (prevailing in summertime) is not selective in respect of particle size and mass. In wintertime and during night the turbulent transfer often vanishes. According to the Stokes’ law, the velocity of gravitational settling is proportional to the particulate matter density and cross-section surface of the particle. Thus, relatively small differences in particle size and composition can cause

560 M. Kaasik et al.
remarkably different deposition fluxes. Unfortunately, we still do not have reliable data on size distributions of different types of fly ash particles: studies are complicated due to irregular form and aggregation of particles.
When looking at the proportions of technogenic and background deposition some aspects need to be mentioned. The contemporary level of fly ash deposition in the oil shale processing region is several times lower than in the 1970’s or the 1980’s. Thus, for most of the studied components (not regarding spherical particles) the regional industrial input is in the same order of magnitude with background values (see Table 2). Therefore, the non-oil-shale fluxes of Ca, other cations and anions and suspended mineral matter interfere the fly-ash-based proportions of components.
It is natural that in summertime a large part of deposited matter can originate from soil erosion. That matter is rich of both soluble and insoluble minerals, but does not contain spherical particles, except small amounts of previously deposited and resuspended ones. The campaign in August 2002 is a drastic example: deposition fluxes of calcium and several other components are even higher at background areas than in the oil-shale processing region. Probably, the exceptionally hot and dry summer of that year is responsible on soil erosion and forest fires, impact of which may be stronger in more continental south-eastern Estonia.
Thus, we have several reasons scattering the proportion of spherical particles to other fly ash components measured in precipitations. All these reasons can act simultaneously, in combination. It will be a task for future to clarify the mechanisms and to refine the methods of backward tracing from deposition to emissions.
Conclusions
1. The atmospheric deposition fluxes of spherical particles in the oil-shale processing region are 1-2 decimal orders larger than the background values. Thus, these particles are potentially best indicators of oil-shale combustion relative to other detected components of fly ash.
2. The concentration of spherical particles in fly ash is highly variable due to different technologies and regimes used for oil shale combustion in power plants. This diminishes their indicative value at our current level of knowledge, but opens new possibilities to refine tracing methods towards the resolution of “traces” of different energy production units.
3. Due to lower background loads the wintertime (snowy) campaigns give more reliable results for tracing both the spherical particles and chemical components of oil-shale fly ash than those provided during the warm season. On the other hand, campaigns during both cold and warm seasons are needed to get a comprehensive overview of yearly fluxes to the ecosystem.
Spherical Fly Ash Particles from Oil-Shale-Fired Power Plants in Atmospheric Precipitations… 561
Acknowledgements
This paper is a result of the research Grant No. 5002 funded by the Estonian Science Foundation. Authors are thankful to Ülis Sõukand from Tartu Environmental Research Ltd. for methodological consultations on chemical analysis and to numerous persons for kind assistance during the fieldwork.
REFERENCES
1. Raask, E. Creation, capture and coalescence of mineral species in coal flames // J. Inst. Energy. 1984. Vol. 57. P. 231–239.
2. Bacci, P., Del Monte, M., Longhetto, A., Piano, A., Prodi, F., Redaelli, P., Sabbioni, C., Ventura, A. Characterization of the particulate emission by a large oil fuel fired power plant // J. Aerosol Sci. 1983. Vol. 14. P. 557–572.
3. Alliksaar, T., Hörstedt, P., Renberg, I. Characteristic fly-ash particles from oil shale combustion found in lake sediments // Water, Air and Soil Pollution. 1998. Vol. 104. P. 149–160.
4. Semb, A., Hanssen, J. E., Francois, F., Maenhaut, W., Pacyna, J. M. Long-range transport and deposition of mineral matter as a source for base cations // Water, Air and Soil Pollution. 1995. Vol. 85. P. 1933–1940.
5. Pets, L. I., Vaganov, P. A., Knoth, I., Haldna, Ü., Schwenke, H., Schnier, C., Juga, R. Microelements in oil shale ash of the Baltic Thermoelectric Power Plant // Oil Shale. 1985. Vol. 2, No. 4. P. 379–390 [in Russian with English summary].
6. Kaasik, M., Rõõm, R., Røyset, O., Vadset, M., Sõukand, Ü., Tõugu, K., Kaasik, H. Elemental and base anions deposition in the snow cover of north-eastern Estonia. The impact of industrial emissions // Water, Air, and Soil Pollution. 2000. V.121. P. 349–366.
7. EMEP Manual for Sampling and Chemical Analysis. – NILU, Kjeller, 1996. 8. Voll, M., Trapido, M., Luiga, P., Haldna, Ü., Palvadre, R., Johannes, I. Spread
of atmospheric wastes from power equipments and oil shale processing enterprises // Natural State and Development of the Kurtna Lakeland / M. Ilomets (ed.) – Tallinn, Valgus, 1989. P. 29–42 [in Estonian].
9. Kaasik, M., Sõukand, Ü. Balance of alkaline and acidic pollution loads in the area affected by oil shale combustion // Oil Shale. 2000. V. 17, No. 2. P. 113–128.
10. Kaasik, M., Alliksaar, T. Dry deposition of coarse solid particles in patchy sub-boreal landscape // Air Pollution Modelling and its Applications, NATO “Challenges of modern society”/ Borrego, C., Incecik, S. (eds.) – Kluwer, N.Y., 2004. P. 491–499.
11. Hanna, S. R, Strimaitis, D. G., Chang, J. C. User’s Guide for Software for Evaluating Hazardous Gas Dispersion Models. – Sigma Research Corporation, Westford, MA, 1991.
12. George, W, Slinn, N. Precipitation scavenging // Atmospheric Science and Power Production / D. Randerson (Ed.) – U.S. Dept. of Energy, Oak Ridge, 1984. P. 466–524.
Received December 27, 2004