SPERM MORPHOMETRY AND MOTILITY IN AN AFRICAN … · sperm morphometry and motility in an african...
84
SPERM MORPHOMETRY AND MOTILITY IN AN AFRICAN CICHLID, PSEUDOCRENILABRUS MULTICOLOR VICTORIAE, ACROSS DIVERGENT HABITATS by KERRY PERRAULT A thesis submitted in partial fulfillment of the requirements for the degree of Master of Science (MSc) in Biology The Faculty of Graduate Studies Laurentian University Sudbury, Ontario, Canada © Kerry Perrault, 2015
Transcript of SPERM MORPHOMETRY AND MOTILITY IN AN AFRICAN … · sperm morphometry and motility in an african...
SPERM MORPHOMETRY AND MOTILITY IN AN AFRICAN
CICHLID, PSEUDOCRENILABRUS MULTICOLOR VICTORIAE,
ACROSS DIVERGENT HABITATS
by
KERRY PERRAULT
A thesis submitted in partial fulfillment
of the requirements for the degree of
Master of Science (MSc) in Biology
The Faculty of Graduate Studies
Laurentian University
Sudbury, Ontario, Canada
© Kerry Perrault, 2015

ii
THESIS DEFENCE COMMITTEE/COMITÉ DE SOUTENANCE DE THÈSE
Laurentian Université/Université Laurentienne
Faculty of Graduate Studies/Faculté des études supérieures
Title of Thesis
Titre de la thèse SPERM MORPHOMETRY AND MOTILITY IN AN AFRICAN
CICHLID, PSEUDOCRENILABRUS MULTICOLOR VICTORIAE,
ACROSS DIVERGENT HABITATS
Name of Candidate
Nom du candidat Perrault, Kerry
Degree
Diplôme Master of Science
Department/Program Date of Defence
Département/Programme Biology Date de la soutenance October 13, 2015
APPROVED/APPROUVÉ
Thesis Examiners/Examinateurs de thèse:
Dr. Mery Martinez
(Supervisor/Directeur(trice) de thèse)
Dr. Lauren Chapman
(Committee member/Membre du comité)
Dr. Suzanne M. Gray
(Committee member/Membre du comité)
Approved for the Faculty of Graduate Studies
Dr. Albrecht Schulte-Hostedde Approuvé pour la Faculté des études supérieures
(Committee member/Membre du comité) Dr. David Lesbarrères
Monsieur David Lesbarrères
Dr. Trevor Pitcher Acting Dean, Faculty of Graduate Studies
(External Examiner/Examinateur externe) Doyen intérimaire, Faculté des études
supérieures
ACCESSIBILITY CLAUSE AND PERMISSION TO USE
I, Kerry Perrault, hereby grant to Laurentian University and/or its agents the non-exclusive license to
archive and make accessible my thesis, dissertation, or project report in whole or in part in all forms of
media, now or for the duration of my copyright ownership. I retain all other ownership rights to the
copyright of the thesis, dissertation or project report. I also reserve the right to use in future works
(such as articles or books) all or part of this thesis, dissertation, or project report. I further agree that
permission for copying of this thesis in any manner, in whole or in part, for scholarly purposes may be
granted by the professor or professors who supervised my thesis work or, in their absence, by the
Head of the Department in which my thesis work was done. It is understood that any copying or
publication or use of this thesis or parts thereof for financial gain shall not be allowed without my
written permission. It is also understood that this copy is being made available in this form by the
authority of the copyright owner solely for the purpose of private study and research and may not be
copied or reproduced except as permitted by the copyright laws without written authority from the
copyright owner

iii
ABSTRACT
There is a paucity of studies on the natural variation in sperm morphometry and
motility in a single species across dissolved oxygen regimes. This study measured
the natural variation in reproductive traits including sperm morphometry and motility
of male Pseudocrenilabrus multicolor victoriae across a wide range of habitats in
Uganda, Africa. I investigated whether fish displayed differences in testes mass,
testes asymmetry, sperm morphometry, and sperm motility. P. multicolor were
collected from nine sites characterized by three oxygen regimes: seasonally
fluctuating, hypoxic and normoxic. Fish traits were measured and analyzed by site
and by oxygen regime. I found that P. multicolor display variation in reproductive
traits across habitats, and that males in hypoxic regimes are smaller bodied, have
lower testes asymmetry, shorter sperm, and a higher sperm velocity relative to males
in normoxic or fluctuating regimes. Males may be able to invest more energy into
reproduction in hypoxic sites due to a lack of predators in these sites. Additionally,
over the long term, males in hypoxic sites may have locally adapted to chronic
conditions, allowing them to invest more energy into testes and sperm to offset the
costs of living under hypoxia. In contrast, males from the fluctuating regime were
large bodied, had high testes asymmetry, and the longest sperm with the lowest
sperm velocity. Males in fluctuating regimes may be experiencing energetic trade-
offs between growth and reproduction, due to the less predictable oxygen levels in
their habitat. Future studies should assess P. multicolor for trait differences across
oxygen regimes in a split-brood laboratory study to control for confounding effects
of food availability, predation risk, and mating competition on reproductive traits.
Keywords
Sperm morphology, sperm motility, Pseudocrenilabrus multicolor victoriae, testis asymmetry
iv
RÉSUMÉ
Il y a peu d'études traitant la variation naturelle morphologique des spermatozoïdes et
leur motilité dans une seule espèce dans divers régimes d'oxygène dissous. Cette
étude a mesuré la variation naturelle des traits reproductifs, y compris la
morphométrie des spermatozoïdes et leur motilité chez les mâles du poisson
Pseudocrenilabrus multicolor victoriae habitant une diversité d'habitats d’Ouganda,
en Afrique. J’étudiée si les poissons présentent des différences au niveau d’indices
gonadosomatiques, d’asymétrie testiculaire, ainsi que la morphométrie et la motilité
des spermatozoïdes. Les mâles P. multicolor ont étaient recueillies dans neuf sites
caractérises par trois régimes d'oxygène: saisonnier fluctuante, hypoxique et
normoxique. Les différents traits chez les poissons ont étaient mesures et analyses
par site ainsi que selon le régime d'oxygène dissous. J’ai trouvé une variation des
traits reproductifs chez P. multicolor selon l’habitat où ils se trouvent. De plus, les
mâles habitant dans des régimes hypoxiques ont un corps plus petit, possèdent un
index gonadosomatique supérieur, avec de spermatozoïdes plus courts, et possédant
une plus grande vitesse de nage que les ceux des mâles habitant des régimes
normoxiques ou fluctuants. Il est possible que les mâles puissent être en mesure
d'investir plus d'énergie dans la reproduction dans des sites hypoxiques en raison d'un
manque de prédateurs dans ces sites. En outre, il est possible aussi à long terme, que
les mâles des sites hypoxiques se sont adaptés localement aux conditions chroniques,
leur permettant ainsi d'investir plus d'énergie dans le développement des testicules et
la qualité des spermatozoïdes pour compenser les coûts d’habiter sous des conditions
d'hypoxiques. En revanche, les mâles du régime fluctuant ont de grands corps, ayant
le deuxième plus haut index gonadosomatique, une grande asymétrie testiculaire, et
le plus long des spermatozoïdes mais avec la vitesse de nage la plus basse. Il est fort
probable que les mâles des régimes fluctuants éprouvent des challenges énergétiques
compromettant la croissance et la reproduction, en raison des niveaux d'oxygène
moins prévisibles dans leur habitat. Les études futures devraient évaluer différents
traits chez P. multicolor entre différents régimes d'oxygène dans des conditions
contrôlées de laboratoire pour ainsi contrecarrer les possibles effets de confusion de
v
la disponibilité alimentaire, le risque de prédation, et la concurrence d'accouplement
sur les traits reproductifs.

vi
ACKNOWLEDGEMENTS
I would like to thank my family, especially my son Damien and my husband Evan,
for being my inspiration and support during my time at Laurentian. Thank you to my
mother Rose, Evan’s mother Darlene and Evan’s siblings for helping take care of
Damien while I furthered my education. I could not have completed this thesis
without them. My supervisor, Dr. Mery Martínez has taught me much more than you
will find in this thesis. After two years of working with her, I have become more
confident, and have become a better researcher and communicator of science. I feel
very fortunate to have been a student in her lab. I am grateful to my committee,
including Dr. Lauren Chapman, Dr. Suzanne Gray, and Dr. Schulte-Hostedde, who
gave me their time and input. Special thanks goes to my lab mate Brandon Varela,
who developed the sperm performance analysis protocol, and helped me in ways I
cannot express over the last two years. I would also like to thank Darryl Edwards for
taking the time to look at my data, and teaching me not to fear statistics. Thank you
Lorraine Brosseau for helping to make a very nervous student into a useful teaching
assistant. Finally, I would like to thank my funders and everyone who was involved
in the fieldwork for my study. I would not have been able to attend Laurentian
without my band, Garden River First Nation. I would also like to extend my
gratitude to the Uganda National Council for Science and Technology and Makerere
University for providing the permission to conduct research in Uganda Finally, this
project was possible thanks to the financial support provided by Laurentian
University Research Funds and the National Science and Engineering Research
Council of Canada.

vii
TABLE OF CONTENTS
ACKNOWLEDGEMENTS .................................................................................................... vi
GENERAL INTRODUCTION ................................................................................................ 1
1.1 Mating systems, sexual selection, and fitness ............................................................................... 2
1.3 African cichlid evolution and mating systems .............................................................................. 5
1.4 Reproductive fitness and the environment .................................................................................... 6
1.5 General effects of hypoxia on fishes ............................................................................................. 8
1.6 Hypoxia and reproduction ............................................................................................................ 9
1.7 Male reproductive traits and the environment ........................................................................... 10
1.7 STUDY PROBLEM ................................................................................................................... 13
1.8 STUDY QUESTION .................................................................................................................. 14
1.9 HYPOTHESIS AND PREDICTIONS ....................................................................................... 15
MATERIALS AND METHODS ........................................................................................... 16
2.1 Study sites ................................................................................................................................... 16
2.2 Data collection ........................................................................................................................... 16
2.2 Sperm swimming capacity and sperm morphometry .................................................................. 18
2.3 Statistical analyses ..................................................................................................................... 22
RESULTS ............................................................................................................................... 25
Analyses by site ................................................................................................................................ 25
3.1 General body morphometry ........................................................................................................ 25
3.2 Sperm morphometrics ................................................................................................................. 30
3.3 Sperm motility............................................................................................................................. 33
Summary of results by site ................................................................................................................ 36
Analyses by dissolved oxygen regime ............................................................................................... 37
DISCUSSION ........................................................................................................................ 44
4.1 General body morphometry ........................................................................................................ 44
4.2 Sperm morphometry and motility ............................................................................................... 46
4.3 Other effects on energy in fishes in natural settings ................................................................... 51
CONCLUSION ...................................................................................................................... 54
REFERENCES ....................................................................................................................... 56
Appendix 1 ............................................................................................................................. 72
Correlations for variables that interacted with the covariate in ANCOVA ANALYSIS ....... 72
viii
Appendix 2 ............................................................................................................................. 74
Relationship between somatic mass and testes mass in male P. multicolor ........................... 74

ix
LIST OF TABLES
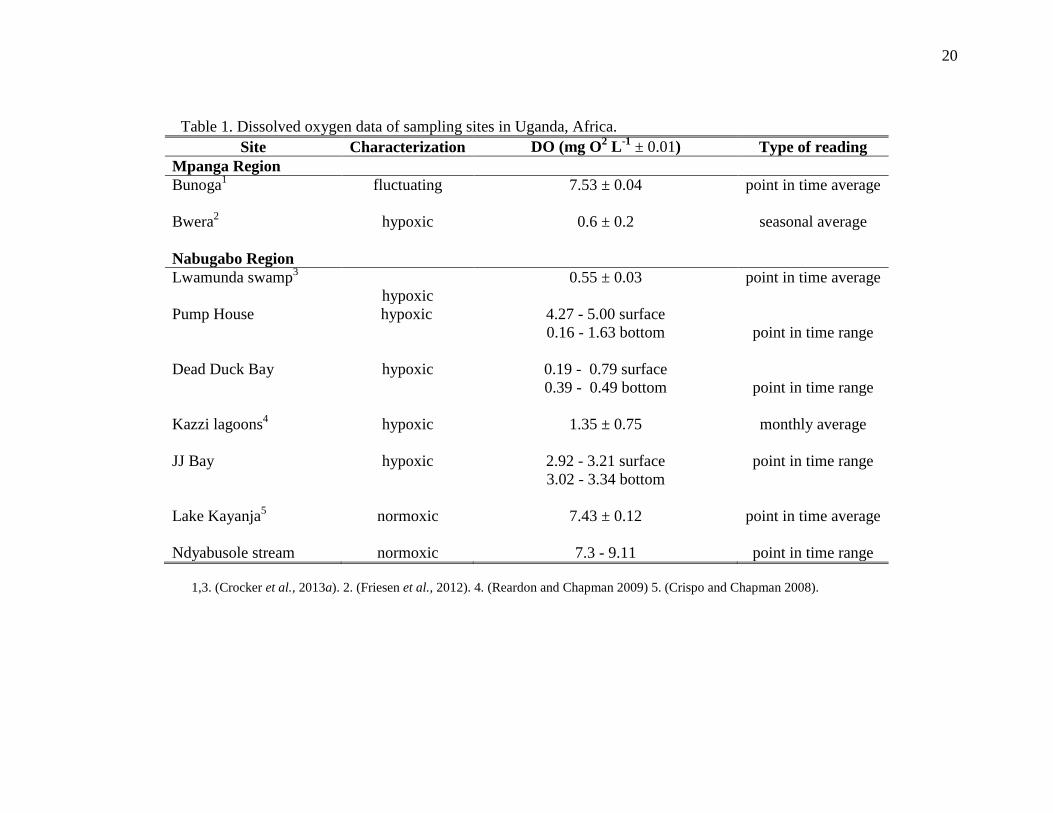
TABLE 1 Dissolved oxygen levels of sampling sites ........................................................... 20
TABLE 2 General morphological traits, sperm morphometry traits and sperm motility
of P. multicolor victoriae by site .................................................................................. 27
TABLE 3 Results of nested ANCOVAs for P. multicolor traits by site ............................... 29
TABLE 4 Results of principal component analysis of sperm morphometry traits of P.
multicolor victoriae across sites ................................................................................... 31
TABLE 5 Results of hierarchical linear regression of 3 models with velocity and
linearity at each post-activation time ........................................................................... 39
TABLE 6 Beta coefficients and P-value of each variable from Model 3 of hierarchical
regression ..................................................................................................................... 40
TABLE 7 Variation in general morphological traits, sperm morphometry traits and
sperm motility of male P. multicolor by oxygen regime ............................................. 42
TABLE 8. Results of nested ANCOVAs for P. multicolor traits by oxygen regime ............ 43

x
LIST OF FIGURES
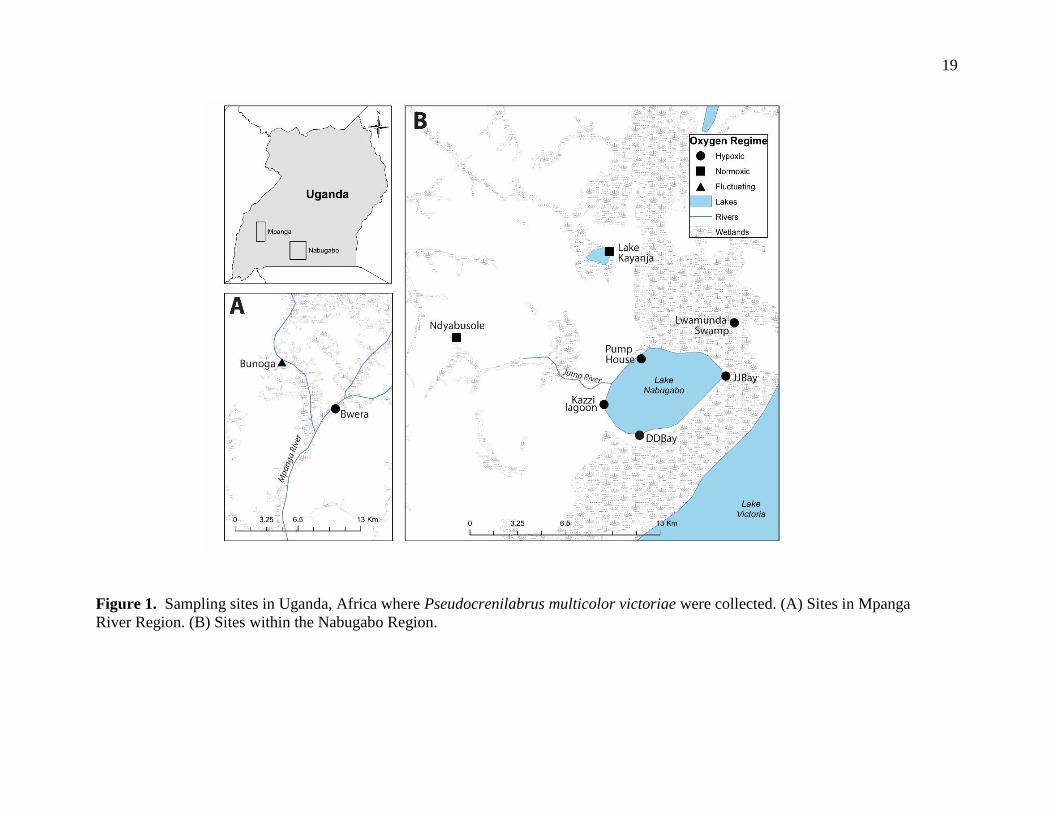
Figure 1. Sampling sites in Uganda, Africa............................................................................ 19
Figure 2. Left and right testes mass across sampling sites ..................................................... 28
Figure 3. Examples of sperm morphometry from Pump house and Bunoga .......................... 31
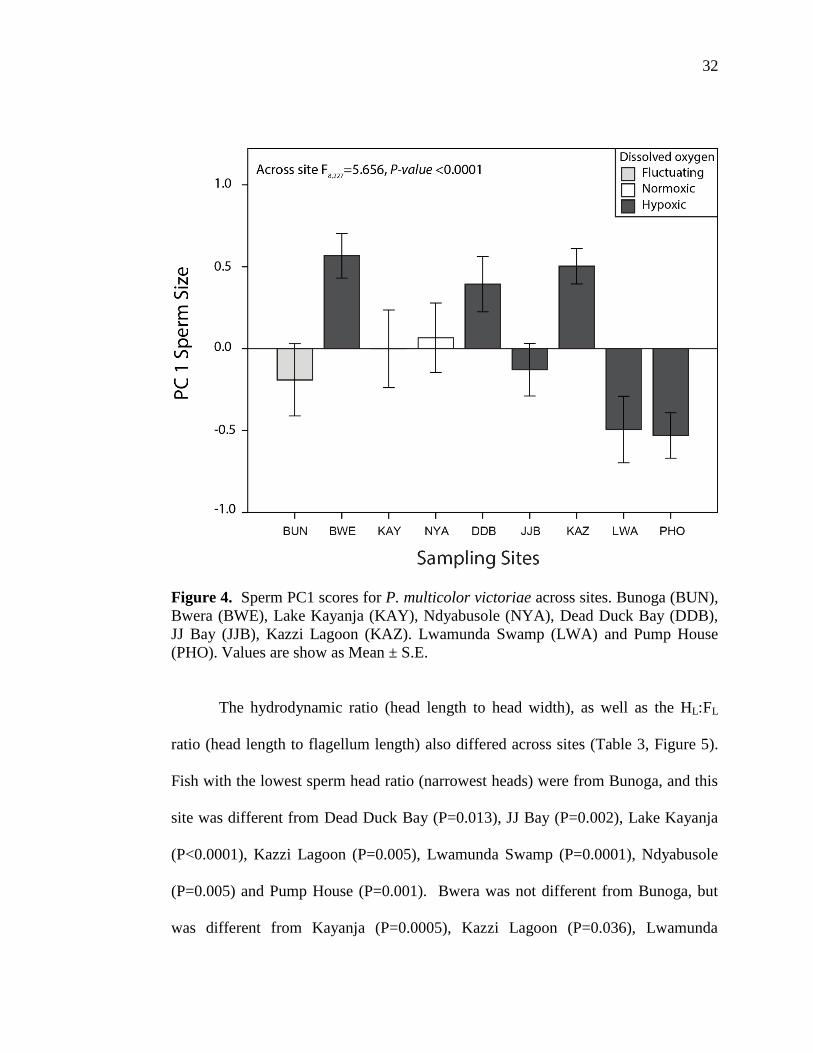
Figure 4. Variation in sperm morphometry shown through principal component scores
across sites .................................................................................................................... 32
Figure 5. Variation in sperm morphometry ratios of hydrodynamic head ratio and head
length to flagellum length of P. multicolor victoriae across sites ................................ 33
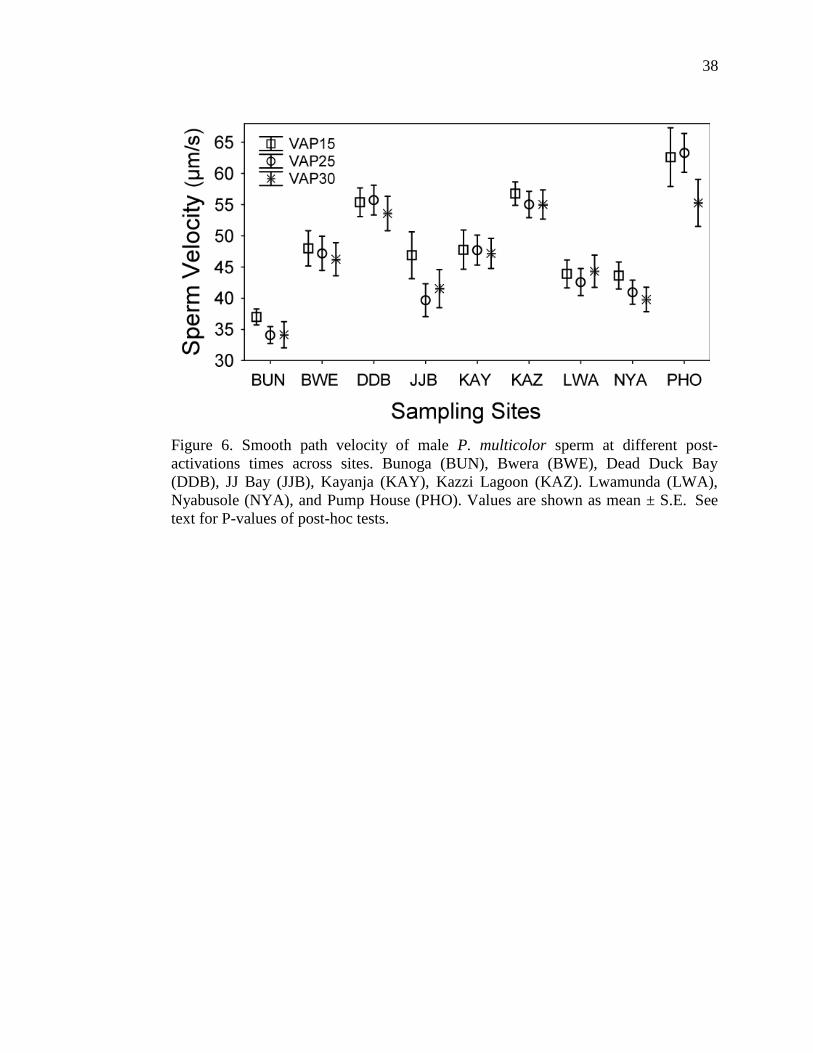
Figure 6. Smooth path velocity of male P. multicolor sperm at different post-activations
times across sites .......................................................................................................... 38
Figure 7. Scatterplot of somatic mass and total testes mass ................................................... 74
1
GENERAL INTRODUCTION
There are over 32,000 fish species known today, classified into approximately 50
taxonomic Orders and thousands of Families, making them the most widespread and
diverse group of vertebrates in the world (Froese and Pauly 2011). As a result of
such diversity, there is a wide variety of morphological and physiological adaptations
across groups (Rocha et al., 2008). Sexual selection and adaptation to habitat
combine to shape the reproductive morphology, physiology, and behaviour of fish
species (Reynolds 1996; Seehausen and Alphen 1999; Basilone et al., 2006). Sexual
selection occurs when an individual who possesses certain morphological or
behavioural traits is able to secure more mates or produce more offspring than others
(Darwin 1859; 1871; Andersson 1994). Males who possess traits that allow them to
produce more offspring are ‘selected’ as more reproductively ‘fit’ than other males in
the population (Darwin 1859; Carson 1987: Beaver et al., 2002). For example,
across species, fish that experience higher competition due to density or mating
system type invest more in spermatogenesis in order to increase their fitness, and
thus have a higher gonadosomatic index (GSI) than males in less competitive
systems (Stockley et al., 1997; Balshine et al., 2001; Awata et al., 2008).
Aside from mating systems, other biotic and abiotic factors can directly affect
reproductive fitness. Examples include water temperature (Jafri 1989; Lahnsteiner
and Mansour 2012), substrate characteristics (Sternecker et al., 2013), water flow
(Coma and Lasker 1997; Petersen et al., 2001), oxygen availability (Wu et al., 2003),
population density (Lee and Ban 1999), predation risk (Pavlová et al., 2010; Cothran
et al., 2012), and the quality and availability of food (Collins and Anderson 1999;
2
Okamoto et al., 2012). For example, the cycling of food abundance from low to high
is the only trigger for oocyte growth and maturation in the golden perch (Macquaria
ambigua), due to the unpredictable conditions of their natural habitat (Collins and
Anderson 1999). Similarly, the availability and abundance of prey species is an
important predictor of the amount of offspring produced by the black surfperch,
Embiotoca jacksoni, (Okamoto et al., 2012). In order to understand male
reproductive traits such as sperm morphometry and motility, I will first give an
overview of fish mating systems and modes of reproduction. Secondly, I will
describe the study species, and provide a review of the literature investigating the
relationships between male fish reproductive traits, their mating systems, and the
environment.
1.1 Mating systems, sexual selection, and fitness
A ‘mating system’ encompasses mode of reproduction, courtship behaviour, average
number of mates, and the extent of parental care in a species (Emlen and Oring
1977). The mating system which occurs when one male or female attempts to mate
with one other partner is called monogamy (Rocha et al., 2008). Polygamy occurs
when one or both members of a mating pair attempt to mate with more than one
partner (Rocha et al., 2008). However, it is now known that there is a distinction
between social and genetic monogamy (Rocha et al., 2008). Many fish species that
are socially monogamous are not genetically monogamous, because they mate
outside of their pair bond (Rocha et al., 2008). For example, the cichlid
Variabilichromis moorii, forms a social pair bond, and both parents guard a nest

3
together during the breeding period (Sturmbauer et al., 2008). Nonetheless, some
offspring from each nest are sired by outside males (Sefc et al., 2008). Another
example is the Australian Seahorse (Hippocampus subelongatus), which was
previously considered to ‘mate for life’ with one partner, and was found to have both
monogamous and polygamous males in one population (Kvarnemo et al., 2000).
Pre-copulatory sexual selection occurs when a male secures a mate through
interactions with females or other males (Andersson 1994; Møller and Ninni 1998).
Male fish characteristics that convey reproductive fitness to females can include
body size (Reynolds and Gross 1992) and carotenoid colouration (Evans et al.,
2003). In a laboratory courtship study, female guppies (Poecilia reticulata) selected
males with relatively longer total length (Reynolds and Gross 1992). In a later study,
female guppies selected male guppies with a relatively larger area of orange body
colouration (Evans et al., 2003). The honest signal hypothesis states that males that
possess traits attractive to females also produce more or larger offspring (Reynolds
and Gross 1992; Evans et al., 2003). Male guppies that were longer produced
relatively larger and faster growing offspring (Reynolds and Gross 1992), and more
colourful males fertilized more eggs when competing at equal sperm densities with
others under laboratory conditions (Evans et al., 2003).
Furthermore, male competition for mates in some species has resulted in the
development of alternate reproductive tactics (ARTs), defined by differences in
behaviour or physiology between males in one species (Henson and Warner 1997;
Fitzpatrick et al., 2007). The most common ART is the ‘sneaker’, which is a male
that fertilizes eggs guarded by a dominant male (Henson and Warner 1997; Leach
4
and Montgomerie 2000; Fitzpatrick et al., 2007). In the Bluegill Sunfish (Lepomis
macrochirus), for example, there are three different ARTs (Gross 1982). Smaller
males act as sneakers and do not build nests, intermediate sized males mimic females
to gain access to the nest and fertilize the eggs; finally, there are large dominant
males that build nests to attract females (Gross 1982). Some cichlid (Cichlidae)
species have ‘pirate’ males that, attempt to fertilize eggs by chasing the dominant
male away from the nest (Ota et al., 2012). In some salmonids (Salmonidae),
sneakers mature early, stay small, and do not build nests; whereas nest builders
mature slowly, grow larger, and do not sneak (Avise et al., 2002). In some species
such as the Bluehead Wrasse (Thalassoma bifasciatum), males switch from being a
sneaker to a dominant male as they grow larger (Hoffman et al., 1985).
Where attractiveness to females is a part of pre-copulatory sexual selection,
the competition between sperm to fertilize eggs is a form of post-copulatory sexual
selection (Parker 1970). The two types of sperm competition that may determine
how much energy males invest in sperm production are sperm competition risk and
sperm competition intensity (Byrne 2004). Males perceive sperm competition risk
when there is a chance that their partner has or will mate with other males, and sperm
competition intensity is associated with the number of males mating when males
always compete (Parker et al., 1996). Different species respond to sperm
competition risk and intensity in different ways, but many studies have found that
males will increase sperm production or expenditure (reviewed in Byrne 2004).
Aside from increasing sperm expenditure or production, sperm competition
can be a strong determinant of sperm quality traits such as morphometry and motility
5
(Parker 1998; Gage et al., 2004). Fish sperm morphometry varies across species and
reproductive strategies, but the basic design includes a rounded head, a midpiece that
contains mitochondria and adenosine triphosphate (ATP), and a flagellum, or tail, to
propel sperm forward (Thünken et al., 2007).
1.3 African cichlid evolution and mating systems
There are more than 3000 cichlid species across Central and South America, and
Africa (Kocher 2004). Africa contains the most cichlid species; these cichlids have
displayed massive adaptive radiations and rapid speciation, and have very diverse
and unique mating systems (Kornfield and Smith 2000). For these reasons, cichlids
have become a model system to study modes of evolution and sexual selection
(Kornfield and Smith 2000). Particularly, Lake Victoria has been home to about 500
species of haplochromine cichlids, which diversified in the last 15,000 years: one of
the most rapid radiations known today (Kaufman 1992).
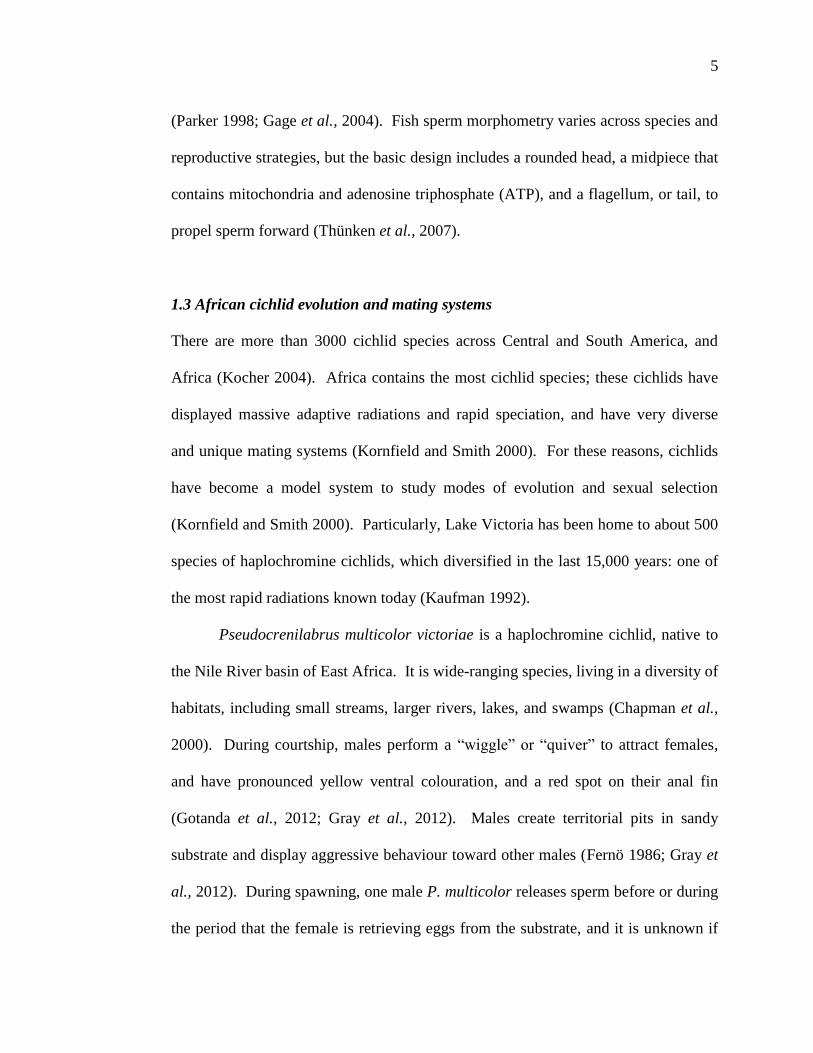
Pseudocrenilabrus multicolor victoriae is a haplochromine cichlid, native to
the Nile River basin of East Africa. It is wide-ranging species, living in a diversity of
habitats, including small streams, larger rivers, lakes, and swamps (Chapman et al.,
2000). During courtship, males perform a “wiggle” or “quiver” to attract females,
and have pronounced yellow ventral colouration, and a red spot on their anal fin
(Gotanda et al., 2012; Gray et al., 2012). Males create territorial pits in sandy
substrate and display aggressive behaviour toward other males (Fernö 1986; Gray et
al., 2012). During spawning, one male P. multicolor releases sperm before or during
the period that the female is retrieving eggs from the substrate, and it is unknown if
6
some fertilization occurs in the female’s mouth in some cases (Reardon and
Chapman 2010). Females incubate developing embryos in their mouths for 10-25
days, and then release the offspring as juveniles (Reardon and Chapman 2010).
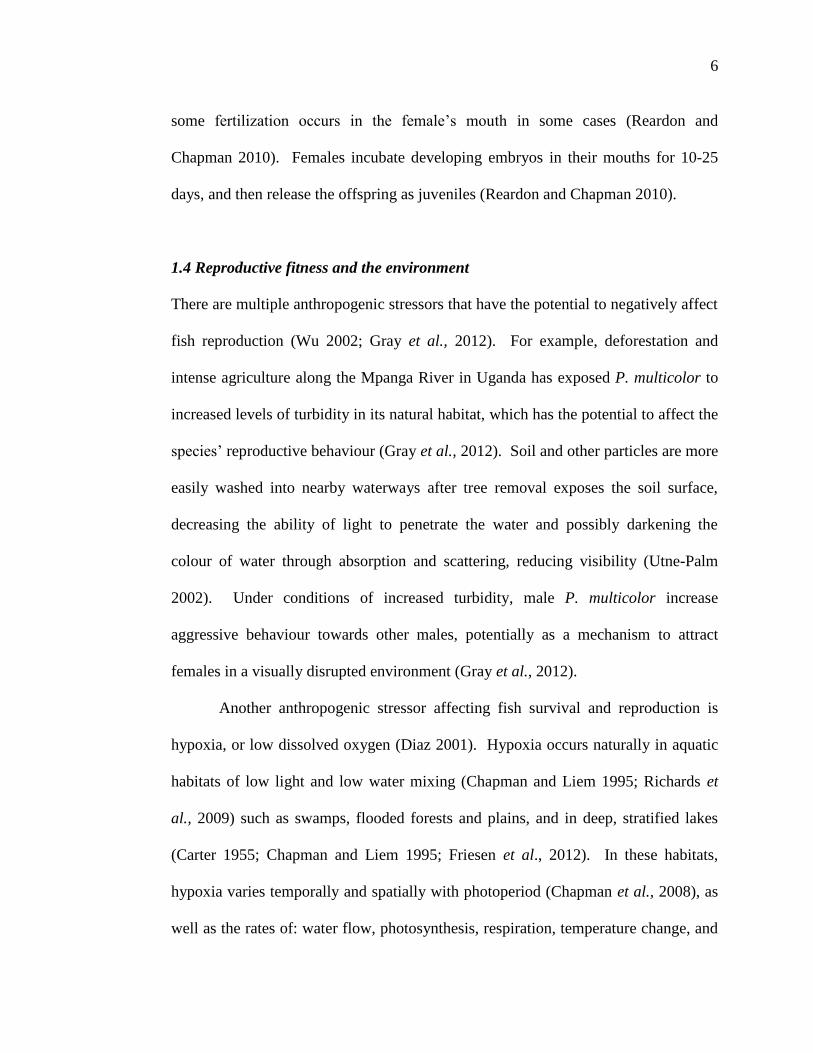
1.4 Reproductive fitness and the environment
There are multiple anthropogenic stressors that have the potential to negatively affect
fish reproduction (Wu 2002; Gray et al., 2012). For example, deforestation and
intense agriculture along the Mpanga River in Uganda has exposed P. multicolor to
increased levels of turbidity in its natural habitat, which has the potential to affect the
species’ reproductive behaviour (Gray et al., 2012). Soil and other particles are more
easily washed into nearby waterways after tree removal exposes the soil surface,
decreasing the ability of light to penetrate the water and possibly darkening the
colour of water through absorption and scattering, reducing visibility (Utne-Palm
2002). Under conditions of increased turbidity, male P. multicolor increase
aggressive behaviour towards other males, potentially as a mechanism to attract
females in a visually disrupted environment (Gray et al., 2012).
Another anthropogenic stressor affecting fish survival and reproduction is
hypoxia, or low dissolved oxygen (Diaz 2001). Hypoxia occurs naturally in aquatic
habitats of low light and low water mixing (Chapman and Liem 1995; Richards et
al., 2009) such as swamps, flooded forests and plains, and in deep, stratified lakes
(Carter 1955; Chapman and Liem 1995; Friesen et al., 2012). In these habitats,
hypoxia varies temporally and spatially with photoperiod (Chapman et al., 2008), as
well as the rates of: water flow, photosynthesis, respiration, temperature change, and

7
decomposition (Rabalais et al., 2010). However, the frequency and extent of
hypoxia is increasing globally, and is associated with the use of agricultural
fertilizers and the release of human waste runoff that leads to eutrophication (Diaz
2001; Rabalais et al., 2010). For example, nitrogen loading into the Mississippi
River from nearby corn crops has doubled in the last century, sometimes more than
tripling the size of the seasonal hypoxic “dead” zone in the Gulf of Mexico from
5000 km2 to up to 22,000 km
2 (Turner et al., 2008). The recent global increase in
hypoxia is resulting in mass fish kills and extirpations in these dead zones (Diaz
2001; Gray et al., 2002; Rabalais et al., 2010). Evidence suggests that hypoxia may
also be increasing and spreading due to global climate change (Richards et al., 2009;
Lyons et al., 2010).
Sufficient levels of dissolved oxygen (DO) are necessary for aerobic cellular
respiration and ATP production in fish (Richards et al., 2009). For most freshwater
species, the minimum concentration of oxygen in water that does not cause
physiological stress (known as the oxygen threshold) is between 5 and 6 mg L-1
,
whereas the threshold for most marine species is 2 mg L-1
(Landry et al., 2007;
Richards et al., 2009). Dissolved oxygen concentrations above average threshold
levels are generally considered to be normoxic, whereas concentrations below the
average threshold are generally considered hypoxic. The oxygen levels in P.
multicolor’s habitats can be highly variable or relatively stable depending on the site,
and range from as low as 0.4 mg L-1
in swamps (Friesen et al., 2012), and as high as
9.1 mg L-1
in streams.

8
1.5 General effects of hypoxia on fishes
When dissolved oxygen levels are below threshold concentrations, fish will use
relatively more energy to maintain homeostasis, causing them direct or indirect stress
(Heath 1995). Fish respond to hypoxia with behavioural, physiological, and
morphological changes (Chapman et al., 2002; Pollock et al., 2007; Crispo and
Chapman 2008). These responses will differ depending on the species and the
severity and duration of exposure (Timmerman and Chapman 2004; Martínez et al.
2006). Short term exposure has been shown to first induce behavioural changes such
as avoidance (Pihl et al., 1991), increased gill ventilation, or air surface respiration in
some species (Chapman et al., 2002; Timmerman and Chapman 2004), as well as
reduced activity levels (Schurmann and Steffensen 1994; Dalla Via et al., 1998).
Secondly, short term physiological responses include bradycardia, or slowing of the
heart rate (Milsom 2012), increased red blood cell production, hemoglobin levels, or
hematocrit levels, in an attempt to maintain oxygen levels or raise oxygen carrying
capacity in the blood (Chapman et al., 2002; Martínez et al., 2004; Timmerman and
Chapman 2004).
On the other hand, long-term exposure (i.e., months or multiple generations)
to hypoxia in P. multicolor has resulted in morphological changes like increased gill
size and surface area, as well as longer gill filaments (Chapman et al., 2000; 2002).
P. multicolor in hypoxic sites also have larger heads to accommodate larger gills
(Crispo and Chapman 2011), and smaller brains to reduce oxygen demands, relative
to populations living in normoxia (Chapman et al., 2008; Crispo and Chapman 2010;

9
2011). Long-term physiological responses can also include metabolic changes, such
as higher levels of liver lactate dehydrogenase (LDH) in species like the Gulf
Killifish, Fundulus grandis, (Martínez et al., 2009). However, results from studies
on a larger array of metabolic enzymes in species adapted to long term hypoxia such
as P. multicolor (Crocker et al., 2013a,b), the Gulf killifish, Fundulus grandis,
(Martínez et al., 2006) and the Common Carp, Cyprinus carpio, (Zhou et al., 2000)
have shown no significant trend in metabolic responses to hypoxia. This suggests
that some species can adapt metabolically to decreased oxygen, when living under
hypoxia for many generations (Zhou et al., 2000; Martínez et al., 2009; Crocker et
al., 2013 a, b).
1.6 Hypoxia and reproduction
High reproductive fitness depends on proper gonad development, high quality and
quantity of gametes, the ability to achieve fertilization, and the ability of the
fertilized eggs to hatch and survive (Wu et al., 2003). Gonad development begins
with the system of endocrine glands known as the hypothalamus– pituitary–gonadal
(HPG) axis (Thomas and Rahman 2009). A cascade of hormone stimulation and
generation occurs, beginning with gonadotropins and ending with ovulation and
spermiation, or the release of eggs and sperm (Thomas and Rahman 2009). In a
study on the Common Carp, short-term hypoxia exposure disrupted this pathway by
altering sex hormone function and impairing the quality of eggs and sperm (Wu et
al., 2003). Sex hormone levels, gonad size, total fertilization, and juvenile survival
rates were all reduced by 50% or more in carp exposed to hypoxia (1 mg O2 L-1
) for

10
eight weeks (Wu et al., 2003). After one month of laboratory induced hypoxia
exposure, Gulf Killifish were producing 50% less hormones than fish in normoxic
conditions (Landry et al., 2007). They also produced fewer eggs and had a stunted
spawning time (Landry et al., 2007). If severity or duration of hypoxia increase in
the Gulf Killifish natural habitat, it could have negative effects on the reproductive
capacity of populations in this species (Landry et al., 2007)
1.7 Male reproductive traits and the environment
Organisms experience life history trade-offs because they cannot produce sufficient
energy to maximize fitness in all physical or behavioural traits at once (Fisher 1930;
Trivers 1972; Skibiel et al., 2013). For example, fish must balance energy
investment between growth and reproduction, where higher investment in growth or
homeostasis represents energy that became unavailable to invest in sperm quality
(Taborsky 1998; Awata et al., 2008; Franssen et al., 2008). Therefore, reproductive
characteristics can vary between individuals in a population who have invested
energy differently (Burness et al., 2008). For example, male Whitefish (Coregonus
clupeaformis) that have a relatively higher Fulton’s body condition (K) before
spawning often develop larger gonads and larger ejaculates than males in lower
condition (Burness et al., 2008). However, at the time of spawning, these higher
condition males can exhibit reduced Fulton’s condition relative to males that did not
invest as much energy into initial gonad development (Burness et al., 2008).
Individual investment in gonads and ultimately spermatogenesis (the production of
sperm), can also depend on mating systems (Gage et al., 1995; Reynolds 1996).

11
Therefore, the level of competition and the availability of females can play a role in
how much a species invests in testes development (Rocha et al., 2008). For example,
sneaker Atlantic Salmon (Salmo salar) males, or parr, have been shown to have a
higher gonadosomatic index (GSI), a higher percent of motile sperm, and increased
sperm swimming longevity, relative to anadromous males (Gage et al., 1995).
Since testes development is energetically costly, testes asymmetry can be an
indicator of energetic trade-offs (Clarke 1995). The development of paired structures
and whether or not they are symmetrical in size and shape is dependent on an
organism’s genes, and on the environment (Clarke 1995; Harrod and Griffiths 2005).
Many species of fish, including whitefish (Coregonus spp.), salmonids, and
anchovies (Engraulidae family) display some level of testes asymmetry on a
population scale (reviewed in Harrod and Griffiths 2005). In a study of testes
asymmetry in a Whitefish population, males had a larger left testis, and that testis
also had a higher ATP content when controlling for gonad mass (Burness et. al.,
2008). Because ATP content is an indicator of energy production, this study showed
that testes asymmetry may have evolved as a means to produce good quality sperm in
the face of energy constraints in this species (Burness et al., 2008).
Sperm morphometry, velocity, and longevity are expected to affect sperm
quality, among other traits (Parker 1990; Gomendio and Roldan 1991). Overall,
sperm quality is determined by the ability to fertilize an egg and produce viable
offspring (Rurangwa et al., 2004). Additionally, studies have shown that fertilization
success can depend on motility, internal spermatocrit levels, pH, chemical
composition of seminal plasma, enzyme activity, and ATP production or

12
concentration, to name a few (reviewed in Rurangwa et al., 2004). However, in
externally fertilizing species, the velocity of sperm seems to be the main determinant
of fertilization success when sperm from different males are released at the same
time, from the same location (Levitan 2000; Gage et al., 2004). It has been
hypothesized that longer sperm flagella should have increased wave propagation
relative to shorter flagella, giving sperm with longer flagella more power to propel
sperm forward (Katz et al., 1989). Therefore, sperm with longer flagella should be
able to swim at higher velocities than sperm with shorter flagella (Gomendio and
Roldan 1991; 2008). In a study of 35 fish species from different taxonomic orders,
Ishijima (2012) found that the main determinant of sperm velocity was beat
frequency of the flagellum, and longer flagella produced more beats per unit time
than shorter flagella (Ishijima 2012). In support of these hypotheses, sperm velocity
has been correlated with flagellum length in some species (Tuset et al., 2008;
Simpson et al., 2014; Bakker et al., 2014). Simpson et al., (2014) found that in a
species of Rainbowfish (Melanotaenia australis), sperm that had longer flagella and
a shorter head relative to flagellum length swam faster than other sperm from the
same individual. Tuset et al., (2008) found that Rainbow Trout (Oncorhynchus
mykiss) displayed two different fertilization strategies within individuals, which
affected both morphometry and velocity. Sperm with longer flagella had a faster
velocity, and the trajectory of faster sperm was more linear than slower sperm (Tuset
et al., 2008).
The hypothesis that faster sperm having longer flagella was later amended to
include the idea that faster swimming sperm may face a trade-off with swimming

13
longevity, having a shorter time to find and fertilize an egg than slower sperm
(Gomendio and Roldan 1993; Ball and Parker 1996). Bakker et al., (2014) found
that Three-spined Stickleback sperm possessed intraspecific variation in flagellum
length, with longer sperm in one individual initially being more successful fertilizers,
but with a reduced swimming longevity. Sea urchin (Lytechinus variegatus) sperm
that swam faster fertilized more eggs, but also had lower swimming longevity than
slower sperm (Levitan 2000). A later study found that in sea urchin (Heliocidaris
erythrogramma) faster sperm have longer flagella (Fitzpatrick et al., 2010).
1.7 STUDY PROBLEM
Multiple studies confirm that the physiological and morphological responses to
hypoxia in P. multicolor are a combination of genetic and phenotypically plastic
responses, which vary across populations (Chapman et al., 2000; Chapman et al.,
2008; Crispo and Chapman 2008; Martínez et al., 2009; Crispo and Chapman 2010;
2011; Crocker et al., 2013 a, b). To date, several studies have investigated the
effects of hypoxia on female P. multicolor. In a laboratory study of P. multicolor
hormone levels, testosterone levels were higher in fish from hypoxic sites (Friesen et
al., 2012). Also, the ratio between testosterone and estradiol was higher in P.
multicolor from hypoxic sites (Friesen et al., 2012), suggesting that hypoxia disrupts
the enzyme mediated conversion of testosterone to estradiol (Landry et al., 2007).
Brooding females living under long-term hypoxia have shown a lower metabolic rate
during brooding, and a shorter brooding period by an average of 5 days (Reardon and
Chapman 2010). This indicates that they are compensating for reduced oxygen
14
availability by limiting their metabolic needs and by spending less time doing
energetically expensive activities (Reardon and Chapman 2010). Despite the great
importance of male reproductive capacity in the success of a species, few efforts
have explored a correlation between oxygen regimes and reproductive fitness in male
P. multicolor. Additionally, there are no studies that have assessed the relationship
between sperm morphometry and motility in this species. To my knowledge, only
one study has assessed the performance of sperm under hypoxic conditions from a
fish species that has naturally adapted to long-term hypoxia (Fitzpatrick et al., 2009).
It was found that sperm velocity of the hypoxia tolerant Plainfin Midshipman
(Porichthys notatus) was higher when measured under hypoxic conditions in the lab
relative to normoxic conditions (Fitzpatrick et al., 2009). This will be the first study
to assess differences in testes size, asymmetry, sperm morphometry and motility of a
single species across a wide range of habitat types.
1.8 STUDY QUESTION
This thesis focuses on the reproductive characteristics of male Pseudocrenilabrus
multicolor victoriae between two regions and across nine sites with different oxygen
regimes. My main question is: Do male P. multicolor show measurable population-
level differences in fitness correlates: body length and mass, testes size and
asymmetry, and sperm morphometry and velocity?

15
1.9 HYPOTHESIS AND PREDICTIONS
I hypothesized that male P. multicolor adapted to different habitats over many
generations would exhibit variation in reproductive traits. The following predictions
were tested:
(1) If hypoxia results in energetic stress, males from hypoxic sites should display
lower testes mass and greater testes asymmetry than males from normoxic
sites.
(2a) If sperm head shape affects sperm motility, sperm with more hydrodynamic
heads should also have a higher swimming velocity.
(2b) If sperm flagellum length affects sperm motility, males that have sperm with
longer flagella should also have sperm with a higher swimming velocity.
(3) If trade-offs between sperm swimming velocity and sperm swimming
longevity exist for this species, males with initially faster sperm performance
should display a more rapid decrease in sperm swimming velocity than sperm
with initially slower swimming velocities.
16
MATERIALS AND METHODS
2.1 Study sites
Pseudocrenilabrus multicolor victoriae were collected in June 2011 and June 2013
from nine sites in two regions of the Lake Victoria basin of Western Uganda: Lake
Nabugabo and the Mpanga River. Sites from the Mpanga region included Bunoga
and Bwera. Sites from the Nabugabo region included Lwamunda Swamp,
Lwamunda Pump House, Dead Duck Bay, Kazzi Lagoons, JJ Bay, Lake Kayanja,
and Ndyabusole stream (Figure 1). There is a great variation in dissolved oxygen
across sites (Table 1).
2.2 Data collection
Based long-term data from other studies, the above sites have been categorized as
normoxic, hypoxic, or seasonally fluctuating (Table 1). Bunoga has monthly DO
values ranging from 1.7 to 9.05 mg O2 L-1
(McNeil 2012; Crocker et al., 2013a).
This large variation in dissolved oxygen is associated with seasonal water levels
changes, where the lowest values are found during the rainy season, which causes
extensive runoff. For this reason, it has been categorized as seasonally fluctuating.
Dissolved oxygen content was also measured with a YSI multimeter (YSI Inc.,
Yellow Springs, OH, USA) at each site during each day of fish collection. Baited
minnow traps were set for 3 to 4 hours at each site and checked every 20 to 30
minutes. Males were transported to the field station, where they were euthanized
with an overdose of clove oil (1:10 clove oil: ethanol) and measured for total length
(LT± 1 mm), standard length (LS± 1mm), and total mass (MT± 0.1g). Testes were

17
removed and the mass of left and right testes were taken separately (TestL and TestR
± 0.001g). From total fish mass and the mass of the testes, somatic mass (MS ± 0.10
g) and testes asymmetry (TA) was calculated.
Somatic mass was calculated as follows:
MS = MT - GT
where MS represents somatic fish mass, MT represents total fish mass, and GT
represents total testes mass (g).
Testis asymmetry (TA) was calculated as follows:
TA = (TestL * TestR -1
)
where TestR and TestL represents right and left testis mass (g), respectively.
Although Fulton’s condition factor (K) is widely used as a fitness proxy for overall
fish health (McPherson 2010), it was not used in this study for several reasons. First,
the formula is based on the assumption that isometric growth occurs, which is not
documented in all species (Jones et al., 1999). Additionally, some authors have
argued that morphometric condition factors measure the shape of fish, rather than
their condition (McPherson 2010). P. multicolor show variation in body shape and
size across sites in response to hypoxia, and this variation reflects an increased head
and gill size in fish from hypoxic sites, rather than better condition (Chapman et al.,
2000; 2008). Finally, for some fish species, fish length alone has been the strongest
predictor of sperm velocity (Blukacz et al., 2010). Therefore, conclusions about
Fulton’s condition are not made.
18
2.2 Sperm swimming capacity and sperm morphometry
Due to the size of the testes, milt could not be obtained by abdominal pressure.
Instead, after the testes were weighed, approximately 2µL of milt (sperm and seminal
plasma) was obtained and placed in a small weighing boat and rapidly diluted with
rain water. Rain water was used to activate the sperm as standard protocol, since
having constant electric power can be difficult for the maintenance of buffer
solutions. A subsample of diluted sperm (4 µL) was placed on a pre-focused 1 mm
deep-welled Leja slide (Leja, The Netherlands). Sperm motility was recorded
initially for 1.5 minutes. However, after reviewing the initial videos, it was decided
to record all videos for a total of 45 seconds, since after this time there was a
dramatic reduction in sperm motility.
19
Figure 1. Sampling sites in Uganda, Africa where Pseudocrenilabrus multicolor victoriae were collected. (A) Sites in Mpanga
River Region. (B) Sites within the Nabugabo Region.
20
Table 1. Dissolved oxygen data of sampling sites in Uganda, Africa.
Site Characterization DO (mg O2 L
-1 ± 0.01) Type of reading
Mpanga Region
Bunoga1
fluctuating 7.53 ± 0.04 point in time average
Bwera2
hypoxic 0.6 ± 0.2 seasonal average
Nabugabo Region
Lwamunda swamp3
hypoxic
0.55 ± 0.03 point in time average
Pump House
hypoxic 4.27 - 5.00 surface
0.16 - 1.63 bottom
point in time range
Dead Duck Bay
hypoxic 0.19 - 0.79 surface
0.39 - 0.49 bottom
point in time range
Kazzi lagoons4
hypoxic 1.35 ± 0.75 monthly average
JJ Bay
hypoxic 2.92 - 3.21 surface
3.02 - 3.34 bottom
point in time range
Lake Kayanja5
normoxic 7.43 ± 0.12 point in time average
Ndyabusole stream normoxic 7.3 - 9.11 point in time range
1,3. (Crocker et al., 2013a). 2. (Friesen et al., 2012). 4. (Reardon and Chapman 2009) 5. (Crispo and Chapman 2008).

21
All videos were captured at 100 X magnification with an Infinity 1 USB digital
camera (resolution 800 x 600, an exposure of 8.3, 60 frames per second, and a gain
of 1.43) mounted on a Leica light microscope (Leica Microsystems, Wetzler,
Germany). Sperm swimming parameters (velocity and linearity) were analyzed
using a Ceros Animal Motility sperm analysis system (Version 12.3, Hamilton-
Thorne Biosciences, Massachusetts). The system was set as follows: number of
frames = 60, minimum contrast = 32, photometer = 1, and minimum cell size = 5
pixels. Sperm velocity and linearity per individual were analyzed for 10 sperm per
fish at three different post-activation times: 15, 25, and 30 seconds. The velocity
parameters recorded were curvilinear velocity (VCL), smooth-path velocity (VAP)
and straight-line velocity (VSL). VCL is a measure of the points along the sperm’s
full path over time, while VAP is a measure of an averaged path over time. VSL is a
measure of the straight line distance from the starting point and ending point over
time. Linearity is calculated as the percent of straight-line velocity (straight line
distance travelled over time) to curvilinear velocity (actual path travelled over time).
The higher the linearity value, the straighter the path travelled by the sperm.
Sperm longevity was calculated as final velocity as a percent of initial velocity for
each male as follows:
Longevity = (VAP15 *VAP30-1
)
A second subsample (2 µL) of the sperm was collected directly from the
testes using a micropipette and diluted into 200 µL of 30% formaldehyde solution
(Fisher Scientific, Ottawa, Ontario, Canada). Immediately after dilution, a sperm
smear was prepared. After 24 hours of drying, slides were stained by 10 minute

22
immersion in methanol, followed by air drying, followed by 7 minute immersion in
Eosin (Bonanno and Schulte-Hostedde 2009). Slides were then mounted with
Permount and coverslips (Fischer Scientific, Nepean, Ontario, Canada). Photo
records were taken from the smears using an Olympus CX41 light microscope
(Olympus Corporation of the Americas Inc., Center Valley Pennsylvania), using the
same camera described above. A minimum of 10 fully visible spermatozoa per
individual were photographed and measured using Image J software (National
Institutes of Health, Bethseda Maryland). I measured the following traits for each
spermatozoa: the length of the spermatozoa head from flagellum insertion point to
anterior tip (HL ± 0.01 µm), the width of the head perpendicular to length and from
the widest point (HW ± 0.01 µm) of the head, and the length of the flagellum (FL ±
0.01 µm). These traits were measured three times independently, and then averaged.
The midpiece was often not visible at this magnification and was not measured.
Additionally, sperm head length to head width (hydrodynamic) ratio, and
percent of head length to flagellum length were calculated to assess relationships
between morphometry and velocity (Humphries et al., 2008) as follows:.
Hydrodynamic ratio = HW : HL
Head length to flagellum length ratio = (HL * FL-1
) * 100
Where HW is head width, HL is head length, and FL is flagellum length (µm).
2.3 Statistical analyses
Statistical analyses were performed with Statistica (Statsoft Inc., 2013, Tulsa
Oklahoma, Version 12) and SPSS (IBM Corp., 2015, Armonk, NY, Version 23).
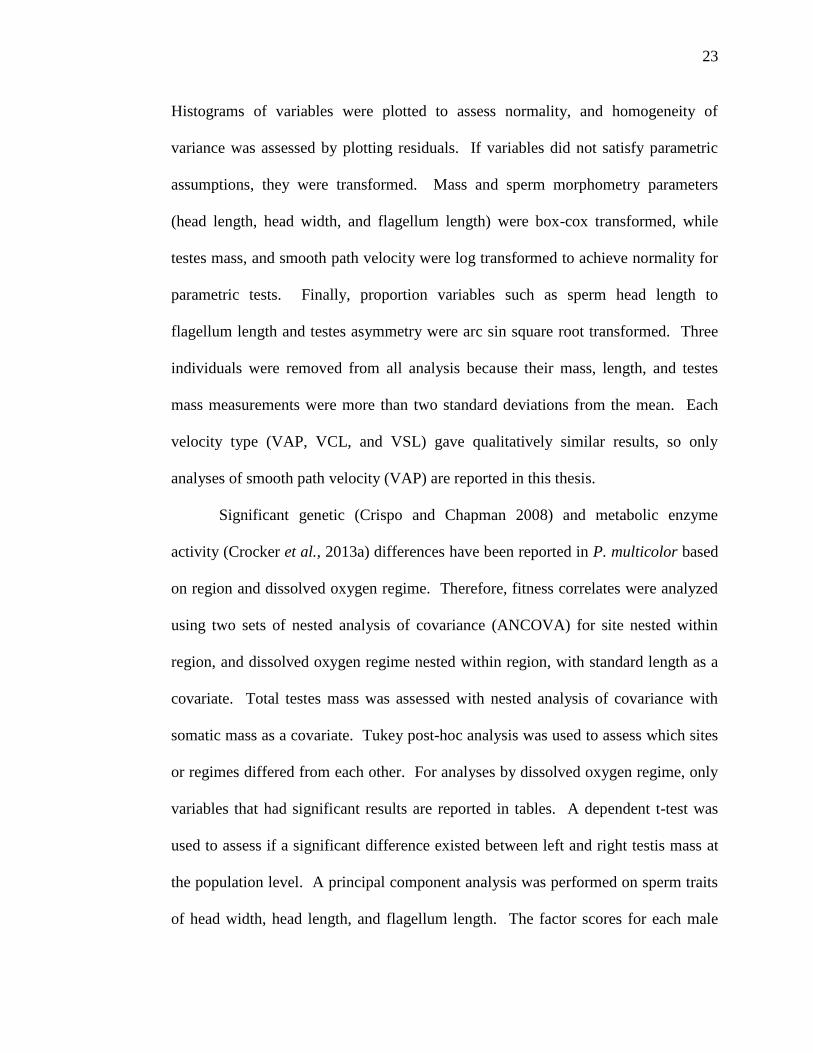
23
Histograms of variables were plotted to assess normality, and homogeneity of
variance was assessed by plotting residuals. If variables did not satisfy parametric
assumptions, they were transformed. Mass and sperm morphometry parameters
(head length, head width, and flagellum length) were box-cox transformed, while
testes mass, and smooth path velocity were log transformed to achieve normality for
parametric tests. Finally, proportion variables such as sperm head length to
flagellum length and testes asymmetry were arc sin square root transformed. Three
individuals were removed from all analysis because their mass, length, and testes
mass measurements were more than two standard deviations from the mean. Each
velocity type (VAP, VCL, and VSL) gave qualitatively similar results, so only
analyses of smooth path velocity (VAP) are reported in this thesis.
Significant genetic (Crispo and Chapman 2008) and metabolic enzyme
activity (Crocker et al., 2013a) differences have been reported in P. multicolor based
on region and dissolved oxygen regime. Therefore, fitness correlates were analyzed
using two sets of nested analysis of covariance (ANCOVA) for site nested within
region, and dissolved oxygen regime nested within region, with standard length as a
covariate. Total testes mass was assessed with nested analysis of covariance with
somatic mass as a covariate. Tukey post-hoc analysis was used to assess which sites
or regimes differed from each other. For analyses by dissolved oxygen regime, only
variables that had significant results are reported in tables. A dependent t-test was
used to assess if a significant difference existed between left and right testis mass at
the population level. A principal component analysis was performed on sperm traits
of head width, head length, and flagellum length. The factor scores for each male

24
from principal component one were used in nested ANCOVAs. Repeated measures
ANOVA with standard length as a covariate, and Bonferroni post-hoc tests were
used to assess significant differences in velocity at each time post-activation by site.
In order to test differences in longevity, velocity at 30 seconds were calculated as a
percent of velocity at 15 seconds for each male, and an ANCOVA with standard
length as a covariate was run by site. Hierarchical regression was used to investigate
the relationship between fish body traits, sperm morphometry traits, and sperm
motility. In order to control for body size, the parameters in the first level of the
model were standard length and somatic mass. The second level parameter was total
testes mass, and the third level included all three sperm morphometry measurements:
head length, head width, and flagellum length. The assumptions of multiple linear
regressions were tested by doing the following: plotting all parameters in scatterplots
to ensure that a linear relationship existed. In SPSS, the Durbin-Watson value was
attained to test the independence of residuals. Homoscedasticity was assessed by
plotting the studentized residuals against unstandardized predicted values. Data were
also analyzed for multicollinearity by ensuring that the tolerance value in the
multicollinearity statistics was below 0.9 for each trait. Testes asymmetry was not
used in this model because it expressed multicollinearity. Finally, a probability plot
was used to assess normality.
25
RESULTS
Analyses by site
3.1 General body morphometry
Male P. multicolor display variation in body morphometry, sperm morphometry, and
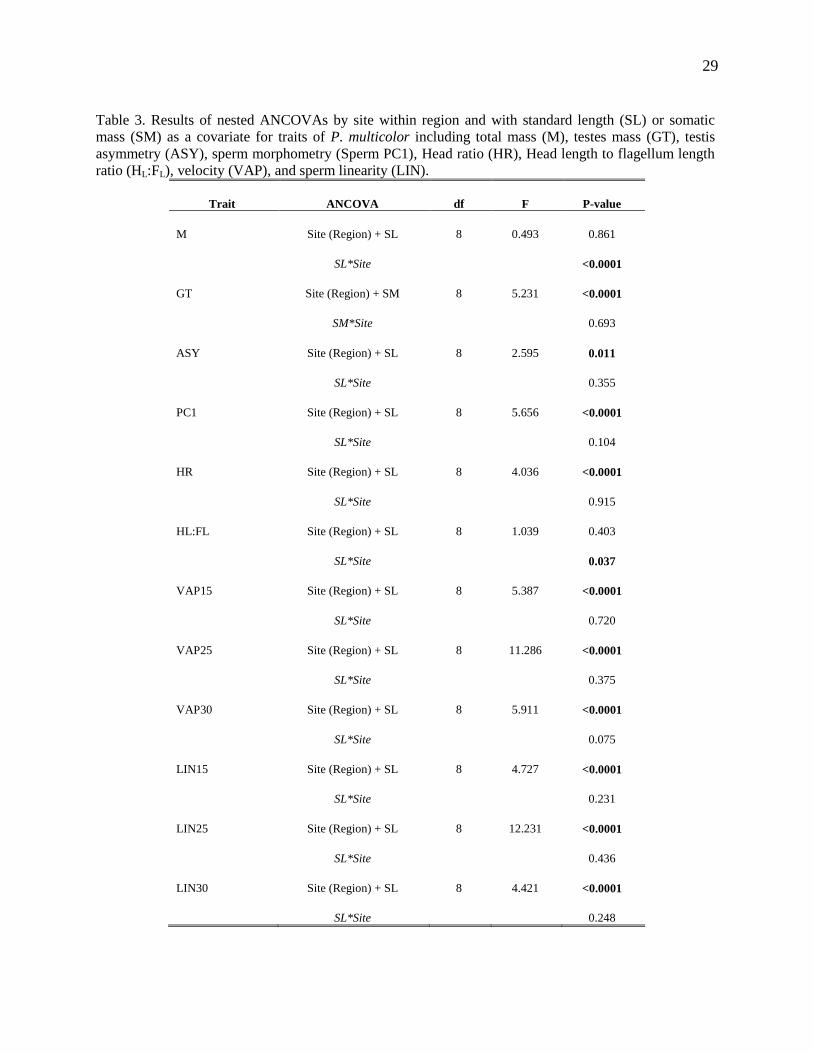
sperm motility across sites (Table 2). When controlling for fish size, each trait was
significantly different across sites (Table 3). There was an interaction between
standard length and site when assessing total mass. Pearson’s correlation for
standard length and total mass by site indicated that mass and length were highly
correlated (r = 0.9) at all sites except for Lwamunda Swamp, where it was much
lower (r = 0.86), indicating that fish were shorter in body length per unit mass in
Lwamunda swamp than at any other site (Appendix 1). There was also interaction
between site and standard length when assessing the HL:FL ratio (P=0.03, Table 3).
Pearson’s correlation for standard length and the HL:FL ratio by site indicated that
males from Bwera, Kazzi Lagoon, and Lwamunda Swamp had a positive relationship
between the ratio and standard length, whereas the rest of the sites had a negative
relationship (Appendix 1). This means that for most sites, as fish length increased,
sperm length also increased.
Pearson’s correlation between testes mass and somatic mass for all males
indicated a positive relationship between fish somatic mass and testes mass for this
species (r = 0.656, P<0.001; Appendix 2). Total testes mass of males from Bunoga
was higher than testes mass of males from Dead Duck Bay (P=0.005), Kayanja
(P=0.004), and Ndyabusole (P=0.0003). Similarly, testes mass of males from Bwera
26
was higher than those of Dead Duck Bay (P=0.01), Kayanja (P=0.01), and
Ndyabusole (P=0.001). Males from Lwamunda had higher testes mass than males
from Dead Duck Bay (P<0.0001), JJ Bay (P=0.02), Kayanja (P<0.0001), Kazzi
Lagoon (P=0.002), and Pump House (P=0.02). Ndyabusole males had lower testes
mass than males from Pump House (P=0.009) and Kazzi Lagoon (P=0.008). .
Males from JJ Bay had the lowest testes asymmetry and were different than
males from Bunoga (P=0.019), Bwera (P=0.003), and Pump House (P=0.003).
Lwamunda Swamp males had lower testes asymmetry than males from Pump House
(P=0.031) and Bwera (P=0.035). Ndyabusole fish had lower testes asymmetry than
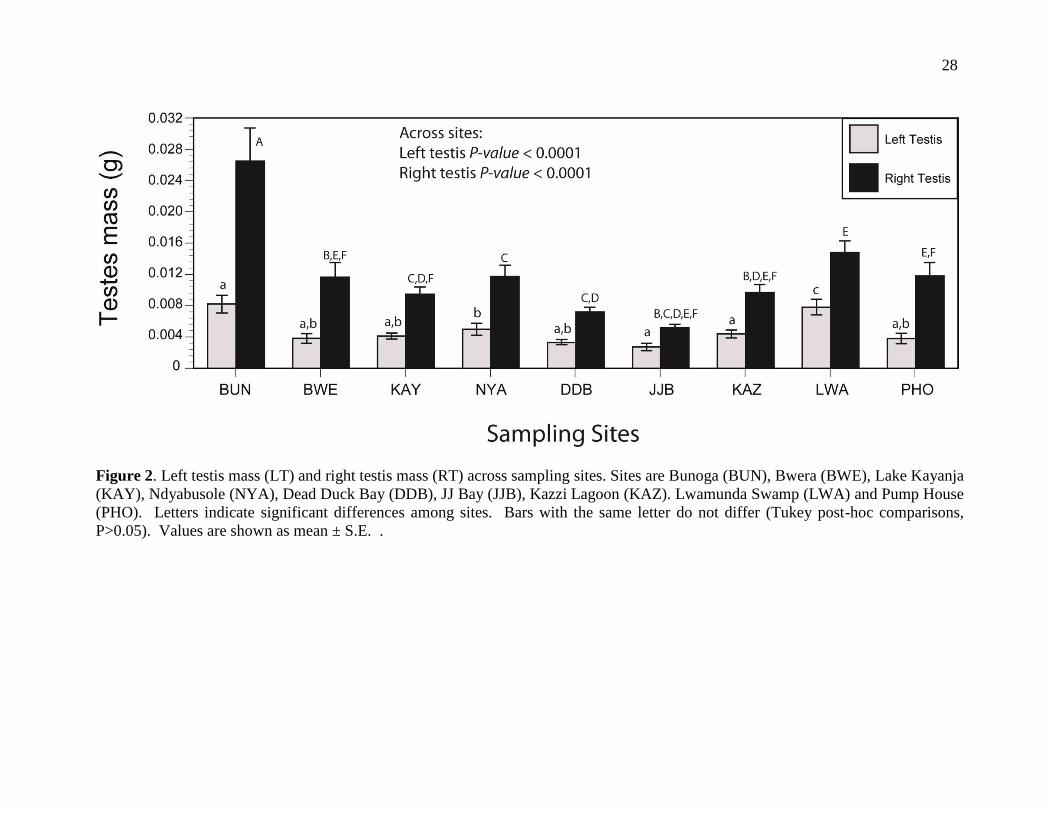
males from Pump House (P<0.0001). Dependent t-tests on left and right testes mass
were carried out for each site, and right testis mass was significantly larger than the
left testis within a site and across populations (P < 0.0001 for each site; Figure 2).
Pearson’s correlation was carried out on testes mass and asymmetry. As the
difference in mass between the left and right testis increased, so did total mass of the
testes (r = 0.73, P<0.0001).

27
Table 2. General morphological traits, sperm morphometry traits and sperm motility of P. multicolor sampled at nine sites in Uganda,
Africa. Variables are total length (TL), standard length (SL), total mass (mass), somatic mass (SM), left testis mass (LT), right testis
mass (RT), total testes mass (GT), testes asymmetry (ASY), sperm head length (HL), head width (HW), flagellum length (FL),
hydrodynamic ratio (HR), head length to flagellum length ratio (HL:FL), sperm velocity (VAP), and linearity of trajectory (LIN).
Values are mean ± S.E.
Body Morphology Bunoga Bwera Dead Duck Bay JJ Bay Kayanja Kazzi Lwamunda Nyabusole P House
TL (cm) 7.3 ± 0.309 6.3 ± 0.157 5.99 ± 0.160 5.32 ± 0.104 6.01 ± 0.195 6.12 ± 0.112 6.73 ± 0.146ae 7.07 ± 0.151 5.84 ± 0.145
SL (cm) 5.9 ± 0.249 5.1 ± 0.131 4.83 ± 0.134 4.25 ± 0.084 4.8 ± 0.162 4.95 ± 0.098 5.45 ± 0.116 5.65 ± 0.124 4.72 ± 0.125
Mass (g) 7.1 ± 0.730 4.2 ± 0.350 3.61 ± 0.281 2.45 ± 0.147 3.67 ± 0.335 3.82 ± 0.210 4.66 ± 0.316 5.6 ± 0.356 3.56 ± 0.297
SM (g) 7.0 ± 0.726 4.2 ± 0.360 4.08 ± 0.263 2.83 ± 0.178 4.26 ± 0.329 4.07 ± 0.204 4.39 ± 0.244 5.83 ± 0.355 4.23 ± 0.361
LT (g) 0.008 ± 0.001 0.004 ± 0.0006 0.003 ± 0.0002 0.003 ± 0.0005 0.004 ± 0.0004 0.004 ± 0.0005 0.008 ± 0.001 0.005 ± 0.0008 0.004 ± 0.0007
RT (g) 0.027 ± 0.004 0.012 ± 0.002 0.008 ± 0.0006 0.005 ± 0.0004 0.009 ± 0.0009 0.01 ± 0.001 0.015 ± 0.001 0.012 ± 0.001 0.012 ± 0.002
GT (g) 0.031 ± 0.005 0.016 ± 0.002 0.009 ± 0.0008 0.007 ± 0.0006 0.011 ± 0.001 0.013 ± 0.001 0.021 ± 0.002 0.015 ± 0.002 0.014 ± 0.002
ASY 0.369 ± 0.138 0.378 ± 0.214 0.492 ± 0.221 0.622 ± 0.238 0.475 ± 0.252 0.466 ± 0.195 0.513 ± 0.252 0.394 ± 0.190 0.336 ± 0.216
Sperm Morphology
HL 1.92 ± 0.048 2.01 ± 0.030 1.98 ± 0.030 1.9 ± 0.032 1.91 ± 0.042 1.98 ± 0.223 1.84 ± 0.034 1.91 ± 0.037 1.81 ± 0.020
HW 2.01 ± 0.035 2.18 ± 0.024 2.19 ± 0.037 2.11 ± 0.025 2.19 ± 0.050 2.22 ± 0.027 2.07 ± 0.034 2.15 ± 0.039 2.06 ± 0.023
FL 22.45 ± 0.344 21.74 ± 0.250 20.2 ± 0.187 20 ± 0.191 19.96 ± 0.201 20.26 ± 0.232 19.77 ± 0.233 20.78 ± 0.238 19.85 ± 0.155
HR 1.049 ± 0.019 1.087 ± 0.010 1.106 ± 0.011 1.124 ± 0.011 1.151 ± 0.02 1.125 ± 0.014 1.129 ± 0.007 1.124 ± 0.009 1.134 ± 0.008
HL:FL 0.086 ± 0.003 0.092 ± 0.002 0.099 ± 0.00 0.094 ± 0.002 0.096 ± 0.002 0.098 ± 0.002 0.093 ± 0.002 0.092 ± 0.002 0.092 ± 0.001
Sperm Motility
VAP15 (µm s-1) 37 ± 1.271 47.99 ± 2.833 55.37 ± 2.306 46.87 ± 3.759 47.79 ± 3.141 56.76 ± 1.875 43.89 ± 2.227 43.64 ± 2.166 62.6 ± 4.711
VAP25 (µm s-1) 34.09 ± 1.350 47.18 ± 2.735 55.72 ± 2.382 39.67 ± 2.637 47.72 ± 2.394 55.02 ± 2.111 42.59 ± 2.163 40.96 ± 1.926 63.29 ± 3.113
VAP30 (µm s-1) 34.13 ± 2.104 46.25 ± 2.658 53.57 ± 2.752 41.53 ± 3.047 47.17 ± 2.405 55.01 ± 2.340 44.32 ± 2.588 39.8 ± 1.957 55.28 ± 3.778
LIN 15 41.08 ± 1.254 48.03± 1.523 49.24 ± 1.29 46.46 ± 1.998 46.59 ± 1.435 52.5 ± 0.79 46.71 ± 1.293 47.38 ± 1.301 54.25 ± 2.553
LIN 25 39.47 ± 1.046 46.29 ± 1.558 51.20 ± 1.091 41.15 ± 1.338 47.24 ± 1.602 51.26 ± 1.007 47.04 ± 1.27 45.84 ± 1.02 55.83 ± 1.691
LIN 30 40.09 ± 1.214 48.18 ± 1.368 48.5 ± 1.767 43.22 ± 1.903 48.76 ± 1.358 50.79 ± 1.369 46.33 ± 1.466 46.03 ± 1.054 52.6 ± 2.732
28
Figure 2. Left testis mass (LT) and right testis mass (RT) across sampling sites. Sites are Bunoga (BUN), Bwera (BWE), Lake Kayanja
(KAY), Ndyabusole (NYA), Dead Duck Bay (DDB), JJ Bay (JJB), Kazzi Lagoon (KAZ). Lwamunda Swamp (LWA) and Pump House
(PHO). Letters indicate significant differences among sites. Bars with the same letter do not differ (Tukey post-hoc comparisons,
P>0.05). Values are shown as mean ± S.E. .
29
Table 3. Results of nested ANCOVAs by site within region and with standard length (SL) or somatic
mass (SM) as a covariate for traits of P. multicolor including total mass (M), testes mass (GT), testis
asymmetry (ASY), sperm morphometry (Sperm PC1), Head ratio (HR), Head length to flagellum length
ratio (HL:FL), velocity (VAP), and sperm linearity (LIN).
Trait ANCOVA df F P-value
M Site (Region) + SL 8 0.493 0.861
SL*Site <0.0001
GT Site (Region) + SM 8 5.231 <0.0001
SM*Site 0.693
ASY Site (Region) + SL 8 2.595 0.011
SL*Site 0.355
PC1 Site (Region) + SL 8 5.656 <0.0001
SL*Site 0.104
HR Site (Region) + SL 8 4.036 <0.0001
SL*Site 0.915
HL:FL Site (Region) + SL 8 1.039 0.403
SL*Site 0.037
VAP15 Site (Region) + SL 8 5.387 <0.0001
SL*Site 0.720
VAP25 Site (Region) + SL 8 11.286 <0.0001
SL*Site 0.375
VAP30 Site (Region) + SL 8 5.911 <0.0001
SL*Site 0.075
LIN15 Site (Region) + SL 8 4.727 <0.0001
SL*Site 0.231
LIN25 Site (Region) + SL 8 12.231 <0.0001
SL*Site 0.436
LIN30 Site (Region) + SL 8 4.421 <0.0001
SL*Site 0.248

30
3.2 Sperm morphometrics
P. multicolor sperm total length (the sum of head length and flagellum length) ranged
from 18.4 µm (min) to 26.4 µm (max), with an average of 22.4 µm (Figure 3). The
first component (PC1) of the principal component analysis (PCA) explained sixty
percent of the total variance (Table 4). An ANCOVA of PC1 scores across sites
showed variation in sperm shape across sites (Figure 4). Specifically, sperm from
males in Bunoga was similar to sperm from males in all other sites except Pump
House (P= 0.041); Bwera differed from JJBay (P=0.001), Lake Kayanja (P= 0.011),
Lwamunda Swamp and Pump House (P< 0.0001 respectively); Dead Duck Bay
sperm differed from JJBay (P=0.016), Lwamunda Swamp (P= 0.004) and Pump
House (P< 0.0001); JJBay differed from Kazzi Lagoon (P=0.002); Lake Kayanja
sperm differed from Kazzi lagoon (P=0.021) and Pump House (P=0.022); Kazzi
Lagoon differed from Lwamunda Swamp and Pump House (P<0.0001 respectively);
Lwamunda Swamp significantly differed from Ndysbusole (P=0.014) and finally,
Ndyabusole significantly differed from Pump House (P=0.002).

31
Figure 3. (1): Spermatozoa from Pump House, where the highest sperm velocity was
recorded, Head width = 1.8 µm, Flagellum length = 20.5 µm; and (2): Spermatozoa
from Bunoga, which had more hydrodynamic shape and the lowest velocity of all
sites. Head width = 1.5 µm, Flagellum length = 22.6 µm.
Table 4. Results of principal component analysis of sperm morphometry traits of P.
multicolor victoriae across sites.
Sperm trait PC1 Matrix PC1Scores
Head length 0.947 0.527
Head width 0.929 0.517
Flagellum length 0.019 0.107
Eigen value 1.795
Prp total var 59.84
32
Figure 4. Sperm PC1 scores for P. multicolor victoriae across sites. Bunoga (BUN),
Bwera (BWE), Lake Kayanja (KAY), Ndyabusole (NYA), Dead Duck Bay (DDB),
JJ Bay (JJB), Kazzi Lagoon (KAZ). Lwamunda Swamp (LWA) and Pump House
(PHO). Values are show as Mean ± S.E.
The hydrodynamic ratio (head length to head width), as well as the HL:FL
ratio (head length to flagellum length) also differed across sites (Table 3, Figure 5).
Fish with the lowest sperm head ratio (narrowest heads) were from Bunoga, and this
site was different from Dead Duck Bay (P=0.013), JJ Bay (P=0.002), Lake Kayanja
(P<0.0001), Kazzi Lagoon (P=0.005), Lwamunda Swamp (P=0.0001), Ndyabusole
(P=0.005) and Pump House (P=0.001). Bwera was not different from Bunoga, but
was different from Kayanja (P=0.0005), Kazzi Lagoon (P=0.036), Lwamunda

33
Swamp (P=0.015), Ndyabusole (P=0.044), and Pump House (P=0.009). Sperm
heads from males in Lake Kayanja were wider than sperm from males in Dead Duck
Bay (P=0.015). Fish with the highest ratio of sperm head length to flagellum length
(or the shortest sperm) were from Dead Duck Bay (Table 2). Fish with the lowest
ratio of head length to flagellum length (or the longest sperm) were from Bunoga
(Table 2).
Figure 5. Sperm morphometry variation of P. multicolor victoriae across sites. (A)
Hydrodynamic ratio and (B) Head length to flagellum length ratio (HH:FL). Bunoga
(BUN), Bwera (BWE), Lake Kayanja (KAY), Ndyabusole (NYA), Dead Duck Bay
(DDB), JJ Bay (JJB), Kazzi Lagoon (KAZ). Lwamunda Swamp (LWA) and Pump
House (PHO). Values are show as Mean ± S.E. .
3.3 Sperm motility
Sperm velocity at each post-activation time differed by site (Table 3). At 15 seconds
post-activation, males from Bunoga had slower sperm than males from Bwera
(P=0.012), Dead Duck Bay (P<0.0001), Kayanja (P=0.024), Kazzi Lagoon
(P<0.0001), and Pump House (P<0.0001). Males from Bwera had slower sperm than
males from Dead Duck Bay (P=0.047), Kazzi Lagoon (P=0.018), and Pump House

34
(P=0.007). Sperm from males in Dead Duck Bay were also faster than males from JJ
Bay (P=0.007), Lake Kayanja (P=0.044), Lwamunda Swamp (P=0.01), and
Ndyabusole (P=0.001). Sperm from JJ Bay males were slower than sperm from
Kazzi Lagoon males (P=0.002). Sperm from Lake Kayanja males were slower than
sperm from Kazzi Lagoon males (P=0.018). Males from Kazzi Lagoon had faster
sperm than males from Lwamunda Swamp (P=0.003) and Ndyabusole (P=0.0003).
Finally, Pump House sperm was faster than sperm from all other sites except for
Kazzi Lagoon and Dead Duck Bay: Bunoga (P<0.0001), Bwera (P=0.007), JJ Bay
(P=0.0008), Kayanja (P=0.006), Lwamunda (P=0.002), Ndyabusole (P=0.0003).
Some sperm velocity relationships changed from 15 to 25 seconds between
sites. At 25 seconds post-activation, sperm from males in Bunoga became slower
than sperm from Lwamunda (P=0.011) and Nyabusole males (P=0.028), leaving it
only not different from JJ Bay. Sperm from Bwera males became faster than sperm
from JJ Bay (P=0.019), and Nyabusole males (P=0.042). Sperm from Lake Kayanja
males also became faster than JJ Bay (P=0.006) and Ndyabusole (P=0.025). Finally,
at 30 seconds post-activation, sperm swimming velocities from most sites were no
longer different from one another. However, sperm from Bunoga males were slower
than all other sites except for JJ Bay (P=0.256) and Ndyabusole (P=0.108), and
Kazzi Lagoon sperm was significantly faster than Bwera (P=0.032), JJ Bay
(P<0.0001), and Kayanja (P=0.042); Dead Duck Bay sperm was faster than JJ Bay
(P=0.0003) and Ndyabusole (P=0.0009); and finally, Pump House sperm was
significantly faster than JJ Bay (P=0.001) and Ndyabusole sperm (P=0.004).
35
Sperm swimming velocity in all males decayed significantly over time
(within subjects repeated measures ANCOVA, F2,164=3.068, P=0.049). Bonferroni
post-hoc analysis showed that velocity at 15 seconds post-activation was
significantly different from velocity at both 25 (P=0.003) and 30 seconds
(P=<0.0001), and velocity at 25 seconds post-activation was different from 30
seconds post-activation (P=0.048). Sperm velocity decay also differed significantly
by site (Between subjects repeated measures ANCOVA, time F2,332=11.23,
P=0.00002). There was an interaction between sperm swimming velocity and fish
standard length (F2, 164 =4.054, P= 0.019), and between sperm swimming velocity and
site (F2, 328=2.085, P=0.009), indicating that fish from different sites and of different
sizes had different sperm swimming decay patterns (Figure 6). Longevity (the
difference in final velocity compared to initial velocity) did not differ by site (F= 8,174
=1.37, P=0.213).
Linearity was positively correlated with sperm swimming velocity at all post-
activation times (15 seconds r=0.89, P=<0.0001, 25 and 30 seconds r=0.86,
P=<0.0001), indicating that faster sperm travelled in a more linear trajectory.
Linearity of sperm trajectory differed across sites, with differences between sites
being qualitatively the same as velocity (Table 3). For example, the lowest linearity
was found in Bunoga males’ sperm, and the highest linearity was found in Pump
House males’ sperm at 15 seconds post-activation (Table 2). Linearity did not
change across sperm swimming decay times (Repeated measures ANCOVA,
F2,164=0.549, P=0.579), indicating that as sperm velocity decayed, their trajectory
patterns did not change. The HL:FL ratio was also positively correlated with sperm

36
swimming velocity at each time post-activation (VAP15 r=0.354 P=<0.0001, VAP25
r=0.402, P=<0.0001, VAP30 r=0.403, P=<0.0001). This indicates that as sperm
flagellum length decreases, velocity increases.
Results of hierarchical regression showed that Model 3 (which included
standard length, somatic mass, testes mass, sperm head length, head width, and
flagellum length) best explained sperm velocity and linearity (P=<0.0001; Table 5).
The individual variables that most strongly predicted both sperm velocity and
linearity at all times post-activation were sperm head width and sperm flagellum
length (Table 6). Sperm head width had a positive relationship with sperm velocity
and linearity, while sperm flagellum length had a negative relationship with sperm
velocity and linearity (Table 6). Additionally, fish somatic mass was a significant
and positive predictor for both velocity and linearity at 15 seconds post-activation.
Linearity at 25 seconds post-activation was also marginally significantly explained
by model 2 (total testes mass; Table 5).
Summary of results by site
In summary, total gonad mass differed by site. Males from Bunoga had the highest
testes mass, while males from JJ Bay had the lowest. The sperm head length to
flagellum length ratio (HL:FL) had a different relationship with fish size across sites,
indicating that smaller fish had a higher ratio, or smaller sperm. Furthermore, testes
asymmetry varied by site, with males from Bunoga having the highest asymmetry,
and males from JJ Bay having the lowest. Testes mass and testes asymmetry were
highly correlated, and as testes mass increased, so did testes asymmetry.
37
Sperm head size differed by site, with hypoxic sites having the widest heads,
and the fluctuating oxygen site Bunoga having the narrowest sperm heads. Velocity
of sperm at each postactivation time was lowest in males from Bunoga, and highest
in Pump House. Overall, sperm velocity decayed significantly over time. However,
there was no difference in longevity of sperm across sites. Faster sperm had a more
linear trajectory than slower sperm, and this relationship did not change over the 15
second postactivation period. The morphometric traits that best predicted velocity
and linearity were (in order of highest p-value to lowest p-value): sperm head width,
sperm flagellum length, somatic mass, and standard length.
Analyses by dissolved oxygen regime
Male traits showed variation across dissolved oxygen regimes (Table 7). There was
a significant interaction between fish somatic mass and oxygen regime when
assessing total testes mass across dissolved oxygen regimes (Table 8). Pearson’s
correlation showed that the fluctuating site had a much stronger relationship between
somatic mass and total testes mass than did the hypoxic and normoxic sites
(Appendix 1). Head ratio was highest in males from normoxic sites and was
significantly different from both fluctuating (P<0.0001) and normoxic (P=0.004)
regimes. Head ratio in males from fluctuating regimes was also significantly lower
than males from the hypoxic regime (P=0.004). Although the HL:FL ratio did not
differ across regimes, flagellum length was significantly different between all 3
regimes: fluctuating vs. hypoxic and normoxic (P<0.0001, respectively); and
hypoxic vs. normoxic (P=0.01).
38
Figure 6. Smooth path velocity of male P. multicolor sperm at different post-
activations times across sites. Bunoga (BUN), Bwera (BWE), Dead Duck Bay
(DDB), JJ Bay (JJB), Kayanja (KAY), Kazzi Lagoon (KAZ). Lwamunda (LWA),
Nyabusole (NYA), and Pump House (PHO). Values are shown as mean ± S.E. See
text for P-values of post-hoc tests.

39
Table. 5. Results of hierarchical linear regression of 3 models with velocity and linearity at each post-activation time. Model 1
contained only somatic mass and standard length, model 2 added total testes mass, and model 3 added sperm head length, head width,
and flagellum length. Table shows R2, adjusted R
2, R square change (or the total proportion explained by that model alone), and the
significance of each model. Model 1 included somatic mass and standard length, model 2 added total testes mass, and model 3 added
sperm morphometry: head length, head width, and flagellum length
VAP15 R2 Adj R
2 R
2 Ch P-value LIN15 R2 Adj R
2 R
2 Ch P-value
Model 1 0.046 0.032 0.046 0.039 Model 1 0.046 0.033 0.046 0.038
Model 2 0.048 0.027 0.002 0.577 Model 2 0.05 0.029 0.003 0.483
Model 3 0.289 0.257 0.241 <0.0001 Model 3 0.231 0.197 0.182 <0.0001
VAP25
R2
Adj R2
R2
Ch
P-value
LIN25
R2
Adj R2
R2
Ch
P-value
Model 1 0.019 0.005 0.019 0.269 Model 1 0.008 -0.007 0.008 0.585
Model 2 0.038 0.017 0.019 0.102 Model 2 0.035 0.014 0.028 0.049
Model 3 0.379 0.351 0.341 <0.0001 Model 3 0.297 0.266 0.262 <0.0001
VAP30
R2
Adj R2
R2
Ch
P-value
LIN30
R2
Adj R2
R2
Ch
P-value
Model 1 0.049 0.035 0.049 0.032 Model 1 0.035 0.021 0.035 0.086
Model 2 0.05 0.03 0.002 0.598 Model 2 0.035 0.014 0 0.926
Model 3 0.382 0.354 0.331 <0.0001 Model 3 0.261 0.228 0.226 <0.0001

40
Table 6. Beta coefficients and P-value of each variable from Model 3 for velocity
and linearity at each post-activation time.
VAP15 VAP25 VAP30
Var Coeff P-value Coeff P-value Coeff P-value
SL -0.455 0.062 0.058 0.8 -0.196 0.386
SM 0.495 0.032 0.091 0.671 0.163 0.445
GT 0.013 0.906 -0.11 0.28 0.027 0.789
HH -0.027 0.824 -0.125 0.27 -0.126 0.263
HW 0.458 0.0002 0.637 <0.0001 0.645 <0.0001
FL -0.282 0.0004 -0.277 0.0002 -0.239 0.001
LIN15
LIN25
LIN30
Var Coeff P-value Coeff P-value Coeff P-value
SL -0.525 0.039 0.346 0.153 -0.391 0.115
SM 0.65 0.007 -0.129 0.571 0.406 0.082
GT -0.017 0.877 -0.168 0.122 0.063 0.57
HH -0.045 0.719 -0.164 0.174 -0.151 0.221
HW 0.382 0.003 0.527 <0.0001 0.549 <0.0001
FL -0.287 0.001 -0.333 <0.0001 -0.225 0.006
There was a significant interaction between fish standard length and oxygen
regime when assessing velocity and linearity at 30 seconds post-activation (Table 8).
Correlation between standard length and velocity at 30s post-activation showed that
males in hypoxic sites had a slight positive relationship between velocity and
standard length, whereas males in normoxic and fluctuating regimes had a very
strong negative relationship between velocity and standard length (Appendix 1).
Qualitatively similar results were shown for linearity of sperm trajectory (Appendix
1). Velocity at 15 seconds post-activation was highest in males from hypoxic sites
and significantly different from sperm velocity of males from fluctuating regime
(P=0.002) but was not different from sperm velocity of males in normoxic sites

41
(P=0.06). Velocity of sperm from males from normoxic sites was also not
significantly different from sperm velocity in the fluctuating regime (P=0.06). At 25
seconds post-activation, males from the fluctuating regime had a sperm velocity that
was significantly slower than both hypoxic (P<0.0001) and normoxic (P=0.007)
males. Males from hypoxic and normoxic regimes still did not differ significantly in
sperm velocity (P=0.05). Longevity (the difference in final velocity compared to
initial velocity) did not differ by site (P=0.175). Longevity did not differ by
dissolved oxygen regime (F 3,174 = 0.337, P=0.779). Linearity at 15 seconds post-
activation was highest in males from hypoxic sites, differing significantly from males
in fluctuating regimes (P<0.0001) but not from males in normoxic regime (P=0.186).
Males from fluctuating regimes were also significantly less linear than males in
normoxic regimes (P=0.005). At 25 seconds post-activation, the relationship
between regimes remained qualitatively the same.
In summary, total testes mass and somatic mass had a stronger relationship in
the fluctuating regime versus the normoxic and hypoxic regimes. Head width of
sperm was highest in hypoxic sites, and flagellum length was lowest in hypoxic sites.
Although sperm from hypoxic sites had the highest mean velocity, sperm velocity
and linearity did not differ between hypoxic and normoxic regimes. However, males
from the fluctuating regime had significantly slower sperm than males from the
hypoxic regime. Longevity did not differ across regimes.

42
Table 7. General morphological traits, sperm morphometry traits and sperm motility
of P. multicolor by oxygen regime. Variables are total length (TL), standard length
(SL), total mass (mass), somatic mass (SM), left testis mass (LT), right testis mass
(RT), total testes mass (GT), testes asymmetry (ASY), sperm head length (HL), head
width (HW), flagellum length (FL), hydrodynamic ratio (HR), head length to
flagellum length ratio (HL:FL), sperm velocity (VAP), and linearity of trajectory
(LIN). Values are mean ± S.E
Trait Fluctuatin
g
Hypoxic Normoxic
Body morphometry
TL (cm) 7.319 ± 0.309 6.065± 0.064 6.505 ± 0.142
SL (cm) 5.9 ± 0.249 4.894 ± 0.054 5.191± 0.116
Mass (g) 7.048± 0.73 3.728 ± 0.121 4.561± 0.27
SM 7.017 ± 0.726 4.036 ± 0.119 5.032± 0.262
LT 0.008 ± 0.001 0.005 ± 0.0003 0.005± 0.0004
RT 0.027 ± 0.004 0.011 ± 0.0006 0.011± 0.0009
GT 0.031 ± 0.005 0.014 ± 0.0008 0.013± 0.001
ASY 0.369 ± 0.037 0.457 ± 0.02 0.434 ± 0.0333
Sperm morphometry
HL 1.924 ± 0.048 1.911 ± 0.013 1.909 ± 0.0282
HW 2.008 ± 0.035 2.134 ± 0.013 2.168 ± 0.032
FL 22.453 ± 0.344 20.253 ± 0.099 20.334 ± 0.162
HR 1.049 ± 0.019 1.119 ± 0.004 1.139 ± 0.011
HL :FL 0.0861 ± 0.003 0.095 ± 0.0007 0.094 ± 0.001
Sperm motility
VAP15 36.999 ± 1.271 51.682 ± 1.301 45.355 ± 1.821
VAP25 34.094 ± 1.350 49.715 ± 1.242 43.751 ± 1.566
VAP30 34.134 ± 2.104 48.977 ± 1.246 42.848 ± 1.596
LIN15 41.079 ± 1.254 49.213 ± 0.676 47.051 ± 0.959
LIN25 39.471 ± 1.046 48.169 ± 0.673 46.419 ± 0.888
LIN30 40.092 ± 1.214 47.912 ± 0.743 47.161 ± 0.850

43
Table 8. Results of nested ANCOVAs by dissolved oxygen regime within region
and with standard length as a covariate for traits of P. multicolor including testes
mass (GT), flagellum length (FL), sperm head ratio (HR), velocity (VAP), and
sperm linearity (LIN).
Trait ANCOVA df F P-value
GT D.O. Regime (Region) + SM 3 0.138 0.670
SM*Site
<0.0001
FL D.O. Regime (Region) + SL 3 24.9 <0.0001
SL*Site
0.084
HR D.O. Regime (Region) + SL 3 9.222 <0.0001
SL*Site
0.937
VAP15 D.O. Regime (Region) + SL 3 5.686 0.001
SL*Site
0.601
VAP25 D.O. Regime (Region) + SL 3 7.267 0.0001
SL*Site 0.060
VAP30 D.O. Regime (Region) + SL 3 2.761 0.044
SL*Site 0.002
LIN15 D.O. Regime (Region) + SL 3 6.167 0.001
SL*Site 0.754
LIN25 D.O. Regime (Region) + SL 3 7.587 0.001
SL*Site 0.206
LIN30 D.O. Regime (Region) + SL 3 2.199 0.09
SL*Site 0.031
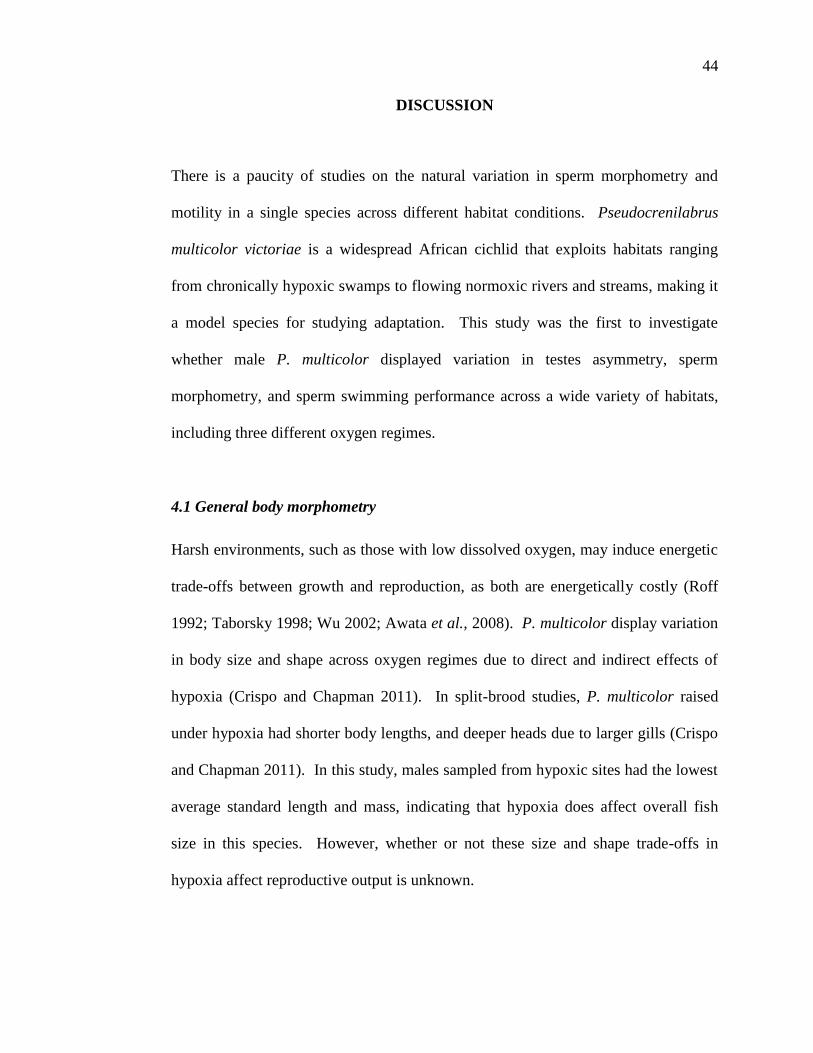
44
DISCUSSION
There is a paucity of studies on the natural variation in sperm morphometry and
motility in a single species across different habitat conditions. Pseudocrenilabrus
multicolor victoriae is a widespread African cichlid that exploits habitats ranging
from chronically hypoxic swamps to flowing normoxic rivers and streams, making it
a model species for studying adaptation. This study was the first to investigate
whether male P. multicolor displayed variation in testes asymmetry, sperm
morphometry, and sperm swimming performance across a wide variety of habitats,
including three different oxygen regimes.
4.1 General body morphometry
Harsh environments, such as those with low dissolved oxygen, may induce energetic
trade-offs between growth and reproduction, as both are energetically costly (Roff
1992; Taborsky 1998; Wu 2002; Awata et al., 2008). P. multicolor display variation
in body size and shape across oxygen regimes due to direct and indirect effects of
hypoxia (Crispo and Chapman 2011). In split-brood studies, P. multicolor raised
under hypoxia had shorter body lengths, and deeper heads due to larger gills (Crispo
and Chapman 2011). In this study, males sampled from hypoxic sites had the lowest
average standard length and mass, indicating that hypoxia does affect overall fish
size in this species. However, whether or not these size and shape trade-offs in
hypoxia affect reproductive output is unknown.

45
Testes mass relative to body mass is a measure of reproductive investment in
males because larger testes are often correlated with higher sperm production (Møller
and Birkhead 1989; Stockley et al., 1997). Fish species that are adapted to hypoxia
can face reproductive stress that reduces testes mass under low dissolved oxygen
levels (Wu et al., 2003, Thomas et al., 2006; Landry et al., 2007; Thomas and
Rahman 2009). For example, male Atlantic Croaker collected from hypoxic and
normoxic estuaries were compared, and males from hypoxic sites had reduced
testosterone levels, reduced testes development, and a reduced production of sperm
relative to males from normoxia (Thomas et al., 2007). Additionally, males from the
species Barbus neumayeri living in the same drainage in Africa as P. multicolor
displayed the same pattern, with males in hypoxic regimes having a reduced GSI
relative to males from normoxic regimes (Martínez et al., 2015). Therefore, I
expected P. multicolor to have relatively lower testes mass under hypoxia. However,
there was no clear difference in the testes mass to somatic mass relationship across
sites or oxygen regimes, and larger fish had larger testes regardless of site of origin.
This study was the first to show that P. multicolor display directional testes
asymmetry on a population scale, where the right testis was approximately double
the size of the left across all populations sampled. Testes asymmetry has been seen
in other species and groups, including birds (reviewed in Møller 1994), amphibians,
reptiles, and mammals (reviewed in Yu 1998), although it is usually the left testis
that is larger than the right (Jamieson et al., 2007). In birds, testes asymmetry has
been correlated with better male condition (Møller 1994). However, in fish, the
degree of testes asymmetry has been shown to be related to environmental stressors
46
(Clarke 1995; Sopinka et al., 2012). For example, testes asymmetry in the Plainfin
Midshipman was shown to be greatest in individuals exposed to dissolved
contaminants (Sopinka et al., 2012). I predicted that testes asymmetry would be
higher in the hypoxic regime due to energetic stress caused by hypoxia. However,
the level of asymmetry was not significantly different across oxygen regimes,
indicating that hypoxia does not affect asymmetry in this species. Another reason for
increased asymmetry in fish can be mating competition, as was seen in whitefish
(Burness et al., 2008). In this study, the level of asymmetry was not significantly
correlated with sperm morphometry or velocity, but was strongly correlated to total
testes mass. In this species, larger males had larger testes. This relationship between
size and asymmetry may indicate that larger males face a trade-off between growth
and the production of viable or competitive sperm in both testes (Burness et al.,
2008). Additionally, the highest asymmetry was seen in males from Bunoga, and
these males had the slowest sperm velocity of all sites, indicating that asymmetry
may also be related to energetic stress in this species. Future studies should directly
assess whether testes asymmetry is associated with energetic trade-offs, and whether
the level of asymmetry is related to sperm performance.
4.2 Sperm morphometry and motility
Sperm morphometry varied across sites and dissolved oxygen regimes, and there was
a trend in sperm size and shape based on regime. Sperm from hypoxic sites had the
widest and roundest sperm heads and the shortest flagella. On average, sperm
velocity was also highest in the hypoxic regime. It was noted in this study that the
47
wider heads of the sperm in hypoxic sites often allowed for a larger midpiece vesicle,
which became visually discernible from the head and flagellum in many sperm from
hypoxic sites (results not shown). Therefore, this author hypothesizes that the strong
positive relationship between sperm head width and sperm velocity in this study may
be due to a higher ATP content in larger midpieces. Some studies have linked sperm
ATP content or the size of the midpiece (which contains ATP) to sperm velocity or
sperm fertilization success (Vladic et al., 2002). Atlantic Salmon sperm fertilization
success was positively correlated with ATP stores (Vladic et al., 2002). In
Sticklebacks, both the flagellum length and the size of the midpiece were positively
correlated with fertilization success (Bakker et al., 2014). Future studies should
assess midpiece size and its relationship with ATP content, as well as the
relationships between sperm velocity, fertilization success, and ATP content in this
species. If ATP content is positively correlated with sperm velocity, variation in
sperm swimming performance may be explained by variation in ATP content across
populations. Another possibility is that sperm are facing a trade-off between
morphometry and energy storage ability, where the more narrow headed sperm have
less room for ATP stores.
Sperm from the fluctuating regime had a more hydrodynamic (narrow) head
shape than all other sites. Humphries et al., (2008) hypothesized that a more
hydrodynamic head shape (narrower) would be beneficial to reduce drag for
swimming sperm. The fluctuating site is also a river, and previous studies have
shown that sperm performance and fertilization success can be negatively affected by
turbulent or flowing water (Petersen et al., 2001). For example, in observations of

48
natural spawning activities of coral species, the levels of water flow had a dramatic
effect on fertilization success, with higher flow reducing fertilization success (Coma
and Lasker 1997). In a study on Bluehead Wrasse, sperm performance under
increased water velocity was also negatively correlated with fertilization success
(Petersen et al., 2001). If males in flowing water have adapted to have narrower
sperm heads to better swim through flowing water, there may be a trade-off between
hydrodynamic shape and ATP stores in these sperm. Future studies should assess the
effect of water flow on sperm morphometry and performance in this species.
Furthermore, males from the fluctuating site had the longest flagella. Males in the
Bunoga and Bwera sites, which are close to each other in the Mpanga region had
similar sperm flagellum lengths, but Bwera males had wider sperm heads like all
other hypoxic sites, and a significantly higher sperm swimming velocity than Bunoga
males. This suggests that sperm head width is a better indicator than flagellum
length of sperm swimming performance in this species (Roff 1992; Taborsky 1998;
Wu 2002; Awata et al., 2008).
Humphries et al., (2008) hypothesized that the ratio of head size to flagellum
length would be an important factor to analyze in studies attempting to link sperm
morphometry to sperm velocity, reasoning that the thrust force of the flagellum
would need to overcome the drag forces of the head. Interestingly, the head length of
sperm was not related to sperm velocity, and flagellum length alone was negatively
correlated with velocity. However, the head length to flagellum length ratio was
positively correlated with velocity. This may indicate that a ratio of head and
49
flagellum size may be a better indicator of sperm swimming performance than
singular morphometry measures in this species (Humphries et al., 2008).
Additionally, sperm performance may be affected by the mating system of
this fish. The occurrence of sneakers, or males with competitively better sperm, is
also a possibility. It is now known that genetic monogamy is scarce in fish mating
systems (reviewed in Rocha et al., 2008), indicating that competition induced sexual
selection of sperm traits may be acting on males in socially monogamous systems
such as P. multicolor’s. It should be noted that some males collected in this study
resembled females in body colouration and size (results not shown), meaning that
some of the smaller males lacked the pronounced red spot on their anal fin and
yellow ventral colouration, yet they had viable sperm. Future studies should assess
the mating system of this species in a natural setting, and assess whether sneakers or
female mimics exist.
Sperm velocity may be just as important in non-competitive or less
competitive mating systems if overall sperm longevity is low (Gomendio and Roldan
1993; Ball and Parker 1996). Indeed, most externally fertilizing species have a very
short period of progressive motility after activation (Ishijima et al., 1998). If faster
sperm require more ATP than slower sperm, it may be beneficial to maintain
intraspecific variation in sperm fertilization tactics to increase longevity of some
sperm, as was seen in Rainbowfish (Simpson et al., 2014), and Rainbow Trout (Tuset
et al., 2008).
Sperm swimming velocities at each post-activation time were variable across
sites. The males with the fastest sperm were from three hypoxic sites: Pump House,
50
Dead Duck Bay, and Kazzi Lagoon. The sperm from these sites remained the fastest
across all three post-activation times, indicating that sperm from hypoxic sites have
higher motility in this species. Additionally, decay did not occur more quickly in
faster sperm. Different authors suggest that faster swimming sperm may face a trade-
off with longevity, having a shorter time to find and fertilize an egg than slower
sperm (Gomendio and Roldan 1993; Ball and Parker 1996), nevertheless, the pattern
does not seem to be widespread across species. In Bluegill Sunfish (Lepomis
macrochirus), it was found that sneaker males had faster sperm with a reduced
longevity than parental male sperm (Burness et al., 2004). Several studies of
Atlantic Salmon did not find a link between flagellum length and velocity, or a trade-
off between velocity and longevity (Vladic et al., 2002; Gage et al., 2004). In the
Redside Dace (Clinostomus elongatus), a promiscuous species, there was a
significant positive relationship between flagellum length and sperm velocity, but no
trade-off between velocity and longevity was found (Pitcher et al., 2009a). Finally,
Fitzpatrick and collaborators (2009) did not find a common pattern between sperm
swimming velocity and sperm longevity across 25 different cichlid species.
Another alternative explanation for why males in hypoxic sites have
relatively faster sperm than males from other habitats may be that males from
hypoxic sites face a reproduction and life span trade-off as an adaptation to hypoxia.
In general, costs to fish under hypoxia increase as body size increases, because there
is less gill surface area to absorb oxygen and more internal volume that requires it
(Pauly 1981; Reardon and Chapman 2012). If a hypoxic environment favours smaller
fish that are able to mature faster, there may be more energy available in these males
51
to invest in sperm performance over larger or slower growing fish (Enberg et al.,
2012). However, this is a difficult hypothesis to confirm because of so many
confounding variables, such as nutrition and predation rates in natural settings
(Enberg et al., 2012). Furthermore, no work has been done on size and age at
maturity in this species to date. Future studies should assess whether any maturity vs.
lifespan trade-offs exist, and whether or not sperm velocity is related to age in this
species.
Finally, some logistic limitations of studying sperm swimming performance
outside of a more controlled lab setting must be addressed in future studies. As
mentioned in the methods section, sperm were assessed for swimming performance
using water taken from a rain barrel, and dissolved oxygen levels were the same for
all sperm swimming trials, despite site of origin. Future studies should conduct the
same sperm performance assessments under both hypoxic and normoxic dissolved
oxygen levels to assess if a difference in velocity results from the immediate oxygen
levels available to the sperm. For example, Fitzpatrick et al., (2009) found that
Plainfin midshipman sperm from hypoxic sites performed better under hypoxic
conditions, although the exact reason for that was not found.
4.3 Other effects on energy in fishes in natural settings
Aside from dissolved oxygen levels, there are multiple environmental conditions that
may cause variation in body size and gonad mass across and within regimes,
including food availability (Collins and Anderson 1999; Donelson et al., 2010),
predation risk (Pavlová et al., 2010), and the level of mating competition (Gage
52
1995; Long and Montgomerie 2006). The effect of food availability on reproductive
output has been studied more often in female fish (Collins and Anderson 1999;
Donelson et al., 2010), as eggs require more energy to produce than sperm (Jonsson
et al., 1991). In some species such as the White Crappie (Pomoxis annularis), a
lowered diet negatively affected egg production in females but did not affect sperm
production in males (Bunnell et al., 2007). Predation risk may also vary across
habitats for P. multicolor, with less risk for fish in the hypoxic sites, as most predator
species are larger and not as hypoxia tolerant as smaller species (Chapman et al.,
2002; Reid et al., 2013). Lwamunda Swamp has some of the most consistent and
chronic hypoxia of all sites sampled, and males were also relatively larger in this site
than males in other hypoxic sites. Fish may benefit from a lack of predators in this
swamp by an increase in foraging ability, allowing them to invest more energy in
growth and reproduction (Cerri and Fraser 1983; Pavlová et al., 2010; Martínez et
al., 2015). A lack of predators in a more hypoxic environment may also mean that
there is a higher density of P. multicolor in those sites, increasing the level of mating
competition for males as observed in other fish species (Gage et al., 1995; Long and
Montgomerie 2006). Little is known about reproduction in P. multicolor outside of
laboratory studies and observational data from many decades ago. Variation in testes
mass between and within species often reflects the level of mating competition (Gage
1994; Stockley et al., 1997). For example, in a laboratory study assessing whether
male cichlids of the species Julidochromis transcriptus adjust testes size in relation
to perceived competition levels, it was found that males placed in competition with
other males developed relatively heavier testes than males placed in a monogamous

53
system (Awata et al., 2008). Future studies should assess whether competition for
mates varies across habitats for this species, and whether relative testes mass varies
with competition.

54
CONCLUSION
Pseudocrenilabrus multicolor victoriae is a hypoxia tolerant species that displays
morphological and physiological differences across sites with different dissolved
oxygen levels (Chapman et al., 2000; Chapman et al., 2008; Crispo and Chapman
2008; Martínez et al., 2009; Crispo and Chapman 2010; 2011; Crocker et al., 2013 a,
b). Similar to other traits in P. multicolor, it was found that sperm morphometry and
velocity varied across habitats. An overall pattern was observed, where males from
Bunoga, which is a seasonally fluctuating river, were the largest, and had the slowest
swimming sperm of all sites. Males investing more energy into overall growth may
face a trade-off between body size and sperm performance in this species. For
example, some fish species, such as Coho Salmon (Oncorhynchus kisutch), face
energetic trade-offs between secondary sexual characteristics and sperm performance
(Pitcher et al., 2009b), where those investing more in body traits had sperm with a
slower velocity. Males from Bunoga were also unique in that they displayed the
greatest inter-individual variation of traits, as seen in the standard error of each trait
mean. Similar trends were seen in enzyme levels for P. multicolor from the Mpanga
region, where there was a greater amount of variation in enzyme levels between
individuals in Bunoga than between individuals from sites in Nabugabo (Crocker et
al., 2012a). The seasonally fluctuating oxygen levels in this river site may induce
more variation in male phenotypes, as physiological needs change on a seasonal
basis (Crocker et al., 2012a). Finally, male P. multicolor invests energy into
carotenoid body colouration to attract females during courtship (Fernö 1986).
Hence, future studies should assess if males are facing a trade-off between
55
investment in colouration and investment in sperm traits. A split-brood study that
assesses testes mass, testes asymmetry, and sperm morphometry and motility in a
range of dissolved oxygen levels and levels of water flow is recommended.
Hypoxia’s effects on neuroendocrine reproductive pathways in fish are
becoming clearer as research progresses (Wu et al., 2003; Martínez et al., 2004;
2006; Thomas and Rahman 2009). It is important to collect baseline information on
the physiological adaptations of fish species currently thriving in hypoxic habitats, as
they could become threatened in the future (Wikelski and Cooke 2006).
Additionally, the negative effects of globally rising hypoxia may be harder to detect
in hypoxia tolerant species without baseline information, as they do not always
display obvious or significant physiological changes (Zhou et al., 2000; Martínez et
al., 2006; Crocker et al., 2013a). Alternatively, because this species is living at
much lower levels of oxygen than most freshwater species can survive in (0.6 versus
5 -6 mg O2 L-1
), smaller changes in temperature and dissolved oxygen levels may
have more of a detrimental effect on this and other tropical freshwater species living
in similar conditions. Due to their habitat distribution, P. multicolor is a great model
to study the effects of hypoxia, which can be extrapolated to other freshwater species
worldwide. By looking at the fish general morphometry, sperm shape and size and
sperm motility from a variety of sites with different habitat characteristics,
researchers can find relationships between habitat and reproductive characteristics
that engender further important research.
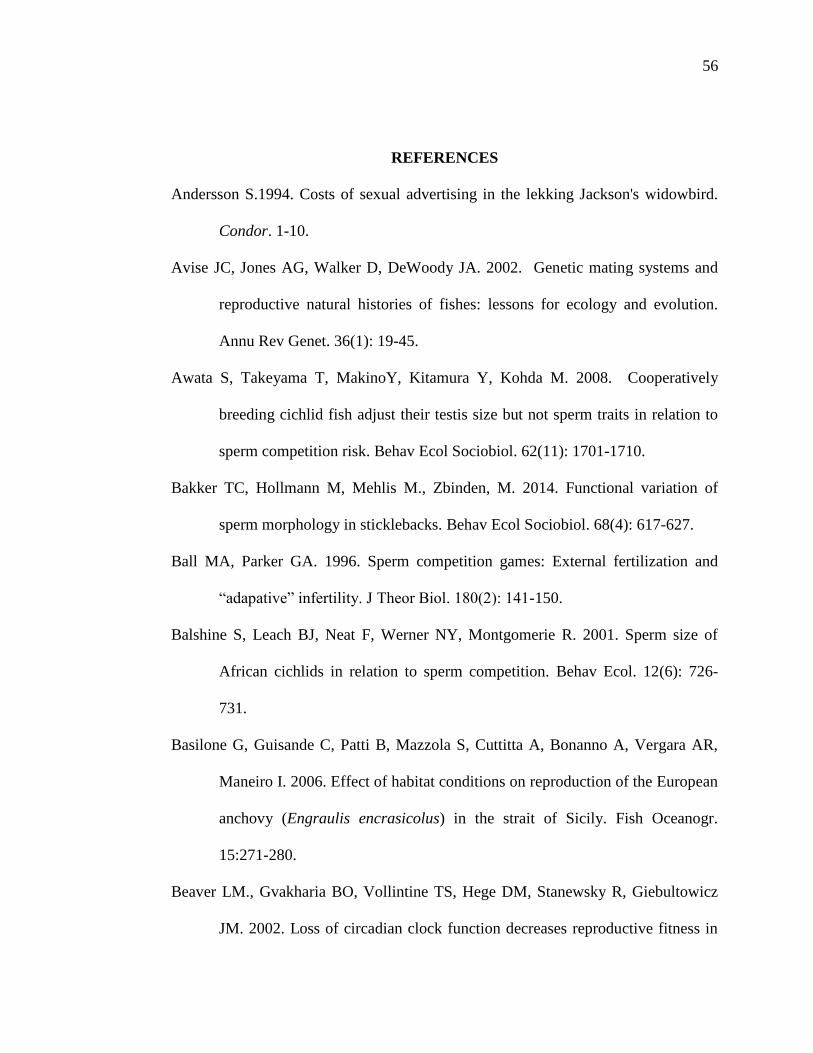
56
REFERENCES
Andersson S.1994. Costs of sexual advertising in the lekking Jackson's widowbird.
Condor. 1-10.
Avise JC, Jones AG, Walker D, DeWoody JA. 2002. Genetic mating systems and
reproductive natural histories of fishes: lessons for ecology and evolution.
Annu Rev Genet. 36(1): 19-45.
Awata S, Takeyama T, MakinoY, Kitamura Y, Kohda M. 2008. Cooperatively
breeding cichlid fish adjust their testis size but not sperm traits in relation to
sperm competition risk. Behav Ecol Sociobiol. 62(11): 1701-1710.
Bakker TC, Hollmann M, Mehlis M., Zbinden, M. 2014. Functional variation of
sperm morphology in sticklebacks. Behav Ecol Sociobiol. 68(4): 617-627.
Ball MA, Parker GA. 1996. Sperm competition games: External fertilization and
“adapative” infertility. J Theor Biol. 180(2): 141-150.
Balshine S, Leach BJ, Neat F, Werner NY, Montgomerie R. 2001. Sperm size of
African cichlids in relation to sperm competition. Behav Ecol. 12(6): 726-
731.
Basilone G, Guisande C, Patti B, Mazzola S, Cuttitta A, Bonanno A, Vergara AR,
Maneiro I. 2006. Effect of habitat conditions on reproduction of the European
anchovy (Engraulis encrasicolus) in the strait of Sicily. Fish Oceanogr.
15:271-280.
Beaver LM., Gvakharia BO, Vollintine TS, Hege DM, Stanewsky R, Giebultowicz
JM. 2002. Loss of circadian clock function decreases reproductive fitness in
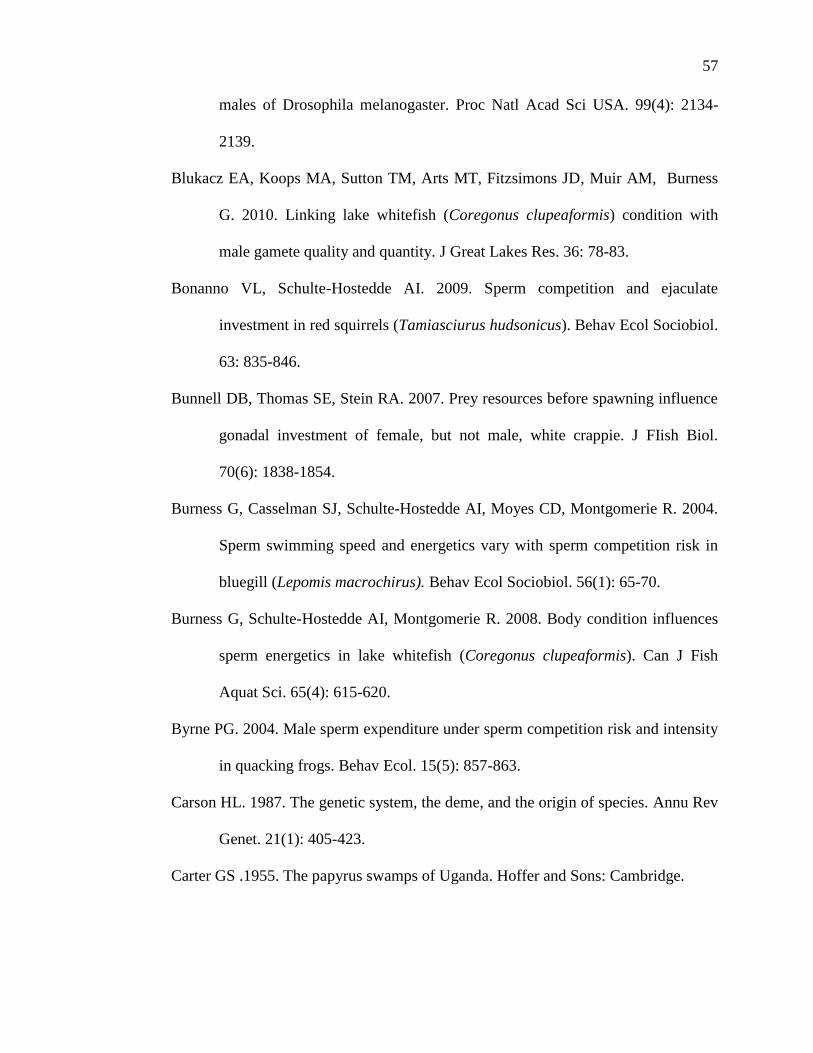
57
males of Drosophila melanogaster. Proc Natl Acad Sci USA. 99(4): 2134-
2139.
Blukacz EA, Koops MA, Sutton TM, Arts MT, Fitzsimons JD, Muir AM, Burness
G. 2010. Linking lake whitefish (Coregonus clupeaformis) condition with
male gamete quality and quantity. J Great Lakes Res. 36: 78-83.
Bonanno VL, Schulte-Hostedde AI. 2009. Sperm competition and ejaculate
investment in red squirrels (Tamiasciurus hudsonicus). Behav Ecol Sociobiol.
63: 835-846.
Bunnell DB, Thomas SE, Stein RA. 2007. Prey resources before spawning influence
gonadal investment of female, but not male, white crappie. J FIish Biol.
70(6): 1838-1854.
Burness G, Casselman SJ, Schulte-Hostedde AI, Moyes CD, Montgomerie R. 2004.
Sperm swimming speed and energetics vary with sperm competition risk in
bluegill (Lepomis macrochirus). Behav Ecol Sociobiol. 56(1): 65-70.
Burness G, Schulte-Hostedde AI, Montgomerie R. 2008. Body condition influences
sperm energetics in lake whitefish (Coregonus clupeaformis). Can J Fish
Aquat Sci. 65(4): 615-620.
Byrne PG. 2004. Male sperm expenditure under sperm competition risk and intensity
in quacking frogs. Behav Ecol. 15(5): 857-863.
Carson HL. 1987. The genetic system, the deme, and the origin of species. Annu Rev
Genet. 21(1): 405-423.
Carter GS .1955. The papyrus swamps of Uganda. Hoffer and Sons: Cambridge.

58
Cerri RD, Fraser DF. 1983. Predation and risk in foraging minnows: balancing
conflicting demands. American Naturalist. 552-561.
Chapman LJ, Liem MK. 1995. Papyrus swamps and the respiratory ecology of
Barbus neumayeri. Environ Biol Fish. 44:183-197.
Chapman LJ, Galis F, Shinn J, 2000. Phenotypic plasticity and the possible role of
genetic assimilation: Hypoxia-induced trade-offs in the morphological traits
of an African cichlid. Ecol Lett. 3: 387–393.
Chapman LJ, Chapman CA, Nordlie FG, Rosenberger AE. 2002. Physiological
refugia: swamps, hypoxia tolerance, and maintenance of fish biodiversity in
the Lake Victoria region. Comp Biochem Phys A. 133:421-437.
Chapman LJ, Albert J, Galis F. 2008. Developmental plasticity, genetic
differentiation, and hypoxia-induced trade-offs in an African cichlid fish.
Open Evolution Journal 2: 75–88.
Clarke GM.1995. Relationships between developmental stability and fitness:
application for conservation biology. Conserv Biol. 9(1): 18-24.
Coleman SW, Jones AG. 2011. Patterns of multiple paternity and maternity in fishes.
Biol J Linn Soc. 103(4): 735-760.
Collins AL, Anderson TA. 1999. The role of food availability in regulating
reproductive development in female golden perch. J Fish Biol. 55(1): 94-104.
Coma R, Lasker HR. 1997. Small-scale heterogeneity of fertilization success in a
broadcast spawning octocoral. J Exp Mar Biol Ecol. 214(1): 107-120.
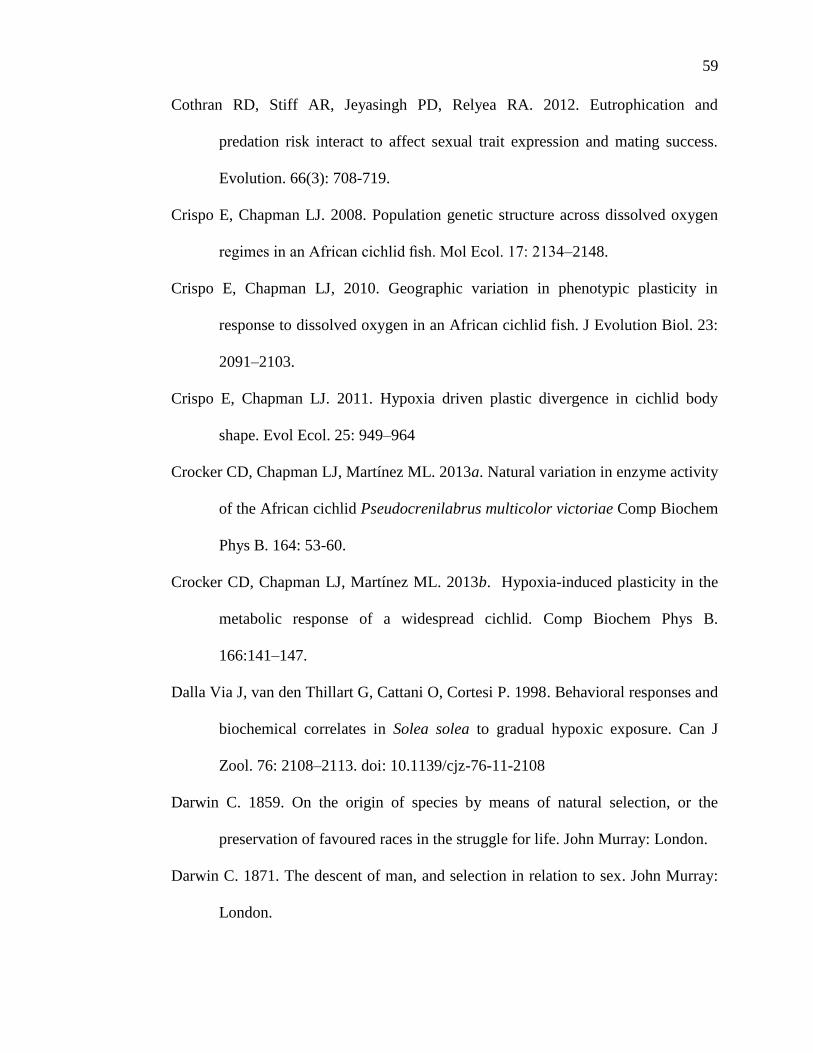
59
Cothran RD, Stiff AR, Jeyasingh PD, Relyea RA. 2012. Eutrophication and
predation risk interact to affect sexual trait expression and mating success.
Evolution. 66(3): 708-719.
Crispo E, Chapman LJ. 2008. Population genetic structure across dissolved oxygen
regimes in an African cichlid fish. Mol Ecol. 17: 2134–2148.
Crispo E, Chapman LJ, 2010. Geographic variation in phenotypic plasticity in
response to dissolved oxygen in an African cichlid fish. J Evolution Biol. 23:
2091–2103.
Crispo E, Chapman LJ. 2011. Hypoxia driven plastic divergence in cichlid body
shape. Evol Ecol. 25: 949–964
Crocker CD, Chapman LJ, Martínez ML. 2013a. Natural variation in enzyme activity
of the African cichlid Pseudocrenilabrus multicolor victoriae Comp Biochem
Phys B. 164: 53-60.
Crocker CD, Chapman LJ, Martínez ML. 2013b. Hypoxia-induced plasticity in the
metabolic response of a widespread cichlid. Comp Biochem Phys B.
166:141–147.
Dalla Via J, van den Thillart G, Cattani O, Cortesi P. 1998. Behavioral responses and
biochemical correlates in Solea solea to gradual hypoxic exposure. Can J
Zool. 76: 2108–2113. doi: 10.1139/cjz-76-11-2108
Darwin C. 1859. On the origin of species by means of natural selection, or the
preservation of favoured races in the struggle for life. John Murray: London.
Darwin C. 1871. The descent of man, and selection in relation to sex. John Murray:
London.

60
Diaz RJ. 2001. Overview of hypoxia around the world. J Environ Qual. 30:275-281.
Donelson, JM, Munday PL, McCormick MI, Pankhurst NW, Pankhurst PM. 2010.
Effects of elevated water temperature and food availability on the
reproductive performance of a coral reef fish. Mar Ecol Prog Ser. 401: 233-
243.
Emlen ST, Oring LW.1977. Ecology, sexual selection, and the evolution of mating
systems. Science. 197(4300): 215-223.
Enberg K, Jørgensen C, Dunlop ES, Varpe Ø, Boukal DS, Baulier L, Eliassen S,
Heino M. 2012. Fishing‐induced evolution of growth: concepts, mechanisms
and the empirical evidence. Marine Ecol. 33(1): 1-25.
ESHRE. 1998. Guidelines on the application of CASA technology in the analysis of
spermatozoa. ESHRE Andrology Special Interest Group. European Society
for Human Reproduction and Embryology. Hum Reprod. 13: 142-145.
Evans JP, Zane L, Francescato S, Pilastro A. 2003. Directional postcopulatory sexual
selection revealed by artificial insemination. Nature. 421(6921): 360-363.
Fernö A. 1986. The aggressive behavior between territorial Pseudocrenilabrus
multicolor (Pisces, Cichlidae) with unlimited or only visual contact. Behav
Process. 13: 353–366.
Fisher RA. 1930. The genetical theory of natural selection. Claredon Press: Oxford.
Fitzpatrick JL, Desjardins JK, Milligan N, Montgomerie R, Balshine S. 2007.
Reproductive-tactic-specific variation in sperm swimming speeds in a shell-
brooding cichlid. Biol Reprod. 77(2): 280-284.

61
Fitzpatrick JL, Craig PM, Bucking C, Balshine S, Wood, CM, McClelland GB. 2009.
Sperm performance under hypoxic conditions in the intertidal fish Porichthys
notatus. Can J Zool. 87(5): 464-469.
Fitzpatrick JL, Garcia-Gonzalez, F., & Evans, J. P. 2010. Linking sperm length and
velocity: the importance of intramale variation. Biol Lett. 6(6), 797-799.
Franssen CM, Tobler M, Riesch R. De León FJG. Tiedmann R, Schlupp I, Plath M.
2008. Sperm production in an extremophile fish, the cave molly (Poecilia
Mexicana). Aquat Ecol. 42(4): 685-692.
Friesen CN, Aubin-Horth N, Chapman LJ. 2012. The effect of hypoxia on sex
hormones in an African cichlid Pseudocrenilabrus multicolor victoriae.
Comp Biochem Physiol A. 162: 22–30.
Froese, R, Pauly D. Eds. 2011. FishBase. World Wide Web electronic publication.
www.fishbase.org.
Gage MJG. 1994. Associations between body size, mating pattern, testis size and
sperm lengths across butterflies. Proc R Soc Lond B: 258, 247–254.
Gage MJG. Stockley P, Parker GA. 1995. Effects of alternative male mating
strategies on characteristics of sperm production in the Atlantic salmon
(Salmo salar): theoretical and empirical investigations. Phil Trans R Soc B.
350: 391–399. doi:10.1098/rstb.1995.0173.
Gage MJG, MacFarlane CP, Yeates S 2004. Spermatozoal traits and sperm
competition in Atlantic salmon: Relative sperm velocity is the primary
determinant of fertilization success. Curr Biol.14: 44–47.

62
Gomendio M, Roldan ER. 1991. Sperm size and sperm competition in mammals.
Proc R Soc Lond B 243: 181-185.
Gomendio M, Roldan ER. 1993. Coevolution between male ejaculates and female
reproductive biology in eutherian mammals. Proc R Soc Lond Biol 252
(1333): 7-12.
Gomendio M & Roldan ERS 2008 Implications of diversity in sperm size and
function for sperm competition and fertility. Int J Dev Biol. 52: 439–447.
doi:10.1387/ijdb.082595mg.
Gotanda KM, Reardon EE, Chapman LJ. 2012. Hypoxia and behaviour in a male
African cichlid. J Fish Biol. 78 (7): 2085-2092. doi: 10.1111/j.1095-
8649.2011.02996
Gray JS, Wu RS, Or YY. 2002. Effects of hypoxia and organic enrichment on the
coastal marine environment: Rev Mar Ecol Prog Ser. 238: 249-279.
Gray SM, McDonnell LH, Cinquemani FG, Chapman LJ. 2012. As clear as mud:
turbidity induces behavioral changes in the African cichlid Pseudocrenilabrus
multicolor. Curr Zool. 58: 146-157.
Gross MR. 1982. Sneakers, satellites and parentals: polymorphic mating strategies in
North American sunfishes. Zeitschrift für Tierpsychologie. 60(1): 1-26.
Harrod C, Griffiths D. 2005. Parasitism, space constraints and gonad asymmetry in
the pollan (Coregonus autumnalis). Can J Fish Aquatic Sci. 62: 2796-2801.
Heath AG. 1995. Water Pollution and Fish Physiology.CRC Press Inc., Florida.

63
Henson SA, Warner RR. 1997. Male and female alternative reproductive behaviors
in fishes: a new approach using intersexual dynamics. Annu Rev Ecol Syst.
571-592.
Hoffman SG, Schildhauer MP, Warner, R. R. (1985). The costs of changing sex and
the ontogeny of males under contest competition for mates. Evolution. 915-
927.
Humphries S, Evans JP, Simmons LW. 2008. Sperm competition: linking form to
function. BMC Evol Biol. 8(1): 319.
Ishijima S, Hara M, Okiyama M. 1998. Comparative studies on spermatozoan
motility of Japanese fishes. Bull Ocean Res Inst Univ Tokyo. 33: 139-152.
Ishijima S. 2012. Comparative analysis of movement characteristics of lancelet and
fish spermatozoa having different morphologies. Biol Bull. 222(3): 214-221.
Jafri SIH. 1989. The effects of photoperiod and temperature manipulation on
reproduction in the roach Rutilus rutilus (L.) (Teleostei). Pakistan J Zool.
21:289–299.
Jones RE, Petrell R.J, Pauly D. 1999. Using modified length–weight relationships to
assess the condition of fish. Aquacult Eng. 20(4): 261-276.
Jonsson N, Jonsson B, and Hansen LP. 1991. Energetic cost of spawning in male and
female Atlantic salmon (Salmo salar). J Fish Biol. 39: 739–744.
Kaufman L. 1992. Catastrophic change in species-rich freshwater ecosystems.
BioScience. 846-858.
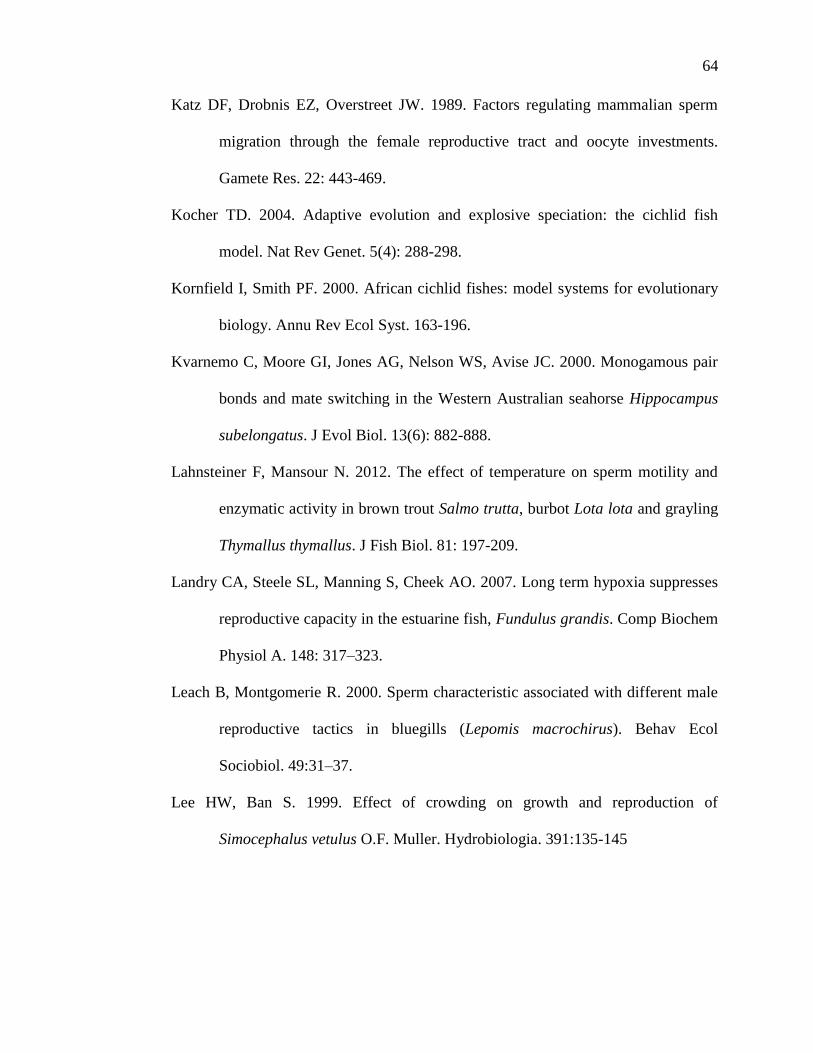
64
Katz DF, Drobnis EZ, Overstreet JW. 1989. Factors regulating mammalian sperm
migration through the female reproductive tract and oocyte investments.
Gamete Res. 22: 443-469.
Kocher TD. 2004. Adaptive evolution and explosive speciation: the cichlid fish
model. Nat Rev Genet. 5(4): 288-298.
Kornfield I, Smith PF. 2000. African cichlid fishes: model systems for evolutionary
biology. Annu Rev Ecol Syst. 163-196.
Kvarnemo C, Moore GI, Jones AG, Nelson WS, Avise JC. 2000. Monogamous pair
bonds and mate switching in the Western Australian seahorse Hippocampus
subelongatus. J Evol Biol. 13(6): 882-888.
Lahnsteiner F, Mansour N. 2012. The effect of temperature on sperm motility and
enzymatic activity in brown trout Salmo trutta, burbot Lota lota and grayling
Thymallus thymallus. J Fish Biol. 81: 197-209.
Landry CA, Steele SL, Manning S, Cheek AO. 2007. Long term hypoxia suppresses
reproductive capacity in the estuarine fish, Fundulus grandis. Comp Biochem
Physiol A. 148: 317–323.
Leach B, Montgomerie R. 2000. Sperm characteristic associated with different male
reproductive tactics in bluegills (Lepomis macrochirus). Behav Ecol
Sociobiol. 49:31–37.
Lee HW, Ban S. 1999. Effect of crowding on growth and reproduction of
Simocephalus vetulus O.F. Muller. Hydrobiologia. 391:135-145

65
Levitan DR. 2000. Sperm velocity and longevity trade off each other and influence
fertilization in the sea urchin Lytechinus variegates. Proc R Soc Lond B. 267:
531-534.
Lyons J, Stewart JS, Mitro M. 2010. Predicted effects of climate warming on the
distribution of 50 stream fishes in Wisconsin, USA. J Fish Biol. 77:1867-
1898.
McPherson LR., Slotte A, Kvamme C, Meier S, Marshall CT. 2010. Inconsistencies
in measurement of fish condition: a comparison of four indices of fat reserves
for Atlantic herring (Clupea harengus). ICES J Mar Sci. 148.
Martínez ML, Chapman LJ, Grady JM, Rees BB. 2004. Interdemic variation in
haemocrit and lactate dehydrogenase in the African cyprinid Barbus
neumayeri. J Fish Biol.65:1056–1069.
Martínez ML, Chapman LJ, Rees BB. 2009. Population variation in hypoxic
responses of the cichlid Pseudocrenilabrus multicolor victoriae. Can J Zool.
87: 188–194.
Martínez ML, Landry C, Boehm R, Manning S, Cheek AO, Rees BB. 2006. Effects
of long-term hypoxia on enzymes of carbohydrate metabolism in the Gulf
killifish, Fundulus grandis. J Exp Biol. 209: 3851–3861.
Martínez ML, Mullin V, Schulte-Hostedde A. 2015. Variation in sperm
morphometry of the African cyprinid Barbus neumayeri. Can J Zool. 93:
259–266.
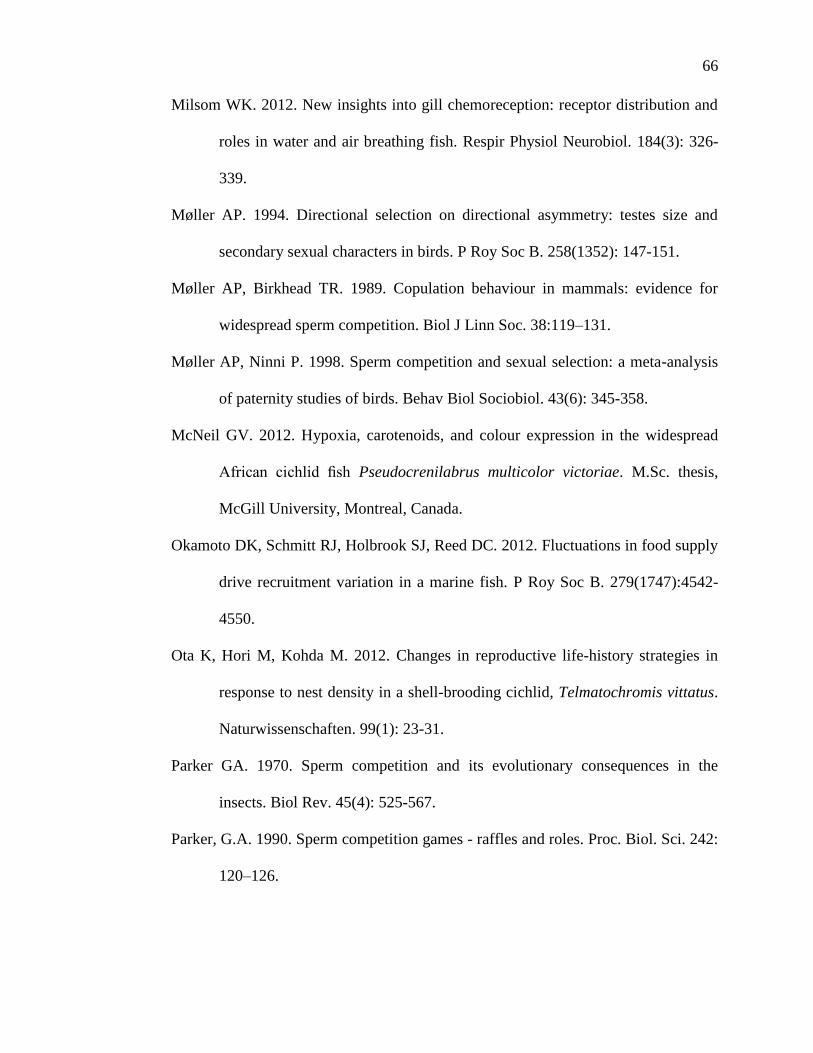
66
Milsom WK. 2012. New insights into gill chemoreception: receptor distribution and
roles in water and air breathing fish. Respir Physiol Neurobiol. 184(3): 326-
339.
Møller AP. 1994. Directional selection on directional asymmetry: testes size and
secondary sexual characters in birds. P Roy Soc B. 258(1352): 147-151.
Møller AP, Birkhead TR. 1989. Copulation behaviour in mammals: evidence for
widespread sperm competition. Biol J Linn Soc. 38:119–131.
Møller AP, Ninni P. 1998. Sperm competition and sexual selection: a meta-analysis
of paternity studies of birds. Behav Biol Sociobiol. 43(6): 345-358.
McNeil GV. 2012. Hypoxia, carotenoids, and colour expression in the widespread
African cichlid fish Pseudocrenilabrus multicolor victoriae. M.Sc. thesis,
McGill University, Montreal, Canada.
Okamoto DK, Schmitt RJ, Holbrook SJ, Reed DC. 2012. Fluctuations in food supply
drive recruitment variation in a marine fish. P Roy Soc B. 279(1747):4542-
4550.
Ota K, Hori M, Kohda M. 2012. Changes in reproductive life-history strategies in
response to nest density in a shell-brooding cichlid, Telmatochromis vittatus.
Naturwissenschaften. 99(1): 23-31.
Parker GA. 1970. Sperm competition and its evolutionary consequences in the
insects. Biol Rev. 45(4): 525-567.
Parker, G.A. 1990. Sperm competition games - raffles and roles. Proc. Biol. Sci. 242:
120–126.
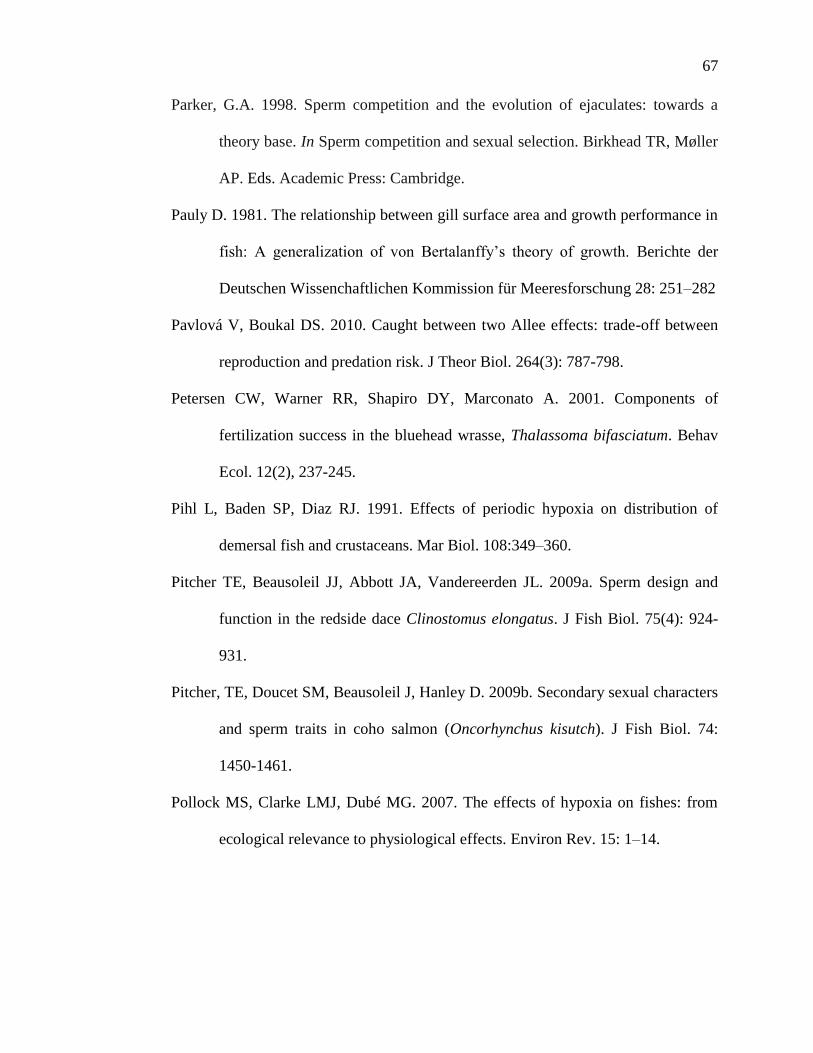
67
Parker, G.A. 1998. Sperm competition and the evolution of ejaculates: towards a
theory base. In Sperm competition and sexual selection. Birkhead TR, Møller
AP. Eds. Academic Press: Cambridge.
Pauly D. 1981. The relationship between gill surface area and growth performance in
fish: A generalization of von Bertalanffy’s theory of growth. Berichte der
Deutschen Wissenchaftlichen Kommission für Meeresforschung 28: 251–282
Pavlová V, Boukal DS. 2010. Caught between two Allee effects: trade-off between
reproduction and predation risk. J Theor Biol. 264(3): 787-798.
Petersen CW, Warner RR, Shapiro DY, Marconato A. 2001. Components of
fertilization success in the bluehead wrasse, Thalassoma bifasciatum. Behav
Ecol. 12(2), 237-245.
Pihl L, Baden SP, Diaz RJ. 1991. Effects of periodic hypoxia on distribution of
demersal fish and crustaceans. Mar Biol. 108:349–360.
Pitcher TE, Beausoleil JJ, Abbott JA, Vandereerden JL. 2009a. Sperm design and
function in the redside dace Clinostomus elongatus. J Fish Biol. 75(4): 924-
931.
Pitcher, TE, Doucet SM, Beausoleil J, Hanley D. 2009b. Secondary sexual characters
and sperm traits in coho salmon (Oncorhynchus kisutch). J Fish Biol. 74:
1450-1461.
Pollock MS, Clarke LMJ, Dubé MG. 2007. The effects of hypoxia on fishes: from
ecological relevance to physiological effects. Environ Rev. 15: 1–14.
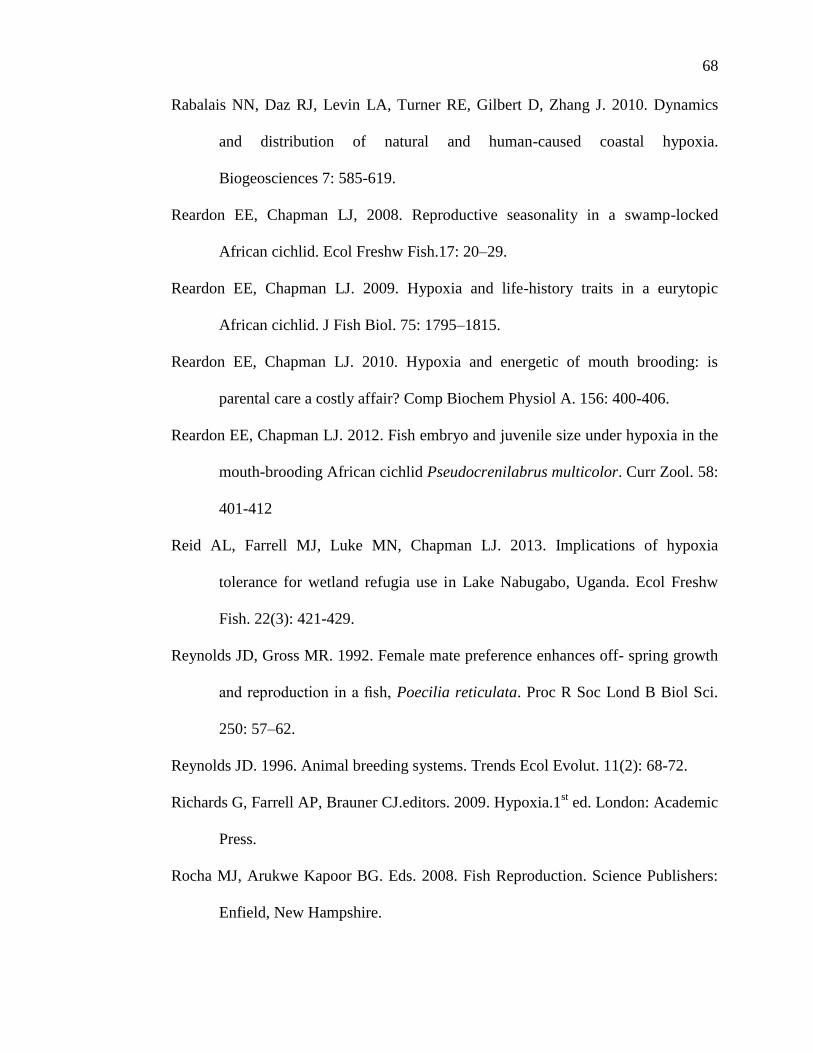
68
Rabalais NN, Daz RJ, Levin LA, Turner RE, Gilbert D, Zhang J. 2010. Dynamics
and distribution of natural and human-caused coastal hypoxia.
Biogeosciences 7: 585-619.
Reardon EE, Chapman LJ, 2008. Reproductive seasonality in a swamp-locked
African cichlid. Ecol Freshw Fish.17: 20–29.
Reardon EE, Chapman LJ. 2009. Hypoxia and life-history traits in a eurytopic
African cichlid. J Fish Biol. 75: 1795–1815.
Reardon EE, Chapman LJ. 2010. Hypoxia and energetic of mouth brooding: is
parental care a costly affair? Comp Biochem Physiol A. 156: 400-406.
Reardon EE, Chapman LJ. 2012. Fish embryo and juvenile size under hypoxia in the
mouth-brooding African cichlid Pseudocrenilabrus multicolor. Curr Zool. 58:
401-412
Reid AL, Farrell MJ, Luke MN, Chapman LJ. 2013. Implications of hypoxia
tolerance for wetland refugia use in Lake Nabugabo, Uganda. Ecol Freshw
Fish. 22(3): 421-429.
Reynolds JD, Gross MR. 1992. Female mate preference enhances off- spring growth
and reproduction in a fish, Poecilia reticulata. Proc R Soc Lond B Biol Sci.
250: 57–62.
Reynolds JD. 1996. Animal breeding systems. Trends Ecol Evolut. 11(2): 68-72.
Richards G, Farrell AP, Brauner CJ.editors. 2009. Hypoxia.1st ed. London: Academic
Press.
Rocha MJ, Arukwe Kapoor BG. Eds. 2008. Fish Reproduction. Science Publishers:
Enfield, New Hampshire.

69
Roff D. 1992. The Evolution of life histories: theory and analysis. Chapman and
Hall: New York.
Rurangwa E, Kime DE, Ollevier F, Nash JP.2004. The measurement of sperm
motility and factors affecting sperm quality in cultured fish. Aquaculture.
234: 1-4, 1-28.
Schulte PM. 2014. What is environmental stress? Insights from fish living in a
variable environment. J Exp Biol. 217: 23-34.
Schurmann H, Steffensen JF. 1994. Spontaneous swimming activity of Atlantic cod
Gadus morhua exposed to graded hypoxia at three temperatures. J Exp Biol.
197: 129–142.
Seehausen M, Alphen JJMV. 1999. Evolution of colour patterns in East African
cichlid fish. J Evol Biol. 12:514-534.
Sefc KM, Mattersdorfer K, Sturmbauer C, Koblmueller S. 2008. High frequency of
multiple paternity in broods of a socially monogamous cichlid fish with
biparental nest defence. Mol Ecol. 17(10): 2531-2543.
Simpson JL, Humphries S, Evans JP, Simmons LW, Fitzpatrick JL. 2014.
Relationships between sperm length and speed differ among three internally
and three externally fertilizing species. Evolution. 68(1): 92-104.
Skibiel AL, Speakman JR, Hood WR. 2013. Testing the predictions of energy
allocation decisions in the evolution of life-history trade-offs. Funct Ecol.
27(6): 1382-1391.
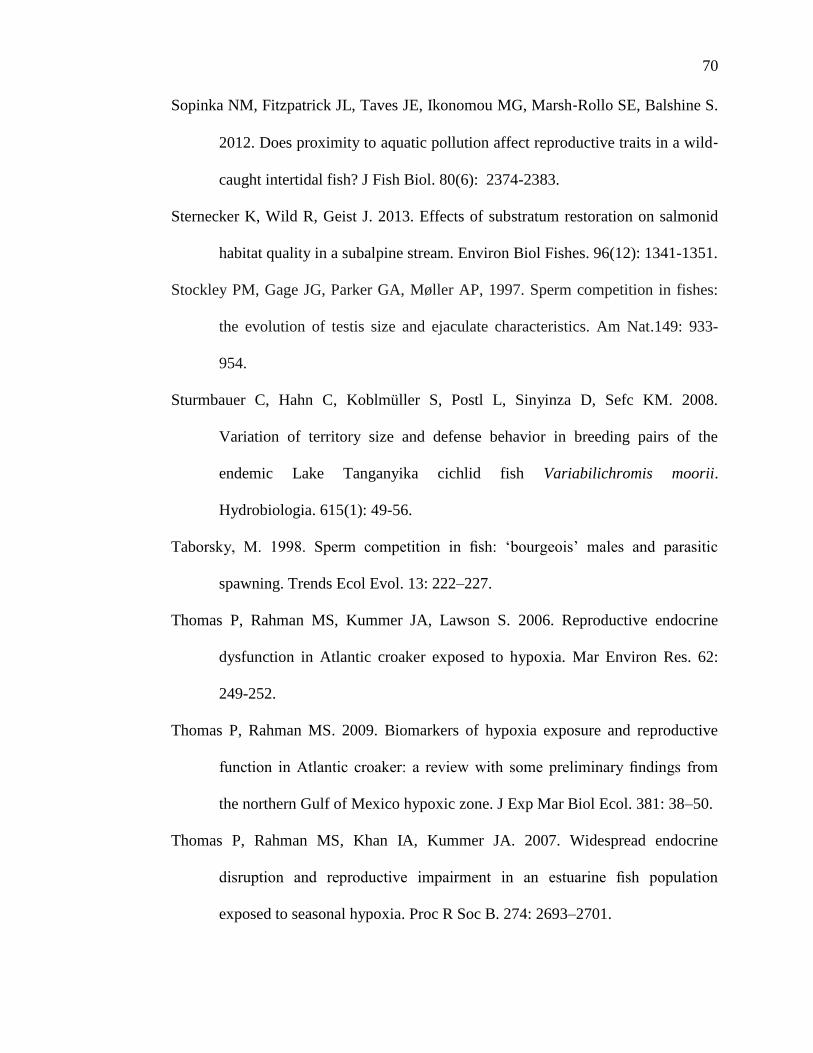
70
Sopinka NM, Fitzpatrick JL, Taves JE, Ikonomou MG, Marsh‐Rollo SE, Balshine S.
2012. Does proximity to aquatic pollution affect reproductive traits in a wild‐
caught intertidal fish? J Fish Biol. 80(6): 2374-2383.
Sternecker K, Wild R, Geist J. 2013. Effects of substratum restoration on salmonid
habitat quality in a subalpine stream. Environ Biol Fishes. 96(12): 1341-1351.
Stockley PM, Gage JG, Parker GA, Møller AP, 1997. Sperm competition in fishes:
the evolution of testis size and ejaculate characteristics. Am Nat.149: 933-
954.
Sturmbauer C, Hahn C, Koblmüller S, Postl L, Sinyinza D, Sefc KM. 2008.
Variation of territory size and defense behavior in breeding pairs of the
endemic Lake Tanganyika cichlid fish Variabilichromis moorii.
Hydrobiologia. 615(1): 49-56.
Taborsky, M. 1998. Sperm competition in fish: ‘bourgeois’ males and parasitic
spawning. Trends Ecol Evol. 13: 222–227.
Thomas P, Rahman MS, Kummer JA, Lawson S. 2006. Reproductive endocrine
dysfunction in Atlantic croaker exposed to hypoxia. Mar Environ Res. 62:
249-252.
Thomas P, Rahman MS. 2009. Biomarkers of hypoxia exposure and reproductive
function in Atlantic croaker: a review with some preliminary findings from
the northern Gulf of Mexico hypoxic zone. J Exp Mar Biol Ecol. 381: 38–50.
Thomas P, Rahman MS, Khan IA, Kummer JA. 2007. Widespread endocrine
disruption and reproductive impairment in an estuarine fish population
exposed to seasonal hypoxia. Proc R Soc B. 274: 2693–2701.
71
Thünken T, Bakker TCM, Baldauf SA, Kullmann H. 2007. Active inbreeding in a
cichlid fish and its adaptive significance. Curr Biol. 17: 225–229.
Timmerman CM, Chapman LJ. 2004. Behavioral and physiological compensation for
chronic hypoxia in the sailfin molly (Poecilia latipinna). Physiol Biochem
Zool. 77: 601–610.
Trivers RL. 1972. Parental investment and sexual selection. In Sexual Selection and
the Descent of Man, ed. B.Campbell, pp. 136-79. Chicago: Aldine.
Turner RE, Rabalais NN, Justic, D. 2008. Gulf of Mexico hypoxia: Alternate states
and a legacy. Environ Sci Technol. 42(7): 2323-2327.
Tuset VM, Trippel EA, de Montserrat J. 2008. Sperm morphology and its influence
on swimming speed in Atlantic cod. J App. Ichthyol. 24 (4): 98-405.
Utne-Palm AC. 2002. Visual feeding of fish in a turbid environment: physical and
behavioural aspects. Mar Freshw Behav Physiol. 35: 111–128.
Wu RSS. 2002 Hypoxia: from molecular responses to ecosystem responses. Mar
Pollut Bull. 45: 35–45.
Wu R, Zhou B, Randall D, Woo N, Lam P. 2003. Aquatic hypoxia is an endocrine
disruptor and impairs fish reproduction. Environ Sci Technol. 37: 1137-1141.
Vladic TV, Afzelius BA, Bronnikov GE. 2002. Sperm quality as reflected through
morphology in salmon alternative life histories. Biol Reprod. 66:98–105.
Wikelski M, Cooke SJ. 2006. Conservation physiology. Trends Ecol Evol. 21(1):
38-46.
Yu ZH. 1998. Asymmetrical testicular weights in mammals, birds, reptiles and
amphibia. Int J Androl. 21(1): 53-55.

72
Zhou BS, Wu RSS, Randall DJ, Lam PKS, Ip YK, Chew SF. 2000. Metabolic
adjustments in the common carp during prolonged hypoxia. J Fish Biol. 57:
1160-1171.
APPENDIX 1
CORRELATIONS FOR VARIABLES THAT INTERACTED WITH THE
COVARIATE IN ANCOVA ANALYSIS
Site SL x M SL x HLFL
r P r P
BUN 0.989 <0.0001 -0.591 0.016
BWE 0.977 <0.0001 0.2 0.347
DDB 0.957 <0.0001 -0.283 0.191
JJB 0.950 <0.0001 -0.171 0.424
KAY 0.988 <0.0001 -0.337 0.06
KAZ 0.979 <0.0001 0.112 0.554
LWA 0.868 <0.0001 0.026 0.884
NYA 0.974 <0.0001 -0.15 0.473
PH 0.925 <0.0001 -0.416 0.018

73
D.O. Regime SL xVAP30 SL x LIN 30
r p r p
FLU -0.853 0.0001 -0.624 0.017
HYP 0.1 0.284 0.14 0.136
NOR -0.416 0.004 -0.379 0.009
D.O. Regime SM x GT
r p
FLU 0.870 <0.0001
HYP 0.714 <0.0001
NOR 0.624 <0.0001

74
APPENDIX 2
RELATIONSHIP BETWEEN SOMATIC MASS AND TESTES MASS IN
MALE P. MULTICOLOR
Figure 7. Scatter plot of the log of somatic mass and the log of total testes mass to
demonstrate the approximate linear relationship between size and gonad mass in this
species.


![Sperm Motility Algorithm for Solving Fractional Programming … · 2018. 12. 15. · human, was proposed for solving optimization problems by Osama and Hezam [1]. The uncertainty](https://static.fdocuments.in/doc/165x107/5ffb3f54af63da2cf7181650/sperm-motility-algorithm-for-solving-fractional-programming-2018-12-15-human.jpg)
![Review Article · 2015. 5. 4. · Species Property Source Rats Increase sperm count and sperm motility [16] Increase male sexual behavior [13 ,22 23] Small effect on rat male sexual](https://static.fdocuments.in/doc/165x107/603bcf1394f5db0b65622ab7/review-article-2015-5-4-species-property-source-rats-increase-sperm-count-and.jpg)