Spending on Safety Net for the Poor: How...
62
Spending on Safety Nets for the Poor: How Much, For How Many? The Case of Malawi January 2001 Africa Region Working Paper Series No. 11 ABSTRACT The paper looks at the general question of affordability of safety net programs in low income countries such as Malawi where a large proportion of the population are very poor subsistence farmers. With a very tight budget, and significant numbers of absolute poor, any program large enough to have a substantial impact would be extremely costly. However narrow targeting is difficult, both because the data base does not allow the authorities to identify particular groups or households (for example even the most basic attributes like age, landholding, and income are generally not known with any accuracy); and because the administrative capacity to target is very weak. The author examines what the objectives of public safety net programs should be under these conditions, and which groups of beneficiaries it makes most sense to support. The paper analyzes the cost-effectiveness of existing programs in depth, including public works, food distribution, and a free fertilizer distribution program. The paper concludes that programs must contribute to some wider development goal (to minimize the fiscal trade-off) and as far as possible be self-targeting (to overcome the information and administrative constraints). In conclusion a specific package of programs for the next 10 years is recommended. AUTHORS’ AFFILIATION AND SPONSORSHIP William James Smith, AFTH1, The World Bank Email: [email protected] THE WORKING PAPER S ERIES The Africa Region Working Paper Series expedites dissemination of applied research and policy studies with potential for improving economic performance and social conditions in Sub-Saharan Africa. The Series publishes papers at preliminary stages to stimulate timely discussion within the Region and among client countries, donors, and the policy research community. The editorial board for the Series consists of representatives from professional Families appointed by the Region’s Sector Directors. Editor in charge of the series: Antoine Waldburger, AFTM3, Email: [email protected] The findings, interpretations, and conclusions expressed in this paper are entirely those of the author(s) and do not necessarily represent the views of the World Bank Group, its Executive Directors, or the countries they represent. For additional information visit the Web site http://www.worldbank.org/afr/wps/index.htm
Transcript of Spending on Safety Net for the Poor: How...
Spending on Safety Nets for the Poor: How Much, For How Many? The Case of MalawiJanuary 2001Africa Region Working Paper Series No. 11
ABSTRACT
The paper looks at the general question of affordability of safety net programs in low incomecountries such as Malawi where a large proportion of the population are very poor subsistencefarmers. With a very tight budget, and significant numbers of absolute poor, any program largeenough to have a substantial impact would be extremely costly. However narrow targeting isdifficult, both because the data base does not allow the authorities to identify particular groups orhouseholds (for example even the most basic attributes like age, landholding, and income aregenerally not known with any accuracy); and because the administrative capacity to target is veryweak. The author examines what the objectives of public safety net programs should be underthese conditions, and which groups of beneficiaries it makes most sense to support. The paperanalyzes the cost-effectiveness of existing programs in depth, including public works, fooddistribution, and a free fertilizer distribution program. The paper concludes that programs mustcontribute to some wider development goal (to minimize the fiscal trade-off) and as far aspossible be self-targeting (to overcome the information and administrative constraints). Inconclusion a specific package of programs for the next 10 years is recommended.
AUTHORS’ AFFILIATION AND SPONSORSHIP
William James Smith, AFTH1, The World BankEmail: [email protected]
THE WORKING PAPER SERIES
The Africa Region Working Paper Series expedites dissemination of applied research and policystudies with potential for improving economic performance and social conditions in Sub-SaharanAfrica. The Series publishes papers at preliminary stages to stimulate timely discussion withinthe Region and among client countries, donors, and the policy research community. Theeditorial board for the Series consists of representatives from professional Families appointed bythe Region’s Sector Directors.Editor in charge of the series: Antoine Waldburger, AFTM3, Email:[email protected]
The findings, interpretations, and conclusions expressed in this paper are entirely those of theauthor(s) and do not necessarily represent the views of the World Bank Group, its ExecutiveDirectors, or the countries they represent.
For additional information visit the Web site http://www.worldbank.org/afr/wps/index.htm
Spending on Safety Nets for the Poor:How Much, For How Many? The Case of Malawi
William James SmithJanuary 20001
This paper presents analytical work done as background to a joint government-donor effort to assess theappropriate safety net strategy in Malawi, in 1999. The document however is the responsibility of theauthor, and does not necessarily reflect the views of the World Bank, the government of Malawi, or of theother donors involved, although its findings have been discussed widely. Valuable contributions andcomments were provided by Kalanidhi Subbarao, Maxton Tsoka, Rob Geddes, Judith Appleton, KevinBillings, Steven Devereux, Trina Haque, Paul Harnett, Philip White, Lawrence Kachikopa, John Rook,Bob Leverington, Marie Lisa Santonocinoto, Ana Christina Amaral, Sanjay Kotecha, and Bob Liebenthal.Gene Tidrick and Harold Alderman served as Peer Reviewers for the original work. The report is based onmissions to Malawi in March and July of 1999; as well as consultations with numerous villagers, fieldworkers and program managers, representatives

Exchange Rate
Malawi Kwacha 44 = US$ 1 (mid-1999)
List of Acronyms
ADMARC Agricultural Development and Marketing CorporationBNPL Basic Needs Poverty LineCPAR Canadian Physicians for Relief and DevelopmentDfID Department for International DevelopmentEMOP Emergency OperationEPA Extension Planning AreaESNP Emergency Safety Net OperationEU European UnionFEWS Famine Early Warning SystemFFW Food for WorkGDP Gross Domestic ProductHa. hectareHH HouseholdK. Kwacham. millionMASAF Malawi Social Action FundMEGS Maharastra Employment Guarantee SchemeMoHP Ministry of Health and PopulationNEC National Economic councilNGO Non-Government OrganizationNSSA National Survey of Smallholder Agriculturep.a. per annump.c. per capitaPWP Public Works ProgramSPI Starter Pack InitiativeUNDP United Nations Development ProgramWFP World Food Program

i
Table of Contents
Introduction........................................................................................................................1
Chapter I - The Nature Of Poverty In Malawi................................................................5
1.1 The Poverty Profile .........................................................................................51.2 Characteristics of the Poor ..............................................................................61.3 Risks Faced by the Poor..................................................................................7
Chapter 2 - Affordability: Broad Options for a Safety Net Strategy..........................10
Chapter 3 - Objectives and Target Groups ...................................................................12
3.1 The Debate Over Objectives.........................................................................123.2 Possible Target Groups .................................................................................143.3 Political and Social Considerations...............................................................16
Chapter 4 - Existing Safety Net Programs .....................................................................19
Chapter 5 - Evaluation of Options ..................................................................................23
5.1 Public Works.................................................................................................235.2 Food and Feeding Programs .........................................................................285.3 Starter Packs..................................................................................................335.4 Subsidies........................................................................................................365.5 Cash Transfers...............................................................................................375.6 Summary of Alternative Programs................................................................39
Chapter 6 - Conclusions and Recommendations ..........................................................41
6.1 The Choice of Safety Net Strategy................................................................416.2 Recommended Safety Net Program..............................................................436.3 Next Steps .....................................................................................................456.4 Closing Observations: Institutional Issues ...................................................46
References .......................................................................................................................47
Annex – Assumptions Underlying Evaluation of Programs Options ..........................54
ii
List of Tables
Table 1 Projected Number of Poor..................................................................................1Table 2 Approximate Distribution of Income and
Attributes of Income Classes..............................................................................6Table 3 Selected Prices Following August, 1998 Devaluation.......................................8Table 4 Illustrative Transfers Possible for a Given Level of Funding..........................11Table 5 Consumption Risks and Possible Objectives
of a Safety Net in Malawi.................................................................................12Table 6 Approximate Numbers in Various Poverty Groups in Malawi........................15Table 7 Programs On-Going in 1998/99 or
Committed to for 1999/2000............................................................................19Table 8 Characteristics of Public Works Participants
and Non-Participants........................................................................................26Table 9 Costs of An Expanded School Feeding Program.............................................32Table 10 Estimated Production Impact of Starter Pack Transfers ..................................34Table 11 Estimated Transfers and Incidence Costs for
Various Transfer Programs ..............................................................................39Table 12 Broad Options for a Safety Net Strategy for Malawi.......................................42Table 13 Recommended Safety Net Program – 2000-2020............................................45
List of Boxes
Box 1 What Should the Objectives of a Safety Net Be? – Voices from theConsultative Process…………………………………………………………16
Box 2 To Target or Not to Target? The Costs and PoliticalEconomy of Being Selective............................................................................18
Box 3 Public Works: Some Best Practice Examples fromInternational Experience ..................................................................................25
Box 4 Food Transfers: Lessons from International Experience ................................31Box 5 Voices from the Village – School Feeding vs. Clinic
Distribution (ESNP) Program..........................................................................33
1
A Safety Net Strategy for the Poor – How Much, For How Many?
Introduction
Malawi typifies the problems of trying to provide a public safety net in very low-income countries:
• a large proportion of the population are absolutely poor; with incomes aroundthe subsistence minimum; and they are also prone to severe shocks (such asdrought, and the widespread threat of AIDS);
• growth is not likely to be rapid enough – at least in the near-to-medium term –to dramatically reduce the numbers of the poor;
• with such a large share of the population in poverty, and with little surplus toredistribute, it is not clear what role safety net transfers should play;
• the data base is weak, making it difficult to identify and target the poorest;• there is limited administrative capacity, making it difficult to manage complex
programs; and,• although there is no formal safety net program, a lot is already spent on
transfers under various ad hoc donor initiatives, but with little impact onpoverty.
This paper looks at the desirability of public safety nets in the case of Malawi:how big a role they should play in the development strategy, how much it makes sense tospend on them, and what the best choice of programs might be.
The World Bank’s earlier analysis of household survey data suggested that thereare about 4.8 million absolute poor in Malawi. A more recent poverty profile shows thatsomething like 65% of the population live below the current basic needs poverty line;and that 29% constitute the ‘ultra-poor’, surviving on less than US 25 cents per day. Byany measure these are clearly among the world’s poorest people.
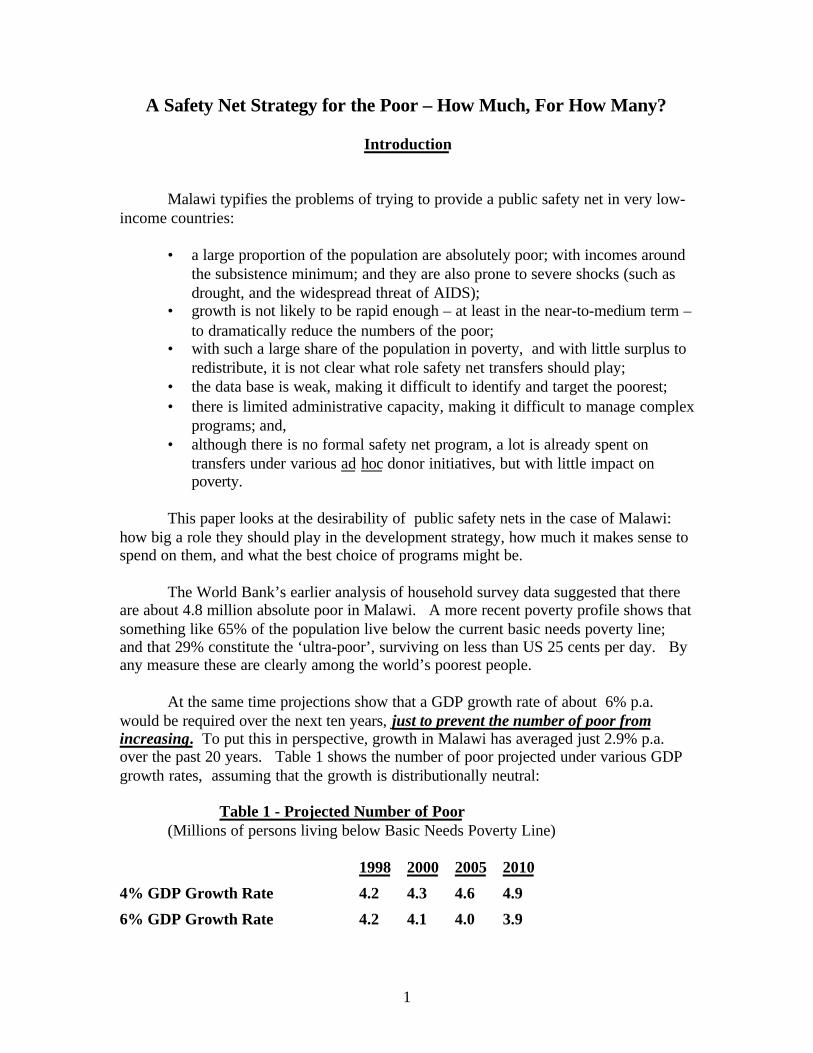
At the same time projections show that a GDP growth rate of about 6% p.a.would be required over the next ten years, just to prevent the number of poor fromincreasing. To put this in perspective, growth in Malawi has averaged just 2.9% p.a.over the past 20 years. Table 1 shows the number of poor projected under various GDPgrowth rates, assuming that the growth is distributionally neutral:
Table 1 - Projected Number of Poor(Millions of persons living below Basic Needs Poverty Line)
1998 2000 2005 2010
4% GDP Growth Rate 4.2 4.3 4.6 4.9
6% GDP Growth Rate 4.2 4.1 4.0 3.9

2
Obviously under any scenario there are going to remain a very large number ofvery poor people in Malawi for the foreseeable future. It therefore makes sense toconsider some kind of safety net or transfer program. However with a per capita incomeof less than $200 equivalent, the surplus available to redistribute under any sustained“safety net” program is relatively small. At the same time, the large proportion of thepopulation that are absolutely poor mean that:
(a) any program large enough to have a substantial impact would be extremelycostly; and,(b) affordable options will likely only be able to reach some fairly limited portionof the population in need, and/or to have a limited effect on household incomes.
Under these conditions the challenge for Malawi (and indeed for very low incomecountries generally) is to carefully consider the options for public policy, and to be highlyselective in choosing interventions which are cost-effective in delivering benefits to thepoorest.
Historically there has been no coherent strategy, and there remain in Malawi anumber of uncoordinated, fairly small-scale interventions. In the face of obvious need,the government and donors have launched ad hoc, and often not very consistentprograms to address the needs of the poor in the short run. Currently, for example, thereare over 15 public works, feeding, and transfer programs funded by various donors (seeChapter 4). While each of these has merits, most do not reach more than a few tens ofthousands of beneficiaries, nor do they deliver sustained benefits to the poor.
During 1999 therefore the government and donors undertook a joint piece of workto develop a national safety net strategy. The objective was to pull together what isknown of poverty in Malawi, and of experience with programs in Malawi and elsewhere,and to come up with an agreed safety net program for the next ten years. This paper ispresented to share some of the analytical findings more widely, to help those confrontingthe issues of public safety nets in very poor countries.
The central questions asked were:
• What are the realistic objectives of a publicly funded safety net - given the nature andcharacteristics of the poor; and revealed political and social preferences?
• Which groups (or sub-groups) among the poor should benefit?• What choice of safety net programs is most cost-effective in terms of achieving the
desired objectives?
The analysis then examines three key issues that arise in considering thesequestions: the affordability and appropriate size of transfer program; the problem oftargeting approaches – how much selectivity is appropriate, and how much is feasible;and finally the questions of institutional capacity.
3
It must be emphasized that the objective is not to lay out a poverty alleviationstrategy for Malawi, but rather to look more narrowly at what it makes sense to do interms of direct transfers to the critically poor. The paper looks at programs such aspublic works employment, food and feeding programs, subsidies and transfers; but it doesnot include programs designed to raise incomes more permanently, such as agricultural,credit, or income-generating schemes, which are treated as part of the broader growth andpoverty reduction strategy.
The main vehicle for poverty reduction needs to be growth – and especially pro-poor growth that absorbs labour. To achieve this in Malawi depends on efforts todiversify agriculture, to shift to higher-productivity activities, and to ensure theeducation, infrastructure, and financial markets are in place to facilitate off-farmemployment. Within this framework, safety nets represent but one, limited aspect of thepoverty reduction strategy. It is important to recognize, however, that safety net transfersare not just an effort to improve the immediate consumption of the poor, but alsorepresent an investment in Malawi’s future – by ensuring the productivity of the nextgeneration, and preventing the economic collapse of families in times of stress.
Structure of the Report
This report presents the findings of that work. Chapter I describes what is known ofpoverty in Malawi, and what implications that has for the choice of safety net interventions.Chapter 2 lays out the broad fiscal options for a safety net strategy open to the governmentand donors, and very roughly, what each might cost. Chapter 3 looks in more depth at thecomplex question of what the objectives of a safety net might be in a society like Malawi,and the possible target groups. Chapter 4 summarizes existing programs, and Chapter 5evaluates the pros and cons of various program options. Finally Chapter 6 presents arecommended safety net program, and a program of immediate work.
4
Chapter 1 - The Nature of Poverty In Malawi
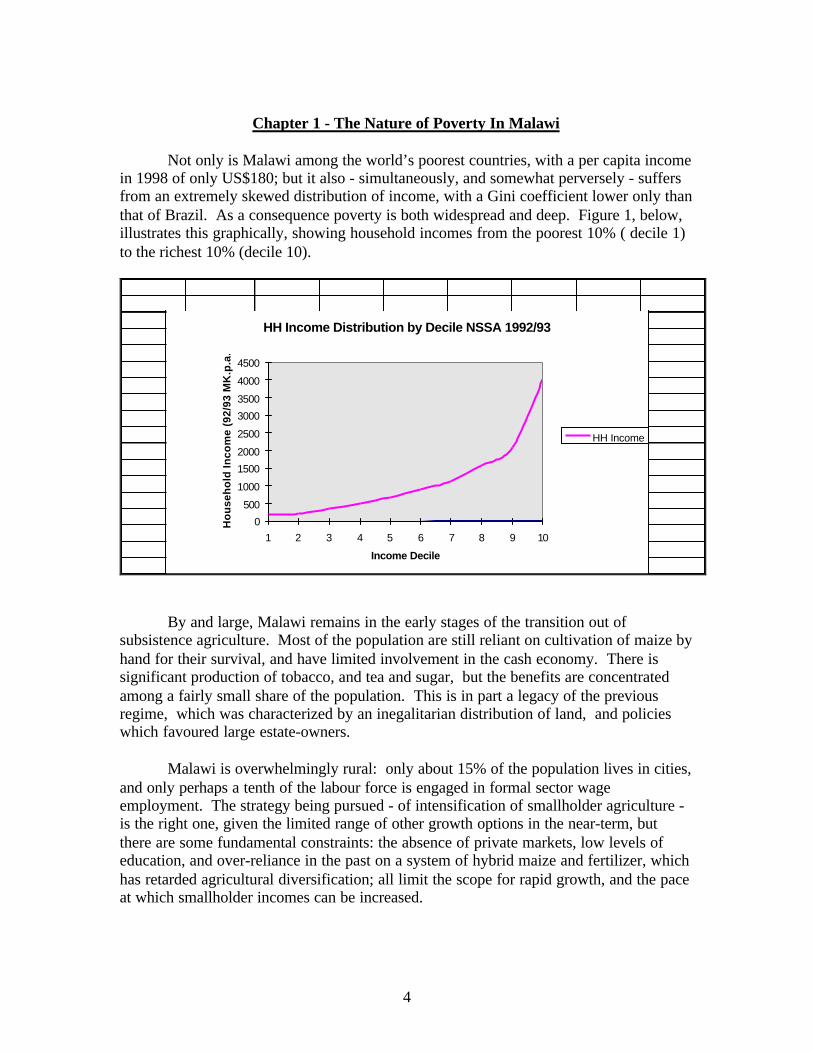
Not only is Malawi among the world’s poorest countries, with a per capita incomein 1998 of only US$180; but it also - simultaneously, and somewhat perversely - suffersfrom an extremely skewed distribution of income, with a Gini coefficient lower only thanthat of Brazil. As a consequence poverty is both widespread and deep. Figure 1, below,illustrates this graphically, showing household incomes from the poorest 10% ( decile 1)to the richest 10% (decile 10).
HH Income Distribution by Decile NSSA 1992/93
0
500
1000
1500
2000
2500
3000
3500
4000
4500
1 2 3 4 5 6 7 8 9 10
Income Decile
Ho
use
ho
ld In
com
e (9
2/93
MK
.p.a
.)
HH Income
By and large, Malawi remains in the early stages of the transition out ofsubsistence agriculture. Most of the population are still reliant on cultivation of maize byhand for their survival, and have limited involvement in the cash economy. There issignificant production of tobacco, and tea and sugar, but the benefits are concentratedamong a fairly small share of the population. This is in part a legacy of the previousregime, which was characterized by an inegalitarian distribution of land, and policieswhich favoured large estate-owners.
Malawi is overwhelmingly rural: only about 15% of the population lives in cities,and only perhaps a tenth of the labour force is engaged in formal sector wageemployment. The strategy being pursued - of intensification of smallholder agriculture -is the right one, given the limited range of other growth options in the near-term, butthere are some fundamental constraints: the absence of private markets, low levels ofeducation, and over-reliance in the past on a system of hybrid maize and fertilizer, whichhas retarded agricultural diversification; all limit the scope for rapid growth, and the paceat which smallholder incomes can be increased.
5
Recent Developments
At the same time, the nature of poverty in Malawi is evolving. There have been anumber of developments over the past five years that have had a fundamental impact onthe composition of poverty. These include:
(i) a population that is increasingly less dependent on subsistence agriculture; partlybecause there has been a shift into cash crops on the part of smallholders -- intotobacco, but also into traded food crops;
(ii) as a result of population pressure and the sub-division of holdings, there isgrowing landlessness, as well as increasing urbanization; and therefore a greaterdependence on off-farm incomes;
(iii) in addition, the dismantling of the previous system of state-controlled maizedistribution and pricing of agricultural inputs has resulted in greater volatility inprices and incomes.
As a consequence of all of these factors, there has almost certainly been awidening of the income distribution among the poor (who previously had uniformly lowincomes). There have been winners and losers; qualitative surveys suggest that those inthe cash economy, and some of the ‘middle poor’ are better-off than they were, but thereis no doubt that some households are substantially worse off, and that there is, inaddition, a growing new category of urban poor.
Meanwhile there was increasing concern in Malawi, and among the donorcommunity, with the food security situation throughout the second half of the 1990s.Food insecurity is of course primarily a problem of insufficient purchasing power,although it is exacerbated by national foodgrain deficits in some years. Certainly there isno doubt that it is a cause of great political and popular concern. While the lack of dataon food consumption and incomes makes it difficult to draw firm conclusions, all of thefundamentals suggest that there is a very large proportion of the population living incircumstances of such acute poverty as to be unacceptable - both to the government andto the international community. As a result there is a general consensus that some kindof more consistent safety net program is needed.
1.1 The Poverty Profile
An Integrated Household Survey has recently been completed, and an updatedpoverty profile is being produced at the time of writing. Data by income decile is not yetavailable, however the preliminary results suggest that the story told by the earlier datastill broadly describes the poverty situation in Malawi.
Having updated the estimated income distribution, we have constructed thefollowing rough profile for a preliminary discussion of targeting issues.

6
Table 2 - Approximate Distribution of Income and Attributes of Income Classes
Adult-Equivalent
HouseholdSize
Estimated1998 Income Average Landholding
Income Deciles (MK/capita) (Ha./HH) (Ha./capita)
1 5.4 101 0.25 0.052 5.5 246 0.46 0.083 5.2 396 0.55 0.114 5.2 570 0.65 0.135 5.2 773 0.74 0.146 5.1 1029 0.81 0.167 4.9 1368 0.91 0.198 4.9 1880 1.07 0.219 4.5 2779 1.12 0.2410 4.2 5930 1.55 0.37
Average 5.0 1507 0.79 0.16
Source: NSSA; 1992, updated to 1998 prices
Using the updated poverty survey, a picture emerges similar to that painted in theearlier poverty studies: with about 65% of the population having incomes below theBasic Needs poverty line, and 29% existing below the ‘ultra-poor’ poverty line of aboutK.6 per day (US 25 cents). It should be emphasized that the raw income data is suspect,and almost certainly understates actual incomes. The important point is not so much theabsolute levels of income, but the distribution (which we believe to be fairly accurate);the picture that emerges remains valid: of a large proportion of the population – aboutthe 2nd through 5th deciles – living at very low consumption levels, and a bottom 10-20% or so who are so poor as to be living at the margins of survival.
1.2 Characteristics of the poor
A few other characteristics emerge from the poverty profile which can potentiallyhelp us think about who should be targeted by safety nets in Malawi. One is the strongcorrelation between poverty and landholding size. As can be seen from Table 2, averagehousehold landholdings are universally small among the poor – at about 0.5 hectare – butare dramatically lower for the very poor, averaging only 0.25 ha. per household in thelowest decile.1
Another characteristic that may be helpful in defining who safety nets shouldtarget is that of female-headed households (FHH). There is an unusually high proportionof FHHs in Malawi generally (representing about a quarter of the rural population) and adisportionate number among the poor. The recent household survey classifies 63.5% of
1 The more recent IHS data shows higher average landholdings among the poorest – close to 0.7 ha. per
household - although it is not clear whether the two surveys are methodologically comparable.
7
rural female-headed households as below the poverty line. Micro-level studies suggestthat they are particularly labour-constrained, and therefore less likely to be able to takeadvantage of off-farm employment opportunities, as well as being unable to optimallyexploit their own landholdings. Female-headed households suffer triple-jeopardy in thisregard: (i) they have fewer potential adult workers than other households; (ii) there aremore demands on the primary adult breadwinner - because she also has primaryresponsibility for childcare and household management; and (iii) she is – by both customand skills - less readily employable outside the household, and is typically paid lesswhen she is employed.
Thirdly, there is a growing group of orphans, mostly as a result of AIDS,estimated to reach about two-thirds of a million within the next few years. These orphansare generally unable to provide for themselves, and at the moment are supported, if at all,by a combination of relatives, their communities, and limited charity programs run bychurches and NGOs. However traditional support systems are increasingly strained, andwhile one wants to avoid duplicating community support, some kind of carefullydesigned program that reinforces the grandparents, communities, and NGOs that arestruggling to cope with the growing number of orphans almost certainly needs to be partof the safety net strategy.
1.3 Risks Faced by the Poor
The poor in Malawi face four distinct types of risk. Firstly, there is the seasonalshock of annual food shortages and price increases. Each year food stocks run low byabout November, and for the next three or four months many households subsist on onemeal a day, or on wild foods. At the same time, due to scarcity, the price of maizeincreases dramatically, sharply reducing their capacity to buy food from the market. Thefollowing table illustrates the ratio of lean-season (November-March) to post-harvest(April-June) maize prices, in nominal kwacha per kg.:
88/89-91/92 1994/95 1996/97 1997/98 1998/99
Post-Harvest Price 0.27 1.19 1.98 2.46 3.87
Lean-Season High 0.38 3.53 3.22 7.62 9.53
Intra-season Increase 41% 196% 62% 209% 146%
This is a predictable annual shock, but the poor have little way of insuring againstit, and it severely affects their welfare, resulting in extreme nutritional stress for manyhouseholds.
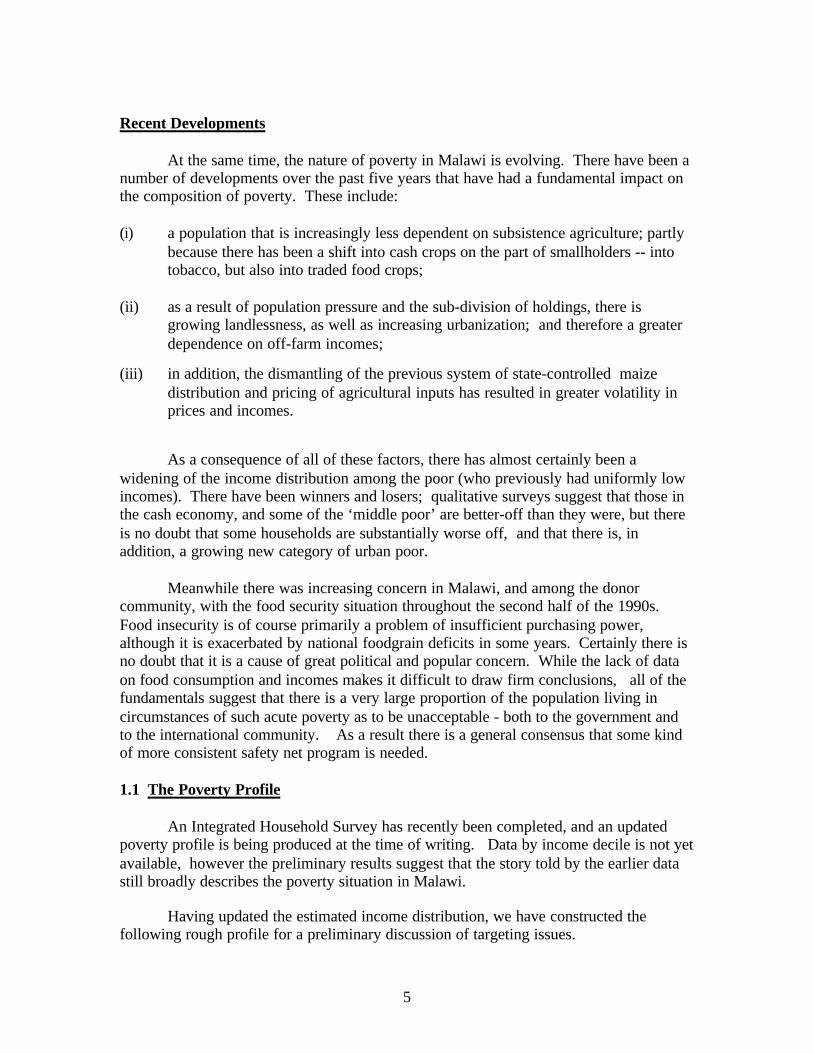
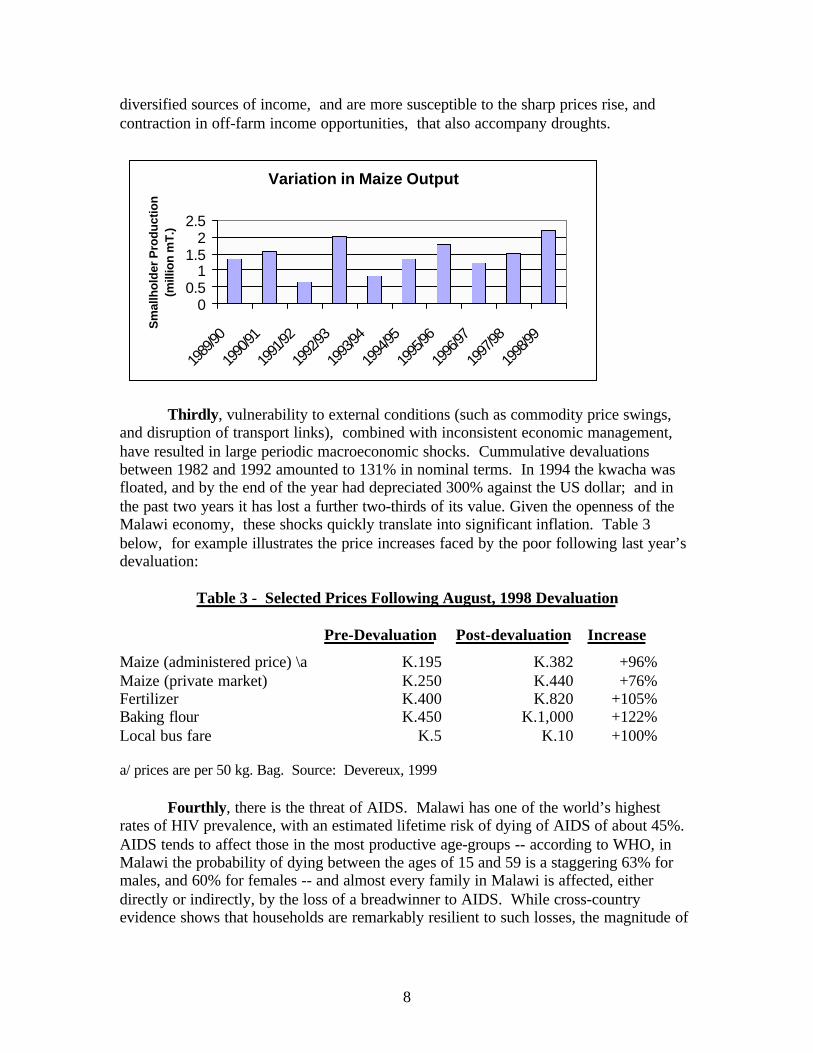
Secondly, Malawi is vulnerable to the periodic droughts that affect eastern andsouthern Africa, as the following graph indicates. With the population (and particularlythe poor) relying heavily on rainfed agriculture, these have tremendous impact onhousehold welfare. Major droughts in 1991/92 and 1993/94 resulted in widespreadhunger and hardship. The poor are particularly hard-hit, as they tend to have fewer
8
diversified sources of income, and are more susceptible to the sharp prices rise, andcontraction in off-farm income opportunities, that also accompany droughts.
Thirdly, vulnerability to external conditions (such as commodity price swings,and disruption of transport links), combined with inconsistent economic management,have resulted in large periodic macroeconomic shocks. Cummulative devaluationsbetween 1982 and 1992 amounted to 131% in nominal terms. In 1994 the kwacha wasfloated, and by the end of the year had depreciated 300% against the US dollar; and inthe past two years it has lost a further two-thirds of its value. Given the openness of theMalawi economy, these shocks quickly translate into significant inflation. Table 3below, for example illustrates the price increases faced by the poor following last year’sdevaluation:
Table 3 - Selected Prices Following August, 1998 Devaluation
Pre-Devaluation Post-devaluation Increase
Maize (administered price) \a K.195 K.382 +96%Maize (private market) K.250 K.440 +76%Fertilizer K.400 K.820 +105%Baking flour K.450 K.1,000 +122%Local bus fare K.5 K.10 +100%
a/ prices are per 50 kg. Bag. Source: Devereux, 1999
Fourthly, there is the threat of AIDS. Malawi has one of the world’s highestrates of HIV prevalence, with an estimated lifetime risk of dying of AIDS of about 45%.AIDS tends to affect those in the most productive age-groups -- according to WHO, inMalawi the probability of dying between the ages of 15 and 59 is a staggering 63% formales, and 60% for females -- and almost every family in Malawi is affected, eitherdirectly or indirectly, by the loss of a breadwinner to AIDS. While cross-countryevidence shows that households are remarkably resilient to such losses, the magnitude of
Variation in Maize Output
00.5
11.5
22.5
1989
/90
1990
/91
1991
/92
1992
/93
1993
/94
1994
/95
1995
/96
1996
/97
1997
/98
1998
/99
Sm
allh
olde
r P
rodu
ctio
n (m
illio
n m
T.)

9
the pandemic in Malawi is such that traditional coping mechanisms are overwhelmed,and there are increasingly many households where both parents have died.
We do not know enough to be able to quantify the relative importance of theserisks in affecting consumption of the poor; and this is an area that needs further analysis(see discussion in Chapter 3.). however, during the consultative process the over-ridingimportance of the annual lean-season shortfall in consumption was emphasized again andagain as the most critical issue facing the poor.
These considerations also underline the importance of locating safety nets in awider development context. It is important not to loose sight of the fact that in Malawiissues such as land reform, the pattern of growth pursued, and the nature of agriculturaldiversification, will have more impact on reducing risk (and of course on raisingincomes) than any explicit safety net measure. Furthermore, some forms of risk can beaddressed in the medium-term by means other than safety nets – for example AIDS riskcan be reduced by behavioural change, and the risk of seasonal price rises by betterfunctioning private storage and trade.
10
Chapter 2 – Affordability: Broad Options For a Safety Net Strategy
Magnitude of the Problem and Costs
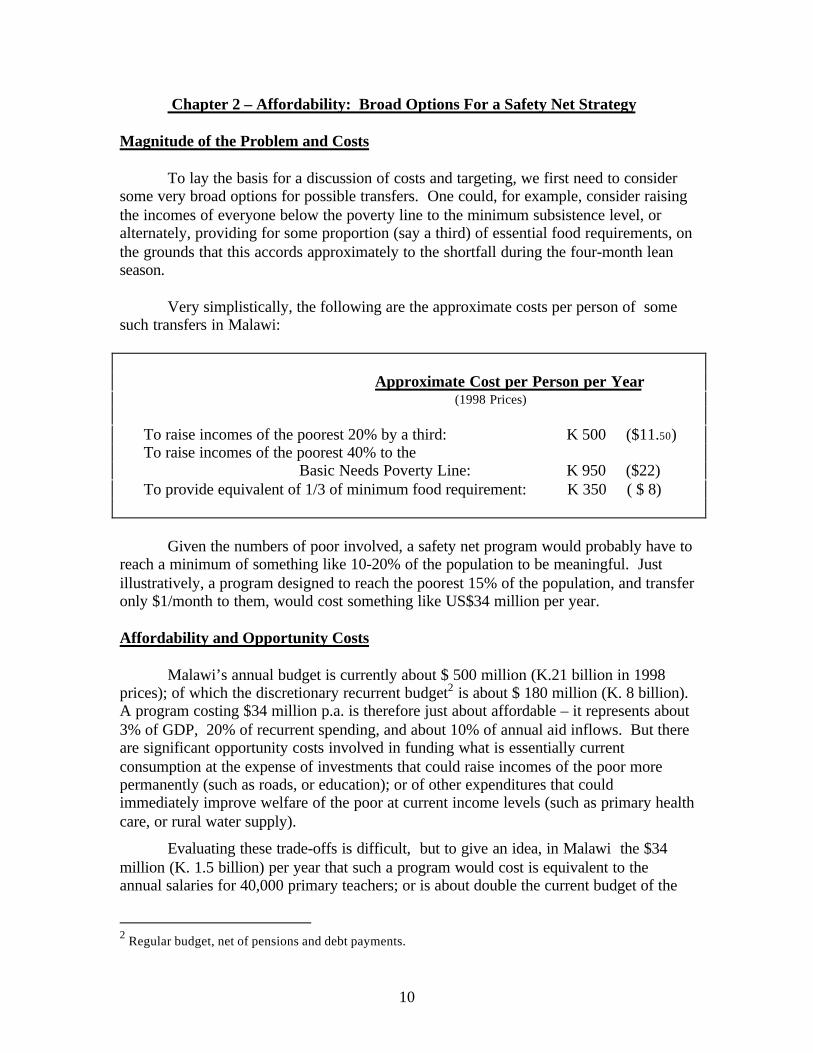
To lay the basis for a discussion of costs and targeting, we first need to considersome very broad options for possible transfers. One could, for example, consider raisingthe incomes of everyone below the poverty line to the minimum subsistence level, oralternately, providing for some proportion (say a third) of essential food requirements, onthe grounds that this accords approximately to the shortfall during the four-month leanseason.
Very simplistically, the following are the approximate costs per person of somesuch transfers in Malawi:
Approximate Cost per Person per Year(1998 Prices)
To raise incomes of the poorest 20% by a third: K 500 ($11.50)To raise incomes of the poorest 40% to the
Basic Needs Poverty Line: K 950 ($22)To provide equivalent of 1/3 of minimum food requirement: K 350 ( $ 8)
Given the numbers of poor involved, a safety net program would probably have toreach a minimum of something like 10-20% of the population to be meaningful. Justillustratively, a program designed to reach the poorest 15% of the population, and transferonly $1/month to them, would cost something like US$34 million per year.
Affordability and Opportunity Costs
Malawi’s annual budget is currently about $ 500 million (K.21 billion in 1998prices); of which the discretionary recurrent budget2 is about $ 180 million (K. 8 billion).A program costing $34 million p.a. is therefore just about affordable – it represents about3% of GDP, 20% of recurrent spending, and about 10% of annual aid inflows. But thereare significant opportunity costs involved in funding what is essentially currentconsumption at the expense of investments that could raise incomes of the poor morepermanently (such as roads, or education); or of other expenditures that couldimmediately improve welfare of the poor at current income levels (such as primary healthcare, or rural water supply).
Evaluating these trade-offs is difficult, but to give an idea, in Malawi the $34million (K. 1.5 billion) per year that such a program would cost is equivalent to theannual salaries for 40,000 primary teachers; or is about double the current budget of the
2 Regular budget, net of pensions and debt payments.

11
Ministry of Health. This raises some fundamental questions: as to whether eithertaxpayers or donors are willing to fund such transfers; and if so, at the expense of whatother programs they might otherwise finance?
Conversely, we might want to ask what, for a given amount of expenditureallocated to safety nets, Malawi would be able to finance in the way of transfers,subsidies, and the like. Suppose 1% of GDP were to be allocated to a transfer program,this would finance a transfer of K.190 ($4.50) per capita to the poorest 20% of thepopulation (representing about 10% of the minimum consumption income), oralternately provide 12% of the population with the equivalent of four months’of maize.Table 4 illustrates very roughly the amount that could be transferred for a givenallocation of expenditures:
Table 4 - Illustrative Transfers Possible for a Given Level of Funding(1998 Prices)
5% of 1% of 2% of Discretionary 10% of GDP GDP Public Aid
Expenditure ResourcesAmount of per capita K 190 K 400 K 300 K 560 transfer to poorest 20% (a) ($4.60) ($9.30) ($7.00) ($13.10)
Share of population provided 13% 25% 19% 35% w/ 4 months worth of food (b)
Amount of universal K 1.80 K 3.60 K 2.65 K 5.00 Maize subsidy (MK/kg.) (c)
Quantity of free fertilizer 13 kg. 25 kg. 19 kg. 34 kg. Per household (d)
(a) Assuming efficiency of 75%; (b) Assuming $8 per capita, and 75% efficiency; (c) Assumingmarketed maize of 300,000 mT. subject to subsidy; (d) Assuming costs of K.800/50kg., 2.3 millionHH, and 15% administrative costs.
There is, of course, no way of saying what the ‘right’ amount to spend on safetynets is. However it seems clear, given the critical need for investment in long-termgrowth3, that it should be strictly limited. At the same time, the pervasive poverty, andthe fact that much of public expenditure does not reach the poor, argues for allocatingsome proportion of spending to direct transfers. To some extent spending on safety netsshould be seen as an investment in future productivity and human capital, rather than apure consumption cost. The opportunity cost problem can also be reduced by selectinginstruments (like public works) that contribute to lifting the constraints to income growthin the longer run. Part of the answer to how much it makes sense to spend depends onwhat objectives decision-makers want to achieve with safety nets, and how wide acoverage of the population is desired. This is the subject of the next chapter.
3 For example– for education (currently there are only secondary school places for about 7% of thoseleaving primary school), and infrastructure (only 4% of the population currently has electricity)..

12
Chapter 3 – Objectives and Target Groups
3.1 The Debate Over Objectives
There is much debate over what the objectives of a safety net - and of socialprotection measures more broadly - should be in Malawi. Table 5 summarizes thetypography of safety net objectives that one can think of.
Table 5 - Consumption Risks and Possible Objectives of a Safety Net in Malawi
Type of Risk Examples Affected groupsFrequency/timescale
Numbersaffected
Appropriateresponse
Drought
Whole regions, mostagriculturedependenthouseholdsDisasters, shocks
Flood Whole communities
Occasional,transitory/up to12 months
Up to100% inaffected areas
Disaster relief (food,inputs, cash) in shortterm, diversificationand preparednessmeasures in longerterm
Severe rural“lean period”food stress
Labour or landscarce smallholders
Chronic/2-4months eachyear
2-3 million
Productivityenhancements, landtenure measures,micro-credit/IGAs,alternativeemployment, self-targeting safety nets
Structural failuresof development,(deepened byprecipitousadjustmentshocks)
Growing urbanpoverty
Urban unemployed,working poor.
Chronic/year-round
120,000?,growing
Employment,microcredit, self-targeting safety nets.
Personaladversity
Disability,disease (AIDS),accident, crime
Disabled, elderly ororphans withoutcarers
Chronic/year-round
600,000?,growing
Cash and/or foodtransfers
Source: [P.White]
Following substantial public consultation, two views emerged: the general viewof Malawian civil society is that given the depth of poverty a fairly widespread programof support – say for bottom third of the population – is probably justified. Among someMalawian leaders, donors and international NGOs, on the other hand, there was moreconcern that a widespread program would create dependency, and undermine otherdevelopment initiatives, and that therefore a more selective approach should be taken.
Whether this is true or not depends in part on what view policy-makers take ofwhether chronic poverty is transitory or permanent - that is, on whether very poorhouseholds could realistically be expected to rise out of poverty as a result of otherinterventions, and/or of broad economic growth, in the foreseeable future. It alsodepends on the proportion of poor households who remain among the chronically poor on

13
a continuous basis – as opposed to ‘cycling’ in and out of poverty year to year – althoughunfortunately there is no data available to allow us to assess this in Malawi.
Another aspect of the debate is whether safety nets should be designed primarilyto address shocks (eg. drought years), or to raise incomes to relieve chronic poverty moregenerally. The answer to this depends how tightly focused society wants safety nets to beon the very poorest; as opposed to serving as a more general insurance policy for abroader spectrum of the population.
Chapter 2 identified a number of important risks faced by the poor: largeseasonal food price rises, drought, economic shocks, and AIDS. The second-roundquestion becomes how can these risks be insured against cost-effectively, and whichshould be insured against first? Part of the problem is measuring them in way that ismeaningful for designing public interventions. All of the risks outlined above contributeto variance in consumption, but without knowing how much each contributes, we don’tknow whether it is better, as a social protection measure, to devote public resources to –for example – financing agricultural credit (to allow farmers to purchase agriculturalinputs), or to smooth inter-seasonal price variation by providing a targeted foodgrainsubsidy in the lean season.
These issues are still under discussion, but a consensus seems to be emergingthat:
(a) as far as possible safety nets in Malawi need to be productivity-enhancing (forexample in the form of public works, or agricultural inputs supplementation),rather than pure transfers – both to reduce the risk of dependency, and tomaximize long-term income growth among the poor; and,
(b) recognizing that the question of objectives is complex, and is not going to beresolved overnight, that in the first instance, safety nets should be selective oflimited sub-groups that everyone can agree are needy, while in parallel the policydebate over objectives can continue, further data can be gathered, and experiencegained in piloting approaches.
3.2. Possible Target Groups
Who are the logical beneficiaries of a safety net program in Malawi? and howcould one target them?
One of the central questions surrounding any safety net program is who thebeneficiaries should be. In Malawi, one can think of three broad categories of targetgroups:
• There are “The Poor” broadly-defined ; that is, those living below some given povertyline - say the bottom two income deciles, or below the Basic Needs poverty line;
14
• There are the chronically poor or food deficit; for example the effectively landless;those without food for four months each year; or those in particularly food-insecuregeographical areas;
• And finally there are selected particularly vulnerable groups; those who are notcapable of looking after themselves -- the elderly, the infirm, and orphans, areobvious examples.
All present problems with respect to targeting. The problem with targeting “thepoor” generally is that they are too large and undifferentiated a group. As we have seenearlier, depending on the poverty line one chooses, between 30 and 65% of thepopulation are in absolute poverty. Also, the measurement of income is extremelydifficult, and the cut-off point will always be arbitrary -- raising questions such as “whyis one household included, and not another?”
In considering safety nets, it is often useful to consider some sub-group of theultra-poor. It is not clear whether it makes sense to talk of the “ultra-poor” in Malawi –after all, even the poor broadly defined, with incomes of less than $50 per capita p.a.,would be among the ultra-poor in most other countries. Nonetheless, as Table 2illustrated, the average per capita income of the bottom decile is less than half that ofpeople in the next decile, and only a quarter of that among the poor generally – so thereis a group out there that are significantly worse off than others – the question is whetherone can effectively identify them.
Geographical Targeting – The Famine Early Warning System (FEWS) ranksareas by foodcrop production and other indicators. While highly imperfect, it provides asurrogate measure of welfare on a geographical basis. According to the 1998 FEWSdata there are some 33 EPAs 4 representing about a fifth of the country (with a populationof 1.6 million people) with less than the minimum requirement of 1800 kcals. per capita,and the bottom six (representing about 500,000 people) providing less than half of theirfood requirements.
The problem with targeting geographically is one of exclusion and inclusion. Ifwe direct benefits only to “poor” areas - as has been done under most of the food-basedprograms in Malawi - then large numbers of the poor will be left out, as there are, forexample, many food-deficit households in non-food-deficit areas. Conversely, whiletargeting at poor areas is simple, and cheaper, in any “poor” area in Malawi there will belarge numbers of non-poor, and targeting geographically will lead to transferringresources to them at the expense of coverage of others, who are truly poor, elsewhere.
Finally, the problem with selecting more narrow groups - for example the ultra-poor, or members of female-headed households - is the administrative burden ofidentifying and targeting them individually. (Everyone may suddenly become anorphan, or a female-headed household, if benefits are only directed at them.)
4 Administrative subdivisions with a typical population of 50-100,000.
15
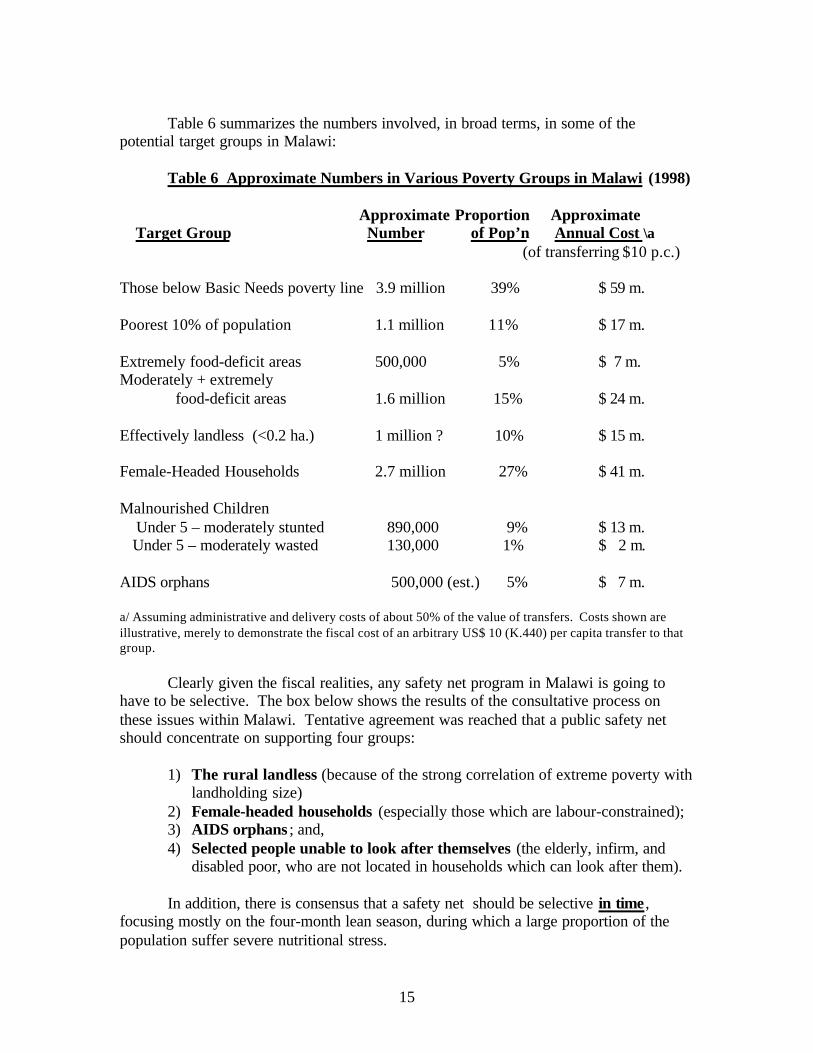
Table 6 summarizes the numbers involved, in broad terms, in some of thepotential target groups in Malawi:
Table 6 Approximate Numbers in Various Poverty Groups in Malawi (1998)
Approximate Proportion Approximate Target Group Number of Pop’n Annual Cost \a
(of transferring $10 p.c.)
Those below Basic Needs poverty line 3.9 million 39% $ 59 m.
Poorest 10% of population 1.1 million 11% $ 17 m.
Extremely food-deficit areas 500,000 5% $ 7 m.Moderately + extremely food-deficit areas 1.6 million 15% $ 24 m.
Effectively landless (<0.2 ha.) 1 million ? 10% $ 15 m.
Female-Headed Households 2.7 million 27% $ 41 m.
Malnourished Children Under 5 – moderately stunted 890,000 9% $ 13 m. Under 5 – moderately wasted 130,000 1% $ 2 m.
AIDS orphans 500,000 (est.) 5% $ 7 m.
a/ Assuming administrative and delivery costs of about 50% of the value of transfers. Costs shown areillustrative, merely to demonstrate the fiscal cost of an arbitrary US$ 10 (K.440) per capita transfer to thatgroup.
Clearly given the fiscal realities, any safety net program in Malawi is going tohave to be selective. The box below shows the results of the consultative process onthese issues within Malawi. Tentative agreement was reached that a public safety netshould concentrate on supporting four groups:
1) The rural landless (because of the strong correlation of extreme poverty withlandholding size)
2) Female-headed households (especially those which are labour-constrained);3) AIDS orphans ; and,4) Selected people unable to look after themselves (the elderly, infirm, and
disabled poor, who are not located in households which can look after them).
In addition, there is consensus that a safety net should be selective in time ,focusing mostly on the four-month lean season, during which a large proportion of thepopulation suffer severe nutritional stress.
16
Box 1 – What Should the Objective of a Safety Net Be? - Voices from the ConsultativeProcess
The following are quotes from community and religious leaders, NGO workers, officials, and villagersthemselves, that emerged during the rounds of consultative meetings.
“Hunger is the greatest single medical problem faced in villages. The need for safety nets is self-evident” - (NGO doctor working at the village level)
“The need and desire is there (for a safety net) but it’s useless, unless you link it with other efforts toraise incomes”
“Let’s accept upfront that this is not sustainable. That it needs to be there for the long run. We shouldplan for 20-30 years. The poor will still be there” - Donor representative
“What do the poor themselves want? They would say food.” - field worker
“The object is to reduce the level of real hunger during the four months of the year”
“Targeting female-headed households is almost impossible, but we can target women.”
“ Elderly (single) men, the sick, and chronically poor [should be supported]” – religious representative
“The link with landholding size is so clear. So targeting should be geographical , by land scarcity.” –local official
“In the first year go for orphans, female-headed households, or similar readily-identifiable groups thateveryone agrees should benefit. In parallel work on better registering, identifying, selection processes,to expand in second year.”
“ We probably can’t go for all 4 million poor in the first stage; possibly go for the first 2 million – thepoorest 20% initially – focus on geographically poor areas; the elderly women, orphans.”
“For a mass program, it either has to be self-selection, or no targeting at all” – NGO representative
“ The people at the grassroots can tell you who the poor are, therefore a collaborative process is veryimportant; The poor need to be the ones to decide.” – women’s organization representative
“ About selectivitiy: the chiefs, the churches, and NGOs should all be able to do this – I know there willbe bias, but get them together and they should present the results in a public meeting.”
“…It will be DIFFICULT to do, but some kind of public validation (eg. group of chiefs, church elders,etc.) is needed.”
“The moment you try to identify(individual) households you are doomed”
“Geographical targeting will leave [some people ] out? Anything we do will leave some people out!.”
“WHO IS TO IMPLEMENT is the most important question. For example a task force in the District –church, NGOs, government to oversee (don’t give it to only one or two agencies). We need to invest inimproving such structures.”

17
3.3 Political and Social Considerations
A number of social and political concerns come into play when the question ofsafety nets is raised in Malawi. Firstly, it is not clear that there is a consensus, neither atthe political level, nor among society as a whole, on the desirability of large-scaletransfers to the poor under a safety net. There are concerns with the dependency thatsuch transfers might create (especially when there is a hope that such poverty istemporary, and will that many of the poor will move out of poverty with developmentand hard work). There are concerns with respect to targeting, which is understandablyseen as politically sensitive, difficult, and potentially divisive. In this regard, one oftenhears the sentiment expressed that “everyone is poor in Malawi”, and therefore apreference for universal subsidies.
A good example is the experience in the last several years with Starter Packs (seeChapter 5), when despite a technical recognition that it was wasteful to provide freefertilizer to 100% of the population, there was strong political pressure for a universalprogram. Although after 3 years this has been acknowledged as being unaffordable, anda targeted version is being piloted in 2000/01. Similarly there is continuing pressure insome quarters to re-introduce universal fertilizer ands maize subsidies, despite the factthat they would primarily benefit the non-poor.
The political economy of these decisions needs to be acknowledged. There is nodoubt that universal programs enjoy wider popular and political support than those thatare narrowly focused. However they are very expensive, and in the case of Malawi areunlikely to be fiscally sustainable. Programs that support very specific groups that arewidely accepted to be deserving of help (eg. orphans, the disabled) will prove morepolitically palatable than those targeted at the poor generally [See Box].
Informal Safety Nets and Social Protection. One consequence of being a verypoor country is that the overlap with informal safety nets is less of an issue than it iselsewhere. While there is little hard data available, a recent review [Tsoka/Devereux]concluded that transfers represent a minor part of the incomes of poor households. Thisis in part because many people are uniformly poor, and have little to share; becauserelatively few are engaged in formal employment compared to elsewhere in Africa; and,more recently, because urban dwellers have had their purchasing power eroded byinflation, and are thus less willing (or able) to provide transfers to relatives.
This is consistent with findings elsewhere [Murdoch], but nonetheless, there issubstantial informal borrowing from friends and relatives in times of need, and transfersof fertilizer and maize from the urban employed (and large landholders) to their ruralrelatives – which are almost certainly under-reported in the survey work. In designingpublic safety net interventions one wants to be careful not to displace these with publictransfers unnecessarily. However given the breadth and depth of poverty in Malawi, therisk of displacing some redistributive private transfers is probably outweighed by the netgain, especially since most transfers take place from the poor to the poor.
18
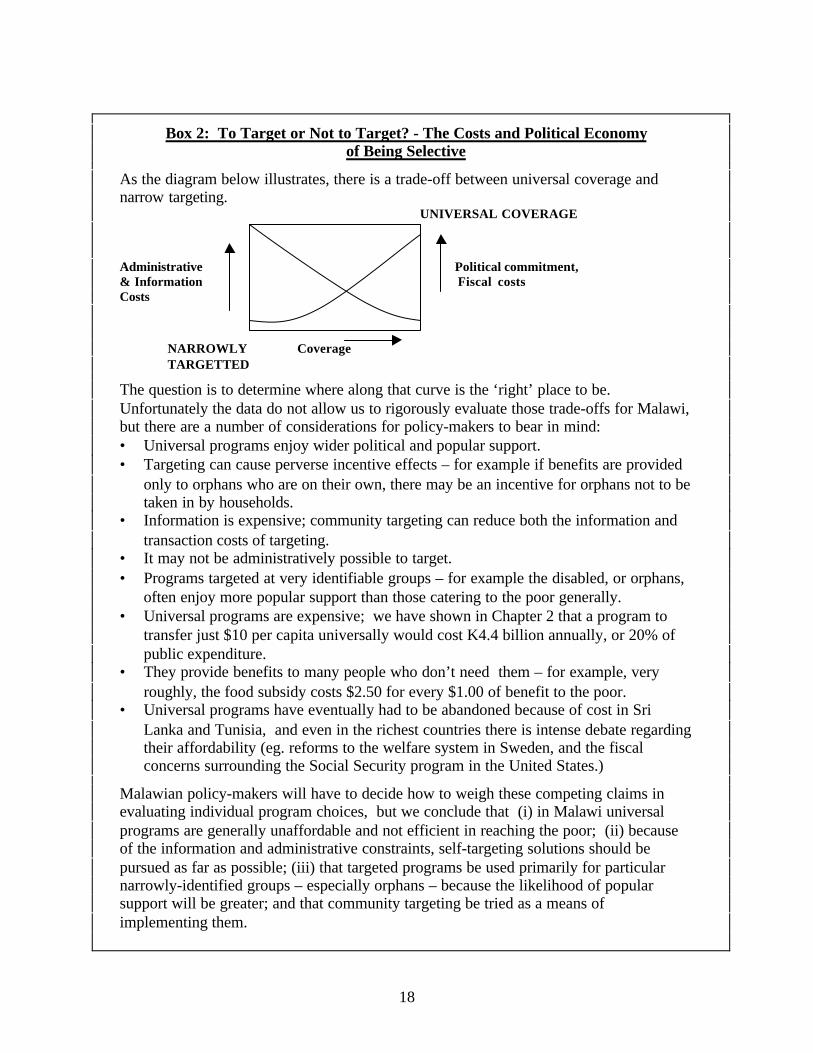
Box 2: To Target or Not to Target? - The Costs and Political Economyof Being Selective
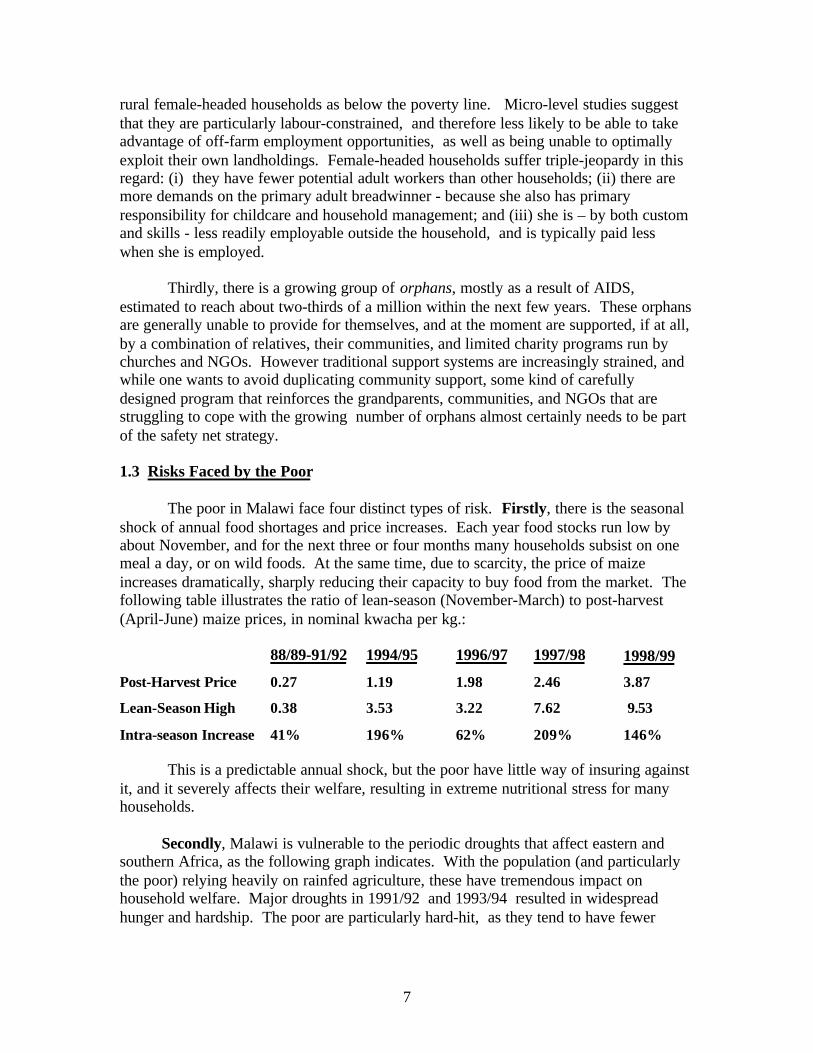
As the diagram below illustrates, there is a trade-off between universal coverage andnarrow targeting.
UNIVERSAL COVERAGE
Administrative Political commitment,& Information Fiscal costs Costs
NARROWLY CoverageTARGETTED
The question is to determine where along that curve is the ‘right’ place to be.Unfortunately the data do not allow us to rigorously evaluate those trade-offs for Malawi,but there are a number of considerations for policy-makers to bear in mind:• Universal programs enjoy wider political and popular support.• Targeting can cause perverse incentive effects – for example if benefits are provided
only to orphans who are on their own, there may be an incentive for orphans not to betaken in by households.
• Information is expensive; community targeting can reduce both the information andtransaction costs of targeting.
• It may not be administratively possible to target.• Programs targeted at very identifiable groups – for example the disabled, or orphans,
often enjoy more popular support than those catering to the poor generally.• Universal programs are expensive; we have shown in Chapter 2 that a program to
transfer just $10 per capita universally would cost K4.4 billion annually, or 20% ofpublic expenditure.
• They provide benefits to many people who don’t need them – for example, veryroughly, the food subsidy costs $2.50 for every $1.00 of benefit to the poor.
• Universal programs have eventually had to be abandoned because of cost in SriLanka and Tunisia, and even in the richest countries there is intense debate regardingtheir affordability (eg. reforms to the welfare system in Sweden, and the fiscalconcerns surrounding the Social Security program in the United States.)
Malawian policy-makers will have to decide how to weigh these competing claims inevaluating individual program choices, but we conclude that (i) in Malawi universalprograms are generally unaffordable and not efficient in reaching the poor; (ii) becauseof the information and administrative constraints, self-targeting solutions should bepursued as far as possible; (iii) that targeted programs be used primarily for particularnarrowly-identified groups – especially orphans – because the likelihood of popularsupport will be greater; and that community targeting be tried as a means ofimplementing them.

19
Chapter 4 - Existing Safety Net Programs
Despite not having a defined safety net program in place, significant resourceshave been devoted to transfers of one type or another – mostly as the result of individualdonor programs. Various short-term food distribution programs have been implemented,originally justified in response to droughts, but increasingly as a permanent fixture. Infact substantial amounts of food aid have been distributed in both drought and non-drought years recently. Various public employment and food-for-work schemes havebeen mounted by Government , donors, and NGOs; as well as a number of initiatives todistribute free seed and fertilizer on a large scale, on the grounds that it is more cost-effective to provide the poor with agricultural inputs than with food. In aggregate weestimate Malawi spent something like US$ 68 million on various transfer programs in1998/99.
Table 7 – Programs On-Going in 1998/99 or Committed to for 1999/2000 Average
Direct Estimated Transfer Program Expenditure Beneficiaries Coverage /Participant Agency
Public Works Program $ 4 million (e) 50,000 250,000 K.950 MASAF
Food-for-Work $ 3 million 40,000 200,000 K.1200 WFP/various
Emergency Safety Net $10 million 215,000 1.1 million K.1250 WFP/MoH Program (food distribution & nutrition)
School Feeding $ 1.5 million 25,000 75,000 K 2000 WFP
Starter Packs $ 27 million 2.4 million 8 million (e) K. 400 GoM/Various
Assistance to $ 3.2 m. 43,000 86,700 n/a WFP Malnourished (p)
Disaster Mitigation (p) $ 4.7 million est.20-30,000 100,000+ n/a WFP
Public Employment $ 5 million 20,000 + 100,000+ K.4,000 EU Program (p)
Note: Estimates in Table 1 are approximations only on the basis of information provided by variousagencies, with varying degrees of accuracy, and bases that are not necessarily comparable with oneanother. (e) = estimated. (p) = proposed new program in 1999/2000. Exchange rate = K.44 /US$.
Notes on Table 7:PWP (MASAF) – levels of planned expenditure and employment are unclear – varying sources provideddifferent estimates. Last year 2.8 million person-days (= approx. 45,000 persons), assumption is this yearslightly larger. Calculations here assume avg. person employed 60 days (= 3 months).Assistance to Malnourished – replaces this year’s food distribution program. Expenditure is for year 2000.Nationwide, covers primarily feeding at Nutrition Rehabilitation Centres, plus maize distribution to womenfrom affected HHs.Food-for-Work. Expenditure is for 2000. Wage 2.5 kg. maize/day, here assumes avg. employment of 60days/beneficiary. Program plans 5.2million person-days over 2 years; estimate 40,000 beneficiaries in first year,rising to 75,000 in second year.
20
School Feeding expenditure is for CY 2000. Plan is for 12,000 children in 1999, rising to 80,000 in 2000.Coverage assumes build-up in current year. Provides one meal per school day to all students at coveredschools, plus 25 kg. maize/month to girl students to take home. (est. value at MK. 250/month * 10 months =2,500/HH) Assumes direct beneficiaries of 25,000, plus HH members of 12,500 female students.Disaster Mitigation – program scope and modalities not yet clear. Intended to replace this year’s Safety net fooddistribution program – understood to involve free distribution of food up front to disaster-affected HHs,followed by food-for-work type distribution on basis of Coverage very rough estimate only.Public Employment Prog. – Proposed expenditure of Euro 15 million over 2.5 years, and coverage of 48,000,with effectively full-time employment. Assumption here is of moderate build-up in first year. Plan is for transferof K5,500 per HH.Starter Packs - In absence of other decisions, assumes same design and coverage as this year. Assumes value ofpack at US$ 9 (approx. K.400); and value of incremental output of approx. US$ 25 (K 1,100).
Public Works Program. The main employment program, operated by theMalawi Social Action Fund, provides transfers to the poor, self-targeted on the basis ofa low wage rate. The program is a good start, but on the current scale (about 40,000households) it is not large enough to constitute a wide-scale safety net. However itprovides a basis for expansion, providing issues of wage rate, seasonality, and absorptivecapacity can be worked out (see section 5.1 below).
Food-for-Work. The main food-for-work program pays participants 2.5 kg. perday of maize, using food aid provided by WFP. Various forms of food for work (FFW)are also being operated by NGOs and Gtz, but total coverage is limited, having averagedsomething like 65,000 persons annually in recent years, and furthermore is generallyrestricted geographically, to about 10% of the country.
Like the public works program, it is self-targeting on the basis of a workrequirement and relatively low wage rate. The advantage is that food payments are moreselective of women (and probably of the poorest) than are cash, and, due to the weaknessof markets, food is simply not available in some parts of Malawi at some times of theyear. The drawback is that the logistics of moving food around the country, and ofpaying in food, is cumbersome and expensive. FFW initiatives in Malawi have alwaysbeen plagued by logistical problems, with the result that coverage has generally beenlower than was intended.
Free Food Distribution. The most recent WFP food transfer program distributedmaize to 100,000 households in 1998/99, identified on the basis of having at least onemalnourished child. It appears to have been successful in targeting the poor, butcoverage was very limited, with large exclusion errors. Part of the problem is that eachfamily was given 50 kg. of maize per month, or almost the entire food requirement –severely limiting the number of households that could be covered. Also the program islimited geographically to about a third of the country.
While it requires strengthening in the areas of administration, and ease oftargeting, this program (or something like it) holds promise, but at the moment is toosmall to be meaningful as a safety net. Unfortunately this program was not planned to berepeated in the 1999/2000 season – however it is the latest in a long series of fooddistribution programs, and it is almost certain that some similar effort will continue toexist in the future. Part of the problem is that a uniform approach is not sustained on ayear-to-year basis

21
The Starter Pack Initiative (SPI) provided 10 kg. of fertilizer, along with seed,to all smallholder households at a cost of K.1.2 billion ($27 million) in 1998/99, and wasrepeated in 1999/2000. The objectives were in part safety net – in the sense of raisinghousehold food self-sufficiency - and in part to maintain total national-level foodproduction in the face of a 100% fertilizer price increase. The concept was that everyhousehold should be provided with enough inputs to produce an additional 6 weeks’supply of food. While providing agricultural inputs is not an obvious safety net strategy,there is a certain logic to it in a country like Malawi where the vast majority of the poorare subsistence farmers, and the ‘multiplier’ effect - resulting from the poor investingtheir own labour and land in the process – is such that the value of benefits produced isabout double the cost of the inputs given out.
The drawbacks are that the program was universal, so the government spent $27million p.a. on transfers of which only a proportion goes to the poor. While there is anelement of self-targeting due to the small size of the pack, at least half went tohouseholds who either would have bought the fertilizer themselves anyway, and/or forwhom the incremental income effect is negligible. It also does not particularly benefitthe very poorest , who may have no land, or be incapable of farming due to labourconstraints or disability.
New Programs : In addition to these established programs, there is a schoolfeeding program, launched in 1996 , but still in pilot form, covering only about 24,000out of 3 million primary students (see Chapter 5); and a new intensive public worksprogram , funded by the European Union, designed to provide intensive cash injections(about four times the level of per capita transfer under the existing PWP program) to thepoor in 6 Districts.
Institutional Issues
As in many countries, there is no clear institutional home for safety net issues.While implementation responsibility clearly falls to the line agencies, there is no centralbody with a clear mandate to set the government’s safety net strategy – for example todetermine who the government wants to target, what scale of transfers, or choice ofprograms it wishes to implement. Responsibility nominally falls under the NationalEconomic Council. While this is an appropriate home, NEC has historically had onlylimited power to direct the design of interventions, and to co-ordinate programs orfinancing. Lacking a clear institutional home, it has also been difficult to engage thepolitical leadership on such intensely political questions as what degree of redistributionthe society wants to pursue, and who the beneficiaries should be.
In this vacuum, donors have been designing and implementing programs inisolation. In the absence of any central strategy, bilateral deals are made betweenindividual Ministries, donors, and NGOs, resulting in an ad hoc collection of programswith limited impact.

22
For example, there are various Food-for-Work and employment programs fundedby WFP, Gtz, CPAR, CARE, the World Food Program, the Malawi Social Action Fund,and a new employment scheme proposed by the European Union – each with differentdesign, pay rates, and incentives; each doing different analytical and evaluation work;and each proposing different methodologies and modalities with respect to targeting,contracting, community participation. 5
This proliferation of programs over-stretches limited administrative capacity,dilutes impact, and confuses signals and incentives. It also results in uncoordinatedtargeting – for example programs may cover some target households (or areas, or groupsof beneficiaries) several times, while others are not reached at all.
Another concern is that programs are launched by donors, and then onlysustained for a few years. In the past 5 or 6 years there have been about 20 differentsafety net programs of various kinds, many of which don’t last more than a few years.This stop-and-start approach not only has little impact on poverty, but, perhaps equallyimportantly, results in a failure to build institutional capacity to deliver benefits.In countries like Malawi, where managerial and administrative capacity is at a premium,establishing simple, repetitive systems that function efficiently is particularly important.
Although it is hard to quantify the costs of these duplicating programs, and of thestop-start approach, it seems almost certain that developing a simple, unified nationalsafety net program would be both cheaper, and more effective than the current approach.
5 Note – all of these ongoing programs are food-for-work, with the exception of the MASAF PWP, and
the new EU program, which is just becoming operational.
23
Chapter 5 - Evaluation of Options5.1 Public Works
Public works provides perhaps the single most attractive option for safety nettransfers in Malawi. The benefits are that it is one of the few self-targeting instrumentsavailable, and thus gets around the difficult problem of trying to target transfers; it alsohas the capacity, if well-managed, to create productive infrastructure; and, because thereis a work requirement, it avoids the dependency, and potential distortions, of pure give-away or subsidy programs. The drawbacks are that it is expensive, with about $2 beingspent for every $1 worth of benefit transferred in wages; and is administratively difficultto manage compared to pure transfer schemes. The current program provides a goodbasis for expansion as the core of a nation-wide safety net program, but needs substantialinvestment in expanding the scale, and refining the poverty focus, in order to have thedesired poverty impact
Scale
The current PWP has been running as part of the social fund since 1996.6 Afterhitting a peak of about 2.8 million person-days of employment in 1998 (equivalent toabout 60,000 persons employed)7 , the program then contracted. If public works is toserve a significant safety net function, it would have to employ something like 200,000 to400,000 persons annually (say 12 million person-days of employment - or about 4 timesthe peak level reached in 1998). There are two main constraints to effective expansion:the ready availability of projects, and implementation capacity.
Potential Scale. The question is whether there are enough productive projects toeffectively employ the kind of numbers of poor workers we are aiming for. While theinfrastructure requirements in Malawi are extremely large, the complexities of findingproductive projects, and of managing their implementation, limits what is possible in theshort run. Based on a sample analysis of one District it is estimated that it is potentiallypossible to create 33 million days of employment on public works annually8. [see Geddesand Billings, 1999]. Roads provide the most obvious pool of potential works, but a shiftinto dams, reforestation, and land conservation works is needed to absorb the numbersrequired. However all of these present management and organizational challenges. Theother obvious way of expanding employment is to move from construction of new worksto maintenance, which has historically been underfunded in Malawi.
However to move from the potential to an implementable program will need asignificant investment in developing a pool of project designs. (Developing a shelf of
6 The analysis in this section focuses mostly on the public works scheme operated under the Malawi Social
Action Fund, as it is the only established scheme at this time.7 Assuming an average of 2 months (40 days) per person employed.8 Estimates range up to 192 million person days , if one includes the possibility of contour ridging and
other land conservation works on private land.
24
project proposals will also make it easier to expand employment quickly in droughtyears). The best way of doing this is to integrate the planning of the PWP with thedevelopment of District-level development plans
Another part of the solution clearly has to be to integrate PWP employment intothe wider capital works program of the government. Each year Malawi is spendingsomething like K5.5 billion ($125 million) 9 on public works; if the methodology of low-wage public employment could be extended to a proportion of those works, it wouldcreate a significant pool of income opportunities for the poor.
Malawi cannot afford to be investing in sub-optimal projects, and if significantresources are to be spent through the PWP, then they need to be part of a cost-effectiveinvestment program. At the moment projects are largely chosen by communities, on thebasis of community desires – which while they are legitimate, may in many cases notreflect the most cost-effective infrastructure solution. One thus sees roads being built toareas of limited potential, or which duplicate other routes of access. Bringing theselection of PWP works under the District infrastructure planning process should reduce,if not eliminate, this problem.
An investment of effort is needed in: (i) developing a shelf of project proposals;(ii) examining in more detail the scope for, and constraints to, developing ‘alternative’works such as river training, irrigation dams, and reforestation, and (iii) determining howbest to shift the PWP from a discrete projects-based approach, to a more continuousprogram of maintenance and execution of the Government’s ‘normal’ capital worksprogram, but utilizing PWP-like employment practices.
Implementation Capacity. Currently the PWP is implemented by a fairly adhoc combination of District officials, and MASAF supervisory staff. This has proven aconstraint to implementation, and is one of the reasons for the contraction from 60,000 to20,000 persons employed in 1999. There is a need both to expand local supervisioncapacity (and therefore to tie the program in more closely with local government), and ,equally importantly, to shift to greater use of contractors. The consultants in factcalculated that contractor capacity was binding constraint to expansion of PWP. A majoreffort should be mounted over the next two years to develop a cadre of small localcontractors specializing in the execution of labour-based works.
9 In the 1999/200 budget: K5.3 billion on formation and maintenance of capital assets in the Development
budget, and K.314 million in the Regular Budget.

25
Box 3. Public Works: Some Best Practice Examples from International Experience
Public works have been an important countercyclical intervention in industrial anddeveloping countries. Public works programs have an obvious relevance in many developing andtransitional countries: they are eminently suitable for regional targeting and self-targeting. Theyare also highly suitable for consumption smoothing, and hence very relevant for Malawi. Thescale of public works operations has been as high as 21% of the labor force in Botswana in 1985-86, 13% in Chile in 1983, and 5 % in Honduras in 1990-93. One merit of public works is thatthey are flexible – contracting and expanding as needed.
International experience suggests that the principal design feature that contributes tosuccess of public works programs is a program wage that does not exceed the prevailing marketwage for unskilled labor. In countries where the program wage exceeded the market wage, theprogram crowded out the poorest from participation. A number of countries did manage to keepthe program wage lower than the market wage. Chile ran a public works program in the mid-1980s which maintained the program wage at 70 percent of the minimum wage, which was alsothe market wage for unskilled labor. The program’s outreach was vast covering almost 13 % ofthe Chilean labor force. In India’s Maharashtra Employment Guarantee Scheme – one of thelongest and most celebrated of safety nets in the world – the program wage was equal to theminimum wage. Until 1988, the minimum wage itself was low so that the program could be self-targeted. However, after 1988, the minimum wage, and hence the program wage, was doubled.The increase in program wage resulted in job rationing and erosion of the guarantee of theprogram, apart from reducing its self-targeting character. More recently, in South Korea, a publicworks program was introduced following the financial crisis. The program was maintained atabout 15 percent lower than the market wage; moreover as the market wage fell, the programwas further adjusted downward. The program was very successful in providing short-run transferbenefits to the unemployed poor.
Other design features that rendered India’s MEGS program successful included: timingof the program that synchronizes with the slack agricultural season, provision of employmentwithin 5 km. from the place of residence (a feature that was responsible for enabling manywomen to participate), and a focus of creation of assets that contributed to enhancingagricultural/rural infrastructure (rural roads, irrigation structures, soil conservation, etc.) Further,maintaining a high labor-intensity is important to be effective as a transfer program. The share oflabor in total costs has ranged from 40 to 70 percent in different countries.
Experience also suggests that the implementation of the program should generally avoidtwo weaknesses: poor supervision and poor quality of assets created. If the economic benefitsfrom the assets created are not substantial, the program could prove to be cost-ineffective.Incentives must be built into the program – both to workers and program managers – to ensurequality of assets created. It may also be helpful to ensure appropriate mediation of the NGOs forprotecting the rights of the poor vis-à-vis program managers and contractors.
Sources: K. Subbarao (1997) “Public Works as an Anti-Poverty Program: An Overview of Cross-CountryExperience” American Journal of Agricultural Economics 79(May 1997), p.678-683; M. Ravallion (1991):“Reaching the Rural Poor through Public Employment: Arguments, Evidence, and Lessons from South Asia”World Bank Research Observer 6(2): 153-75.

26
Poverty Impact
The underlying principle of any public-employment scheme is that it should self-select the poor, by paying less than the prevailing market wage (see Box). This ensuresthat in general the non-poor will not be attracted, and that those who can findemployment (or otherwise generate their own incomes) elsewhere will not divert theirlabour to the program. It also increases the probability of employing women, as informalwage rates for women are generally below those for men.
While there is no good analytical study of the impact, it appears that the currentpublic works program is not particularly selective of the poor. The one assessment done[Zgovu, 1998] found little difference in estimated incomes and assets betweenparticipants and non-participants; and site visits suggest that both the poor and non-poorin villages are participating.
Table 8 – Characteristics of Public works Participants and Non-Participants
Participants Non-ParticipantsAverage Landholding (ha.) 0.57 0.54
% Using Fertilizer 26% 33%
Mean Household Expenditure (MK.) 2,388 2,615
% Owning Bicycle 26% 33%
This may in part be due to the fact that, as someone has said, “everyone is poor”in rural Malawi, and that the areas selected are generally already poorer than average.But it also reflects a failure to distinguish between the poor, generally, and those who arevery poor – who would have no alternative source of income without the PWPemployment . However if public works is going to form the core of an affordable safetynet strategy - directed at the bottom 20% of the population (as opposed to the bottom50%) - it is essential that it be targeted. Getting the wage rate right is thus at the center ofany successful PWP effort.
Arguments have been made that the current MASAF PWP wage is both too high,and too low. 10 To be fair, it is difficult to get the wage rate ‘right’ in an inflationary
10 In 1998 the PWP paid 15.80 Kwacha for a four-hour day, as opposed to the reported agricultural daily wage rate ofabout K.24 for a full day’s work. The effective rate is thus almost 50% above the market alternative. Most participantswork on public works sites until about 9:00 or 10:00 a.m., and then go to work on their own farms, or to pursue otherincome opportunities. While this is understandable, it also suggests that PWP employment for many issupplementary, and not providing an essential safety net function. The impression from site visits was that manyparticipants were using the PWP to generate additional cash income, to buy things such as cooking oil, soap, orkerosene. Again, while this is reasonable (and in fact in most countries this would be a legitimate aim of a publicworks program), in the case of Malawi, where the poorest are desperately short of food, the limited transferopportunities must be used to benefit those who would not be able to adequately feed themselves otherwise.

27
environment. The figure below shows the real MASAF PWP wage rate over the pastthree years. This is an issue that needs further quantitative analysis, and if the wage rateproves too high, in the short run the best solution is to allow the real wage rate to beeroded somewhat by inflation. In the longer run, the answer is to add some morepoverty-analysis capacity to the program (see below), with specific responsibility tocarefully monitor and adjust the wage rate.
MASAF wage in mid-1996 Malawi Kwacha
0.00
2.00
4.00
6.00
8.00
10.00
12.00
3rd '96 4th '96 1st '97 2nd '97 3rd '97 4th '97 1st '98 2nd '98 3rd '98 4th '98 1st '99 2nd '99
Quarter
Mal
awi K
wac
ha
Questions have been raised about the ‘fairness’ of the market wage rate, and theappropriateness of comparing the PWP rate with the ganyu (agrarian) wage,11 . There isa widespread belief that ganyu and estate wages are exploitative, and that in this senseputting upward pressure on wage rate is not a bad thing. The PWP wage is after all onlyabout US cents 35 per half-day - low by international norms. But this is a functioninglabour market: for example able-bodied construction workers are paid only K.40(US$0.90) for a full 8-10 hour shift. Much as one may decry the fairness of these wages,the fact is that with an over-abundance of unskilled labour, and very few off-farmemployment opportunities, the market wage has been bid down to a subsistenceminimum, and offering a wage rate above it will inevitably lead to rationing of PWPjobs, and equally to their capture by the non-poorest.
Seasonality. Public Works employment presents some particular challenges inMalawi. There is a long dry season, which lasts from about April till December, duringwhich the majority of rural the population are chronically underemployed. However thetime when the additional income is most needed is in the November-March lean season,when food stocks run low, and market prices increase dramatically. But this is also theperiod when: (a) households most need the labour on their own farms for fieldpreparation , planting, and harvesting; and (b) it is hardest to execute public works,because of the high rainfall. There is thus a fundamental mismatch between when
11 Ganyu is the local term for daily agrarian piece-work. The difficulty is that it covers a multitude of employment
arrangements, including normal daily work on the farms of others, exploitative labour practices, and welfare-type transfers from larger landowners to poor in the same community.
28
families have excess labour available (and works can be easily implemented) , and whenthe poor most need the additional income.
There is no obvious solution to this dilemma. One option is to increase the‘transferability’ of benefits to the lean season by paying in vouchers – either for fertilizeror price discounts on maize (or other foodstuffs) – which can only be redeemed laterduring the lean season.. Given that the poor cannot be expected to forego immediatepayment, vouchers might be in addition to the cash payment; or redeemable eitherimmediately, or for say a 50% greater value later in the season.
The Need for Sustained Transfers. To have a meaningful impact on poverty,transfers need to be sustained over a period of time. The experience with the MaharastraEmployment Guarantee Scheme in India, and other successful public works programs,is that the existence of the expected employment income stream is what has affectedbehaviour, consumption, and ultimately, poverty status. At the moment the PWPschemes in Malawi are ‘project’ based – being implemented in a selected EPA in a givenyear, and the program then moving on to another area, with no expectation of continuedemployment opportunities under the program in that village for several years, if ever.
This is in part an inevitable consequence of the budget constraint, but also reflectsthe ‘project’ approach of the PWP as currently structured. To increase the povertyimpact the PWP needs to : (i) shift towards more continuous employment, eitherthrough a pool of District works, or a shift to maintenance; and (ii) operate on a largerscale, allowing wider continuous coverage.
Institutional Issues. Consideration was given to where a large-scale publicworks program should be located. The conclusion of the consultants was that for the timebeing it should remain under the Social Action Fund, which has an establishedmethodology and institutional capacity. In the longer run however, it needs to beintegrated more deeply into both the District works programs, and into the Government’spublic works program more broadly. Even within the existing framework, there is a needto: (i) shift the focus more from works implementation to employment; (ii) strengthenthe poverty-orientation of the program, adding staff who are responsible for povertyanalysis, examining labour market linkages and wage rate issues, and monitoringquantitatively who is benefiting; and (iii) improve data collection – on numbersemployed, duration, amount of transfers, etc. There is also an urgent need to rationalizethe various public works programs, with respect to coverage and modalities; and to assignresponsibility to a central agency for providing overall direction to the different PWPinitiatives.
5.2 Food and Feeding Programs
As outlined in Chapter 4, there have been a range of large-scale food distributionprograms in the recent past. Originally introduced as relief measures, they haveincreasingly been used as generally welfare programs in non-drought years.
29
There have basically been three incarnations of the same program over the pastfive years. 12 All build on an earlier Vulnerable Group Feeding program, originallyintended to support malnourished children and lactating mothers, but which has evolvedinto a mechanism for distributing large amounts of maize to households, using the factthat they have a malnourished child as a basis for targeting. The most recent version wascalled the Emergency Safety Net Program (ESNP).
Working through an established child-monitoring system, children whose weightfalls below the normal weight-for-age receive supplemental food (Likhuni phala) at thehealth post, and the mother (or father) is entitled to a 50 kg. bag of maize per month,which is distributed on certain days at fixed points on presentation of the child’s growthmonitoring card. While there has not been an analytical survey of beneficiaries, theassessments done suggest that targeting has been good (see Box at the end of thissection); and that there have been beneficial effects on household food security and onthe nutritional status of children.
The program represents perhaps the only successful example of administeredtargeting in Malawi. The problems are its limited coverage, and high costs, due toexcessively large transfers per household. At its peak it has covered about a third of thecountry, and even within those areas, health post officials believe that a large proportionof families with malnourished children are not being captured.
To expand the program nationwide would cost something like $35 million peryear, and even at the recent levels of $10-12 million p.a., is probably not sustainable.Part of the problem is that the amount of the transfer (50 kg. of maize per household permonth, which represents almost the entire basic family food requirement) is too large –equivalent to over K.1,250 ($30) per household. 13
More broadly, a large-scale food transfer program is probably not tenable, andshould not generally form part of the safety net strategy. Apart from the fact that it isunaffordable, there is – except in selected circumstances - little justification for providingfood rather than cash: it undermines local markets, and further retards the developmentof private traders (which are only just beginning to develop competitively in many partsof rural Malawi). In addition, moving food grain around the country in large quantities islogistically difficult, and expensive. There are instances in which providing food isbeneficial (eg. where markets have failed entirely – although continuing to provide foodwill discourage them from ever developing in these areas) – and because there isgenerally a higher probability of control over food being retained by women, andtherefore having a greater impact on family welfare – but more evidence is needed todetermine whether the equity benefits are worth the extra costs.
12 EMOP ---, Drought Relief (1995/96); EMOP 5639, Assistance to Drought Victims (1996/98); and Emergency
Safety Net Operation EMOP 5997/02 (1998/99).]13 Assuming a household receives 50 kg. per month for four months, at an average value of K 6.25 per kg.,plus the value of the likhuni phala and other supplementation

30
It is recognized that large-scale food distribution in drought years still needs to bepart of the safety net strategy, but even this function should increasingly be taken over bythe newly-established National Food Reserve Agency, which can release stocks onto themarket on a commercial basis, leaving free food distribution to be focused on the verypoorest, and/or substituted for by public-employment- or cash-based transfers.
There is nonetheless room for a selective nutrition program, which could eithersupplement PWP transfers, or reach those not able to participate in public works. Thejustification is both that malnutrition is in general a good indicator of poverty status, andthat improving nutrition, especially among the very youngest, is a good investment infuture productivity and long-run poverty-reduction.
The current ESNP has some faults, but provides a credible basis for expansion.In addition there exist a number of promising nutrition supplementation exercises(including micro-nutrient programs, those run through Nutrition Rehabilitation Units athospitals, and various donor-supported programs.) these should be rationalized, andfunding expanded to a single nation-wide program.
The current program can form the core of this expanded program, although itneeds substantial strengthening, primarily by shifting to a more focused emphasis onearly childhood nutrition , and freeing it of the wider food-distribution responsibilities.
A risk is overloading the already strained administrative capacity of health posts,and within the MOHP generally. If the program is to continue, and be expanded, itneeds to be accompanied by a parallel effort to strengthen delivery capacity , or elseconsideration be given to contracting delivery out to NGOs.
Further work is needed to formulate the nation-wide nutrition program. It isrecommended that a quick consultancy be undertaken, and/or a working group ofGovernment and donors be established to: (i) review all existing programs, and (ii) comeup with a proposal for a unified, nation-wide nutrition program, targeted at the poorest.Finally, to be meaningful, there needs to be a shift to more sustained funding andimplementation. The ESNP depends on year-to-year funding from WFP, and otherprograms are dependent on discrete funding from donor projects. In formulating aprogram, the GoM/donor work group needs to also agree on a long-term financing plan.

31
Box 4 . Food Transfers: Lessons from International Experience
Untargeted food transfers – whatever the form – have generally provenunsustainable fiscally. Bangladesh, Egypt, India, Pakistan, Sri Lanka, and Tunisia allinitiated universal food transfers in the early 1950s. The budgetary cost of theprograms gradually increased in all these countries. Thus in early 1980s, the cost of auniversal program was as high as 5 percent of GDP in Sri Lanka and 4 percent inTunisia. When the program was universal, the share of the transfer benefits of thepoor (bottom quintile) was generally low; in many countries the benefits were evenlydistributed across quintile groups.
Many countries began to switch from universal to targeted programs. Thetargeting approach of self-selection was resorted to in Tunisia while Sri Lankaswitched to targeted food stamps. Other countries such as Bangladesh, Honduras,Jamaica, Jordan and Mexico have also switched from universal programs. Apartfrom a lowering of budgetary costs, significant gains in targeting efficiency wereobserved after a switch from universal programs. For example, in Tunisia, the shareof the poorest quintile increased from 8 percent under a universal regime to 25percent after switching to a self-targeted food products program, whereas the cost ofthe program fell from 4 percent to 2 percent of GDP.
Sources: K. Subbarao et. al. Safety Net Programs and Poverty Reduction: Lessons from Cross-Country Experience; H. Alderman and K. Lindert (1998) “The Potential and Limitations of Self-Targeted Food Programs” The World Bank Research Observer, 13(2), pp.213-229.
School Feeding As has been noted in chapter 4, a school feeding program waslaunched in 1995 and is being expanded in the period 1998-2000. The program providesan arrival snack, plus a mid-morning meal of blended food and tinned fish to all childrenin schools in the areas covered, as well as a free distribution of 20 kg. of maize permonth (about 40% of the household food requirement) to the families of all girls thatattend.
At the moment the areas covered are selected on the basis of the vulnerabilityassessment mapping system, and coverage is limited to 24 schools in one district. Theproblem of course is that this is expensive, and it is untargeted within schools. The valueof the meal transfer is $ 19.30 per student per year, while the value of the maize transferto families of girl students is $55.50 per year. This is admittedly a pilot, but nonetheless,the total program cost is a staggering $95.65 per student covered per year.
While the objectives are partly developmental, school feeding does not appear toprovide a cost-effective part of a safety net strategy for Malawi. The main problem isthat it is not selective of the poor, and if coverage were wide enough to cover the poor, itwould be prohibitively expensive.

32
On the one hand, it is impossible to target benefits to the poor within a school –one cannot include some children and exclude others in the same class. And there is noreason to believe that the poor are more likely to be represented in school than among thepopulation as a whole. In fact the reverse is probably true; both an earlier incidencestudy14, and evaluation of the program suggest the poor are less likely to be in schoolthan the non-poor. [see Box ] . On the other hand if the program remains narrowlytargeted geographically, it does not provide benefits to the majority of the poor who livein areas not covered. To expand the program to a level at which it would have ameaningful transfer effect would cost something like $ 36 million p.a.
Table 9 – Costs of An Expanded School Feeding Program
Cost per $ Share of Poor Benefit transferred
Cost Covered Not Covered to Poor
Current Pilot $3.3 m. 1% 99% $5.38 (34,500 children)Poorest Third $36 m. 19% 81% $2.76 Of Country (495,000)Nationwide Version $222 m. 80% 20% $4.50 (3.1 million)
In addition to the direct costs , there is the administrative burden placed onschools, and, as with food for work, the logistical difficulties of moving large quantitiesof food around the country.
While school feeding may well be an effective means of attracting children toschool, and retaining them there, this is an educational objective, not a safety net one. Asa safety net transfer it appears highly cost-ineffective, and even as an educationalintervention, its cost-effectiveness would need to be carefully evaluated vis.a.vis. otherpossible educational uses of funds.
School feeding may in the future have a role in Malawi, but that day is a long wayoff, when the country can afford it. At the moment, given the scarcity of funds, and theneed for a focused approach, we would argue that these resources should be redirected tosupport of a targeted nutrition program.
14 “Who Benefits from Public Education Spending in Malawi?” F.Castro-Leal, The World Bank, 1996.

33
Box 5 – Voices from the Village
School Feeding vs. Free Food Distribution
The following quotes capture the sense among those involved of the relativeeffectiveness of food distribution to families of malnourished children through healthposts (referred to here as the ‘clinic distribution program’, and more recently calledESNP), and the school feeding program.
“The very poor are not attending school [and therefore do not benefit from schoolfeeding…] – they don’t have clothes, they need to do ganyu”- Headmaster
“Concern was often expressed that a significant portion of poor people, thosewithout school-aged children, were not being reached.” - Evaluation survey - Dil
“The more well-to-do have more children in school. Poorer families are morelikely to have children at home during the lean time” – School committeemember.
“Clinic staff, and village chiefs and elders felt [the feeding through health posts]to be a good channel to reach needy children and households. - Evaluation survey– Dil.
“A statement that was heard often was that clinic distribution targets the needyhouseholds more accurately than school distribution.” – WFP evaluation report
“Pressure on clinic staff…were cited as the only negative effects [of the clinicdistribution program]. These were perceived to be surmountable, and outweighedby the positive effects cited above.” Evaluation survey - Dil
5.3 Starter Packs
The provision of agricultural inputs, and especially fertilizer, enjoy a special placein the popular hierarchy of poverty alleviation measures in Malawi. There are a numberof reasons for this: for 30 years the government promoted a system of hybrid maize andsubsidized fertilizer as a means of securing food security among subsistence farmers,who were otherwise prevented from participating in the cash crops market. This systemevolved to the point where a large proportion of the population are now reliant on the useof fertilizer, even though, with the removal of subsidies and successive devaluations, it isonly marginally economic for small farmers growing dryland maize on small plots. Inthis environment there is continuous political and popular pressure to find ways ofproviding fertilizer – either free or subsidized – to smallholder farmers. But the questionis whether perpetuating this system of subsidized fertilizer and maize, through continuingthe subsidy, or giving away small packs of fertilizer, is the best way of providing a safetynet for the poor in Malawi.
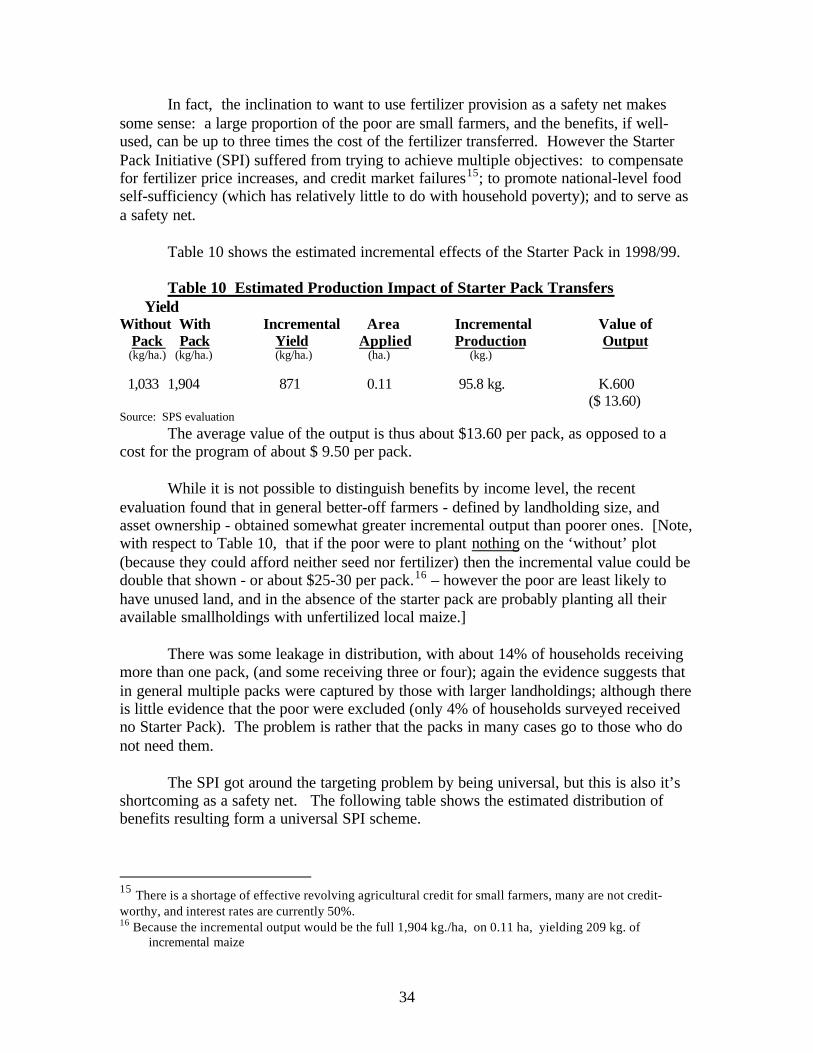
34
In fact, the inclination to want to use fertilizer provision as a safety net makessome sense: a large proportion of the poor are small farmers, and the benefits, if well-used, can be up to three times the cost of the fertilizer transferred. However the StarterPack Initiative (SPI) suffered from trying to achieve multiple objectives: to compensatefor fertilizer price increases, and credit market failures15; to promote national-level foodself-sufficiency (which has relatively little to do with household poverty); and to serve asa safety net.
Table 10 shows the estimated incremental effects of the Starter Pack in 1998/99.
Table 10 Estimated Production Impact of Starter Pack Transfers YieldWithout With Incremental Area Incremental Value of Pack Pack Yield Applied Production Output (kg/ha.) (kg/ha.) (kg/ha.) (ha.) (kg.)
1,033 1,904 871 0.11 95.8 kg. K.600 ($ 13.60)
Source: SPS evaluationThe average value of the output is thus about $13.60 per pack, as opposed to a
cost for the program of about $ 9.50 per pack.
While it is not possible to distinguish benefits by income level, the recentevaluation found that in general better-off farmers - defined by landholding size, andasset ownership - obtained somewhat greater incremental output than poorer ones. [Note,with respect to Table 10, that if the poor were to plant nothing on the ‘without’ plot(because they could afford neither seed nor fertilizer) then the incremental value could bedouble that shown - or about $25-30 per pack.16 – however the poor are least likely tohave unused land, and in the absence of the starter pack are probably planting all theiravailable smallholdings with unfertilized local maize.]
There was some leakage in distribution, with about 14% of households receivingmore than one pack, (and some receiving three or four); again the evidence suggests thatin general multiple packs were captured by those with larger landholdings; although thereis little evidence that the poor were excluded (only 4% of households surveyed receivedno Starter Pack). The problem is rather that the packs in many cases go to those who donot need them.
The SPI got around the targeting problem by being universal, but this is also it’sshortcoming as a safety net. The following table shows the estimated distribution ofbenefits resulting form a universal SPI scheme.
15 There is a shortage of effective revolving agricultural credit for small farmers, many are not credit-worthy, and interest rates are currently 50%.16 Because the incremental output would be the full 1,904 kg./ha, on 0.11 ha, yielding 209 kg. of
incremental maize

35
Non-poor Middle Poor Poorest
Distribution of Packs (,000s) 1,325 866 340
Value of Output $ 18 m. $ 11.8 m. $ 4.6 m.
Cost $14.1 m. $9.2 m. $3.6 m.
The cost per dollar of benefit delivered to the poor and the poorest together isabout $1.65; while the cost per dollar of benefit to the poorest is $5.86. (See annex forincidence assumptions).
Universality of course eases the administrative burden and this is widelyacknowledged to have been one of the reasons for the program’s initial success ; and italso ensures wide popular and political support. Against this has to be weighed the costsof an untargeted program. Ultimately of course the problem is that Malawi cannot affordto run a program on the scale of costs of the current SPI indefinitely. Alternatives mightinclude a program targeted at the bottom 50% of smallholders, (which we estimate mightcost $ 11 million p.a.), or at the bottom 25% ($ 6 million p.a.)17.
So while the SPI is a potentially attractive transfer mechanism for some of thepoor, it suffers from the following drawbacks:
• It is expensive, Malawi is spending $27 million p.a, of which perhaps two-thirds isgoing to the non-poor, or at least to groups other than the poorest;
• It perpetuates a sense of dependency on the part of the population generally – wellbeyond the poor;
• It continues to promote reliance on fertilizer-hybrid maize, which whileunderstandable in the short run, retards the diversification that is ultimately going tohave to be part of a poverty alleviation strategy for rural Malawi.
Thus while it has some attractions, if the objective of a safety net is to tightlyfocus scarce resources on those who most need them, SPI is not the instrument to usewithout substantially tighter targeting. Confronted with the fiscal constraint, thegovernment has subsequently decided to try a targeted version of the program. In 200/01funding has been substantially reduced (to a total of about US$ 11 million equivalent),and district administrators and leaders have been given an allocation about half of theprevious year’s, with responsibility responsibility for identifying a list of the pooresthouseholds to receive starter packs.
We would not, however, entirely rule out some form of directed fertilizer subsidyin the long run as a safety net intervention – provided it can be directed only at the poorfor basic food production. One possibility may be to link qualification for free benefitswith participation in some other poverty-related program – such as public works, or the
17 Assuming very roughly overheads of 20% for targeting the bottom half of the population, and greater
proportional overheads (of 25%) for a smaller program targeting the bottom quarter.

36
child nutrition program. Another, which requires further work, is to shift to a fertilizer-voucher-for-work scheme, perhaps tied in with the proposed large scale PWP expansion.
5.4 Subsidies
It is estimated that Malawi spent about MK 855 million ($19.5 million) on maizesubsidies in 1998/9918; the amount was particularly large that year, as the governmenttried to protect consumers from the effect of a major devaluation. While this no doubthas some impact on lean season consumption of the poor, there is little justification for anuntargeted subsidy as a safety net measure: it is costly, it undermines the development ofmarkets, and , most importantly, it does not primarily benefit the poor.
There is no good survey evidence on the incidence of the subsidy, but certainly atthe subsidized price there are significant problems of equity: of well-connected or well-to-do customers getting preferential access to maize, and of subsidized maize beingbought by traders for either resale at the market price, or in Mozambique or Zambia atmore realistic market prices. At any rate, there is no evidence that the poor getpreferential access to the subsidized maize, and quite a lot that they have less access to it.
One of the problems in Malawi has been the absence of an effectively functioningfood grain market (and this is one of the reasons for the failure of inter-seasonal storagemediation, and hence the excessively large price swings that tax the poor.). Theevolution of such markets will be undermined , however, as long as there is arbitraryprice and supply intervention by the government and ADMARC.
Thus while the inclination to want to control the price is politicallyunderstandable, attempts to do so, in an increasingly open economy are fraught withdifficulties:
• The government is not a large enough player, nor can it afford to be, to have morethan a moderating influence on prices;
• With increasingly open borders, the price will eventually equilibriate at importparity (in times of shortage) or export parity (in times of surplus) , whatever thegovernment tries to do; and,
• General price subsidies have eventually proven unsustainable everywhere they havebeen tried.
In the meantime, however, there is no doubt that the seasonal price rise representsa major cost to the poor, and the compunction to try to moderate it is understandable.Some form of intervention to smooth inter-seasonal price rises may form a legitimate part
18 This was composed primarily of an effort to maintain the consumer price of maize at K3.90 per kg., and
then at K7.25, while the cost of the maize was approximately K.11-12/kg.

37
of the safety net strategy, but it needs to be done in a way that is as non-distortionary, andfiscally neutral, as possible. This should be the subject of further analysis.
The prefered solution is to increase the purchasing power of the poor during thelean season (for example through cash or voucher transfers – under the PWP orotherwise), while simultaneously tackling the supply side through improved agriculturalproductivity, reducing transport costs, unblocking credit markets, and otherwisedeveloping competitive grain markets. In periods of relative scarcity , when the maizeprice increase would be expected to be particularly severe, we would recommend therelease of maize from a commercially-based reserve as a way of increasing supply andputting downward pressure on prices, rather than a general price subsidy.
If there is to be a continuing subsidy then it needs to be targeted – both in thelean season, and at the relatively poor. However we do not think that such a targetedsubsidy is likely to be feasible or desirable. One option is to consider provision ofdiscount vouchers, redeemable commercially, to allow the poor to get maize at a lowerprice during the lean season. These could perhaps be targeted on the basis ofparticipation in other poverty-oriented programs, such as the PWP or child nutritionprograms.
Another is to consider the provision of inferior goods – such as yellow maize orcassava flour – which are generally not preferred by those who can afford white maizeflour, and thus can be self-targeted at the poor. Such programs have been used to targetsubsidies successfully in numerous countries, including Sri Lanka (with coarse rice) andMozambique (using yellow maize). The drawbacks are that in Malawi the imported priceof yellow maize is not much cheaper (and at times is more expensive) than white maize;and that, being imported, it requires foreign exchange, and undermines local maizemarkets. Cassava flour, while produced domestically, has the drawback of being apreferred food in some areas and thus may not be particularly suitable as an inferior good,nonetheless, we feel that the use of both yellow maize and cassava flour should be pilotedthe next time there is provision of either free or subsidized relief maize during a deficityear.
5.5 Cash Transfers
Pure cash transfers to the poor have not been tried in Malawi, for all the obviousreasons of cost, the large numbers of poor, the risk of dependency, and the extremedifficulty of targeting individual beneficiaries. Nonetheless it seems clear that many ofthe most vulnerable that should be supported with a safety net in Malawi – the poordisabled, infirm, and elderly who are not in households; and, increasingly, orphans - willnot be reached by traditional self-targeting mechanisms such as public works, nor willthey benefit from starter packs. Therefore we believe that some kind of direct transfersystem should be tried.
The options being considered are: (i) a program of transfers to the mostvulnerable, in the form of either cash or vouchers; and (ii) an orphan support program, toprovide direct transfers to orphans not in households, or very poor families or agenciessupporting orphans. The problem, in both cases, is how to target them.
38
The Problem of Targeting
Given the administrative weakness, and difficulty in distinguishing the poor fromthe non-poor, self-targeting – either through a work requirement (as in the public worksprogram), or offering small, or inferior benefits (as in the starter pack, or yellow maize) -is the most obvious solution. The problem remains of how to direct transfers to thosewho are not amenable to self-targeting. The challenge is complicated by the fact that notall of the disabled are poor, nor are all female-headed households, nor all orphans.
There are essentially two options: administered targeting, or community targeting.Administered targeting is difficult in Malawi, both because the data base does not allowthe authorities to identify particular groups or households (for example there is no vitalregistration or identity system, and basic attributes like age, landholding , and incomeare generally not known). Even if they were measured, the administrative capacity totarget is simply not there. To operate targeted programs requires skilled middle-levelsupervisors and managers, who are in very short supply in Malawi. To establish thecapacity to operate administered targeting on a large scale would be extremely expensive.
The trick is to design administrative targeting that fits with the existing data andmanagerial constraints. One possibility is to develop proxy “markers” for poverty,identifying characteristics such as type of housing, or household composition, forexample, which are highly correlated with poverty status. The feasibility of doing thiswill be explored as data becomes available from the recent household survey. One suchexample is the current food distribution program, which uses the nutritional status of thechild to target household food transfers, and the existing capacity of the health service totarget beneficiaries through health posts.
Community Targeting. The alternative to administered targeting is to let thecommunity decide who the poor are (or to decide who fulfills certain entitlement criteria),and to direct benefits to them. Opinion on the feasibility of community targeting inMalawi is evenly divided. About half of those participating in the consultative processargue that a village committee – consisting of the traditional chief, church elders, andperhaps NGO or political leaders – will know who the poor are, and should be able todirect benefits to them. Others argue equally strongly that such a system will never work– even if it is not open to favoritism and abuse, that the process of selecting somehouseholds and excluding others will prove too divisive for local leaders. The limitedexperience to date in Malawi has been mixed; in the 1995/96 supplementary inputsprogram, village leaders in some instances preferred to distribute small amounts amongeveryone equally rather than have to make difficult choices of inclusion and exclusion. Inany event, such a process will still be fairly intensive in the need for resources tomobilize and train village groups. Given the uncertainty, over the next two years a seriesof pilot attempts at community targeting should be tried and carefully monitored. Inparallel, further work will take place on administered targeting – both because it holdssome promise, and because it is quite possible that community targeting will proveunworkable.
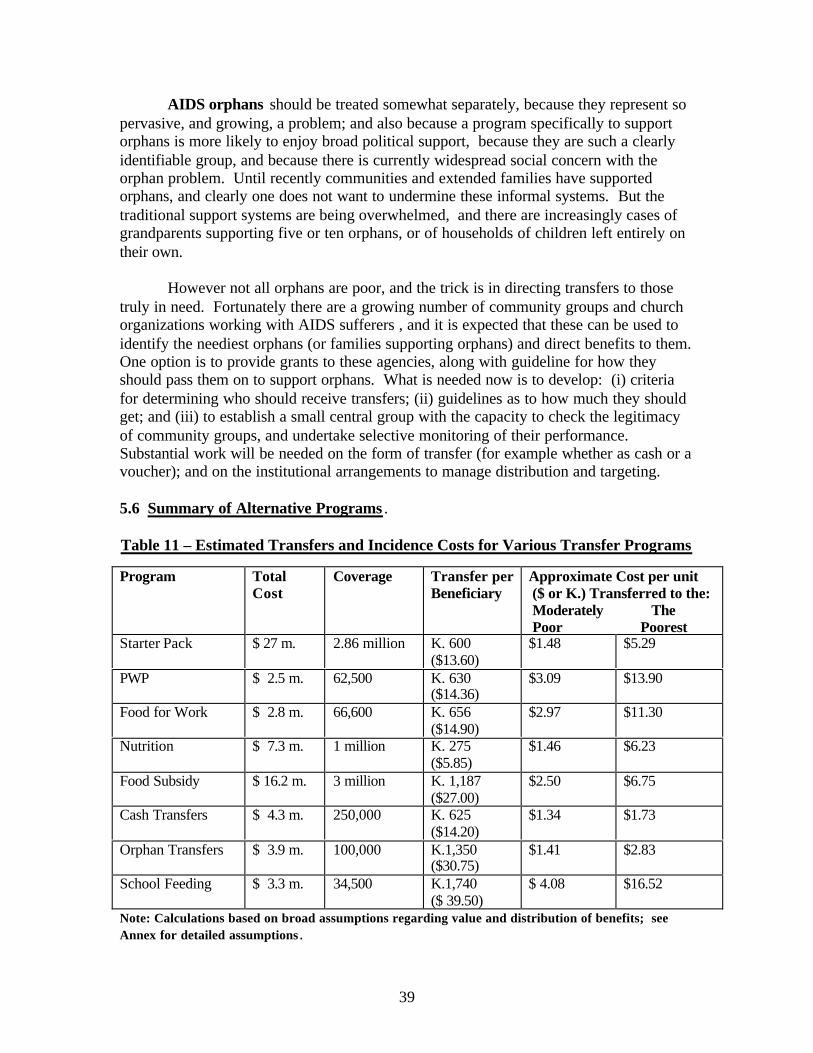
39
AIDS orphans should be treated somewhat separately, because they represent sopervasive, and growing, a problem; and also because a program specifically to supportorphans is more likely to enjoy broad political support, because they are such a clearlyidentifiable group, and because there is currently widespread social concern with theorphan problem. Until recently communities and extended families have supportedorphans, and clearly one does not want to undermine these informal systems. But thetraditional support systems are being overwhelmed, and there are increasingly cases ofgrandparents supporting five or ten orphans, or of households of children left entirely ontheir own.
However not all orphans are poor, and the trick is in directing transfers to thosetruly in need. Fortunately there are a growing number of community groups and churchorganizations working with AIDS sufferers , and it is expected that these can be used toidentify the neediest orphans (or families supporting orphans) and direct benefits to them.One option is to provide grants to these agencies, along with guideline for how theyshould pass them on to support orphans. What is needed now is to develop: (i) criteriafor determining who should receive transfers; (ii) guidelines as to how much they shouldget; and (iii) to establish a small central group with the capacity to check the legitimacyof community groups, and undertake selective monitoring of their performance.Substantial work will be needed on the form of transfer (for example whether as cash or avoucher); and on the institutional arrangements to manage distribution and targeting.
5.6 Summary of Alternative Programs .
Table 11 – Estimated Transfers and Incidence Costs for Various Transfer Programs
Program TotalCost
Coverage Transfer perBeneficiary
Approximate Cost per unit ($ or K.) Transferred to the: Moderately The Poor Poorest
Starter Pack $ 27 m. 2.86 million K. 600($13.60)
$1.48 $5.29
PWP $ 2.5 m. 62,500 K. 630($14.36)
$3.09 $13.90
Food for Work $ 2.8 m. 66,600 K. 656($14.90)
$2.97 $11.30
Nutrition $ 7.3 m. 1 million K. 275($5.85)
$1.46 $6.23
Food Subsidy $ 16.2 m. 3 million K. 1,187($27.00)
$2.50 $6.75
Cash Transfers $ 4.3 m. 250,000 K. 625($14.20)
$1.34 $1.73
Orphan Transfers $ 3.9 m. 100,000 K.1,350($30.75)
$1.41 $2.83
School Feeding $ 3.3 m. 34,500 K.1,740($ 39.50)
$ 4.08 $16.52
Note: Calculations based on broad assumptions regarding value and distribution of benefits; seeAnnex for detailed assumptions.
40
Table 11 is based on some fairly broad assumptions regarding the distribution ofbenefits, but nonetheless it provides an indication of the relative efficiency of variousprogram instruments in reaching the poor. 19 Starter Packs are competitive with otherprograms in terms of providing benefits to the moderately poor – the drawback however(as with the food subsidy) is their high absolute cost as a universal program, which isfiscally unaffordable. Both are less efficient than cash transfers, which appear attractive– however the potential scale is limited by the unknown capacity to manage them, and therisk of distortions.
Public works is a relatively expensive way of delivering benefits, but has theattraction of being self-targeting, and of at least half of the expenditure going to createproductive infrastructure - provided of course that the right infrastructure is chosen.School feeding and the general maize subsidy do not appear competitive with otherinstruments under any circumstances (although the school feeding costs are based on apilot program, and will come down over time, but would unlikely to do so enough to be acost-effective means of delivering benefits to the poor.)
19 Note – the estimated costs of food-for-work and public works per unit benefit are probably over-stated,
and need to be confirmed; school feeding reflects pilot program costs. Assumptions are discussed inAnnex.
41
Chapter 6 – Conclusions and Recommendations
6.1 The Choice of Safety Net Strategy
Table 12 on the next page illustrates the broad options for a safety net strategy forMalawi.
The first option, leaving poverty alleviation almost exclusively to economicgrowth, and providing safety net support to only the most vulnerable 2-3% of thepopulation (the disabled, infirm, etc.), is not adequate in the case of Malawi. The largeshare of the population living close to the subsistence minimum, and at frequent riskfalling below it, and the depth of poverty among the bottom 10-20%, both argue for amore comprehensive approach. Furthermore, as we have seen in Chapter 1, even themost robust economic growth will leave very large numbers of absolutely poor for thenext 10 years or so.
At the same time, the third option – of a major redistributive program, attemptingto reach all of those who are “poor” (i.e. the 40-60% or more who fall below the BasicNeeds Poverty Line) - is not recommended. It is unaffordable, runs the risk of creatingdependency, and undermining incentives to change economic behaviour; and the sameresources could be better used to promote long-run income growth through education orinfrastructure. ( Note that while such a strategy may seem extreme, it is effectively theapproach that Malawi has been pursuing recently, with expenditures of almost $70million on transfers in 1998.)
We would instead recommend that Malawi adopt a version of the ‘moderateintervention’ strategy for the coming ten years, with the following objectives:
- increasing lean season consumption of the poorest 20% or so;- providing direct assistance to those unable to look after themselves; and,- providing increased coverage in years of adverse economic events or shocks
such as droughts.
Although this will only reach a proportion of the poor (perhaps half), in Malawi's tightly-constrained fiscal environment, this level of coverage is likely to be the best that it ispossible.
The policy implications of choosing this option would be to adopt a moreselective approach to transfers, (for example shifting from universal give-away programsto targeted, and especially self-targeted schemes), and to invest substantial effort intargeting mechanisms, and in determining the best ways of insuring against risk.

42
Table 12 - Broad Options for a Safety Net Strategy for Malawi
Strategies ApproximateCost
Coverage Target Groups Possible ProgramInstruments
Policy Implications
1)‘Minimalist’ Strategy - Leave poverty reduction toprocess of economic growth,restrict safety nets to only themost needy unable to look afterthemselves.
$3-4million p.a.
250,000 Only most vulnerable: disabled,elderly, infirm who are not inhouseholds, or in very poorhouseholds; only poorest orphans.
Targeted direct transfersthrough NGOs;possibly nutritionsupplementationprogram formalnourished children.
Drop starter packs, publicworks, and fooddistribution programs(except in drought years);redirect resources togrowth activities;basically leave safetynets to NGOs.
2) Moderate/LimitedIntervention Strategy- Say bottom 25% getsomething, moderate top-up on aself-targeting basis for 15-20%,more substantial transfer forbottom 5-10%
$25-30million p.a.
1-2 million Labour-constrained female-headedhouseholds, rural landless, pooresturban poor; elderly, disabled, etc.who are not in households,; orphansin poor households
Moderate-scale PWP,much more-tightly-focused Starter Pack e.g.voucher for workscheme; targetedtransfer program , butonly for poorest.
Invest substantial effortin targeting mechanisms;restrict scale of starterpacks and food transfers;self-targeting (e.g.through workrequirements) for all butthe poorest
(3) Significant Redistribution4 million - A major effort tosupport those living below thepoverty line – say the bottom40% of the population, [ andprovide them with transfers tobring them close to an‘acceptable’ poverty lineincome]
$50-70million p.a.
3-4 million All poor rural farmers; urban poor;all vulnerable groups as above.
Large-scale self-targetedPWP; continued StarterPack Program –perhapstargeted at bottom 50%;substantial transferprogram for thoseunable to supportthemselves
Don’t worry too muchabout leakage; acceptgoing to be needed for asubstantial time; work upexit/transition strategyover next few years.

43
The target groups for a safety net would thus be, in descending order of priority:
• the elderly, disabled, or infirm who are not in households, or who are in very poorhouseholds;
• orphans – but only those who are not in households, or are in very poor households;
• labour-constrained female-headed households;
• the rural landless;
• the urban poor, and rural poor with very small landholdings.
The instruments proposed to reach these groups are: (i) public works (for thelandless, urban poor, and some female-headed households), because it is self-targeting,and creates productive assets; (ii) a nation-wide targeted nutrition program (formalnourished children from any of these groups); and (iii) selected, targeted, cashtransfers (for those who are unable to look after themselves: orphans, the disabled,elderly, and infirm who are not in households) .
6.2 Recommended Safety Net Program
The following specific safety net program is recommended for Malawi:
Public Works. A consolidated program of low-wage employment on publicworks, aimed at employing 300,000-400,000 persons per year20. Such a programwould reach about 15-20% of the population , and provide transfers of aboutK.630 ($15) to each, at a total cost of about $12-15 million p.a.. [Possiblysupplemented by vouchers for food and/or agricultural inputs/fertilizer]
Nation-wide Nutrition Program. A program of selective child feeding , nutritionsupplementation, and possibly micro-nutrients, that provides almost universalcoverage for malnourished children below the age of 5, and especially below 30months. This would primarily build on the existing Ministry of Health program.Not enough is known about the estimated numbers, but very roughly, such aprogram might cover 500,000 to 1 million children, and cost in the neighbourhoodof $3-5 million annually.
Transfers for Orphans. A program of directed transfers to assist the growingnumbers of orphans who cannot be supported by their communities, or who are inhouseholds which are overwhelmed with the cost of supporting them. Themechanics require further work and piloting, but the expected model is one ofchanneling grants through community groups working with AIDS sufferers and
20 For an average of 40 days each, for total employment of about 12-15 million person-days per year.

44
orphans. A conservative program to target 100,000 orphans, and transfer half ofthe Basic Needs income to them, would likely cost about $4 million annually.21
Selected Cash Transfers. A program designed to provide half of the minimumfood requirement to the absolutely vulnerable, who cannot be reached otherwise:the disabled, elderly, and infirm who are not supported by households. Carefulpiloting is needed to test the feasibility and costs of such a scheme in Malawi. Ifit were to reach 250,000 people (the bottom 2 1/2 % of the population) weestimate it would cost about $4-5 million annually.
Some food distribution will still be needed in drought years, but shouldincreasingly be substituted for by large-scale expansion of the public works and nutritionschemes; and release of stocks from the commercial grain reserve. At the same time, itis recommended that Government:• target the Starter Pack Initiative, possibly by replacing it with a fertilizer voucher-for-
work scheme in the dry season;• phase out food distribution and feeding programs, and school feeding, and redirect
the resources freed up to the nutrition program;• discontinue general food subsidies;• consider piloting the provision of inferior goods (such as yellow maize and cassava
flour) as a way of self-targeting free or subsidized food distribution. – if there is to beany continued food distribution
It is estimated that the proposed program would cost about $28 million (K.1.2billion) per year [see Table 13]. It would address most of the chronic poverty in thecountry, without undermining long-run growth, or the incentive for the able-bodied towork to raise their own incomes. In addition it would:
ü contribute to longer run income growth, through the construction of infrastructure andimproved health and nutritional status of the next generation;
ü reduce the risk of dependency and distortions associated with free hand-outs andsubsidy programs
ü would be affordable; and ,ü if carefully managed should be: (a) financeable on a sustained basis over the coming
ten years; and (b) implementable with the administrative capacity available in Malawi(provided the current plethora of competing programs are consolidated orrationalized).
21 Assuming 100,00 orphans, transfer of K.1,350 ($31.40) per orphan per year (1/2 of BNPL); plus 20%
overhead for NGOs and community groups , and $200,000 p.a. for central monitoring group.

45
Table 13 – Recommended Safety Net Program – 2000-2020
ApproximateProgram Coverage Annual Cost
Expanded Public Works 1.5 million \a K. 528 million ($ 12 m.)
Child Nutrition Program 1 million K. 321 million ($ 7.3 m.)
Orphan Support Program 100,000 \b K. 172 million ($ 3.9 m.)
Selected Transfers to 250,000 K. 190 million ($ 4.3 m.) Most Vulnerable
Notes: See Annex -- for assumptions. a/ 1.5 million beneficiaries, number actually employedis 300,000. b/ assumes support for about 100,000 poorest orphans initially.
6.3 Next Steps
To make this program operational, a number of immediate steps need to be taken:
(1) Laying the basis for expansion of public works by developing a stock ofprojects, shifting to maintenance, and building contractor and managementcapacity; and rationalizing the various existing efforts into a common nation-wideprogram.
(2) Designing and piloting the Orphan Support scheme, including setting up theinstitutional mechanisms to channel and monitor grants.
(3) Further developing the Nutrition Program proposal Including a quick reviewof the existing programs.
(4) Pilot community targeting, and further assess the scope for administeredtargeting.
(5) Refining the poverty focus of public works. an examination of how PWP canbe made more selective of the poorest.
(6) Further analytical work to better understand the nature of poverty and risk, sosafety net interventions can be more narrowly focused only on those in absoluteneed; and respond more narrowly to income variance and shocks;
(7) Looking further at the form of transfers (whether in cash, vouchers, food , orfertilizer) to better understand the costs and benefits of each.

46
6.4 Closing Observations: Institutional Issues
A significant impact on poverty can be achieved at an affordable level, but onlyif a focused approach is adopted. The proposed program cannot be additional, but mustrepresent a rationalization (and in some cases replacement) of the existing multiplicity ofprograms.
Donors and government need to recognize that this program will require a long-term commitment, with funding sustained over a period of 10 years or more. There isfrankly little point in proceeding on the basis of the past stop-start model of donorprograms. It only makes sense to move ahead with the proposed safety net program if itis approached as a common, nationwide program. To increase ownership, and continuity,consideration should be given to moving to a mix of domestic and external financing fora long-run safety net scheme.22
Despite the improved dialogue of the past year, the reality is that the governmentstill is largely in the mode of being reactive. There is a pressing need to move away fromframing the approach in terms of reacting to individual donor funding proposals, fordonors to shift away from proposing discrete projects, and for government to take thelead on a collective, government-directed program.
22 One way of doing this, without threatening fiscal indiscipline, to use the Government’s own ongoing
capital works and maintenance program as means of implementing a large part of the publicemployment program.
47
References
Action Aid (1996),"Farmers Needs and the 1995/96 SIP: Implications for Household FoodSecurity Strategies", Action Aid Malawi, August 1996
Action Aid/GoM (1996),"Evaluation of the Supplementary Inputs Programme (SIP)", MoALD,MEPD, Action Aid Malawi, February 1996
Alderman, H and Lindert, K (1998),"The Potential and Limitations of Self-Targeted FoodSubsidies", World Bank, World Bank Research Observer Vol.13 No.2, August 1998
Alwang, Jeffrey and Siegel, Paul (1996),"Smallholder Agriculture in Malawi: Constraints toAchieving Poverty Alleviation through Agricultural Intensification (draft)", World Bank,January 1996
Alwang, Jeffrey and Siegel, Paul (1999),"Labour Shortages on Small Landholdings in Malawi:Implications for Policy Reforms", World Bank, World Development 27 (8), August 1999(forthcoming)
Ballot, Frank (1995),"Report on a consultancy carried out for Caritas Malawi for CaritasGermany, Caritas Malawi, August 1995
Brown, Donald; Reutlinger, Shlomo; Thomson, Anne (1996),"Malawi: Food Security in a MarketOriented Economy", USAID Agricultural Policy Analysis Project, Malawi, June 1996
CADECOM (1998),"Supplementary Feeding and Food Security Programme, June 1996 - May1998", CADECOM, May 1998
CARE (1998),"Malawi Participatory Livelihood Assessment Exercise", CARE International, July1998
CARE (1999),"Central Region Infrastructure Maintenance Programme (CRIMP)", CAREInternational, Lilongwe, 1999
Caritas Malawi (1996),"Report on Community Based Supplementary Feeding Programme, 1993-1995", Caritas Malawi, July 1996
Castaneda, Tarsicio (1999),"The Design, Implementation and Impact of Food Stamp Programs inDeveloping Countries", World Bank, March 1999
Chewele, Mercy et al (1995),"Participatory Food Security Assessment - Kalima area of MpinguEPA (EPA 2)", CPAR, July 1995
Clay, Daniel C; Molla, Daniel; Habtewold, Debebe (1998),"Food Aid Targeting in Ethiopia: AStudy of Household Food Insecurity and Food Aid Distributions", Grain Market ResearchProject, Ministry of Economic Development and Cooperation, Addis Ababa, March 1998
Concern Universal (1998),"Proposal for Dedza Integrated Food Security Project - submitted toEC Delegation to Malawi", Concern Universal, May 1998
Devereux, S and Gladwin, C (1999a),"The Case for Productivity-Enhancing Safety Nets",mimeo, 1999
Devereux, S and Gladwin, C (1999b),"Making Less Last Longer: coping with food insecurity inMalawi", , March 1999
Devereux, Stephen (1996),"Food Security in Malawi: Issues, Strategies and Policies - A ReviewPaper for ActionAid Malawi", IDS , June 1996
Devereux, Stephen (1997),"Household Food Security in Malawi", IDS, December 1997

48
Devereux, Stephen (1999a),"Experiences with Targeting Transfers in Malawi", IDS for UNDP,March 1999
Devereux, Stephen (1999b),"Prevention is More Cost-Effective than Cure: the case forproductivity-enhancing safety nets in Malawi", IDS/UNDP, March 1999
Devereux, Stephen (1999c),"Targeting Transfers: innovative solutions to familiar problems",IDS, Draft for IDS Bulletin, March 1999
DFID (1998),"Project Memorandum - Malawi Rural Livelihoods: Soil Fertility Initiative StarterPack Scheme", Department for International Development, August 1998
DFID (1999),"Social Protection for Accelerated Development and Employment (SPADE)",Department for International Development, February 1999
Dil, Lee Ann (1996),"Rural Appraisal: Primary Schools, Vulnerable Group Feeding, and Food forWork as Channels of Maize Distribution", WFP Malawi, May 1996
FAO (1989),"ESN - Nutrition Country Profile, Malawi", FAO, Rome, September 1989
FAO (1992),"Strengthening of Inputs Distribution System for Increasing Smallholders' FoodCrop Production, Malawi - Fertilizer Pricing and Distribution", FAO TechnicalCooperation Programme, 1992
Freeland, N (1999),"Malawi: Review of Food Security Information Systems", EU-Resal/MasdarTechnology Ltd, March 1999
Fumulani, Anderson and Msanyama, Cornelius (1997),"Food for Sustainable DevelopmentProject in EPA Mpingu, Lilongwe District - end of project evaluation report", CPARMalawi, December 1997
Fumulani, Anderson and Msanyama, Cornelius (1998),"Food for Sustainable Development inMpingu EPA, Lilongwe District - final project report", CPAR Malawi, February 1998
Geddes, R and Billing, K (1999),"Safety Nets Mechanism for Malawi: Public Works ProgrammeStudy ", Department for International Development, April 1999
GoM (1992),"Food and Nutrition Situation, Policies and Programmes in Malawi - An Overview",Ministry of Agriculture, prepared for International Conference on Nutrition, December1992
GoM (1995a),"Evaluation of the Drought Recovery Inputs Programme - First Round of FarmerSurveys", Ministry of Economic Planning & Development/Ministry of Agriculture &Livestock Development, March 1995
GoM (1995b),"National Plan of Action for Nutrition, 1996-2001", Government of Malawi,November 1995
GoM (1996a),"Country Position Paper on Food Security", Malawi National Committee on WorldFood Summit, April 1996
GoM (1996b),"Malawi Social Indicators Survey 1995", MEPD, NSO and CSR, September 1996
GoM (1996c),"Poverty Monitoring, Social Policy and Safety Nets Analysis and RelatedCapacity-Strengthening Programs in Malawi: A Project Proposal", MEPD; NSO; CSR withIFPRI, September 1996
GoM (1996d),"The International Conference on Nutrition (ICN) and National Plan of Action forNutrition (NPLAN) for Malawi", Paper presented at National Nutrition Plan of ActionConference, Lilongwe, October 1996
49
GoM (1997),"Malawian Children - the state of health, nutrition, education, water and sanitationof children in Malawi in 1995", Poverty Monitoring Unit, MEPD with UNICEF, July 1997
GoM (1998a),"Agricultural Productivity Investment Project - May 1998 Report", Ministry ofAgriculture and Irrigation, May 1998
GoM (1998b),"Food Security and Nutrition Bulletin, Vol 9 No 1", NEC, August 1998
GoM (1998d),"An Outline of the Starter Pack Initiative", Ministry of Agriculture and Irrigation,1998
GoM (1998e),"Qualitative Impact Monitoring of Poverty Alleviation Policies and Programmes inMalawi - Volume 1: Research Findings", National Economic Council, 1998
GoM (1998f),""Malawi's Breadbasket"", National Statistics Office, 1998
GoM (1999a),"The Feeder Roads Programme Project Workshop, Lilongwe 7 January 1999",Government of Malawi, EU, Africon Consulting, January 1999
GoM (1999b),"Final Report - Implementation of Starter Pack Scheme 1998", Starter PackLogistic Unit, February 1999
GoM (1999c),"Final Distribution Report of the 1998/99 APIP Inputs", Ministry of Agriculture &Irrigation, 1999
GoM/FAO (1998a),"Special Programme for Food Security - National Programme Document",Government of Malawi/FAO, August 1998
GoM/UNDP (1993),"Situation Analysis of Poverty in Malawi", Government of Malawi, UNDPMalawi, 1993
Gomonda, N; Kamanga, C; Chiwaka, E; Pain, C (1997),"Qualitative Impact Monitoring (QUIM)as part of the Poverty Monitoring System - Mundangu Village Site Report, Mhuju EPA,Rumphi District", , December 1997
Gray, John G (1995),"Development of a Framework for Maize Price Stabilization and of theMaize Price Information System - interim report", Development Support Group Ltd forGovt of Malawi/World Bank, April 1995
Grosh, Margaret E (1994),"Administering Targeted Social Programs in Latin America: FromPlatitudes to Practice.", World Bank, , February 1994
GTZ (undated),"The Public Works - Food for Work Project within the context of the IFSP inMulanje District", GTZ IFSP Mulanje,
Guta EW (1996),"Socio-economic conditions in the city of Lilongwe with particular focus on lowincome housing areas", GTZ, September 1996
Haddad, Lawrence and Zeller, Manfred (1996),"How Can Safety Nets Do More With Less?General issues with some evidence from Southern Africa.”, IFPRI, July 1996
Haque, Trina et al (1999),"Africa Region Social Protection Sector Strategy Paper" (draft), WorldBank, February 1999
Johnson, JS (1996),"As Assessment of Food Insecurity in Malawi, with Strategies for ImprovingHousehold and National Food Security", FAO, Lilongwe, Paper prepared for the NationalPlan of Action for Nutrition Conference, Malawi, October 1996
Konyani, SET (1998),"Factors Explaining Rural Household Incomes with Recommendations forAiding the Transition Out of Poverty", CSR Zomba, June 1998

50
Lodh, Francoise (1996),"Aspects of Social Security: an Urban Profile of Malawi", GTZ, February1996
Longley, C., Coulter,J., and Thompson,R; “Malawi Rural Livelihoods – Starter Pack Scheme,1998-99: Evaluation Report; ODI, August,1999
Makawa, Joe (1998),"Evaluation of Pilot Phase of IFSP/IGA Sector and Oxfam Mulange withFINCA in Mulange District", ACEDS Ltd, November 1998
Mangani, RG and Chaweza, RD (1999),"Smallholder Supply Response to Agricultural PolicyChanges in Malawi", Chancellor College, Univ of Malawi, , February 1999
Mang'anya, Manuel (1998),"Socio-economic Study to Identify Target Areas for a LabourIntensive Rural Feeder Roads Programme in Malawi - final report", GoM Ministry ofLocal Government and EC Delegation, September 1998
Marsland, Neil (1999),"The incidence of food insecurity in Malawi and the range of coping andadaptive strategies utilised by households to achieve food security", NRI, January 1999
Marsland, Neil and Sutherland, Alistair (1999),"Coping for Adapting to Poverty in Malawi: HowMuch Do We Know and What Are The Gaps", Natural Resources Institute, Presentation toSafety Nets Sub-Committee, Lilongwe, March 1999
Marsland, Neil; Sutherland, Alistair; Long, Andrew (1999),"The Moral Economy: AnAnthropological Approach to Understanding Poverty and Coping Strategies in Malawi",Natural Resources Institute, March 1999
MASAF (1996),"Public Works Programme Implementation Handbook", Malawi Social ActionFund, March 1996
MASAF (1997),"Beneficiary Assessment Documents", Malawi Social Action Fund, May 1997
MASAF (1997),"Beneficiary Assessment, 1997 BA-1, Volume II: Main Report", Malawi SocialAction Fund, April 1997
MASAF (1998),"Public Works Programme Quarterly Report for the Period July to September1998", Malawi Social Action Fund, 1998
Mataya, C; Chulu, O and Chilima, E (1999),"Socio-Economic Effects of Structural AdjustmentPolicies on Malawi's Rural and Urban Households", Bunda College and NEC , February1999
Minae, S; Malfense, O and Mdyetseni, H (1998),"Socio-economic Study to Identify Target Areasfor a Labour Intensive Rural Feeder Roads Programme in Malawi - final report", GoMMinistry of Local Government and EC Delegation, March 1998
Mkamanga, G (1995),"A socio-economic profile of four unplanned traditional housing areaswithin the city of Mzuzu", GTZ-CSC, June 1995
Mkamanga, G (1997),"Socio-economic profiles of secondary centres in the Central region ofMalawi", GTZ-CSC, March 1997
Mkamanga, Gilbert (1996),"Supplementary Inputs Programme (SIP) (1995/96 AgriculturalSeason) Benficiary Impact Assessment Study - preliminary report", ActionAid, Malawi,July 1996
Mkandawire, RM (1988),"Smallholder Survival Strategies, Perception and Responsiveness toExtension and Credit in the Salima ADD", Bunda College, Study for EC-funded midtermevaluation ,November 1988

51
Morduch, Jonathan (1998),"Between the Market and the State: Can Informal Insurance Patch theSafety Net?", World Bank, September 1998
Ngwira, Naomi (1996),"Malawi - Incorporating Gender in Food Security Policies",Commonwealth Secretariat, April 1996
Nigam, Ashok (1999),"Safety Nets and UNICEF's Support for Microcredit in Malawi - Summaryof Mission Report", UNICEF, March 1999
Nkhoma, Wilfred (1996),"Preventing and Controlling Micronutrient Deficiencies", Paper for theNational Nutrition Plan of Action Conference, Lilongwe, October 1996
Pearce, Julie; Ngwira, Austin; Chimseu, George (1996),"Living on the Edge - a study of the ruralfood economy in the Mchinji and Salima districts of Malawi", SCF (UK), March 1996
Peters, Pauline E (1994),"Household Food Security and Drought in Southern Region - SituationReport, 1994", Harvard Institute for International Development for MEPD, October 1994
Riley, Barry and Dejene, Alemneh (1994),"Malawi Country Strategy Outline", Food StudiesGroup for WFP, August 1994
Rimmer, Martin; Jones, Stephen; Cole, Phillip (1996),"Market Access and Safety Nets inMalawi: Developing Action Plans.” Oxford Policy Management, 1996.
Seaman, John; Holt, Julius and Allen, Penny (1993),"A New Approach to Vulnerability Mappingfor Areas at Risk of Food Crisis - Interim Report on the Risk-Mapping Project", SCF (UK),May 1993
Simons, Gacheke; “Household Food security and Safety Nets” mimeo – submitted to USAID forrural Sector Assessment Study, Malawi, May, 1999
Simons, Scott (1998a),"Food Security in Malawi: Steps Taken Toward a Common Agenda in1996 and 1997, and Recommended Steps for 1998", Economic Policy Support Unit,Ministry of Agriculture & Irrigation, March 1998
Simons, Scott (1998b),"Agriculture Sector Retrospective, Malawi: 1990-1998", Economic PolicySupport Unit, Ministry of Agriculture & Irrigation, April 1998
Smith, W.James (1999),"Safety Nets in Malawi: How much? For How many?", World Bank,Lilongwe, February 1999
SOCOTEC (1998),"Progress Report on 1998/99 Agricultural Productivity Investment Project",SOCOTEC International Inspection, November 1998
Subbarao, K (1997),"Public Works as an Anti-Poverty Program: an Overview of Cross-CountryExperience", World Bank, January, 1997
Subbarao, K et al (1996),"Social Assistance and Poverty-Targeted Programs: A Best PracticePaper", World Bank, April 1996
Subbarao, K et al (1997),"Safety Net Programs and Poverty Reduction: Lessons from Cross-Country Experience ", World Bank, Directions in Development series, January 1997
Tsoka, Maxton (1999),"Malawi Safety Nets Analysis Review of Programs - Vol 1: Main Report,Vol 2: Notes on Programs", CSR, January 1999
Tsoka, Maxton and Mvula, Peter (1999),"Malawi Coping Strategies Survey - draft report", CSR,March 1999
UNDP (1998),"Food security sub-programme support document", UNDP Lilongwe, June 1998
52
USAID-FEWS/WFP/GoM (1996),"A Quest for Causality: Vulnerability Assessment & Mapping,Malawi baseline 1996", USAID/FEWS Malawi with WFP and MEPD VAM TechnicalWorking Sub-Committee of the Poverty Monitoring System, Malawi, December 1996
Van de Walle, D (1998),"Targeting Revisited", World Bank, World Bank Research ObserverVol.13 No.2, August 1998
Vergos, Zissimos (1999),"Technical Support to the Food Security Unit for the Preparation andPlanning of the 1998/99 Agricultural Productivity Investment Project (APIP) and theStarter Pack Initiative (SPI)", EC Lilongwe, February 1999
Von Benda-Beckmann, Franz; Kirsch, Renate and Freiberg-Straub, Jorg (1997),"The Capacity ofSocial Security Systems in Southern Africa: conditions, constellations and socio-politicalrelevance - Volume 1", GTZ, 1997
Westlake, MJ (1995),"Papers on Aspects of Maize and Fertiliser Market Liberalization", USAID,ASAP support project, July 1995
Westlake, MJ (1999),"Malawi: Structure of Fertiliser & Transport Costs", Resal Malawi, ResalTechnical Report No. 3, April 1999
WFP (1995a),"Food for Work in the Context of Malawi", WFP Lilongwe, February 1995
WFP (1995b),"Malawi - CSO: Food Insecurity, the Poor and Hungry", WFP, Rome,CFA:39/SCP:14, March 1995
WFP (1995c),"Malawi Country Strategy Outline", WFP, CFA: 39/SCP: 14, March 1995
WFP (1995d),"Project Malawi 4780 (Exp.1) - Vulnerable Group Feeding", WFP, WFPCommittee on Food Aid Policies and Programmes CFA 39/SCP 14, April 1995
WFP (1996),"Project Summary - Enhanced Food Security through Targeted Food for Work",WFP Malawi, 1996
WFP (1997),"WFP support Emergency Operation (EMOP 5639) "Assistance to Drought Victimsin Malawi" - final report", GoM/WFP, July 1997
WFP (1998a),"Project Summary: MLW 5934 - School Feeding for Improved Primary educationand Girls' Enrolment and Attendance in the Mtakataka and Golomoti Areas of DedzaDistrict - Pilot", WFP, February 1998
WFP (1998b),"Country Programme for Malawi (1998-2001)", WFP, WFP/EB.2/98/5/2, April1998
WFP (1998c),"Project Summary: Targeted Safety Net Emergency Operation through theVulnerable Group Feeding (EMOP 5997/02", WFP, September (?) 1998
WFP (1998d),"Evaluation of the Targeted Safety Net Emergency Operation - 5997", WFP-VAMUnit with NEC, MOH, October 1998
White, P and Appleton,J; “Malawi – “The role of In-Kind Transfers in a Safety Net Program” ;RESAL/EU; April, 1999.
Whiteside, M (1998),"When the Whole is More than the Sum of the Parts - the effect of cross-border interactions on livelihood security in southern Malawi and northern Mozambique",Oxfam UK, December 1998
Whiteside, M (1999),"Ganyu Labour in Malawi and its implications for Livelihood SecurityInterventions: an analysis of recent literature and implications for poverty alleviation",Oxfam, Malawi, May 1999
53
World Bank (1996),"Malawi: Human Resources and Poverty - profile and priorities for action",World Bank, March 1996
World Bank (1997),"Accelerating Malawi's Growth: long term prospects and transitionalproblems", World Bank Southern Africa Dept., September 1997
World Bank (1999),"Protecting the poor in a crisis - and beyond", World Bank, World Banknotes - Poverty, No. 12, January 1999
World Bank/CSR; “Consultations with the Poor – Malawi , National Synthesis Report” WorldBank, 1999
Zgovu, EK et al (1998),"A Review and Evaluation of MASAF Safety Net Programme andAssessment of its Impact", Wadonda Consult for Malawi Social Action Fund, February,1998
Zgovu, EK; Mvula, PM (1998),"Safety Net Programme Baseline Study", Wadonda Consult forMalawi Social Action Fund, September 1998
54
Annex – Assumptions Underlying Evaluation of Program Options
Assumptions Underlying Estimates of Program Scale and Costs
The following broad assumptions underlie the estimation of program costs,coverage, and transfers used in comparing options in Chapter 5.
Public Works
• Assumed cost of a program in the long run is US$1 per person day of employmentcreated (the average cost of employment created to date under the MASAF publicworks program).
• Average employment is assumed to be 40 days for any given beneficiary. (Data isunreliable, but historical average appears to be about 42)
• Thus 300,00 persons employed would correspond to 12 million person days ofemployment, at a cost of US$12 million annually.
• Coverage of such a program, in terms of poverty impact, would be about 1.5 millionpersons, or 15% of the population, assuming a household size of 5, and only onedirectly-employed beneficiary per household.
• Average transfer per beneficiary at the current wage rate would be about K.630 (40days at K15.80 per day)
• Program size of 62,500 shown in Table 11 is based on peak level in 1998/99
Food-for-Work
• Costs are also estimated at about US$1 per person day of employment, which hasbeen the average under recent programs. (Although some administrative overheadsmay not be captured in these costs).
• Benefits are based on an assumed ration of 2.5 kg. of maize per participant.• Maize is valued at K.6.25/kg. (in valuation of benefits under all food transfer
programs); on the basis that this represents a weighted average of the replacementvalue of own-produced maize (K.3-5) and of maize purchased from the market (K.8-9per kg.) in 1998/99.
• Program size of 62,500 persons employed shown in Table 11 is approximate totallevel of existing WFP, CPAR and Gtz FFW programs in 1998.
Starter Pack
• Costs and coverage are based on the 1998/99 program actuals.• Value of output generated is valued at K.6.25/kg. of maize, as under food-for-work.• All other assumptions are provided in text footnotes.
55
Nutrition Program
• The actual costs of delivering a widescale child nutrition program in Malawi are notknown, an estimate of US$ 7.30 per beneficiary was used, based on the average ofthe costs of programs in a range of low-income countries.
Food Subsidy
• Costs are estimated on the basis of the difference between cost and selling price ofmaize, it is assumed there is no transactional costs to a general price subsidy. Thevalue of benefits and costs are therefore precisely equal.
• Table 11 based on an illustrative subsidy of K4.75 per kg. of maize sold, based oncontinuing the 1998/99 price retail of K.6.25/kg., and the 1998/99 import cost ofK.11/kg.
• Table 11 assumes public sales of 150,000 mt. of subsidized maize (approximately thelevel in recent years); and that households buy 50 kg. per month of subsidized maizeeach during the 4-month lean season. 150,000 mt. thus benefits 750,000 households,or 3.8 million people.
Cash Transfers
• Assumes value of transfer is to be half of the minimum food requirement, estimatedat 200 kg. of maize per person annually. (Assumption here, for illustrative costingpurposes, is that transfer is not the sole source of income, and is intended as a top-up.The level of half of minimum food requirement is arbritrary. The level of transfer isof course a policy variable and can be set at any level desired
• In tables 11 and 13 cash transfer is assumed K.900 per beneficiary per annum .• Delivery and targeting costs are arbitrarily assumed to be 20% of the value of the
transfer. (which is within the range of international standards).• Coverage is arbitrarily assumed at 250,000 persons, representing the most vulnerable
2 ½ percent of the population. Again, this is a policy variable that can be set at anylevel the government wishes.
Orphan Support Program
• Transfer is assumed to be one-half of Basic Needs Poverty Line income - currentlyestimated at K.1,350 per capita p.a. (BNPL is minimum food requirement, plus anallowance of 50% for other essential expenditures).
• Costs are assumed to be the value of transfers, plus 20% overheads for deliveringNGOs or community organizations, and a cost of US$200,000 per annum to operate acentral secretariat to disburse and monitor NGOs.
• Assumption is of an initial program to reach the poorest 20% of orphans – orapproximately 100,000 beneficiaries.

56
Assumptions Underlying Estimated Incidence of Program Benerfits
Among the overall population, the assumed distribution is:
The Poor: 50%Of which: The Moderately Poor: 35%
The Poorest: 15%The Non-Poor: 50%
The definitions are somewhat arbitrary in the absence of recent income data andpoverty calculations, but ‘the poor’ accord roughly to the proportion of the populationliving below the Basic Needs Poverty Line using updated NSSA data (see Chapter 2);‘the poorest’ are arbitrarily defined here as being the bottom 15% of the population;although this proportion is consistent with micro qualitative surveys, and with thedistribution of landholdings - which suggest a substantially poorer group in the bottom10-20% than among the poor generally.
The following very rough distribution of benefits is assumed for comparingvarious programs:
Proportion of Benefits Accruing to:Middle
Program Non-Poor Poor Poorest
Public Works 10% 70% 20%Food-for-Work 5% 70% 25%Nutrition 15% 65% 20%Food Subsidy 60% 25% 15%Cash Transfers 10% 20% 70%Orphan Transfers 10% 45% 45%Starter Packs 53% 34% 13%School Feeding 40% 45% 15%
It must be emphasized that these are estimations only, for the purposes ofillustrating the relative costs of delivering benefits to various groups, using variousprograms. To rigorously analyse the incidence of benefits would require data onbeneficiaries by income class, which should be generated by forthcoming panel datasurveys.
Notes on the table: Starter Packs assumed to be distributed in proportion to the rural population, withthe degree of over-issue (which the evaluation showed was higher for those with larger landholdings)assumed to be distributed 65% to the non-poor, 35% to the poor, and 5% to the poorest.
Public works programs are assumed to be fairly selective of the poor, given the locations chosenand the wage rate. The poorest are under-represented (proportionally) because many in the bottom 15% areunable to participate in work-based programs (eg. the disabled, elderly infirm, and orphans).
Food for work is assumed to be somewhat more selective of the poorest; again although there isnot firm data by income class, this is consistent with the qualitative evaluations, the greater proportion offemale participants, and the intentional selectivity of the very poorest areas.

57
Nutrition programs are assumed to be fairly well targeted, on the basis of experience withVulnerable Group Feeding and clinic distribution programs. Some of the very poorest are assumed not tobe captured (eg, those without children) and it is assumed that some share of the non-poor are legitimatelycovered because they have malnourished children.
The food subsidy is assumed to be captured somewhat more by the non-poor, given thepreponderance of sales in urban areas (about 30-40% of maize sold by ADMARC); and the anecdotalevidence of leakage to traders and speculators; however– if the amounts sold are large enough (eg. at thelevel of 3-4 million persons covered assumed in Table 12) it is assumed that the benefits are also reachingthe poor and poorest even if not in the same proportions as the non-poor.
Cash transfers are assumed to be fairly efficiently delivered to the poorest, for whom they arespecifically intended, with some limited leakage to the non-poor (10%) and the moderately poor (20%).
Similarly transfers to orphans are assumed to be relatively well targeted to poor orphans (which isthe design intent) – although the incidence on the moderately poor is substantially higher, since orphans(and particularly the households supporting them) may equally come from either group.
Both of these programs are proposals only, so the estimates are hypothetical – however targeting isthe specific design objective of the proposed programs, so if they are not targeting at something like thislevel of precision, they probably should be dropped.
School feeding is assumed to be moderately selective of the middle-poor, if it is targeted only atpoorer geographical areas. Otherwise the distribution of benefits follows the overall distribution of thepopulation, although the very poorest are under-represented because both qualitative and quantitativestudies show they are less likely to have children in school