Spectrophotometric Analysis of Cranberry-Apple …...different cranberry-apple juice brands. Your...
16
Spectrophotometric determination of the percentage of cranberry juice in cranberry-apple juice What percentage of cranberry juice is present in different cranberry-apple juice brands? As in the previous experiment, you will use visible spectroscopy to answer this question. You will use the information and techniques you learned in the previous experiment to design your own procedure for determining how much cranberry juice is in several different cranberry-apple juice samples. You will also explore how to use the StellarNet spectrometer and software to directly compare the color measurements of two liquids. Spectrophotometric Analysis of Cranberry-Apple Juice 2
Transcript of Spectrophotometric Analysis of Cranberry-Apple …...different cranberry-apple juice brands. Your...

Spectrophotometric determination of the percentage of cranberry juice in
cranberry-apple juice
What percentage of cranberry juice is present in different cranberry-apple juice brands? As in the
previous experiment, you will use visible spectroscopy to answer this question. You will use the
information and techniques you learned in the previous experiment to design your own procedure
for determining how much cranberry juice is in several different cranberry-apple juice samples.
You will also explore how to use the StellarNet spectrometer and software to directly compare the
color measurements of two liquids.
Spectrophotometric Analysis of Cranberry-Apple Juice
2

Visible Spectroscopy and Colorimetry
STELLARNET 1
Experiment 2: Cranberry-Apple Juice Analysis
INTRODUCTION Learning Goals
Quality control is an important part of producing and distributing food. Consumers want to know what to expect in the food they buy and manufacturers want to ensure that they are making their intended product. In this experiment, you will perform a quality control inspection of several different cranberry-apple juice brands. Your goal is to determine how much cranberry juice is present in several samples of commercial cranberry-apple juice using Beer’s Law. You will also use colorimetry to compare the color of the cranberry-apple juice samples. Anthocyanins in Cranberries Cranberry juice is commonly used by people to prevent and treat many diseases such as urinary tract infections and kidney disease. Additionally, cranberries contain many compounds that aid the cardiovascular and immune system such as vitamin C, dietary fiber, dietary minerals, manganese and micronutrients.1 Additionally, cranberries contain certain flavonoid phytochemicals called anthocyanins (see Figure 1), which not only give them their deep red color but also have several health benefits associated with them.2 Anthocyanins are a class of chemicals found in a variety of fruits and vegetables including cranberries, blueberries, raspberries, blackberries, eggplant, and red cabbage. Many health benefits have been attributed to anthocyanins pigments and associated flavonoids. For example, anthocyanins from black currents and bilberries significantly improve night vision3,4 and in vitro and in vivo studies have shown that anthocyanins reduce cancer cell proliferation and inhibit tumor formation.5,6,7 In this experiment, the presence of anthocyanins in cranberry juice will allow us to use visible spectroscopy to determine the concentration of cranberry juice in several of cranberry-apple juice brands.
1 Leahy, M., Roderick, R., & Brilliant, K. (2001). The cranberry--promising health benefits, old and new. Nutrition Today, 36(5), 254-265. 2 Zafra-Stone, S., Yasmin, T., Bagchi, M., Chatterjee, A., Vinson, J.A., & Bagchi, G. (2007). Berry anthocyanins as novel antioxidants in human health and disease prevention. Molecular Nutrition and Food Research, 51, 675-683. 3 Nakaishi H, Matsumoto H, Tominaga S, Hirayama M. Effects of black currant anthocyanoside intake on dark adaptation and VDT work-induced transient refractive alteration in healthy humans. Altern Med Rev. 2000;5(6):553–562. 4 Muth E.R, Laurent J, Jasper P. The effect of bilberry nutritional supplementation on night visual acuity and contrast sensitivity. Altern Med Rev. 2000;5(2):164–173. 5 Hou D.X. Potential mechanisms of cancer chemoprevention by anthocyanins. Curr Mol Med. 2003;3(2):149–159. 6 Koide T, Hashimoto Y, Kamei H, Kojima T, Hasegawa M, Terabe K. Antitumor effect of anthocyanin fractions extracted from red soybeans and red beans in vitro and in vivo. Cancer Biother Radiopharm. 1997;12(4):277–280. 7 Koide T, Hashimoto Y, Kamei H, Kojima T, Hasegawa M, Terabe K. Antitumor effect of anthocyanin fractions extracted from red soybeans and red beans in vitro and in vivo. Cancer Biother Radiopharm. 1997;12(4):277–280.
Figure 1: Basic structure of anthocyanins. The structure of the R group determines the identity of the anthocyanin.

Visible Spectroscopy and Colorimetry
STELLARNET 1
Experiment 2: Cranberry-Apple Juice Analysis
Transmission and Absorbance As you learned in the last experiment, absorbance (A) is defined as ratio of the number of photons of a light beam before (P0) and after (P) it passes through a sample:
𝐴 = log '('
Alternatively, we can use transmission of light instead of absorbance to quantify the interaction of light with matter. Absorbance is the number of photons that are absorbed by the sample while transmission is the number of photons that pass through the sample (𝑃 𝑃*). Transmission is related to absorbance by the following equation:
𝐴 = −𝑙𝑜𝑔/*(𝑇) Percent transmittance is simply 𝑇 ∗ 100. Thus, absorbance and percent transmittance are related by:
𝐴 = − 𝑙𝑜𝑔/*%𝑇100 = −𝑙𝑜𝑔/* %𝑇 − [−𝑙𝑜𝑔/* 100 ] = 2 − 𝑙𝑜𝑔/* %𝑇
This last equation is particularly useful since it allows you to directly calculate absorbance values from % transmission data and vice versa. Table 1 shows the relationship between absorbance and % transmission. If a sample does not absorb any visible light then it has 100% light transmittance. If a sample has an absorbance value of 1 then only 1% of the light is transmitted through the sample. Table 1: Relationship between absorbance and percent (%) transmission of light
Absorbance of light % Transmission of light 0 100% 1 10 2 1 3 0.1 4 0.01
Colorimetry: CIELAB and ∆E* Spectroscopy and colorimetry are closely related. Colorimetry is essentially a way of relating spectroscopic measurements to how humans perCIEve color. Two main values are used for this: CIELAB values and ∆E*. CIELAB is a complicated name for what is essentially a color wheel – or more accurately a color space. CIELAB color space was defined in 1976 by the Commission on Illumination (CIE) to standardize color differences (e.g. How different are these two red paints?). Unlike other color scales such as RGB and CMYK, the Lab or L*a*b* color scale approximates human vision. These values represent the lightness (L*), the red to green scale (a*), and the blue to

Visible Spectroscopy and Colorimetry
STELLARNET 2
Experiment 2: Cranberry-Apple Juice Analysis
yellow scale (b*) of a sample (see Figure 2). In this context, ∆E* does not represent the difference in energy but rather the difference between two colors. A ∆E* of 1 is the smallest perceptible unit of color difference. A ∆E* of 1 indicates that the color between two samples is indeed different. Colorimetry is often used for quality control applications. It allows you to easily determine if the color of a solid or liquid sample is what you expect. It also allows you to compare the color of two samples to determine if they are the same or different – which may not be perceptible to the human eye. In this experiment, you will use colorimetry along with absorbance spectroscopy to perform a quality control inspect of several different brands of cranberry-apple juice. Characterizing Data In this experiment, you will collect class data on the percentage of cranberry juice in several cranberry-apple juice brands. Scientists not only collect data but also characterize data in many different ways. Two of the most common ways are by calculating the mean and standard deviation for a data set. Mean and Standard Deviation
One way to characterize data to estimate the central value of the data set from all of the observations within the data set. For example, if you had three absorbance values from the same standard you might use a central absorbance value to represent the absorbance for that standard. The mean, 𝑋, is the numerical average for a data set. We can calculate the mean by dividing the sum of the individual values (e.g. 𝑋/) by the number of observation, 𝑁, in the data set.
𝑋 = 𝑋/ + 𝑋> + 𝑋? +⋯
𝑁
While the mean provides an estimate of an observation’s expected value, the standard deviation provides a measure of the spread of individual measurements. The standard deviation, 𝑠, describes the spread of a data set’s individual values (e.g. 𝑋/) about its mean, 𝑋.
𝑠 = (𝑋/ −𝑋)> + (𝑋> −𝑋)> +(𝑋? −𝑋)> + ⋯
𝑁 − 1
Outliers
Suppose you have five measurements for the density of water at 20˚C: 1.01 g/mL, 1.00 g/mL, 0.98 g/mL, 0.99 g/mL, and 0.79 g/mL. Just by looking at this data set you can see that the last density
Figure 2: CIELAB color space

Visible Spectroscopy and Colorimetry
STELLARNET 3
Experiment 2: Cranberry-Apple Juice Analysis
measurement is very different from the previous four densities for water. If you calculated the mean density of water using all of these observations you would obtain a value that is far from the actual density of water. Outliers are observations within a data set that are not consistent with the majority of observations. An outlier might exist for many reasons: the outlier might be from a different population (Was the last density for a sample of ethanol instead of water?), the outlier might be a contaminated or otherwise altered sample (Did the water sample get contaminated?), or the outlier may result from an error in the analysis (Did we forget to tare the balance? Did we use an incorrect volume to calculate density?). Regardless of its source of the outlier, we need a way to logically and consistently exclude outliers from a data set. This is where significance tests for identifying potential outliers come in handy. There are several different significance tests to determine if there are outliers present in a data set. The International Standards Organization (ISO) recommends using Grubb’s test for calculating outliers.8 To check a data set for one outlier you need to calculate the distance between the outlier’s value, 𝑋CDEFGHI , and the data set’s mean, 𝑋, in terms of the entire data set’s standard deviation, 𝑠.
𝐺HKL =𝑋CDEFGHI − 𝑋
𝑠 We then compare this value, 𝐺HKL, to a critical value 𝐺 𝛼,𝑁 , where 𝛼 is the probability of rejecting a valid data point and 𝑁 is the number of data points in the sample. Typically, an 𝛼 of 0.05 is used. This means that is a 5% chance that you will reject a valid data point (and conversely that there is a 95% chance you have correctly removed an outlier from your data set). There are many different values of 𝛼 that you can use; 0.01, 0.05, and 0.10 are the most common. Table 2 shows the critical values, 𝐺 0.05, 𝑁 , for an 𝛼 of 0.05. If 𝐺HKL is greater than 𝐺 𝛼,𝑁 , we can reject the data point as an outlier. Table 2: Critical values for Grubb’s test for 𝛼 = 0.05
N 𝐺 0.05, 𝑁 3 1.115 4 1.481 5 1.715 6 1.887 7 2.020 8 2.126 9 2.215 10 2.290
8 International Standards ISO Guide 5752-2 “Accuracy (trueness and precision) of measurement methods and results–Part 2: basic methods for the determination of repeatability and reproducibility of a standard measurement method,” 1994.

Visible Spectroscopy and Colorimetry
STELLARNET 4
Experiment 2: Cranberry-Apple Juice Analysis
EXPERIMENT PREPARATION Before you come to lab In preparation for this experiment, you should write a detailed procedure for how you will determine the percentage of cranberry juice in cranberry-apple juice. For example, you should describe the glassware you plan to use and why you chose these particular pieces of glassware. You should explain how you will create your pure cranberry standards and how you will use these standards to determine the percentage of cranberry juice in a sample of cranberry-apple juice. You should also think about what you will do if your standards or cranberry-apple juice sample are too concentrated for an accurate absorbance reading.
Collaboration You will work with a partner to complete this laboratory experiment. You and your partner should work on developing a procedure for this experiment together. It may be helpful to first write-up individual procedures and then discuss as a pair. You can then develop one unified procedure to determine the percentage of cranberry juice in cranberry-apple juice. At the end of this experiment, you will share your results with your laboratory section. This will allow you to determine the average percentage of cranberry juice in cranberry-apple juice and comment on the reliability of your class data.
Safety
In preparation for this experiment, you should look up hazard information on the chemicals and equipment used in this laboratory. This might include looking at the Material Safety Data Sheets (MSDS) or Safety Data Sheets (SDS) for the chemicals used in this experiment. Additionally, the Pharos Project’s Chemical and Materials database (https://www.pharosproject.net) provides a wealth of hazard and safety information on thousands of chemicals. You should identify the hazards associated with each chemical used in this experiment, the necessary personal protective equipment (e.g. lab coats, goggles) you should use, and any toxicology and ecological information. After completing this search, you should understand both how to handle chemicals safely in lab and how these chemicals effect the environment outside of your laboratory. Remember, the chemicals you use and the waste you generate don’t stay in lab – they have to be disposed of after you complete your experiment.

Visible Spectroscopy and Colorimetry
STELLARNET 5
Experiment 2: Cranberry-Apple Juice Analysis
PRELAB QUESTIONS
1. In your lab notebook, describe the
procedure you will use to determine the percentage of cranberry juice in cranberry-apple juice. This procedure should include enough detail that you could hand it to another scientist and they would be able to carry out your plan. For example, you should describe the glassware you plan to use and why you chose these particular pieces of glassware. You should explain how you will create your pure cranberry standards and how you will use these standards to determine the percentage of cranberry juice in a sample of cranberry-apple juice.
2. While your detailed procedure provides all the information necessary to complete this experiment, it is easy to lose the overall goal or purpose of the experiment in a sea of details. In your lab notebook, create an outline or flow chart (see Figure 3) that guides you through the main parts of this experiment. This diagram shouldn’t include every single detail of your
procedure. Instead, it should provide an overview of what you’ll be doing and why you’ll be doing it.
3. Based on the color of cranberry juice, what wavelengths of visible light will it transmit? What wavelengths will it absorb?
4. What assumption are we making about the absorbance spectrum of apple juice?
5. What solution will you use to blank the spectrometer?
6. What information can you use to determine if your standards or cranberry-apple juice sample are too concentrated for an accurate absorbance reading?
7. If a sample is too concentrated for an accurate absorbance reading, what should you do?
8. Describe what mean and standard deviation mean. What information do these two values provide you with for a set of data?
9. Describe what an outlier means. How does an outlier effect your data set’s mean and standard deviation?
Figure 3: Example flowchart

Visible Spectroscopy and Colorimetry
STELLARNET 6
Experiment 2: Cranberry-Apple Juice Analysis
PROCEDURE
Material and Equipment
Chemicals ü 100% cranberry juice ü Cranberry-apple juice samples ü 100% apple juice
Equipment ü Glassware for standard solution
preparation ü Cuvettes with caps ü Lint free wipes ü Spectrometer (Black Comet) ü Light source (deuterium and halogen)
and cuvette holder ü Computer or tablet ü Fiber optic cable ü USB cable
Absorbance of 100% Cranberry Juice Discuss your procedure for determining the percentage of cranberry juice in cranberry-apple juice. Record any changes to your procedure in your laboratory notebook. After your instructor approves your procedure prepare your cranberry juice standards and record the absorbance of each of these standards. Record your observations in your lab notebook and note any changes you make to your procedure. Spectrometer Setup
1. Take your prepared standard and blank cuvettes to the spectrometer. Make sure that your cuvettes are capped so you don’t accidently spill solution on or near the spectrometer.
2. Review the spectrometer system setup. Make sure that
Spectrometer Light
Source
Computer with
Software Fiber Optic
Cuvette holder
Figure 4: StellarNet spectrometer system (Black Comet spectrometer and SL5-CUV deuterium and halogen light source)

Visible Spectroscopy and Colorimetry
STELLARNET 7
Experiment 2: Cranberry-Apple Juice Analysis
the spectrometer system resembles Figure 4. Make sure that you can identify all the components of the spectrometer system.
3. Remove the cuvette holder cap. Place your blank cuvette into the cuvette holder and replace the cuvette holder cap.
4. Turn on the computer. Open the StellarNet software by double clicking on the desktop icon SpectraWiz to open the application.
5. When you first open the software, you should see a screen that looks like:
6. Click on the Scope icon (highlighted above). This will show you the number of counts
(photons) the detector reCIEves. You should see a spectrum of counts versus wavelength.
7. You now need to make sure that there are not too many photons making it to the detector. Click
on the integration time icon (and type in the integration time you want – a value between 1 and 1000 ms) or use sliding scale (both highlighted above). Set the integration time such that your spectrum is not saturated but as close to 65,000 counts as possible.
Saturation Limit (65,536 Counts)
Scope Icon
Integration Time
Dark Reference
Blank Reference
AU Icon
Visible Spectroscopy and Colorimetry
STELLARNET 8
Experiment 2: Cranberry-Apple Juice Analysis
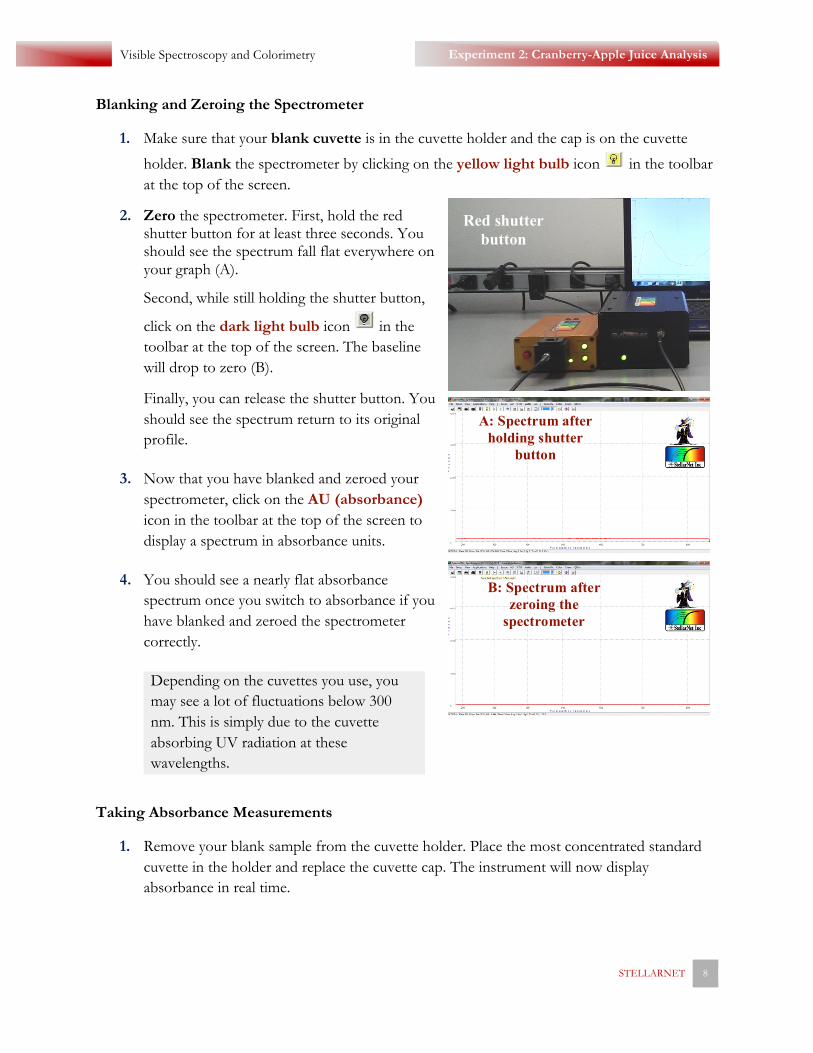
Blanking and Zeroing the Spectrometer
1. Make sure that your blank cuvette is in the cuvette holder and the cap is on the cuvette
holder. Blank the spectrometer by clicking on the yellow light bulb icon in the toolbar at the top of the screen.
2. Zero the spectrometer. First, hold the red shutter button for at least three seconds. You should see the spectrum fall flat everywhere on your graph (A).
Second, while still holding the shutter button,
click on the dark light bulb icon in the toolbar at the top of the screen. The baseline will drop to zero (B).
Finally, you can release the shutter button. You should see the spectrum return to its original profile.
3. Now that you have blanked and zeroed your spectrometer, click on the AU (absorbance) icon in the toolbar at the top of the screen to display a spectrum in absorbance units.
4. You should see a nearly flat absorbance spectrum once you switch to absorbance if you have blanked and zeroed the spectrometer correctly.
Depending on the cuvettes you use, you may see a lot of fluctuations below 300 nm. This is simply due to the cuvette absorbing UV radiation at these wavelengths.
Taking Absorbance Measurements
1. Remove your blank sample from the cuvette holder. Place the most concentrated standard cuvette in the holder and replace the cuvette cap. The instrument will now display absorbance in real time.
Red shutter button
A: Spectrum after holding shutter
button
B: Spectrum after zeroing the
spectrometer

Visible Spectroscopy and Colorimetry
STELLARNET 9
Experiment 2: Cranberry-Apple Juice Analysis
2. Look at the spectrum and select the wavelength of maximum absorbance (λmax). Sketch this spectrum in your lab notebook and label λmax. Make sure to label your axes. Use this wavelength for subsequent absorbance measurements.
3. To find a peak, use the mouse to right click on either of the following icons:
The left arrow will find a peak to the left of the vertical line in the spectra. The right arrow will find a peak to the right of the vertical line in the spectra.
4. You can also right click directly onto the spectrum to find the absorbance of a specific point. To find the specific wavelength your cursor is at, look to the bottom of the spectrum. Wave gives the specific wavelength and Val gives the absorbance for that particular point in the spectrum.
5. Record the absorbance for each one of your standard solutions.
6. Quickly sketch your calibration curve data using graphing paper, a graphing calculator, or a computer/tablet. You should produce a plot of absorbance versus concentration (percentage of cranberry juice). Make sure that your standard solutions adequately cover the linear range (usually between ~0.5 and ~1.5 absorbance units).

Visible Spectroscopy and Colorimetry
STELLARNET 10
Experiment 2: Cranberry-Apple Juice Analysis
Absorbance of Apple Juice 1. Fill a cuvette ¾ full with apple juice and cap the cuvette. Save this sample cuvette for the
colorimetry portion of this experiment.
1. Record a spectrum of your apple juice sample. Remember to blank the spectrometer again if it’s been more than 5 minutes since your last absorbance reading.
Make sure to use the same spectrometer for your apple juice sample as you did for measuring the absorbance of your standards. Why is this important to do?
2. Does the apple juice sample absorb at the λmax for cranberry juice? If so, how strongly does it absorb? Why is it important to note this value?
Absorbance of Cranberry-Apple Juice 1. For each cranberry-apple juice sample, fill a cuvette ¾ full with the juice and cap the cuvette.
Save these sample cuvettes for the colorimetry portion of this experiment.
2. Record a spectrum of the sample (see the previous section for spectrometer operating instructions). Remember to blank the spectrometer again if it’s been more than 5 minutes since your last absorbance reading. Record the absorbance of the sample at λmax for cranberry juice (determined in the previous section).
Make sure to use the same spectrometer for your cranberry-apple juice samples as you did for measuring the absorbance of your standards.
3. Dilute the cranberry-apple juice sample quantitatively if the absorbance is above the linear range. Record the absorbance value of your (diluted) sample at the chosen λmax.
4. Calculate the percentage of cranberry juice present in each cranberry-apple juice samples using Beer’s Law.
Sharing Data 1. Share your data with your laboratory class. See the Data Analysis section on the next page for
help with these calculations.
a. Report the cranberry juice percentages and absorbance values for your standard solutions. Indicate which standards you used for your final calibration curve along with the equation for the best-fit line of the data.
b. Report the absorbance of apple juice at λmax for cranberry juice.
c. Report the absorbance of each cranberry-apple juice sample along with your calculated percentages of cranberry juice in each cranberry-apple juice sample.

Visible Spectroscopy and Colorimetry
STELLARNET 11
Experiment 2: Cranberry-Apple Juice Analysis
Color Measurement of Cranberry-Apple Juice 1. You will now analyze your pure (100%) cranberry juice, apple juice, and cranberry-apple
juice samples using colorimetry. Take your capped cuvettes to the spectrometer.
2. Follow the same procedure you previously used to blank and zero the spectrometer. Make sure that the detector is not saturated (adjust the integration time if needed). What blank should you use for this measurement?
3. Now that you have blanked and zeroed your spectrometer, click on the %T:R (transmission) icon in the toolbar at the top of the screen to display a % transmission spectrum.
4. Place one of your samples in the cuvette holder. You should now see a % transmission
versus wavelength (nm) spectrum for your sample. What wavelengths of light are transmitted? What does this indicate about the color of your sample?
Transmission Mode
% transmittance Wavelength (nm)

Visible Spectroscopy and Colorimetry
STELLARNET 12
Experiment 2: Cranberry-Apple Juice Analysis
5. Click on the Applications icon in the toolbar at the top of the screen. In that dropdown menu, you should see the CIE Color Measurement option. Click on this option to display the CIELAB color wheel.
6. You should now see the CIELAB color wheel. Remember that L* is the lightness, a* is the
red to green scale, and b* the blue to yellow scale of your sample. Record L*, a*, and b* values (displayed at the bottom of the CIELAB color wheel) for each sample in your lab notebook. How do these values compare between the cranberry, apple, and cranberry-apple juice samples?
7. Save each sample’s CIELAB values by clicking the Save Sample button on the CIELAB screen. You will then be prompted to enter a sample ID.
8. Finally, you will quantitatively compare colors of your different juice samples. To do this you will need to save and load a standard sample.
Applications à CIE Color Measurement
b* axis
L* scale
a* axis
Icon indicates the a*b*
coordinates of the sample
Save Sample button

Visible Spectroscopy and Colorimetry
STELLARNET 13
Experiment 2: Cranberry-Apple Juice Analysis
9. Choose one of your cranberry-apple juice samples to serve as your standard sample. It doesn’t matter which one – just make sure to note which one you decide to use.
10. Place this sample in the cuvette holder. Click the Save Standard button on the CIELAB screen and provide a name for your standard.
11. Next click the Load Standard button on the CIELAB screen and select the standard you
just saved. This will allow you to compare this standard sample to all of your other apple, cranberry, and cranberry-apple juice samples. The ∆E* is displayed in the lower left-hand corner of the CIELAB screen. Record the ∆E* for each comparison in your lab notebook. Make sure to note which two solutions you’re comparing.
Load Standard button
Save Standard button
∆E* value

Visible Spectroscopy and Colorimetry
STELLARNET 14
Experiment 2: Cranberry-Apple Juice Analysis
DATA ANALYSIS
1. Calculate the percentage of cranberry juice in each of your standards.
2. Construct calibration plots of absorbance versus percentage of cranberry juice. Are any of your standards too concentrated or too dilute? Make an argument for why you should exclude certain data points from your calibration curve.
3. Use linear regression to determine the slopes (𝜀·b) of these curves. Report the R2 value for your linear regression.
4. Use Beer’s Law to calculate the extinction coefficient for the cranberry juice.
5. Determine the percentage of cranberry juice in each sample of cranberry-apple juice you analyzed.
DISCUSSION QUESTIONS
1. Compare the absorption spectra of 100% cranberry juice to 100% apple juice. Based on these spectra, does the apple juice contributes to the color of cranberry-apple juice at the λmax you selected? Explain.
2. If apple juice has a non-zero absorbance at the λmax, how does this affect calculated percentage of cranberry juice in cranberry-apple juice? Would your calculated percentage of cranberry juice in cranberry-apple juice be high or too low? Explain.
3. Now examine the class data set for the percentage of cranberry juice in each of the cranberry-apple juice samples. What trends do you notice? Are there any data points that stand out to you?
4. For the class data set, choose one cranberry-apple juice brand set to analyze further. Calculate the mean percentage and standard deviation of cranberry juice in this cranberry-apple juice brand. What do these two value tell you about the class data set for this sample?
5. Use Grubb’s test to determine if there is an outlier in your data set. Speculate on why there are or are not outliers in your chosen data set.
6. Summarize your colorimetry results. Did you notice any trends in L*a*b* or ∆E* values between solutions? Which juices had different colors (indicated by a ∆E* value greater than 1)?
7. Based on your colorimetry results what can you say about the concentration or consistency cranberry juice in different brands of cranberry-apple juice? Does this align with your absorbance spectroscopy results?
8. In what situations might you prefer to use colorimetry instead of absorbance spectroscopy? Conversely, when might you prefer to use absorbance spectroscopy instead of colorimetry?