SpectraMax® i3...
201
www.moleculardevices.com SpectraMax® i3 Multi-Mode Detection Platform with the SpectraMax® MiniMax™ Imaging Cytometer User Guide 5025027 A April 2013
Transcript of SpectraMax® i3...

www.moleculardevices.com
SpectraMax® i3Multi-Mode Detection Platform
with the SpectraMax® MiniMax™ Imaging Cytometer
User Guide
5025027 AApril 2013

SpectraMax i3 Multi-Mode Detection Platform User Guide
2 5025027 A
This document is provided to customers who have purchased Molecular Devices, LLC (“MolecularDevices”) equipment, software, reagents, and consumables to use in the operation of such MolecularDevices equipment, software, reagents, and consumables. This document is copyright protected andany reproduction of this document, in whole or any part, is strictly prohibited, except as MolecularDevices may authorize in writing.
Software that may be described in this document is furnished under a license agreement. It is againstthe law to copy, modify, or distribute the software on any medium, except as specifically allowed inthe license agreement. Furthermore, the license agreement may prohibit the software from beingdisassembled, reverse engineered, or decompiled for any purpose.
Portions of this document may make reference to other manufacturers and/or their products, whichmay contain parts whose names are registered as trademarks and/or function as trademarks of theirrespective owners. Any such usage is intended only to designate those manufacturers’ products assupplied by Molecular Devices for incorporation into its equipment and does not imply any right and/orlicense to use or permit others to use such manufacturers’ and/or their product names as trademarks.
Molecular Devices makes no warranties or representations as to the fitness of this equipment for anyparticular purpose and assumes no responsibility or contingent liability, including indirect orconsequential damages, for any use to which the purchaser may put the equipment described herein,or for any adverse circumstances arising therefrom.
For research use only. Not for use in diagnostic procedures.
The trademarks mentioned herein are the property of Molecular Devices, LLC or their respective owners. These trademarks may notbe used in any type of promotion or advertising without the prior written permission of Molecular Devices, LLC.
Patents: http://www.moleculardevices.com/productpatents
This product uses FreeRTOS v7.2.0. The full source code is available at www.freertos.org.
Product manufactured by Molecular Devices, LLC.1311 Orleans Drive, Sunnyvale, California, United States of America 94089.Molecular Devices, LLC is ISO 9001 registered.© 2013 Molecular Devices, LLC.All rights reserved.

5025027 A 3
Contents
Safety Information 7
Warnings, Cautions, Notes, and Tips 7
Symbols on Instrument Labels 8
Before Operating the Instrument 8
Electrical Safety 9
Laser Safety 10
Chemical and Biological Safety 12
Moving Parts Safety 13
Cleaning and Maintenance Safety 14
Chapter 1: Introduction 15
Applications 16
Optics 16
Microplate Controls 17
Environmental Controls 18
Chapter 2: Read Modes and Read Types 19
Supported Read Types 19
Absorbance Read Mode 22
Fluorescence Intensity Read Mode 27
Luminescence Read Mode 31
Time-Resolved Fluorescence Read Mode 36
HTRF Read Mode 41
Fluorescence Polarization Read Mode 45
AlphaScreen Read Mode 49
Imaging Read Mode 53
Chapter 3: Unpacking and Setting Up the Instrument 57
Contents of the Package 58
Unpacking the Instrument 59
Removing the Transport Locks 63
Connecting the Instrument Cables 66
Connecting and Disconnecting a Gas Supply 68

SpectraMax i3 Multi-Mode Detection Platform User Guide
4 5025027 A
Chapter 4: Using the Instrument 71
Front Panel Controls and Indicators 72
Turning the Instrument On and Off 74
Loading and Unloading Microplates 76
Using Detection Cartridges 78
Chapter 5: SpectraMax MiniMax Imaging Cytometer 85
Installing and Setting Up the Cytometer 85
About Whole-Cell Imaging 101
Using the Imaging Cytometer 105
Microplate Recommendations 107
Transmitted Light (TL) Detection Cartridge 108
Cytometer Maintenance and Troubleshooting 109
Chapter 6: Available Detection Cartridges 123
AlphaScreen Detection Cartridges 124
Cisbio HTRF Detection Cartridge 127
Time Resolved Fluorescence (TRF) Detection Cartridge 130
Fluorescence Intensity (FI) Detection Cartridges 133
Fluorescence Intensity (FI) GeneBLAzer Detection Cartridge 136
Fluorescence Polarization (FP) Detection Cartridge 139
Glow Luminescence (LUM) Detection Cartridges 141
Dual Color Luminescence (LUM) (BRET2) Detection Cartridge 144
Dual Color Luminescence (LUM) (Chroma-Glo) Detection Cartridge 149
Chapter 7: Maintenance and Troubleshooting 155
Performing PreventiveMaintenance 156
Cleaning the Instrument 157
Replacing Fuses 158
Moving the Instrument 160
Packing the Instrument for Storage or Service 161
Troubleshooting 170
Obtaining Support 171
Appendix A: Instrument Specifications 173
Measurement Specifications 173
Cytometer Measurement Specifications 176
5025027 A 5
Computer System Specifications 177
Imaging Cytometer Computer System Specifications 178
Physical Specifications 179
Appendix B: System Diagrams and Dimensions 181
Appendix C: Electromagnetic Compatibility 187
Glossary 189
Index 197

SpectraMax i3 Multi-Mode Detection Platform User Guide
6 5025027 A

5025027 A 7
Safety Information
The safety information section provides information on the safe use of the instrument,including the use of user-attention words in this guide, a key to understanding the safetylabels on the instrument, precautions to follow before operating the instrument, andprecautions to followwhile operating the instrument.Please read and observe all warnings, cautions, and instructions. Remember, themostimportant key to safety is to operate the instrument with care.
WARNING! If the instrument is used in a manner not specified by MolecularDevices, the protection provided by the equipment might be impaired.
Warnings, Cautions, Notes, and TipsAll warning symbols in the user guide are framed within a yellow triangle. An exclamationmark is used for most warnings. Other symbols can warn of other types of hazards such asbiohazard, electrical, or laser safety warnings as are described in the text of the warning.When warnings and cautions appear in this guide, pay special attention to the specific safetyinformation associated with them.The following user-attention statements can appear in the text ofMolecular Devices userdocumentation. Each statement implies a particular level of observation or action asdescribed:
WARNING! A warning indicates a situation or operation that could causepersonal injury if precautions are not followed.
CAUTION! A caution indicates a situation or operation that could cause damage tothe instrument or loss of data if correct procedures are not followed.
Note: A note calls attention to significant information.
Tip: A tip provides useful information or a shortcut, but is not essential to thecompletion of a procedure.

SpectraMax i3 Multi-Mode Detection Platform User Guide
8 5025027 A
Symbols on Instrument LabelsEach safety label located on the instrument contains an alert symbol that indicates the typeof potential safety hazard associated with the label. The following table lists the alert symbolsthat can be found on Molecular Devices instruments.
Symbol Indication
This warning symbol indicates that the product documentation needs to be consulted.
This warning symbol indicates a laser hazard. The instrument is rated a Class 1 Laser Productbecause it can house one or more laser modules, and the laser light is not accessible. SeeLaser Safety on page 10.
This warning symbol indicates a potential lifting hazard. To prevent injury, use at least twopeople to lift the instrument. For information about the weight of the instrument, see PhysicalSpecifications on page 179.
This symbol on the power switch indicates power on. See Turning the Instrument On and Offon page 74.
This symbol on the power switch indicates power off. See Turning the Instrument On and Offon page 74.
This symbol on the product is required in accordance with the Waste Electrical and ElectronicEquipment (WEEE) Directive of the European Union. It indicates that you must not discard thiselectrical or electronic product or its components in domestic household waste or in themunicipal waste collection system.
For products under the requirement of the WEEE directive, please contact your dealer or localMolecular Devices office for the procedures to facilitate the proper collection, treatment,recovery, recycling, and safe disposal of the device.
Table S-1: Instrument Label Alert Symbols
Before Operating the InstrumentEnsure that everyone involved with the operation of the instrument has:
Received instruction in general safety practices for laboratories.
Received instruction in specific safety practices for the instrument.
Read and understood all Safety Data Sheets (SDS) for any materials being used.
Safety Information
5025027 A 9
Electrical SafetyTo prevent electrically related injuries and property damage, properly inspect all electricalequipment prior to use and immediately report any electrical deficiencies. Contact MolecularDevices technical support for any servicing of equipment requiring the removal of covers orpanels.
WARNING! HIGH VOLTAGE. Within the instrument is the potential of anelectrical shock hazard existing from a high voltage source. All safety instructionsshould be read and understood before proceeding with the installation,maintenance, and servicing of all modules.
Do not remove the instrument covers. To avoid electrical shock, use the supplied powercords only and connect to a properly grounded wall outlet. Use only multi-plug power stripsthat are provided by themanufacturer.
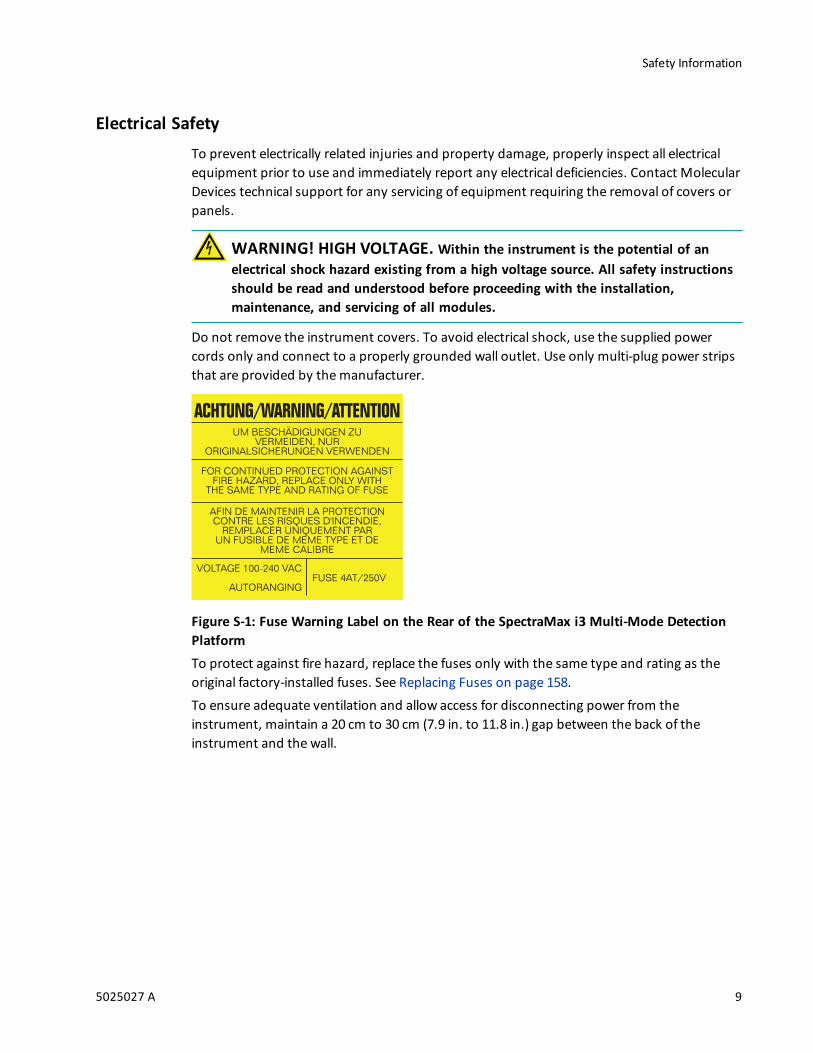
Figure S-1: Fuse Warning Label on the Rear of the SpectraMax i3 Multi-Mode DetectionPlatformTo protect against fire hazard, replace the fuses only with the same type and rating as theoriginal factory-installed fuses. See Replacing Fuses on page 158.To ensure adequate ventilation and allow access for disconnecting power from theinstrument, maintain a 20 cm to 30 cm (7.9 in. to 11.8 in.) gap between the back of theinstrument and the wall.
SpectraMax i3 Multi-Mode Detection Platform User Guide
10 5025027 A
Laser Safety
WARNING! LASER LIGHT. This symbol indicates that a potential hazard topersonal safety exists from a laser source. When this symbol is displayed in thisguide, pay special attention to the specific safety information associated with thesymbol.
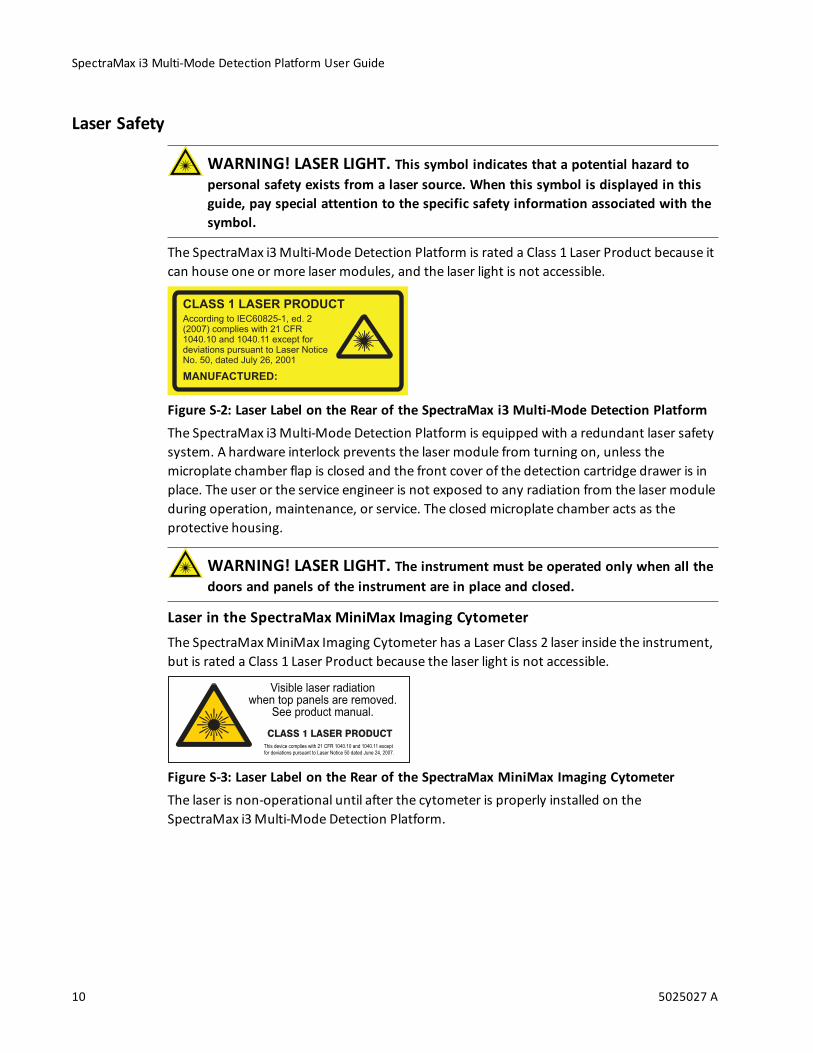
The SpectraMax i3Multi-Mode Detection Platform is rated a Class 1 Laser Product because itcan house one or more laser modules, and the laser light is not accessible.
CLASS 1 LASER PRODUCT
According to IEC60825-1, ed. 2(2007) complies with 21 CFR1040.10 and 1040.11 except fordeviations pursuant to Laser NoticeNo. 50, dated July 26, 2001
MANUFACTURED:
Figure S-2: Laser Label on the Rear of the SpectraMax i3 Multi-Mode Detection PlatformThe SpectraMax i3Multi-Mode Detection Platform is equipped with a redundant laser safetysystem. A hardware interlock prevents the laser module from turning on, unless themicroplate chamber flap is closed and the front cover of the detection cartridge drawer is inplace. The user or the service engineer is not exposed to any radiation from the laser moduleduring operation, maintenance, or service. The closed microplate chamber acts as theprotective housing.
WARNING! LASER LIGHT. The instrument must be operated only when all thedoors and panels of the instrument are in place and closed.
Laser in the SpectraMax MiniMax Imaging CytometerThe SpectraMax MiniMax Imaging Cytometer has a Laser Class 2 laser inside the instrument,but is rated a Class 1 Laser Product because the laser light is not accessible.
Visible laser radiationwhen top panels are removed.
See product manual.
This device complies with 21 CFR 1040.10 and 1040.11 except
for deviations pursuant to Laser Notice 50 dated June 24, 2007.
Figure S-3: Laser Label on the Rear of the SpectraMax MiniMax Imaging CytometerThe laser is non-operational until after the cytometer is properly installed on theSpectraMax i3Multi-Mode Detection Platform.

Safety Information
5025027 A 11
Laser or Laser Diodes in Detection CartridgesSome detection cartridges can have a laser or laser diode up to Laser Class 4 inside thedetection cartridge. The lasers are non-operational until after the detection cartridges areproperly installed in the SpectraMax i3Multi-Mode Detection Platform.
CAUTION
ATTENTION
CLASS 4 INVISIBLE AND/OR VISIBLE LASER
RADIATION WHEN OPEN AND INTERLOCKS
DEFEATED.
AVOID EYE OR SKIN EXPOSURE TO DIRECT
OR SCATTERED RADIATION.
RAYONNEMENT LASER DE CLASSE 4 - EN CAS
D'OUVERTURE EXPOSITION DANGEREUSE
AU RAYONNEMENT DIRECT OU DIFFUS DES
YEUX OU DE LA PEAU
Figure S-4: Laser Label on the Bottom of the SpectraMax i3 Multi-Mode DetectionPlatformThe optics-access cover on the bottom of the SpectraMax i3Multi-Mode Detection Platformhas a hardware interlock that prevents the laser module from turning on, unless the cover isin place. The installed cover acts as the protective housing.

SpectraMax i3 Multi-Mode Detection Platform User Guide
12 5025027 A
Chemical and Biological SafetyNormal operation of the instrument can involve the use ofmaterials that are toxic,flammable, or otherwise biologically harmful. When using such materials, observe thefollowing precautions:
Handle infectious samples according to good laboratory procedures and methods toprevent the spread of disease.
Observe all cautionary information printed on the original containers of solutions priorto their use.
Dispose of all waste solutions according to the waste disposal procedures of your facility.
Operate the instrument in accordance with the instructions outlined in this guide, andtake all the necessary precautions when using pathological, toxic, or radioactivematerials.
Splashing of liquids can occur. Therefore, take appropriate safety precautions, such asusing safety glasses and wearing protective clothing, when working with potentiallyhazardous liquids.
Use an appropriately contained environment when using hazardous materials.
Use a compressed gas supply in a well ventilated area. The instrument is not air-tight,and so gas can escape into the atmosphere surrounding the instrument. When usingpotentially toxic gas, always observe the appropriate cautionary procedures as definedby your safety officer to maintain a safe working environment.
Observe the appropriate cautionary procedures as defined by your safety officer whenusing flammable solvents in or near a powered-up instrument.
Observe the appropriate cautionary procedures as defined by your safety officer whenusing toxic, pathological, or radioactivematerials.
WARNING! BIOHAZARD. Never perform any operation on the instrument inan environment where liquids or potentially damaging gases are present.
CAUTION! Use of organic solvents (such as dichloromethane) can cause harm to theoptics in the instrument. Extreme caution is advised when using organic solvents.Always use a plate lid and avoid placing a plate containing thesematerials in themicroplate chamber for prolonged periods of time. Damage caused by the use ofincompatible or aggressive solvents is NOT covered by the instrument warranty.

Safety Information
5025027 A 13
Moving Parts SafetyTo avoid injury due to moving parts, observe the following:
Never attempt to exchange labware, reagents, or tools while the instrument is operating.
Never attempt to physically restrict any of themoving components of the instrument.
Keep the instrument work area clear to prevent obstruction of themovement. Allowclearance from the front of the instrument of 18 cm (7.1 in.) for themicroplate drawerand 15 cm (5.9 in.) for the detection cartridge drawer.
CAUTION! To prevent damage to the instrument, the height of themicroplatemustnot exceed 25 mm.
Transport locks are placed on the detection cartridge drawer and themicroplate drawer toprotect the instrument from damage during shipping. Transport locks must be removedbefore powering on the instrument.
REMOVE BOTH TRANSPORT LOCKS
(CARTRIDGE DRAWER AND PLATE DRAWER)
BEFORE SWITCHING THE DEVICE ON
Figure S-5: Temporary Warning Label On Power SwitchTo move themicroplate drawer or the detection cartridge drawer into or out of theinstrument, always use the buttons on the keypad or the controls in the software. SeeLoading and Unloading Microplates on page 76 or Using Detection Cartridges on page 78.
CAUTION! To prevent damage to the installed detection cartridges and theinstrument, do not manually slide the detection cartridge drawer in or out when oneor more detection cartridges are installed in the drawer.
DON’T MOVE
CARTRIDGE
DRAWER
MANUALLY
ONLY LOAD / REMOVE
CARTRIDGES BY PRESSING
TOP READ BUTTON ON LEFT
Figure S-6: Warning Label Behind the Detection Cartridge Drawer Cover
Note: Observe all warnings and cautions listed for any external devices attached to orin use during the operation of the instrument. See the applicable user guide for theoperating and safety procedures of that device.

SpectraMax i3 Multi-Mode Detection Platform User Guide
14 5025027 A
Cleaning and Maintenance SafetyObserve the cleaning procedures outlined in this user guide for the instrument.Do the following prior to cleaning equipment that has been exposed to hazardous material:
Contact the appropriate Chemical and Biological Safety personnel.
Review the Chemical and Biological Safety information contained in this user guide.
Perform only themaintenance described in this guide. Maintenance procedures other thanthose specified in this guide should be performed only by Molecular Devices serviceengineers.
WARNING! BIOHAZARD. It is your responsibility to decontaminatecomponents of the instrument before requesting service by a service engineer orreturning parts to Molecular Devices for repair. Molecular Devices will not acceptany items which have not been decontaminated where it is appropriate to do so.If any parts are returned, they must be enclosed in a sealed plastic bag stating thatthe contents are safe to handle and are not contaminated.
For approved cleaning and maintenance procedures, seeMaintenance and Troubleshootingon page 155.

5025027 A 15
Chapter 1: Introduction
The SpectraMax® i3Multi-Mode Detection Platform from Molecular Devices® is amonochromator-based, multi-mode detection platform. An external computer running theSoftMax® Pro Microplate Data Acquisition and Analysis Software provides integratedinstrument control, data display, and statistical data analysis.The built-in read modes include:
UV and Visible Absorbance (ABS), see Absorbance Read Mode on page 22.
Fluorescence Intensity (FL), see Fluorescence Intensity Read Mode on page 27.
Luminescence (LUM), see Luminescence Read Mode on page 31.
The read capabilities of the SpectraMax i3 Instrument can be upgraded with user-installabledetection cartridges. A detection cartridge contains its own independent light source, optics,and electrical components needed to perform specific read modes for specific applications.Up to four detection cartridges can be installed in the detection cartridge drawer. For theSpectraMax i3Multi-Mode Detection Platform, the detection cartridges can be used for topreads. For information about detection cartridges, see Available Detection Cartridges onpage 123.For most read modes, endpoint, kinetic, multi-point well-scan, and spectrum microplateapplications can be set up and run with the SoftMax Pro Software.For more information on the supported read types, see the following topics:
Endpoint Read Type on page 20
Kinetic Read Type on page 20
Well Scan Read Type on page 21
Spectrum Read Type on page 21
The SpectraMax® MiniMax™ Imaging Cytometer adds imaging capability to theSpectraMax i3 Instrument to visually inspect your sample and to run cell-based assays atcellular or whole-cell resolution. See SpectraMax MiniMax Imaging Cytometer on page 85.Depending on the application, the instrument can read 6, 12, 24, 48, 96, and 384-wellmicroplates. For micro-volumemeasurements, the instrument supports SpectraDrop 24-wellmicro-volumemicroplates and SpectraDrop 64-well micro-volumemicroplates. Theinstrument is capable of reading 1536-well microplates when used with specific detectioncartridges. See Selecting SuitableMicroplate Types on page 77.
CAUTION! To prevent damage to the instrument, the height of themicroplatemustnot exceed 25 mm.
1
SpectraMax i3 Multi-Mode Detection Platform User Guide
16 5025027 A
The SoftMax Pro Software can collect data from one or moremicroplates and store it in asingle data file, using the same or different instrument settings for different microplates.Assays requiring a read in two or more read modes or read types can be combined in a singleexperiment and run with a single command in the software, by defining separatemicroplatereads and enabling Auto Read. For information on the acquisition and analysis capabilities ofthe software, see the SoftMax Pro Software application help or user guide.
ApplicationsThe high sensitivity and flexibility of the SpectraMax i3 Instrument make it appropriate forapplications in the fields of biochemistry, cell biology, immunology, molecular biology, andmicrobiology.Typical application include ELISA, nucleic acid, protein, enzymatic type homogeneous andheterogeneous assays, microbial growth, endotoxin testing, and pipettor calibration.Application notes with specific application protocol suggestions can be found in theInformation Center and the Knowledge Base on theMolecular Devices web site atwww.moleculardevices.com.
OpticsThe 2x2monochromators allow for individual optimization of wavelengths for bothexcitation and emission in fluorescence readings. Mirrored optics shape the light, and aheight-adjustable objective lens focuses the beam into the sample volume. The SpectralFusion™ Illumination uses the spectral range of a high power Xenon flash lamp intensified byLEDs in the visible range. Automatic LED power adjustment is used with high PMT Gain whenthe excitation wavelength is between 430 nm and 680 nm for high sensitivity across multiplefluorophores. Outside of the LED range, PMT Gain can be set to automatic or user-selectedat high, medium, low, aremanual.
Dynamic RangeThe dynamic range of detection is approximately from 10-6 to 10-12molar fluorescein.Variations in measured fluorescence values are virtually eliminated by internal compensationfor detector sensitivity, photomultiplier tube voltage and sensitivity, and excitation intensity.The photometric range is 0.000 to 4.000 ODs with a resolution of 0.001 OD.
CAUTION! Never touch any of the optic mirrors, lenses, filters, or cables. The opticsare extremely delicate, and critical to the function of the instrument.
CAUTION! Use of organic solvents (such as dichloromethane) can cause harm to theoptics in the instrument. Extreme caution is advised when using organic solvents.Always use a plate lid and avoid placing a plate containing thesematerials in themicroplate chamber for prolonged periods of time. Damage caused by the use ofincompatible or aggressive solvents is NOT covered by the instrument warranty.

Chapter 1: Introduction
5025027 A 17
Microplate ControlsMicroplate controls include Automix and On-the-Fly Detection.
AutomixThe Automix feature of the SoftMax Pro Software permits the contents of the wells in amicroplate to bemixed automatically inside themicroplate chamber before each read cycle,making it possible to perform kinetic analysis of solid-phase, enzyme-mediated reactions.Automixmust be selected before beginning a read. The actions associated with the Automixsetting depend on the selected read mode:
In endpoint read mode, Automix shakes the plate for a definable number of seconds andthen reads at all selected wavelengths.
In kinetic read mode, Automix can shake the plate for a definable number of secondsbefore the initial reading, and for a definable number of seconds before each subsequentreading.
The following Automix settings are available for the SpectraMax i3 Instrument:
Intensity: Low, Medium, or High. Actual shake speed is based on themicroplate format.
Direction: Linear or Orbital patterns.
Duration: Length of time in seconds (1 to 999).
Molecular Devices strongly recommends the use of Automix for ELISAs and other solid-phase, enzyme-mediated reactions to enhance accuracy.
SpectraMax i3 Multi-Mode Detection Platform User Guide
18 5025027 A
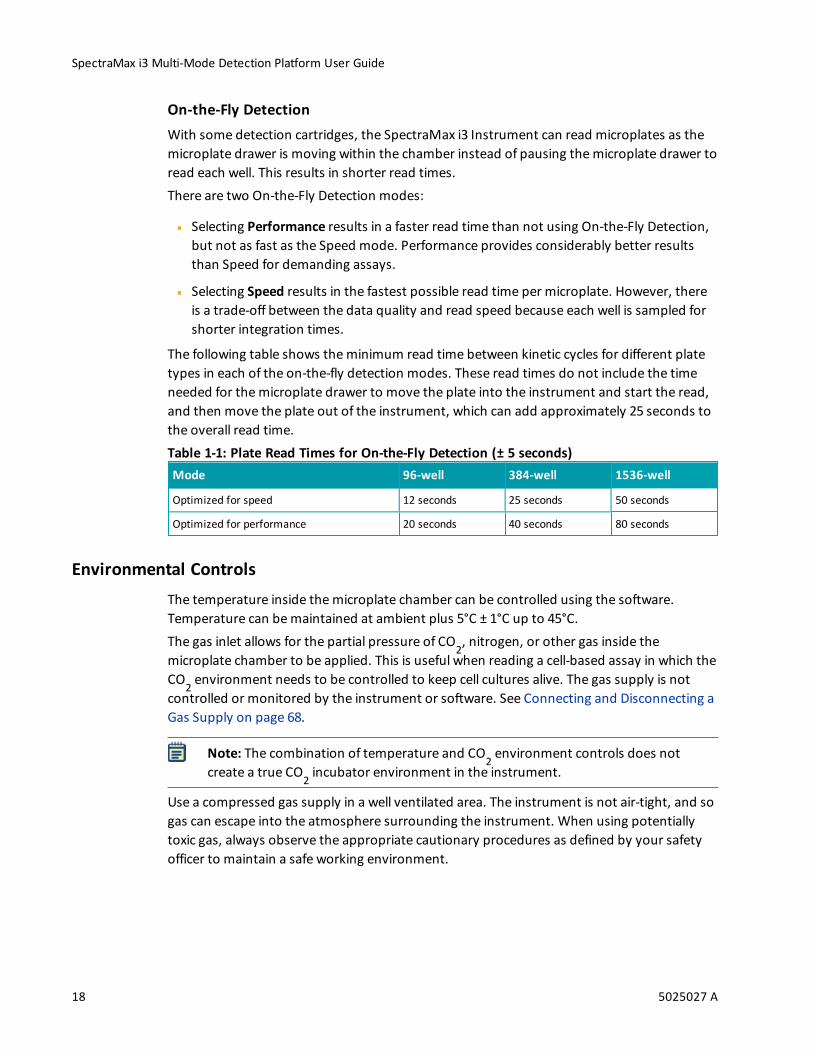
On-the-Fly DetectionWith some detection cartridges, the SpectraMax i3 Instrument can read microplates as themicroplate drawer is moving within the chamber instead of pausing themicroplate drawer toread each well. This results in shorter read times.There are two On-the-Fly Detection modes:
Selecting Performance results in a faster read time than not using On-the-Fly Detection,but not as fast as the Speed mode. Performance provides considerably better resultsthan Speed for demanding assays.
Selecting Speed results in the fastest possible read time per microplate. However, thereis a trade-off between the data quality and read speed because each well is sampled forshorter integration times.
The following table shows theminimum read time between kinetic cycles for different platetypes in each of the on-the-fly detection modes. These read times do not include the timeneeded for themicroplate drawer to move the plate into the instrument and start the read,and then move the plate out of the instrument, which can add approximately 25 seconds tothe overall read time.
Mode 96-well 384-well 1536-well
Optimized for speed 12 seconds 25 seconds 50 seconds
Optimized for performance 20 seconds 40 seconds 80 seconds
Table 1-1: Plate Read Times for On-the-Fly Detection (± 5 seconds)
Environmental ControlsThe temperature inside themicroplate chamber can be controlled using the software.Temperature can bemaintained at ambient plus 5°C ± 1°C up to 45°C.The gas inlet allows for the partial pressure of CO
2, nitrogen, or other gas inside the
microplate chamber to be applied. This is useful when reading a cell-based assay in which theCO
2environment needs to be controlled to keep cell cultures alive. The gas supply is not
controlled or monitored by the instrument or software. See Connecting and Disconnecting aGas Supply on page 68.
Note: The combination of temperature and CO2environment controls does not
create a true CO2incubator environment in the instrument.
Use a compressed gas supply in a well ventilated area. The instrument is not air-tight, and sogas can escape into the atmosphere surrounding the instrument. When using potentiallytoxic gas, always observe the appropriate cautionary procedures as defined by your safetyofficer to maintain a safe working environment.

5025027 A 19
Chapter 2: Read Modes and Read Types
The SpectraMax i3 Instrument can measure samples in absorbance (ABS), fluorescenceintensity (FL), and luminescence (LUM) read modes.The read capabilities of the SpectraMax i3 Instrument can be upgraded with user-installabledetection cartridges. A detection cartridge contains its own independent light source, optics,and electrical components needed to perform specific read modes for specific applications.The SpectraMax® MiniMax™ Imaging Cytometer adds imaging capability to theSpectraMax i3 Instrument to visually inspect your sample and to run cell-based assays atcellular or whole-cell resolution. See SpectraMax MiniMax Imaging Cytometer on page 85.Use the SoftMax Pro Software to define the parameters for the read mode and read type ofyour assay. See the SoftMax Pro Software application help or user guide.Application notes with specific application protocol suggestions can be found in theInformation Center and the Knowledge Base on theMolecular Devices web site atwww.moleculardevices.com.For more information on the supported read modes, see the following topics:
Absorbance Read Mode on page 22
Fluorescence Intensity Read Mode on page 27
Luminescence Read Mode on page 31
Time-Resolved Fluorescence Read Mode on page 36
Fluorescence Polarization Read Mode on page 45
AlphaScreen Read Mode on page 49
HTRF Read Mode on page 41
Imaging Read Mode on page 53
Supported Read TypesFor most read modes, endpoint, kinetic, multi-point well-scan, and spectrum microplateapplications can be set up and run with the SoftMax Pro Software.For more information on the supported read types, see the following topics:
Endpoint Read Type on page 20
Kinetic Read Type on page 20
Well Scan Read Type on page 21
Spectrum Read Type on page 21
2

SpectraMax i3 Multi-Mode Detection Platform User Guide
20 5025027 A
Endpoint Read Type
In an Endpoint read, a reading of each microplate well is taken in the center of each well, at asingle wavelength or at multiple wavelengths. Depending on the read mode, raw data valuesare reported as optical density (OD), %Transmittance (%T), relative fluorescence units (RFU),or relative luminescence units (RLU).
Kinetic Read Type
In a Kinetic read, the instrument collects data over timewith multiple readings taken atregular intervals.The values calculated based on raw kinetic data include VMax, VMax per Sec, Time to VMax,and Onset Time. Kinetic readings can be single-wavelength or multiple-wavelength readings.Kinetic analysis can be performed for up to 99 hours. The kinetic read interval depends onthe instrument setup parameters selected in the SoftMax Pro Software.Kinetic analysis has many advantages when determining the relative activity of an enzyme indifferent types ofmicroplate assays, including ELISAs and the purification andcharacterization of enzymes and enzyme conjugates. Kinetic analysis is capable of providingimproved dynamic range, precision, and sensitivity relative to endpoint analysis.
Peak Pro™ Analysis functions provide advanced peak detection and characterization forapplicable kinetic reads. See the SoftMax Pro Software Formula Reference Guide.
Chapter 2: Read Modes and Read Types
5025027 A 21
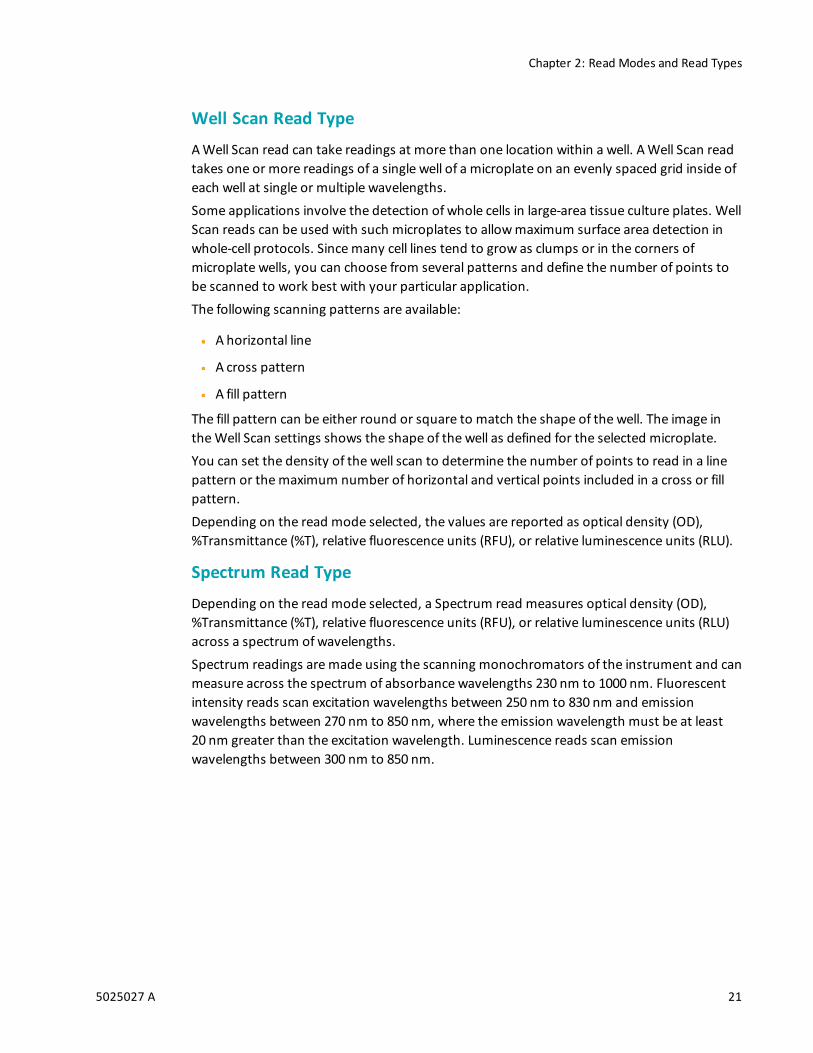
Well Scan Read Type
AWell Scan read can take readings at more than one location within a well. AWell Scan readtakes one or more readings of a single well of a microplate on an evenly spaced grid inside ofeach well at single or multiple wavelengths.Some applications involve the detection of whole cells in large-area tissue culture plates. WellScan reads can be used with such microplates to allowmaximum surface area detection inwhole-cell protocols. Sincemany cell lines tend to grow as clumps or in the corners ofmicroplate wells, you can choose from several patterns and define the number of points tobe scanned to work best with your particular application.The following scanning patterns are available:
A horizontal line
A cross pattern
A fill pattern
The fill pattern can be either round or square to match the shape of the well. The image intheWell Scan settings shows the shape of the well as defined for the selected microplate.You can set the density of the well scan to determine the number of points to read in a linepattern or themaximum number of horizontal and vertical points included in a cross or fillpattern.Depending on the read mode selected, the values are reported as optical density (OD),%Transmittance (%T), relative fluorescence units (RFU), or relative luminescence units (RLU).
Spectrum Read Type
Depending on the read mode selected, a Spectrum read measures optical density (OD),%Transmittance (%T), relative fluorescence units (RFU), or relative luminescence units (RLU)across a spectrum ofwavelengths.Spectrum readings aremade using the scanning monochromators of the instrument and canmeasure across the spectrum of absorbance wavelengths 230 nm to 1000 nm. Fluorescentintensity reads scan excitation wavelengths between 250 nm to 830 nm and emissionwavelengths between 270 nm to 850 nm, where the emission wavelength must be at least20 nm greater than the excitation wavelength. Luminescence reads scan emissionwavelengths between 300 nm to 850 nm.

SpectraMax i3 Multi-Mode Detection Platform User Guide
22 5025027 A
Absorbance Read ModeIn the Absorbance (ABS) read mode, the instrument measures the Optical Density (OD) ofthe sample solutions.Absorbance is the amount of light absorbed by a solution. To measure absorbanceaccurately, it is necessary to eliminate light scatter. In the absence of turbidity,absorbance = optical density.
A = log10(I0 /I) = –log
10(I/I
0)
where I0is incident light before it enters the sample, I is the intensity of light after it passes
through the sample, and A is themeasured absorbance.For Absorbance reads, you can choose whether to display absorbance data as OpticalDensity (OD) or %Transmittance (%T) in the Reduction dialog.Optical DensityOptical density (OD) is the amount of light passing through a sample to a detector relative tothe total amount of light available. Optical Density includes absorbance of the sample pluslight scatter from turbidity and background. You can compensate for background usingblanks.A blank well contains everything used with the sample wells except the chromophore andsample-specific compounds. Do not use an empty well for a blank.Some applications are designed for turbid samples, such as algae or other micro-organismsin suspension. The reported OD values for turbid samples are likely to be different when readby different instruments.For optimum results, Molecular Devices recommends that you run replicates for all blanks,controls, and samples. In this case, the blank value that can be subtracted is the averagevalue of all blanks.% Transmittance%Transmittance is the ratio of transmitted light to the incident light for absorbance reads.
T = I/I0
%T = 100Twhere I is the intensity of light after it passes through the sample and I
0is incident light
before it enters the sample.Optical Density and %Transmittance are related by the following formulas:
%T = 102–OD
OD = 2 – log10(%T)
The factor of two comes from the fact that %T is expressed as a percent of the transmittedlight and log
10(100) = 2.
When in %Transmittance analysis mode, the SoftMax Pro Software converts the rawODvalues reported by the instrument to %Transmittance using the above formula. Allsubsequent calculations are performed on the converted numbers.

Chapter 2: Read Modes and Read Types
5025027 A 23
Applications of AbsorbanceAbsorbance-based detection has been commonly used to assess changes in color orturbidity, allowing for widespread use including ELISAs, protein quantitation, endotoxinassays, and cytotoxicity assays. With absorbance readers that are capable ofmeasuring inthe ultraviolet (UV) range, the concentration of nucleic acids (DNA and RNA) can be foundusing their molar extinction coefficients.For micro-volumemeasurements, you can use SpectraDrop 24-well micro-volumemicroplates and SpectraDrop 64-well micro-volumemicroplates.
PathCheck Pathlength Measurement Technology
The temperature-independent PathCheck® Pathlength Measurement Technologynormalizes your absorbance values to a 1 cm path length based on the near-infraredabsorbance of water.The Beer–Lambert law states that absorbance is proportional to the distance that lighttravels through the sample:
A = εbcwhere A is the absorbance, ε is themolar absorbtivity of the sample, b is the pathlength, andc is the concentration of the sample. The longer the pathlength, the higher the absorbance.Microplate readers use a vertical light path so the distance of the light through the sampledepends on the volume. This variable pathlength makes it difficult to perform extinction-based assays and also makes it confusing to compare results between microplate readersand spectrophotometers.The standard pathlength of a 1 cm cuvette is the conventional basis for quantifying theunique absorptivity properties of compounds in solution. Quantitative analysis can beperformed on the basis of extinction coefficients, without standard curves (for example,NADH-based enzyme assays). When using a cuvette, the pathlength is known and isindependent of sample volume, so absorbance is directly proportional to concentration inthe absence of background interference.In a microplate, pathlength is dependent on the liquid volume, so absorbance isproportional to both the concentration and the pathlength of the sample. Standard curvesare often used to determine analyte concentrations in vertical-beam photometry ofunknowns, yet errors can still arise from pipetting the samples and standards. ThePathCheck technology automatically determines the pathlength of aqueous samples in themicroplate and normalizes the absorbance in each well to a pathlength of 1 cm. Thisapproach to correcting themicrowell absorbance values is accurate to within 2.5% of thevalues obtained directly in a 1 cm cuvette.

SpectraMax i3 Multi-Mode Detection Platform User Guide
24 5025027 A
Horizontal light path
Vertical light path
Cuvette Microplate wells
Figure 2-1: Cuvette and Microplate Well Light PathsThe 1 cm values can be obtained by using the factory installedWater Constant. PathChecktechnology is used to normalize the data acquired from absorbance endpoint microplatereadings to a 1 cm pathlength, correcting the OD for each well to the value expected if thesample were read in a 1 cm cuvette.
Water ConstantTheWater Constant correction method is supported by the SpectraMax i3 Instrument forabsorbance endpoint reads.The PathCheck technology is based on the absorbance of water in the near infrared spectralregion (between 900 nm to 1000 nm). If the sample is completely aqueous, has no turbidityand has a low salt concentration (less than 0.5M), theWater Constant is adequate. TheWater Constant is determined for each instrument during manufacture and is stored in theinstrument.
Note: After you have read a plate with PathCheck technology turned on, PathCheckinformation is stored permanently in the data file. You have the option of applying, ornot applying, PathCheck technology to the absorbance values. If you do not havePathCheck technology turned on during the plate read, you cannot apply thePathCheck Pathlength Measurement Technology feature after the read.

Chapter 2: Read Modes and Read Types
5025027 A 25
Eliminating the Pathlength-Independent Component
RawODmeasurements ofmicroplate samples include both pathlength-dependentcomponents (sample and solvent) and a pathlength-independent component (OD ofmicroplatematerial). The pathlength-independent component must be eliminated from thecalculation to get valid results that have been normalized by the PathCheck technology. Youcan accomplish this using a plate blank or using a plate background constant.Using a Plate BlankThis method can be used if all samples in themicroplate are the same volume and you arenot depending on the PathCheck technology to correct for variability in volumes.To use this method:
1. Designate at least one well (preferably several) as Plate Blank.
2. Pipette buffer (for example, your samplematrix) into those wells and read along withyour samples. Do not use an empty well for a blank.
The SoftMax Pro Software automatically subtracts the average of the blank wells fromeach of the samples. The OD of themicroplatematerial is subtracted as part of the blank.
3. Make sure that Use Plate Blank is checked underOther Options in theData Reductiondialog.
Using a Plate Background ConstantIf your sample volumes are not identical or if you choose not to use a Plate Blank, then youmust use a Plate Background Constant. Omitting a Plate Background Constant results inartificially high values after being normalized by the PathCheck technology.To determine the Plate Background Constant:
1. Fill a clean microplate with water.
2. Read at the wavelengths that you will be reading your samples.
The average OD value is the Plate Background Constant. If you intend to read your samplesat more than one wavelength, there should be a corresponding number of Plate BackgroundConstant values for each wavelength.
Note: It is important that you put water in the wells and not read a dry microplate forthe Plate Background Constant. A dry microplate has a slightly higher OD value than awater-filled microplate because of differences in refractive indices. Using a drymicroplate results in PathCheck technology normalized values that are lower than1 cm cuvette values.

SpectraMax i3 Multi-Mode Detection Platform User Guide
26 5025027 A
Interfering Substances
Any material that absorbs in the 900 nm to 1000 nm spectral region could interfere withPathCheck technology measurements. Fortunately, there are fewmaterials that do interfereat the concentrations generally used.Turbidity is themost common interference. If you can detect any turbidity in your sample,you should not use the PathCheck technology. Turbidity elevates the 900 nm measurementmore than the 1000 nm measurement and causes an erroneously low estimate ofpathlength. Using Cuvette Reference does not reliably correct for turbidity.Samples that are highly colored in the upper-visible spectrum might have absorbanceextending into the near-infrared (NIR) spectrum and can interfere with the PathChecktechnology. Examples include Lowry assays, molybdate-based assays, and samplescontaining hemoglobins or porphyrins. In general, if the sample is distinctly red or purple,you should check for interference before using the PathCheck technology.To determine possible color interference, do the following:
Measure the OD at 900 nm and 1000 nm (both measured with air reference).
Subtract the 900 nm value from the 1000 nm value.
Do the same for pure water.If the delta OD for the sample differs significantly from the delta OD for water, then it isadvisable not to use the PathCheck technology.Organic solvents could interfere with the PathCheck technology if they have absorbance inthe region of the NIR water peak. Solvents such as ethanol and methanol do not absorb inthe NIR region, so they do not interfere, except for causing a decrease in the waterabsorbance to the extent of their presence in the solution. If, however, the solvent absorbsbetween 900 nm and 1000 nm, the interference would be similar to the interference of highlycolored samples as previously described. If you are considering adding an organic solventother than ethanol or methanol, you are advised to run a Spectrum scan between 900 nmand 1000 nm to determine if the solvent would interfere with the PathCheck technology.

Chapter 2: Read Modes and Read Types
5025027 A 27
Fluorescence Intensity Read ModeFluorescence occurs when absorbed light is re-radiated at a longer wavelength. In theFluorescence Intensity (FL) read mode, the instrument measures the intensity of the re-radiated light and expresses the result in Relative Fluorescence Units (RFU).The governing equation for fluorescence is:
Fluorescence = extinction coefficient × concentration × quantum yield ×excitation intensity × pathlength × emission collection efficiency
Fluorescent materials absorb light energy of a characteristic wavelength (excitation), undergoan electronic state change, and instantaneously emit light of a longer wavelength (emission).Most common fluorescent materials have well-characterized excitation and emissionspectra. The following figure shows an example of excitation and emission spectra for afluorophore. The excitation and emission bands are each fairly broad, with half-bandwidthsof approximately 40 nm, and the difference between the wavelengths of the excitation andemission maxima (the Stokes shift) is generally fairly small, about 30 nm. There isconsiderable overlap between the excitation and emission spectra (gray area) when a smallStokes shift is present.
500 550 600 650
0
0.5
1.0
Excitation maximum
Emission maximum
Rel
ative
Flu
ore
scen
ce
Wavelength (nm)
Absorption
Stokes Shift
Figure 2-2: Excitation and Emission SpectraBecause the intensity of the excitation light is usually many tens of thousands of timesgreater than that of the emitted light, you must have sufficient spectral separation to reducethe interference of the excitation light with detection of the emitted light.
Tip: If the Stokes shift is small, you should choose an excitation wavelength that is asfar away from the emission maximum as possible while still being capable ofstimulating the fluorophore so that less of the excited light overlaps the emissionspectrum, allowing better selection and quantitation of the emitted light.
SpectraMax i3 Multi-Mode Detection Platform User Guide
28 5025027 A
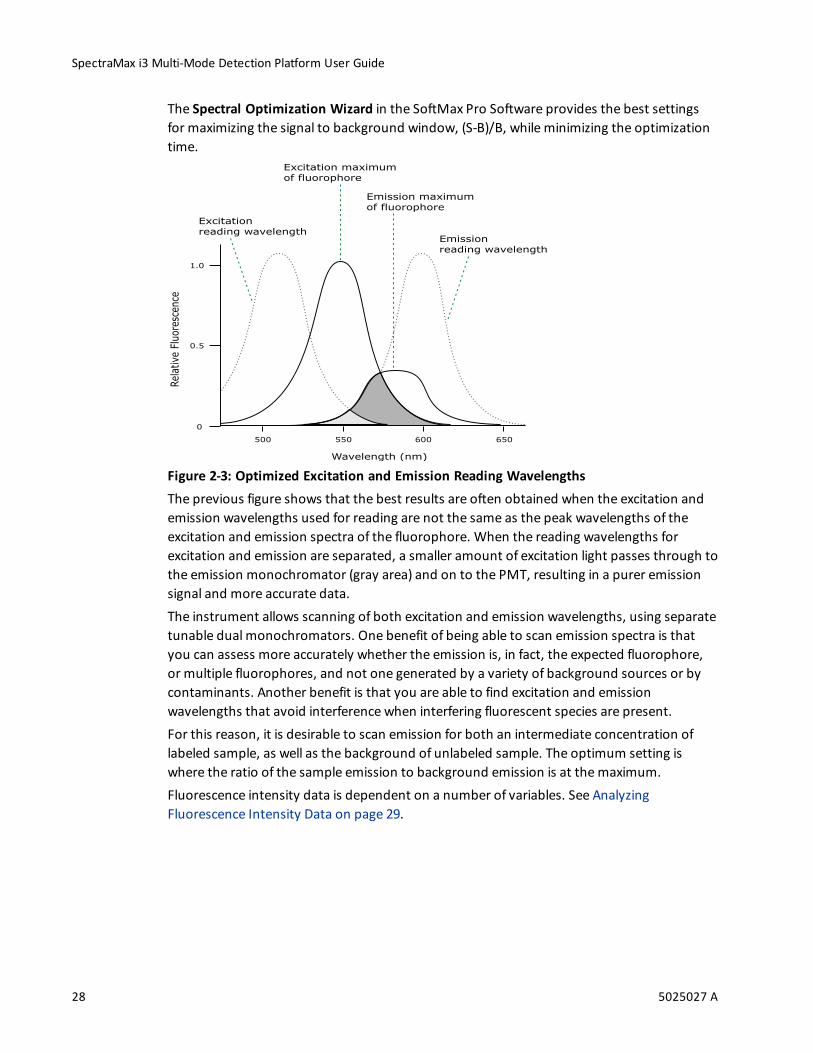
The Spectral Optimization Wizard in the SoftMax Pro Software provides the best settingsfor maximizing the signal to background window, (S-B)/B, while minimizing the optimizationtime.
500 550 600 650
0
0.5
1.0
Excitation maximum of fluorophore
Emission maximum of fluorophore
Rel
ativ
e Fl
uore
scen
ce
Wavelength (nm)
Excitation reading wavelength
Emissionreading wavelength
Figure 2-3: Optimized Excitation and Emission Reading WavelengthsThe previous figure shows that the best results are often obtained when the excitation andemission wavelengths used for reading are not the same as the peak wavelengths of theexcitation and emission spectra of the fluorophore. When the reading wavelengths forexcitation and emission are separated, a smaller amount of excitation light passes through tothe emission monochromator (gray area) and on to the PMT, resulting in a purer emissionsignal and more accurate data.The instrument allows scanning of both excitation and emission wavelengths, using separatetunable dual monochromators. One benefit of being able to scan emission spectra is thatyou can assess more accurately whether the emission is, in fact, the expected fluorophore,or multiple fluorophores, and not one generated by a variety of background sources or bycontaminants. Another benefit is that you are able to find excitation and emissionwavelengths that avoid interference when interfering fluorescent species are present.For this reason, it is desirable to scan emission for both an intermediate concentration oflabeled sample, as well as the background of unlabeled sample. The optimum setting iswhere the ratio of the sample emission to background emission is at themaximum.Fluorescence intensity data is dependent on a number of variables. See AnalyzingFluorescence Intensity Data on page 29.
Chapter 2: Read Modes and Read Types
5025027 A 29
Applications of Fluorescence IntensityFluorescence intensity is used widely in applications such as fluorescent ELISAs, proteinassays, nucleic acid quantitation, reporter gene assays, cell viability, cell proliferation, andcytotoxicity. Another major application of this mode is to study the kinetics of ion release.Some assays use a fluorescent label to selectively attach to certain compounds. The amountor concentration of the compound can then be quantified by measuring the fluorescenceintensity of the label, which is attached to the compound. Such methods are often used toquantify low concentrations of DNA or RNA, for example.The read capabilities of the SpectraMax i3 Instrument can be upgraded with user-installabledetection cartridges. A detection cartridge contains its own independent light source, optics,and electrical components needed to perform specific read modes for specific applications.The following detection cartridges have fluorescence intensity read mode capability:
Fluorescence Intensity (FI) Detection Cartridges, see page 133
Fluorescence Intensity (FI) GeneBLAzer Detection Cartridge, see page 136
Note: For the SpectraMax i3Multi-Mode Detection Platform, the detection cartridgescan be used for top reads.
Analyzing Fluorescence Intensity Data
Fluorescence intensity data is dependent on a number of variables. Raw data is compared toa standard curve with known concentrations of a reference label.A standard curve consists of, at a minimum, a blank sample and a reference standard sampleof known concentration. The raw data can then be expressed in equivalent concentration ofa reference label.Analyzing and validating fluorescence intensity data generally consists of the following:
Background Correction and Quantification on page 30
Detection Limit on page 30
Linearity and the Linear Dynamic Range on page 31
SpectraMax i3 Multi-Mode Detection Platform User Guide
30 5025027 A
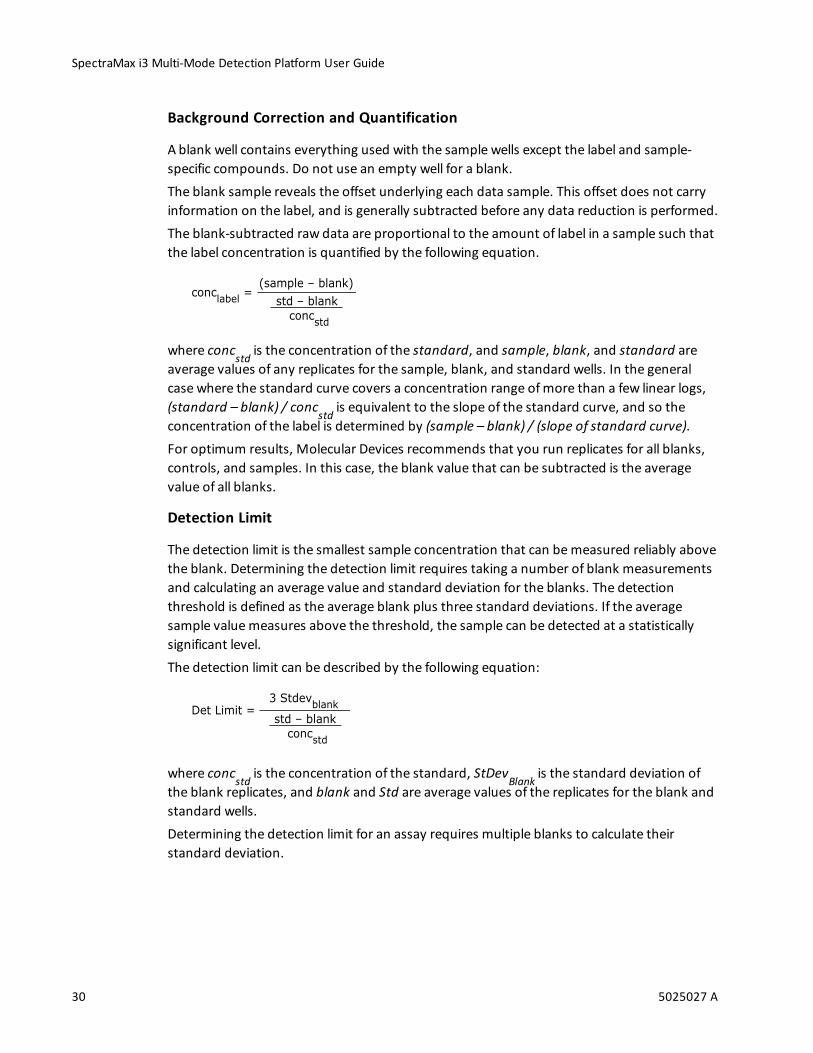
Background Correction and Quantification
A blank well contains everything used with the sample wells except the label and sample-specific compounds. Do not use an empty well for a blank.The blank sample reveals the offset underlying each data sample. This offset does not carryinformation on the label, and is generally subtracted before any data reduction is performed.The blank-subtracted raw data are proportional to the amount of label in a sample such thatthe label concentration is quantified by the following equation.
conclabel
= (sample – blank)
std – blank
concstd
where concstd
is the concentration of the standard, and sample, blank, and standard areaverage values of any replicates for the sample, blank, and standard wells. In the generalcase where the standard curve covers a concentration range ofmore than a few linear logs,(standard – blank) / conc
stdis equivalent to the slope of the standard curve, and so the
concentration of the label is determined by (sample – blank) / (slope of standard curve).For optimum results, Molecular Devices recommends that you run replicates for all blanks,controls, and samples. In this case, the blank value that can be subtracted is the averagevalue of all blanks.
Detection Limit
The detection limit is the smallest sample concentration that can bemeasured reliably abovethe blank. Determining the detection limit requires taking a number of blank measurementsand calculating an average value and standard deviation for the blanks. The detectionthreshold is defined as the average blank plus three standard deviations. If the averagesample valuemeasures above the threshold, the sample can be detected at a statisticallysignificant level.The detection limit can be described by the following equation:
Det Limit =
3 Stdevblank
std – blank
concstd
where concstd
is the concentration of the standard, StDevBlank
is the standard deviation ofthe blank replicates, and blank and Std are average values of the replicates for the blank andstandard wells.Determining the detection limit for an assay requires multiple blanks to calculate theirstandard deviation.

Chapter 2: Read Modes and Read Types
5025027 A 31
Linearity and the Linear Dynamic Range
Within a wide range at moderately high concentrations, blanked raw data is proportional tothe amount of label in a sample.The linear dynamic range (LDR) is defined by:
LDR = log10
max conc lin
detection limit( )where LDR is expressed as a log, andmax conc lin is the highest concentration in the linearrange that can be quantified.When the standard curve after blank reduction is not linear in concentration at the lowerend, theremight be an inappropriate or contaminated blank.
Luminescence Read ModeIn luminescence read mode, no excitation is necessary as the species being measured emitlight naturally. For this reason, the lamp does not flash, so no background excitationinterference occurs.In the Luminescence (LUM) read mode, the instrument provides measurements in RelativeLuminescence Units (RLUs).Luminescence is the emission of light by processes that derive energy from essentially non-thermal changes, themotion of subatomic particles, or the excitation of an atomic system byradiation. Luminescence detection relies on the production of light from a chemical reactionin a sample.To help eliminate background luminescence from a microplate that has been exposed tolight, Molecular Devices recommends dark adaptation of themicroplate by placing thesample-loaded microplate in the instrument for several minutes before starting the read.For monochromator-based instruments, the default setting for luminescence is the “zeroorder” position where the grating monochromator acts as a mirror that reflects all light tothe PMT detector. If wavelength selection is desired, you can choose the wavelength wherepeak emission is expected to occur. In addition, multiple wavelength choices allow specieswith multiple components to be differentiated and measured easily.Luminescence can be read from the top of a microplate. Solid white microplates arerecommended for luminescence reads.Concentrations or qualitative results are derived from raw data by means of a standardcurve or comparison with reference controls. See Analyzing Luminescence Data on page 33.

SpectraMax i3 Multi-Mode Detection Platform User Guide
32 5025027 A
Applications of LuminescenceChemiluminescent or bioluminescent reactions can be induced to measure the quantity of aparticular compound in a sample. Examples of luminescent assays include the following:
Reporter gene assays (themeasurement of luciferase gene expression)
Quantitation of adenosine triphosphate (ATP) as an indication of cell counts with cell-proliferation, cytotoxicity, and biomass assays
Enzymemeasurements with luminescent substrates, such as immunoassays
The read capabilities of the SpectraMax i3 Instrument can be upgraded with user-installabledetection cartridges. A luminescence (LUM) detection cartridge contains its ownindependent optics and electrical components needed to perform specific read modes forspecific applications.The following detection cartridges have luminescence read mode capability:
Glow Luminescence (LUM) Detection Cartridges, see page 141
Dual Color Luminescence (LUM) (BRET2) Detection Cartridge, see page 144
Dual Color Luminescence (LUM) (Chroma-Glo) Detection Cartridge, see page 149
Note: For the SpectraMax i3Multi-Mode Detection Platform, the detection cartridgescan be used for top reads.

Chapter 2: Read Modes and Read Types
5025027 A 33
Analyzing Luminescence Data
The conversion rate of photons to counts is individual for each reader. Therefore, raw datafrom the same plate can appear significantly different from one instrument to the next. Inaddition, the data format used by other manufacturers might not be counts per second andcan be different by several orders ofmagnitude. It is important to know that the number ofcounts and the size of figures is in no way an indication of sensitivity. See Detection Limit onpage 34.Concentrations or qualitative results are derived from raw data by means of a standardcurve or comparison with reference controls. A standard curve consists of, at a minimum, ablank sample and a reference standard sample of known concentration. The raw data canthen be expressed in equivalent concentration of a reference label. The raw data isnormalized to counts per second by dividing the number of counts by the read time per well.Analyzing and validating luminescence data generally consists of the following:
Background Correction on page 33
Detection Limit on page 34
Sample Volumes and Concentration of Reactants on page 34
Data Optimization on page 35
Background Correction
The light detected in a luminescent measurement generally has two components: specificlight from the luminescent reaction and an approximately constant level of background lightcaused by various factors, including the platematerial and impurities in the reagents. Thebackground can be effectively measured using blank replicates. Blanks should include theluminescent substrate (chemical energy source) but not the luminescence agent (generallyan enzymatic group which makes the substrate glow).A blank well contains everything used with the sample wells except the label and sample-specific compounds. Do not use an empty well for a blank.The blank sample reveals the offset underlying each data sample. This offset does not carryinformation on the label, and is generally subtracted before any data reduction is performed.For optimum results, Molecular Devices recommends that you run replicates for all blanks,controls, and samples. In this case, the blank value that can be subtracted is the averagevalue of all blanks.To help eliminate background luminescence from a microplate that has been exposed tolight, Molecular Devices recommends dark adaptation of themicroplate by placing thesample-loaded microplate in the instrument for several minutes before starting the read.

SpectraMax i3 Multi-Mode Detection Platform User Guide
34 5025027 A
Detection Limit
The detection limit is the smallest sample concentration that can bemeasured reliably abovethe blank. Determining the detection limit requires taking a number of blank measurementsand calculating an average value and standard deviation for the blanks. The detectionthreshold is defined as the average blank plus three standard deviations. If the averagesample valuemeasures above the threshold, the sample can be detected at a statisticallysignificant level.The detection limit can be described by the following equation:
Det Limit =
3 Stdevblank
std – blank
concstd
where concstd
is the concentration of the standard, StDevBlank
is the standard deviation ofthe blank replicates, and blank and Std are average values of the replicates for the blank andstandard wells.Determining the detection limit for an assay requires multiple blanks to calculate theirstandard deviation.
Sample Volumes and Concentration of Reactants
The concentration of the luminescent agent impacts the amount of light output in aluminescent reaction. Light is emitted as a result of a reaction between two or morecompounds. Therefore, the amount of light output is proportional to the amount of thelimiting reagent in the sample.For example, in an ATP/luciferin-luciferase system, when total volume is held constant andATP is the limiting reagent, the blanked light output is proportional to the concentration ofATP in the sample, at very high concentrations of ATP. Substrate can be used up and becomerate-limiting, providing it is the rate-limiting component. In this case, the non-linearity is aneffect of the assay and not caused by themicroplate reader.
Chapter 2: Read Modes and Read Types
5025027 A 35
Data Optimization
Themeasurement noise is dependent on the read time per sample (time per plate or timeper well). In particular, the detection limit improves when the read time is increased.Therefore, it is important to specify the read timewhen comparing measurements.All low-light-level detection devices have somemeasurement noise in common. To averageout themeasurement noise, optimization of the time per well involves accumulating asmany counts as possible. Within some range, the reduction of noise (CVs, detection limit)can be accomplished by increasing the read time per well, as far as is acceptable fromthroughput and sample stability considerations.Z´ is the standard statistical parameter in the high-throughput screening community formeasuring the quality of a screening assay independent of test compounds. It is used as ameasure of the signal separation between the positive controls and the negative controls inan assay.The value of Z´ can be determined using the following formula:
Z´ = 1 – | Mean
c+ – Mean
c– |
3(SDc+
) + 3(SDc–
)
where SD is the standard deviation, c+ is the positive control, and c– is the negative control.A Z´ value greater than or equal to 0.4 is the generally acceptable minimum for an assay.Higher values might be desired when results aremore critical.Z´ is not linear and can bemade unrealistically small by outliers that skew the standarddeviations in either population. To improve the Z´ value, you can increase the amount oflabel in the sample, if acceptable for the assay, or increase the read time per well.

SpectraMax i3 Multi-Mode Detection Platform User Guide
36 5025027 A
Time-Resolved Fluorescence Read ModeTo use this read mode, you must install an appropriate detection cartridge in theinstrument.Time-resolved fluorescence (TRF) is a measurement technique that depends on threecharacteristics that lead to better discrimination between the specific signal, proportional tothe amount of label, and the unspecific fluorescence resulting from background andcompound interference:
Pulsed excitation light sources
Time-gated electronics faster than the fluorescence lifetime
Labels with prolonged fluorescence lifetime
The time-gating electronics introduce a delay between the cut off of each light pulse and thestart of signal accumulation. During the delay, the unspecific fluorescence (caused by testcompounds, assay reagents, and themicroplate) vanishes while only a small portion of thespecific fluorescence from the label is sacrificed. Enough of the specific signal remains duringthe decay period with the added benefit of reduced background.In Time-Resolved Fluorescence read mode, the instrument detects the extremely longemission half-lives of rare earth elements called lanthanides such as europium (lifetime ofabout 700 µs), samarium (lifetime of about 70 µs), or terbium (lifetime of about 1000 µs).
Applications of Time-Resolved FluorescenceTime-resolved fluorescence (TRF) is widely used in high throughput screening applicationssuch as kinase assays, and is useful in some fluorescence immunoassays, such as DELFIA(dissociation-enhanced enzyme linked fluorescence immunoassay). TRF is also useful insome assay variants of TR-FRET (time-resolved fluorescence resonance energy transfer) inwhich the FRET acceptor label acts as a quencher only and does not emit fluorescence. Theproximity between donor label and acceptor (quencher) is then quantified by the intensitydecrease of the donor label.DELFIA requires washing steps as in an ELISA, but the TR-FRET assay involving quenching is ahomogeneous microplate assay technique and requires only mixing and measuring—nowash steps are required. It can also beminiaturized, which makes it useful for high-throughput screening applications.The Cisbio Bioassays HTRF (Homogeneous Time-Resolved Fluorescence) technology is aproprietary time-resolved fluorescence technology that overcomes many of the drawbacksof standard Fluorescence Resonance Energy Transfer (FRET) techniques, such as therequirements to correct for autofluorescence and the fluorescent contributions of unboundfluorophores. See HTRF Read Mode on page 41.

Chapter 2: Read Modes and Read Types
5025027 A 37
The read capabilities of the SpectraMax i3 Instrument can be upgraded with user-installabledetection cartridges. A detection cartridge contains its own independent light source, optics,and electrical components needed to perform specific read modes for specific applications.The following detection cartridges have time-resolved fluorescence read mode capability:
Cisbio HTRF Detection Cartridge on page 127
Time Resolved Fluorescence (TRF) Detection Cartridge, see page 130
Note: For the SpectraMax i3Multi-Mode Detection Platform, the detection cartridgescan be used for top reads.
Analyzing Time-Resolved Fluorescence Data
A time-resolved fluorescence (TRF)measurement includes a number of pulses. Each pulseconsists of turning the light source on and off (Excitation Time), pausing for a specified lengthof time (Measurement Delay), and measuring the fluorescence intensity of the sample for aspecified length of time (Integration Time). These pulses are repeated several times, asspecified in the protocol parameters.Analyzing and interpreting TRF data generally consists of the following:
Blank Correction on page 37
Data Normalization on page 38
Data Optimization on page 38
Blank Correction
Although background is significantly lower than with fluorescence intensity measurements,Molecular Devices recommends that you use blanks or assay controls.A blank well contains everything used with the sample wells except the label and sample-specific compounds. Do not use an empty well for a blank.The blank sample reveals the offset underlying each data sample. This offset does not carryinformation on the label, and is generally subtracted before any data reduction is performed.For optimum results, Molecular Devices recommends that you run replicates for all blanks,controls, and samples. In this case, the blank value that can be subtracted is the averagevalue of all blanks.

SpectraMax i3 Multi-Mode Detection Platform User Guide
38 5025027 A
Data Normalization
TRF raw data changes in magnitude when the timing parameters are changed. However, TRFdata are normalized for a number of 1000 pulses. This means that the sample raw data doesnot change when only the number of pulses is changed.When selecting a fast read mode, the raw data becomes slightly lower because during thecontinuous platemovement, some signal is collected under non-optimum focusingconditions.
Data Optimization
There are two timing parameters which can be optimized to adjust the performance of themeasurement as desired: time per well and integration time per cycle.Themeasurement noise is dependent on the read time per sample (time per plate or timeper well). In particular, the detection limit improves when the read time is increased.Therefore, it is important to specify the read timewhen comparing measurements. For TRF,the read time per well increases with the selected number of pulses. The time betweenpulses and the intensity of each pulse, however, can be different on various systems.All low-light-level detection devices have somemeasurement noise in common. To averageout themeasurement noise, optimization of the time per well involves accumulating asmany counts as possible. Within some range, the reduction of noise (CVs, detection limit)can be accomplished by increasing the read time per well, as far as is acceptable fromthroughput and sample stability considerations.To further optimizemeasurement results, optimize the timing parameters. The followingtable and figure can be used as guidelines for the selection of timing parameters.
Chapter 2: Read Modes and Read Types
5025027 A 39
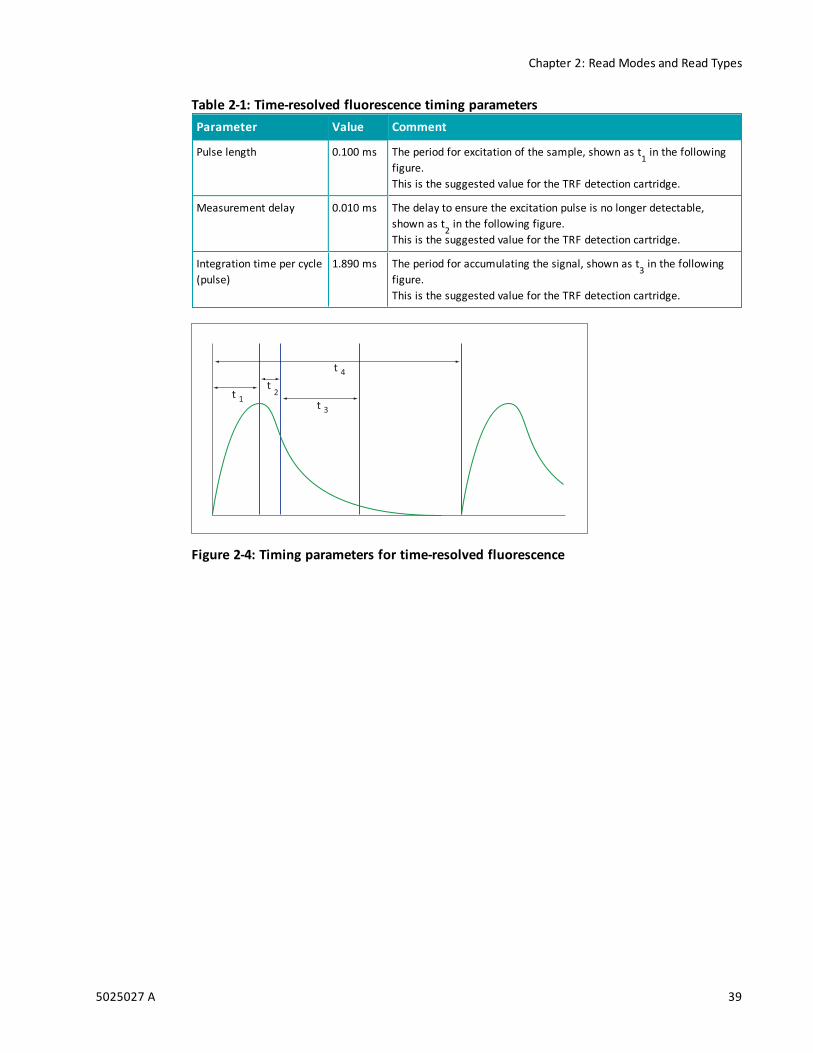
Parameter Value Comment
Pulse length 0.100 ms The period for excitation of the sample, shown as t1 in the followingfigure.This is the suggested value for the TRF detection cartridge.
Measurement delay 0.010 ms The delay to ensure the excitation pulse is no longer detectable,shown as t2 in the following figure.This is the suggested value for the TRF detection cartridge.
Integration time per cycle(pulse)
1.890 ms The period for accumulating the signal, shown as t3 in the followingfigure.This is the suggested value for the TRF detection cartridge.
Table 2-1: Time-resolved fluorescence timing parameters
t1
t4
t3
t2
Figure 2-4: Timing parameters for time-resolved fluorescence

SpectraMax i3 Multi-Mode Detection Platform User Guide
40 5025027 A
When neglecting the time delay t2compared to the integration timewindow t
3, the
accumulated signal A can be approximated with the following equation:
A / Amax
= (1 – exp(–M)) x 100%In the previous equation,M is the size of the timewindow (or integration time) divided bythe exponential decay time constant (or the fluorescence lifetime of the label).
M = (integration time) / (fluorescence lifetime)For example, using Europium, which has a fluorescence lifetime of 700 µs, and the suggestedintegration time per cycle of 1.890 ms (or 1890 µs), M = 1890 / 700 = 2.7. Inserting this valueofM into the first equation yields A / A
max = 93%.
To optimize the integration time per cycle (pulse), the integration time should be set suchthat the value ofM enables the desired signal to be achieved. For example, to achievemorethan 86% signal, select an integration time such that M is greater than 2.0. Using theprevious Europium example and solving for the integration time, the integration time can beset toM (2.0) times the fluorescence lifetime (700 µs), or 1400 µs (1.4 ms).
M 0.25 0.50 0.75 1.00 1.25 1.50 2.00 3.00
A / Amax[%] 22 39 53 63 71 78 86 95
Table 2-2: Achievable accumulated signal percentage compared to M
M can be technically limited by the time between pulses. Further gain in signal beyond somevalue ofM can be negligible to improve results.

Chapter 2: Read Modes and Read Types
5025027 A 41
HTRF Read ModeTo use this read mode, you must install an appropriate detection cartridge in theinstrument.Homogeneous time-resolved fluorescence (HTRF) is a measurement technique based onfluorescence resonance energy transfer (FRET) using the advantages of time-resolvedfluorescence (TRF) reading.Fluorescence resonance energy transfer (FRET) is a distance-dependent interaction betweenthe electronic excited states of two dyemolecules in which excitation is transferred from adonor molecule to an acceptor moleculewithout emission of a photon.FRET relies on the distance-dependent transfer of energy from a donor molecule to anacceptor molecule. Due to its sensitivity to distance, FRET has been used to investigatemolecular interactions. FRET is the radiationless transmission of energy from a donormolecule to an acceptor molecule. The donor molecule is the dye or chromophore thatinitially absorbs the energy and the acceptor is the chromophore to which the energy issubsequently transferred. This resonance interaction occurs over greater than interatomicdistances, without conversion to thermal energy, and without any molecular collision. Thetransfer of energy leads to a reduction in the donor’s fluorescence intensity and excited statelifetime, and an increase in the acceptor’s emission intensity. A pair ofmolecules thatinteract in such a manner that FRET occurs is often referred to as a donor/acceptor pair.While there aremany factors that influence FRET, the primary conditions that need to bemet for FRET to occur are relatively few:
The donor and acceptor molecules must be in close proximity to one another.
The absorption or excitation spectrum of the acceptor must overlap the fluorescenceemission spectrum of the donor.
The degree to which they overlap is referred to as the spectral overlap integral (J).
The donor and acceptor transition must be approximately parallel.
HTRF uses a donor fluorophore with a long fluorescence lifetime, such as Europium. Theacceptor fluorophore acts as if it also has a long fluorescence lifetime. This allows the time-gating principle of time-resolved fluorescence to be applied to the acceptor emission toseparate specific signal from background and signal caused by compound interference.Time-gating electronics introduce a delay between the flashes and the start of signalaccumulation. During the delay, the unspecific fluorescence caused by test compounds,assay reagents, and themicroplate vanishes while only a small portion of the specificfluorescence from the acceptor fluorophore is sacrificed. Enough of the specific signalremains, with the benefit of reduced background.
SpectraMax i3 Multi-Mode Detection Platform User Guide
42 5025027 A
Applications of Homogeneous Time-Resolved FluorescenceHomogeneous time-resolved fluorescence (HTRF) is used in competitive assays to quantifythe binding between two labeled molecules, or the disintegration of a bound complex.Binding partners can have similar molecular weights as opposed to fluorescence polarizationread modes. HTRF is a homogeneous assay that requires only mixing and measuring—nowash steps are required. It can also beminiaturized, which makes it useful for high-throughput screening applications.The fluorescence ratio associated with the HTRF readout is a correction method developedby Cisbio and covered by the US patent 5,527,684 and its foreign equivalents, for whichCisbio has granted a license to Molecular Devices. Its application is strictly limited to the useof HTRF reagents and technology, excluding any other TR-FRET technologies such as IMAPTR-FRET calculations of acceptor to donor ratios.The read capabilities of the SpectraMax i3 Instrument can be upgraded with user-installabledetection cartridges. A detection cartridge contains its own independent light source, optics,and electrical components needed to perform specific read modes for specific applications.To perform HTRF reads, the instrument requires the Cisbio HTRF Detection Cartridge, seepage 127.
Note: For the SpectraMax i3Multi-Mode Detection Platform, the detection cartridgescan be used for top reads.
HTRF is a registered trademark of Cisbio Bioassays.
Analyzing HTRF Data
AHomogeneous Time-Resolved Fluorescence (HTRF)measurement includes a number offlash intervals. Each flash interval consists of flashing the lamp, pausing for a specified lengthof time, and measuring the fluorescence intensity of the sample. These flash intervals arerepeated several times, as specified in the protocol parameters. See Data Optimization onpage 43.Analyzing and interpreting HTRF data generally consists of the following:
Data Reduction on page 43
Data Optimization on page 43

Chapter 2: Read Modes and Read Types
5025027 A 43
Data Reduction
Data reduction for HTRF reads consists of two steps.First, a ratio of the signal measured by the emission from the acceptor label at 665 nm to thesignal measured by the emission of the donor label at 616 nm is calculated and multiplied bya factor of 10,000. This generates what is called the HTRF ratio.In the second step, ratios are calculated that represent the relative change in the HTRF signalcompared to that of the assay background, represented by assay controls potentially namednegative or Standard 0. This relative response ratio is called the Delta F and is formatted as apercentage, though values greater than 100 can be achieved.
Data Optimization
Themeasurement noise is dependent on the read time per sample (time per plate or timeper well). In particular, the detection limit improves when the read time is increased.Therefore, it is important to specify the read timewhen comparing measurements. For TRF,the read time per well increases with the selected number of pulses. The time betweenpulses, however, can be different on various systems.
Parameter Value Comment
Number of pulses 30 The number of flashes per read.
Measurement delay 30 µs The delay to ensure the excitation pulse is no longer detectable.
Integration time per cycle (pulse) 400 µs The period for accumulating the signal.
Table 2-3: HTRF timing parameters
Defining the number of flashes (pulses) cannot be used for comparative purposes becausethe flash and intensity rate varies from system to system.There are two timing parameters which can be optimized to adjust the performance of themeasurement as desired: time per plate or time per well, and integration time per cycle.All low-light-level detection devices have somemeasurement noise in common. To averageout themeasurement noise, optimization of the time per well involves accumulating asmany counts as possible. Within some range, the reduction of noise (CVs, detection limit)can be accomplished by increasing the read time per well, as far as is acceptable fromthroughput and sample stability considerations.As the number of flashes (read time per well) is increased, several aspects of the dataimprove:
Delta F values show less variability (better CVs).
Small Delta F values are better distinguished from noise.
Noise of background is reduced.

SpectraMax i3 Multi-Mode Detection Platform User Guide
44 5025027 A
The second timing parameter which can be optimized is the Integration time per cycle. Caremust be taken in optimizing the integration time to take into account noise. Delta F is higherat low integration times, but noise is also high at low integration times. The optimumintegration time is where noise is minimized while maximizing Delta F.In the following example, the optimum integration time (read time per cycle) appears to be inthe 500 µs to 1000 µs range, as noise is minimized and Delta F is still relatively high. Goingbeyond 1000 µs shows sharp decline in Delta F without any apparent improvement in noise.
Figure 2-5: Relationship Between Integration Time, Noise, and Delta FZ´ is the standard statistical parameter in the high-throughput screening community formeasuring the quality of a screening assay independent of test compounds. It is used as ameasure of the signal separation between the positive controls and the negative controls inan assay.The value of Z´ can be determined using the following formula:
Z´ = 1 – | Mean
c+ – Mean
c– |
3(SDc+
) + 3(SDc–
)
where SD is the standard deviation, c+ is the positive control, and c– is the negative control.A Z´ value greater than or equal to 0.4 is the generally acceptable minimum for an assay.Higher values might be desired when results aremore critical.Z´ is not linear and can bemade unrealistically small by outliers that skew the standarddeviations in either population. To improve the Z´ value, you can increase the amount oflabel in the sample, if acceptable for the assay, or increase the read time per well.

Chapter 2: Read Modes and Read Types
5025027 A 45
Fluorescence Polarization Read ModeTo use this read mode, you must install an appropriate detection cartridge in theinstrument.Fluorescence polarization (FP)modemeasures the relative change of polarization of emittedfluorescent compared to excitation light.Fluorescence polarization detection is similar to fluorescence intensity, with the importantdifference that it uses plane-polarized light, rather than non-polarized light. Plate readersmeasure FP of the sample by detecting light emitted both parallel and perpendicular to theplane of excitation.By using a fluorescent dye to label a small molecule, its binding to another molecule of equalor greater size can bemonitored through its speed of rotation.When molecules are excited with polarized light, the polarization of the emitted lightdepends on the size of themolecule to which the fluorophore is bound. Larger moleculesemit a higher percentage of polarized light, while smaller molecules emit a lower percentageof polarized light because of their rapid molecular movement. For this reason FP is typicallyused for molecular binding assays in high-throughput screening (HTS).Fluorescence polarization mode returns two sets of data: one for fluorescence intensityparallel (P) to the excitation plane, and the other for fluorescence intensity perpendicular (S)to the excitation plane. These S and P values are used to calculate the Polarization (mP) andAnisotropy (r) values in SoftMax Pro Software.The Fluorescence Polarization data for a sample is evaluated based on its relative positionbetween the low and high control values. See Analyzing Fluorescence Polarization Data onpage 46.
Applications of Fluorescence PolarizationFluorescence polarization measurements provide information on molecular orientation andmobility, and are generally used to quantify the success of a binding reaction between asmaller labeled ligand and a binding site at a much larger or immobilized molecule. FP canalso be used to quantify the dissociation or cleavage of the labeled ligand from a binding site.FP is a homogeneous microplate assay technique and requires only mixing and measuring—no wash steps are required as in an ELISA. It can also beminiaturized, which makes it usefulfor high-throughput screening applications.The read capabilities of the SpectraMax i3 Instrument can be upgraded with user-installabledetection cartridges. A detection cartridge contains its own independent light source, optics,and electrical components needed to perform specific read modes for specific applications.The following detection cartridges have fluorescence polarization read mode capability:
Fluorescence Polarization (FP) Detection Cartridge, see page 139
Note: For the SpectraMax i3Multi-Mode Detection Platform, the detection cartridgescan be used for top reads.
SpectraMax i3 Multi-Mode Detection Platform User Guide
46 5025027 A
Analyzing Fluorescence Polarization Data
Fluorescence polarization mode returns two sets of data: one for fluorescence intensityparallel (P) to the excitation plane, and the other for fluorescence intensity perpendicular (S)to the excitation plane. These S and P values are used to calculate the Polarization (mP) andAnisotropy (r) values in SoftMax Pro Software.FP assays in microplates are generally designed with two control samples:
LOW control sample: minimal polarization value resulting from unbound labeled ligandonly
HIGH control sample: maximum polarization value resulting from bound labeled ligandonly
The FP data for a sample is evaluated based on its relative position between the low and highcontrol values. Total intensity can also be determined from the raw data and is proportionalto the amount of label in a sample.Analyzing and interpreting fluorescence polarization data generally consists of the following:
Blank Correction on page 47
Data Reduction on page 47
Data Qualification and Validation on page 48

Chapter 2: Read Modes and Read Types
5025027 A 47
Blank Correction
Many fluorescence polarization assays use small fluorescent label concentrations in thelower nm range. In this range, blank controls become significant when compared to samples.A blank well contains everything used with the sample wells except the label and sample-specific compounds. Do not use an empty well for a blank.Background wells, containing all assay components minus the fluorophore, should betested. If the signal in the background wells is more than 1/10 the signal in the wellscontaining fluorophore, then background wells should be run on each assay plate. Theaverage raw signal from the background's parallel and perpendicular readings must besubtracted from the raw parallel and perpendicular readings of each sample well before themP calculation is performed.For optimum results, Molecular Devices recommends that you run replicates for all blanks,controls, and samples. In this case, the blank value that can be subtracted is the averagevalue of all blanks.
Data Reduction
Fluorescence polarization mode returns two sets of data: one for fluorescence intensityparallel (P) to the excitation plane, and the other for fluorescence intensity perpendicular (S)to the excitation plane. These S and P values are used to calculate the Polarization (mP) andAnisotropy (r) values in SoftMax Pro Software.Although the raw S and P values are the true actual values returned from the instrument, thecalculated Polarization (mP) and Anisotropy (r) values are treated as the raw data andbecome the basis for further reduction calculations.Polarization (mP) is calculated as follows:
mP = 1000(parallel + (G perpendicular))
(parallel (G perpendicular))-*
*
*
Anisotropy (r) is calculated as follows:
r = (parallel (G perpendicular))- *
(parallel + (2G perpendicular))*
The G factor, or grating factor, is used in fluorescence polarization to correct polarizationdata for optical artifacts, converting relativemP data to theoretical mP data. Opticalsystems, particularly with reflective components, pass light of different polarization withdifferent efficiency. G factor corrects this instrumental bias.

SpectraMax i3 Multi-Mode Detection Platform User Guide
48 5025027 A
Data Qualification and Validation
When validating the data of a fluorescence polarization measurement and the assay, the twofactors to look at are the precision value and the Z´ parameter.The FP precision value is a measure of replicate uniformity determined by the standarddeviation of replicates at a label concentration of 1 nM. Since the precision of a measuredsignal also depends on the read time, the read timemust also be specified. A longer readtime leads to a lower (better) precision value.Z´ is the standard statistical parameter in the high-throughput screening community formeasuring the quality of a screening assay independent of test compounds. It is used as ameasure of the signal separation between the positive controls and the negative controls inan assay.The value of Z´ can be determined using the following formula:
Z´ = 1 – | Mean
c+ – Mean
c– |
3(SDc+
) + 3(SDc–
)
where SD is the standard deviation, c+ is the positive control, and c– is the negative control.A Z´ value greater than or equal to 0.4 is the generally acceptable minimum for an assay.Higher values might be desired when results aremore critical.Z´ is not linear and can bemade unrealistically small by outliers that skew the standarddeviations in either population. To improve the Z´ value, you can increase the amount oflabel in the sample, if acceptable for the assay, or increase the read time per well.The assay window is dependent on the fluorophore lifetime and relative size of the receptorto the ligand. Precision values are better (lower) at higher signals, which normally come fromhigher label concentrations.For a given assay window, Z´ is a downward sloping linear function. That is, as precisionvalues get higher (worse), the Z´ value gets lower (worse).Precision is dependent upon assay characteristics (sample volume, label concentration) andread time. In many assays, the characteristics are defined and cannot be changed. In thiscase, the only way to improve precision is to increase the read time per well.
Chapter 2: Read Modes and Read Types
5025027 A 49
AlphaScreen Read ModeTo use this read mode, you must install an appropriate detection cartridge in theinstrument.ALPHA stands for Amplified Luminescent Proximity Homogeneous Assay. AlphaScreen® is abead-based chemistry used to study molecular interactions between moieties A and B, forexample. When a biological interaction between A and B brings beads (coated with A and B,respectively) together, a cascade of chemical reactions acts to produce a greatly amplifiedsignal.The cascade finally resulting in signal is triggered by laser excitation (680 nm), making aphotosensitizer on the A-beads convert oxygen to an excited (singlet) state. That energizedoxygen diffuses away from the A-bead. When reaching the B-bead in close proximity, it reactswith a thioxene derivative on the B-bead generating chemiluminescence at 370 nm. Energytransfer to a fluorescent dye on the same bead shifts the emission wavelength into the 520nm to 620 nm range. The limited lifetime of singlet oxygen in solvent (~4microseconds)allows diffusion reach only up to about 200 nm distance. Thus, only B-beads in the proximityof A-beads yield signal, which indicates binding between moieties A and B.An AlphaScreen measurement includes a light pulse, by turning on the laser diode for aspecified time, turning off the laser diode, followed by themeasurement of the AlphaScreensignal, as specified in themeasurement protocol timing parameters.
Note: AlphaScreen beads are light sensitive. Beads are best handled under subdued(<100 lux) or green filtered (Roscolux filters #389 from Rosco, or equivalent) lightconditions. Perform incubation steps in the dark.
The raw data can be normalized to counts per second. See Analyzing AlphaScreen Data onpage 50.

SpectraMax i3 Multi-Mode Detection Platform User Guide
50 5025027 A
Applications of AlphaScreenAlphaScreen reagent and assays are used for drug discovery purposes. Examples ofAlphaScreen assays include:
G-protein coupled receptor (GPCR) assay kits, for cAMP quantification or IP3quantification.
Tyrosine Kinase assays.
Cytokine detection kits, such as TNF-alpha detection (immunoassay).
AlphaScreen read mode can also capture the Europium emission line of AlphaLISA®.The read capabilities of the SpectraMax i3 Instrument can be upgraded with user-installabledetection cartridges. A detection cartridge contains its own independent light source, optics,and electrical components needed to perform specific read modes for specific applications.To perform AlphaScreen reads, the instrument requires AlphaScreen Detection Cartridges ,see page 124
Note: For the SpectraMax i3Multi-Mode Detection Platform, the detection cartridgescan be used for top reads.
For more information, go to www.perkinelmer.com.ALPHASCREEN and ALPHALISA are registered trademarks of PerkinElmer, Inc.
Analyzing AlphaScreen Data
The conversion rate of photons to counts and relative fluorescence units (RFU) is individualfor each reader. Therefore, raw data from the samemicroplate can appear to be differentfrom one instrument to the next. In addition, the data format used by instrumentmanufacturers might be counts normalized per second or not normalized counts, andtherefore the raw data can be different by several orders ofmagnitude. It is important toknow that the number of counts and the size of figures is in no way an indication ofsensitivity. See Detection Limit on page 51.The raw data can be normalized to counts per second by selecting theNormalization optionin the SoftMax Pro Software Settings dialog. See “Creating a Protocol” in the SoftMax ProSoftware application help or user guide.Analyzing and validating AlphaScreen data can consist of the following:
Background Correction on page 51
Detection Limit on page 51
Data Qualification and Validation on page 52

Chapter 2: Read Modes and Read Types
5025027 A 51
Background Correction
Although background is significantly lower than with fluorescence intensity measurements,Molecular Devices recommends that you use blanks or assay controls for backgroundcorrection. The background can be effectively measured using blank replicates. Whenreading a sample with small signal, an interference can occur from the afterglow of a verystrong emitting adjacent sample that was measured just before. Such cross talk can occurthrough the wall of a white 384-well plate. To prevent such interference, you can select theInterlaced Reading option in the SoftMax Pro Software Settings dialog. This option readsonly every other well in a checkerboard pattern, and then reads themicroplate again to readthe previously omitted wells.A blank well contains everything used with the sample wells except the label and sample-specific compounds. Do not use an empty well for a blank.For optimum results, Molecular Devices recommends that you run replicates for all blanks,controls, and samples. In this case, the blank value that can be subtracted is the averagevalue of all blanks.
Detection Limit
The detection limit is the smallest sample concentration that can bemeasured reliably abovethe blank. Determining the detection limit requires taking a number of blank measurementsand calculating an average value and standard deviation for the blanks. The detectionthreshold is defined as the average blank plus three standard deviations. If the averagesample valuemeasures above the threshold, the sample can be detected at a statisticallysignificant level.The detection limit can be described by the following equation:
Det Limit =
3 Stdevblank
std – blank
concstd
where concstd
is the concentration of the standard, StDevBlank
is the standard deviation ofthe blank replicates, and blank and Std are average values of the replicates for the blank andstandard wells.

SpectraMax i3 Multi-Mode Detection Platform User Guide
52 5025027 A
Data Qualification and Validation
Z´ is the standard statistical parameter in the high-throughput screening community formeasuring the quality of a screening assay independent of test compounds. It is used as ameasure of the signal separation between the positive controls and the negative controls inan assay.The value of Z´ can be determined using the following formula:
Z´ = 1 – | Mean
c+ – Mean
c– |
3(SDc+
) + 3(SDc–
)
where SD is the standard deviation, c+ is the positive control, and c– is the negative control.A Z´ value greater than or equal to 0.4 is the generally acceptable minimum for an assay.Higher values might be desired when results aremore critical.Z´ is not linear and can bemade unrealistically small by outliers that skew the standarddeviations in either population. To improve the Z´ value, you can increase the amount oflabel in the sample, if acceptable for the assay, or increase the read time per well.
CAUTION! The assay plate and the instrument should be kept at room temperature,since temperature variations cause fluctuations in signal.

Chapter 2: Read Modes and Read Types
5025027 A 53
Imaging Read ModeTo use this read mode, you must have the SpectraMax MiniMax Imaging Cytometer installedwith the instrument.Imaging read mode conducts whole-cell imaging assays.Whole-cell imaging assays are cell-based, or object-based, rather than the single-pointmeasurements found in other types ofmicroplate reads. These types of assays can yieldmore biologically meaningful results that can discriminate the fluorescence associated withobjects, such as cells or beads, from the bulk solution within a microplate well.Themeasurement is primarily fluorescent with quantification of cell size, shape, area, andintensity. Label-free quantification is also supported through brightfield, transmitted lightimaging and visual inspection of the image. The camera resolution in theSpectraMax MiniMax Imaging Cytometer is sufficient to determine the approximate shape ofsmall 8micron objects, such as blood cells.Other advantages of these assays include, the direct interrogation of individual cells insteadof whole well or cell lysates that allow for controlling for cell numbers and heterogeneity incell-based assays. Also, increased sensitivity by both detecting a few fluorescent cells perwell, as well as detecting cells that are, on average, less fluorescent.You can obtain imaging data through visual inspection of the image or by using the analysistools available in the SoftMax Pro Software. See Analyzing Imaging Data on page 54.
Applications of Whole-Cell ImagingWhole-cell imaging assays measure a diverse set of cellular responses, such as fluorescentprotein expression (phosphorylated and total), cell viability (cell toxicity), cell apoptosis, andcell cycle analysis.Supported dyes include the following:
Fluorescein isothiocyanate (FITC)
Calcein AM
Alexa Fluor 488

SpectraMax i3 Multi-Mode Detection Platform User Guide
54 5025027 A
Analyzing Imaging Data
You can obtain imaging data through visual inspection of the image or by using the analysistools available in the SoftMax Pro Software. Transmitted light imaging supports visualinspection only. Fluorescent imaging supports both visual inspection and software-basedanalyses.In fluorescent imaging, the fluorescence in the sample is excited with light of a specifiedwavelength. The fluorophore emits at a longer wavelength that is captured in the image.The softwaremeasures the intensity of the emitted fluorescence and estimates the intensityof the background in the image. A combination of intensity threshold and object size can beused to find the cells for your analysis.You can select one of the following image analysis types:
Cell Count separates and counts cells based on signal intensity over background and cellsize.
Cell Proliferation detects cell coverage in the image, or the total cell area.
Marker Expression determines the level of signal intensity corresponding to protein ormarker expression.
For Cell Proliferation andMarker Expression analyses, you can define a global intensitythreshold range that finds the target cells while avoiding background intensity above andbelow the defined range. Define the size of the target cells to help eliminate false positives.For Cell Count analysis, you can define the intensity threshold above the backgroundintensity to be applied separately to each object in the image that meets the defined sizerange. This "local" threshold analysis helps to detect cells in areas of the image where theintensity is uneven. See Global Intensity Threshold and Local Intensity Threshold on page 55.In cases where cells are confluent on portions of the image, Molecular Devices recommendsusing Cell Proliferation rather than Cell Count. Cell counting searches for individual peaksand might have difficulties differentiating largemasses of cells or cells in which the staincovers only certain aspects of the cell other than the nucleus or the entire cytoplasm. Cellsthat are touching or close to touching might be identified and counted as a single cell.
Analysis Output ParametersDepending on the needs of your application, you can use one or more of the followinganalysis output parameters for your experiment:
Cell Count gives the total number of cells detected in the image.
Covered Area gives the combined area of all the cells detected in the image as apercentage of the entire image area.
Average Area gives the average area of the cells detected in the image.
Average Intensity gives the average signal intensity of the cells detected in the image.
Expression in Image gives the combined total signal intensity of the cells detected in theimage.
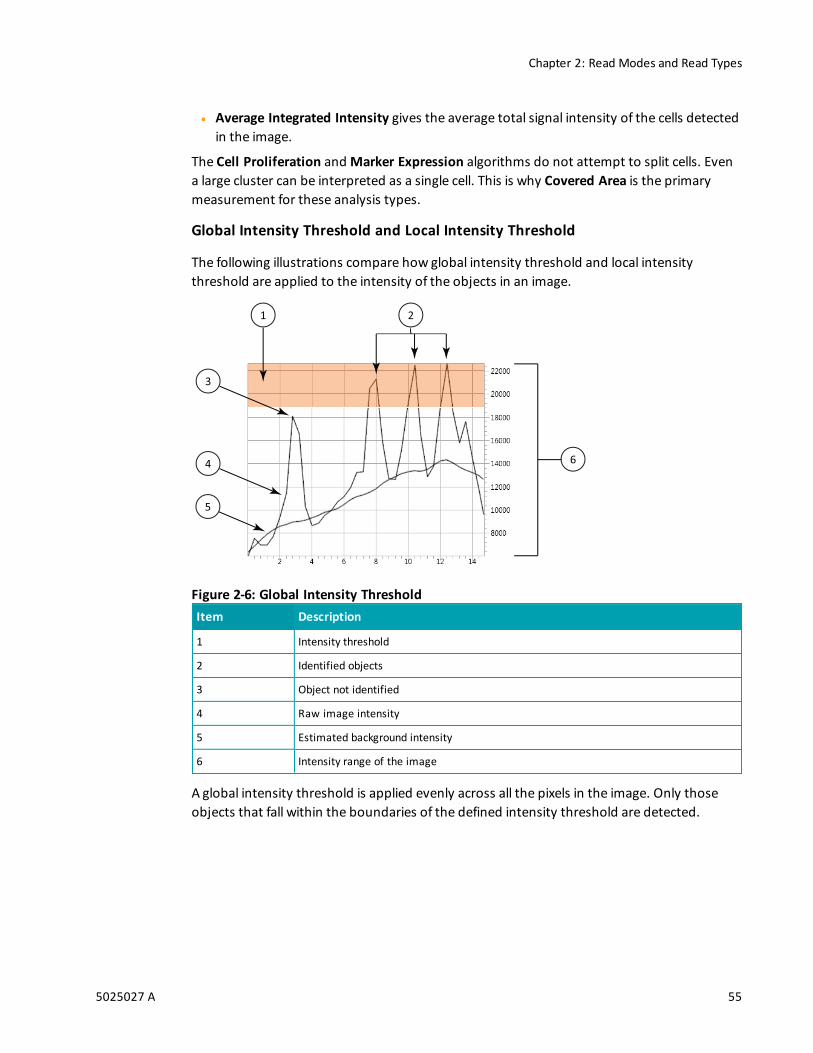
Chapter 2: Read Modes and Read Types
5025027 A 55
Average Integrated Intensity gives the average total signal intensity of the cells detectedin the image.
The Cell Proliferation andMarker Expression algorithms do not attempt to split cells. Evena large cluster can be interpreted as a single cell. This is why Covered Area is the primarymeasurement for these analysis types.
Global Intensity Threshold and Local Intensity Threshold
The following illustrations compare how global intensity threshold and local intensitythreshold are applied to the intensity of the objects in an image.
2
6
1
4
5
3
Item Description
1 Intensity threshold
2 Identified objects
3 Object not identified
4 Raw image intensity
5 Estimated background intensity
6 Intensity range of the image
Figure 2-6: Global Intensity Threshold
A global intensity threshold is applied evenly across all the pixels in the image. Only thoseobjects that fall within the boundaries of the defined intensity threshold are detected.

SpectraMax i3 Multi-Mode Detection Platform User Guide
56 5025027 A
2
5
1
3
4
Item Description
1 Intensity threshold
2 Identified objects
3 Raw image intensity
4 Estimated background intensity
5 Intensity range of the image
Figure 2-7: Local Intensity Threshold
A local intensity threshold is applied separately to each pixel in the image. As the backgroundintensity rises and falls, the defined intensity threshold rises and falls at the same rate abovethe background. This "local" threshold analysis helps to detect cells in areas of the imagewhere the intensity is uneven.

5025027 A 57
Chapter 3: Unpacking and Setting Up the Instrument
Before unpacking and setting up the SpectraMax® i3Multi-Mode Detection Platform,prepare a dry, flat work area that has sufficient space for the instrument, host computer,and required cables. To ensure adequate ventilation and allow access for disconnectingpower from the instrument, maintain a 20 cm to 30 cm (7.9 in. to 11.8 in.) gap between theback of the instrument and the wall. See Instrument Specifications on page 173.Unpacking and setting up the instrument includes the following procedures:
Unpacking the instrument and saving the original packaging. See Unpacking theInstrument on page 59.
Removing the transport locks from themicroplate drawer and the detection cartridgedrawer. See Removing the Transport Locks on page 63.
Connecting the instrument cables and installing the controlling software. See Connectingthe Instrument Cables on page 66.
In addition, you can connect a gas supply line to the back of the instrument.See Connectingand Disconnecting a Gas Supply on page 68.
Note: If you are also installing the SpectraMax MiniMax Imaging Cytometer, followthe unpacking instructions for themicroplate reader in this guide and then refer tothe installation instructions for the cytometer. See Installing and Setting Up theCytometer on page 85.
3

SpectraMax i3 Multi-Mode Detection Platform User Guide
58 5025027 A
Contents of the PackageIn addition to the instrument, the package contains the following tools and accessoriesincluded in the accessory tool box and required for installing the instrument:
Illustration Part Number Description
5025026 Installation guide
VZ 000 014 USB computer connection cable, 3 meter (9.8 foot)
VN 18S S01or VN 18F F01 01
Power cord, 115Vor Power cord, 230V
5018636 SoftMax Pro Software with Product Key
YW 000 006 Hex key, 2.0 mm
Table 3-1: Package Contents
For a complete list of the contents of the package, see the enclosed packing list.
Note: Detection cartridges are shipped separately.
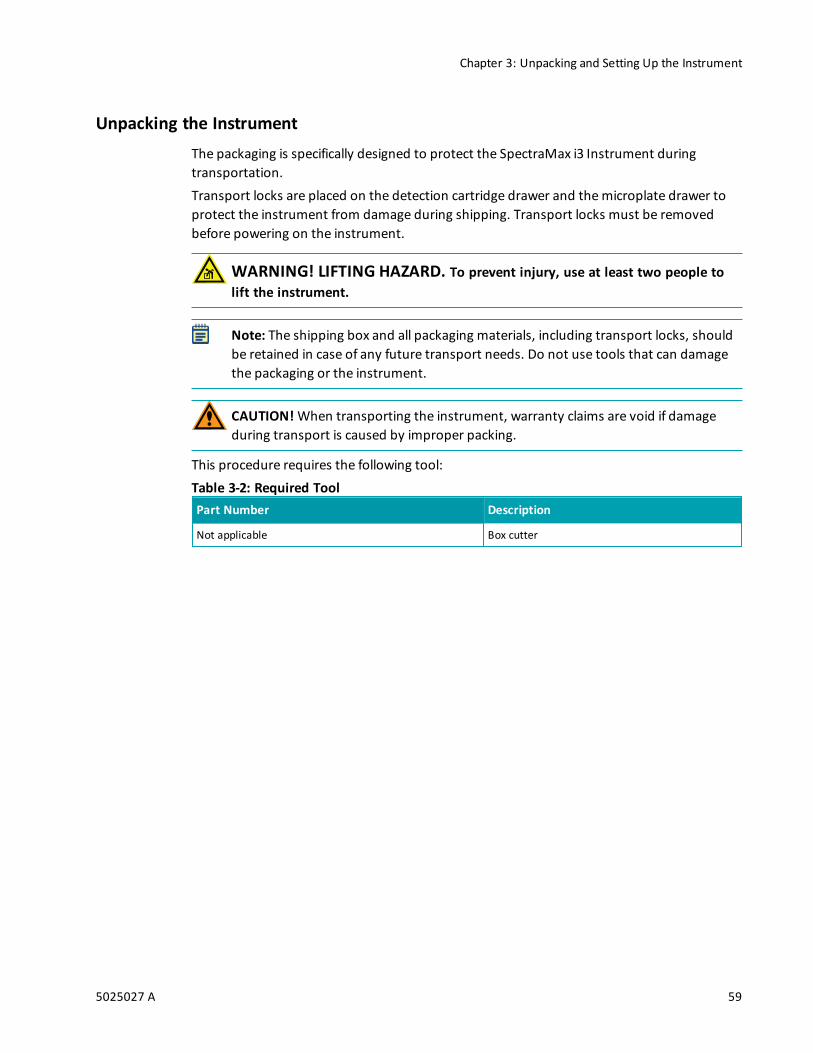
Chapter 3: Unpacking and Setting Up the Instrument
5025027 A 59
Unpacking the InstrumentThe packaging is specifically designed to protect the SpectraMax i3 Instrument duringtransportation.Transport locks are placed on the detection cartridge drawer and themicroplate drawer toprotect the instrument from damage during shipping. Transport locks must be removedbefore powering on the instrument.
WARNING! LIFTING HAZARD. To prevent injury, use at least two people tolift the instrument.
Note: The shipping box and all packaging materials, including transport locks, shouldbe retained in case of any future transport needs. Do not use tools that can damagethe packaging or the instrument.
CAUTION!When transporting the instrument, warranty claims are void if damageduring transport is caused by improper packing.
This procedure requires the following tool:
Part Number Description
Not applicable Box cutter
Table 3-2: Required Tool

SpectraMax i3 Multi-Mode Detection Platform User Guide
60 5025027 A
To unpack the instrument:
1. Check the box for any visible damage during transportation. In case of damage, informthe supplier immediately and keep the damaged packaging.
CAUTION! Keep the box upright. Do not tip or tilt the box or place it on its side.
2. With the box facing up as indicated on the packaging, use a box cutter to carefully cutopen the side of the box labeled Open Here.
OPEN HERE
Figure 3-1: Opening the Box

Chapter 3: Unpacking and Setting Up the Instrument
5025027 A 61
3. Grasp the handle on the cardboard and slide the instrument out of the box.
Tip: It might be easier if a second person holds the box in place while theinstrument is slid out on the cardboard.
Figure 3-2: Sliding the Instrument Out of the Box
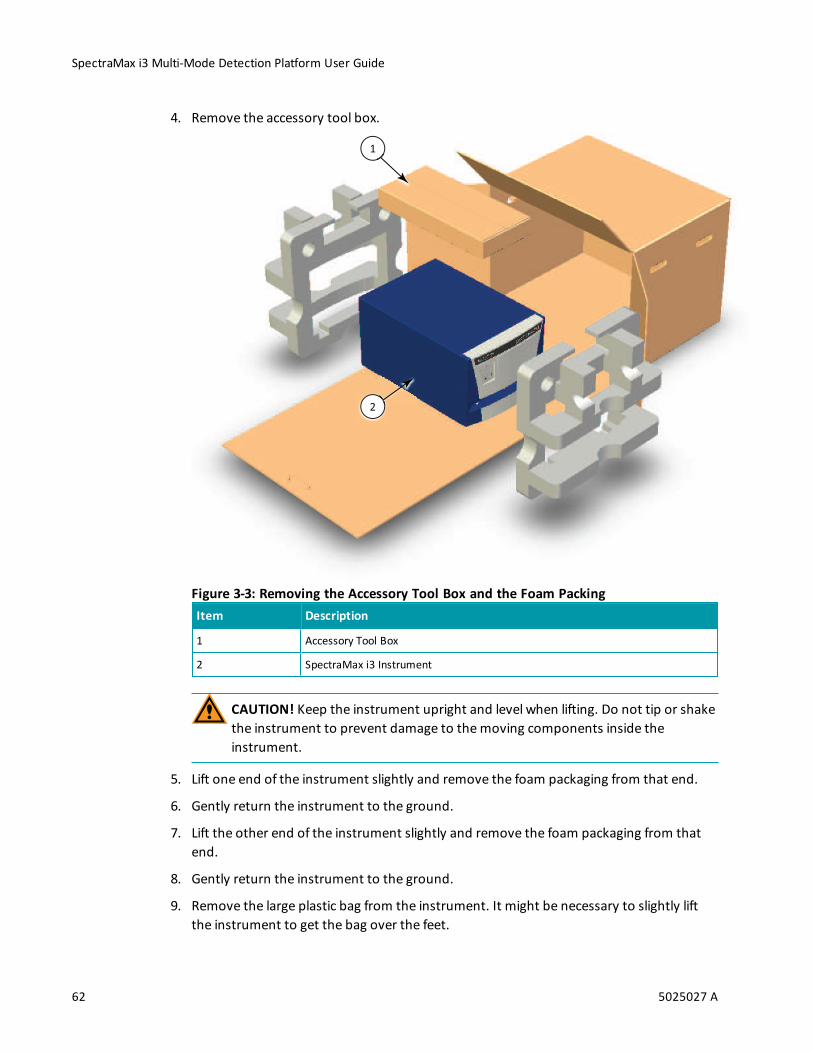
SpectraMax i3 Multi-Mode Detection Platform User Guide
62 5025027 A
4. Remove the accessory tool box.
1
2
Item Description
1 Accessory Tool Box
2 SpectraMax i3 Instrument
Figure 3-3: Removing the Accessory Tool Box and the Foam Packing
CAUTION! Keep the instrument upright and level when lifting. Do not tip or shakethe instrument to prevent damage to themoving components inside theinstrument.
5. Lift one end of the instrument slightly and remove the foam packaging from that end.
6. Gently return the instrument to the ground.
7. Lift the other end of the instrument slightly and remove the foam packaging from thatend.
8. Gently return the instrument to the ground.
9. Remove the large plastic bag from the instrument. It might be necessary to slightly liftthe instrument to get the bag over the feet.

Chapter 3: Unpacking and Setting Up the Instrument
5025027 A 63
10. With one person on each end, lift the instrument and gently place the instrument on adry, flat area. For information about the weight of the instrument, see InstrumentSpecifications on page 173.
Note: The feet are sticky and the instrument does not slide well. It can mark thework surface if slid.
Removing the Transport Locks
CAUTION! The instrument can be damaged if the transport locks are not removedbefore the instrument is powered on.
Transport locks are placed on the detection cartridge drawer and themicroplate drawer toprotect the instrument from damage during shipping. Transport locks must be removedbefore powering on the instrument.
Note: If you are installing the SpectraMax MiniMax Imaging Cytometer, leave thetransport locks in place until after the cytometer is attached to themicroplate reader.See Installing and Setting Up the Cytometer on page 85.
This procedure requires the following tool:
Illustration Part Number Description
YW 000 006 Hex key, 2.0 mm, included with the microplate reader
Table 3-3: Required Tool
CAUTION! Do not touch or loosen any screws or parts other than those specificallydesignated in the instructions. Doing so could causemisalignment and possibly voidthe warranty.
CAUTION! The front cover is held onto the front of the instrument by powerfulmagnets. Keep magnetic storage devices or strips, such as hard drives, key cards, andcredit cards, away from the instrument covers.

SpectraMax i3 Multi-Mode Detection Platform User Guide
64 5025027 A
To remove the transport locks:
1. Firmly pull on the front cover to remove it and then set it aside. The front cover is heldonto the front of the instrument by powerful magnets.
Tip: It is easiest to remove the front cover by pulling from the bottom.
Figure 3-4: Detection Cartridge Drawer Cover Removed
2. Turn the detection cartridge drawer transport lock counter-clockwise until it is free of thethreaded hole in the floor of the drawer compartment.
2
1
DON’T MOVE
CARTRIDGE
DRAWER
MANUALLY
ONLY LOAD / REMOVE
CARTRIDGES BY PRESSING
TOP READ BUTTON ON LEFT
Item Description
1 Detection cartridge drawer
2 Detection cartridge drawer transport lock
Figure 3-5: Detection Cartridge Drawer Transport Lock
3. Gently slide the detection cartridge drawer forward until it is outside of themaininstrument.

Chapter 3: Unpacking and Setting Up the Instrument
5025027 A 65
4. Lower the detection cartridge drawer transport lock to remove it from the detectioncartridge drawer. Store the transport lock in the instrument accessories toolbox.
5. Gently push the detection cartridge drawer back inside the instrument.
6. Replace the front cover by aligning themagnets on the inside of the front cover with themagnets on the instrument base.
7. Gently pull the yellow tab protruding from themicroplate chamber door to open thedoor. Themicroplate drawer door must be held open manually while removing thetransport lock.
Note: Be careful not to tear the yellow tab. It must remain attached to thetransport lock to make it easier to open themicroplate chamber door.
5
12
43
6
Item Description
1 Screw #1 fastens the lock to the internal frame of the instrument
2 Screw #2 fastens the lock to the microplate drawer
3 Screw #3 fastens the lock to the microplate drawer
4 Microplate drawer
5 Microplate chamber door in open position
6 Microplate drawer transport lock
Figure 3-6: Microplate Drawer Transport Lock
8. Use the provided 2.0 mm hex key to loosen screw #1 in the upper-left corner of thetransport lock until the lock disconnects from the instrument frame. The screw isequipped with a retaining washer that prevents it from being removed from the lock.

SpectraMax i3 Multi-Mode Detection Platform User Guide
66 5025027 A
9. Loosen screws #2 and #3 until the lock comes free of themicroplate drawer. The screwsare equipped with retaining washers that prevent them from being removed from thelock. Store the transport lock in the instrument accessories toolbox.
10. Gently close themicroplate chamber door.
11. Save the original carton, foam inserts, accessories toolbox, and transport locks in casethe instrument must be shipped in the future.
Connecting the Instrument CablesThe power cords and USB cables connect to the ports on the back of the instrument.
Note: If you are installing the SpectraMax MiniMax Imaging Cytometer, do not usethis procedure. See Installing and Setting Up the Cytometer on page 85.
This procedure requires the following tools and accessories:
Illustration Part Number Description
VZ 000 014 USB computer connection cable, 3 meter (9.8 foot)
VN 18S S01or VN 18F F01 01
Power cord, 1 meter (3.3 foot)
5018636 SoftMax Pro Software with Product Key
Table 3-4: Required Tools and Accessories
Connect the instrument to the controlling computer using the supplied USB cable. Use thepower cord supplied with the instrument to connect the instrument to a grounded walloutlet. You can optionally connect a gas supply line. A gas supply line is not supplied in thepackage.
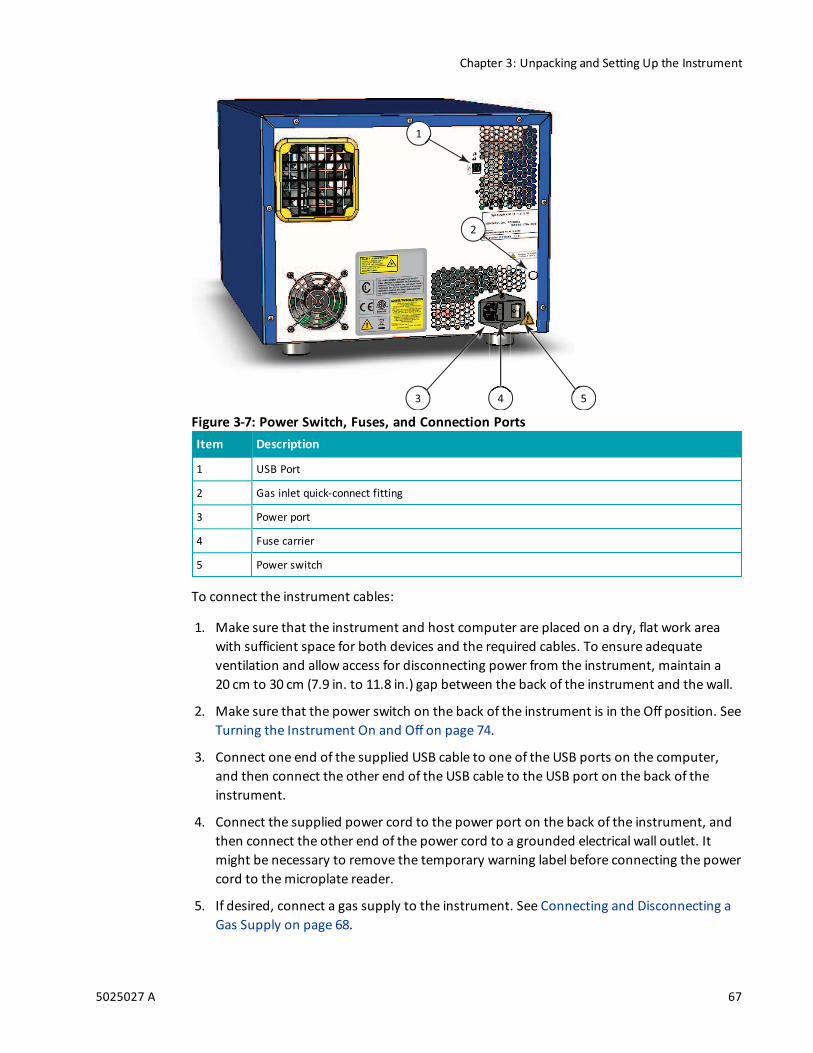
Chapter 3: Unpacking and Setting Up the Instrument
5025027 A 67
1
3 4 5
2
Item Description
1 USB Port
2 Gas inlet quick-connect fitting
3 Power port
4 Fuse carrier
5 Power switch
Figure 3-7: Power Switch, Fuses, and Connection Ports
To connect the instrument cables:
1. Make sure that the instrument and host computer are placed on a dry, flat work areawith sufficient space for both devices and the required cables. To ensure adequateventilation and allow access for disconnecting power from the instrument, maintain a20 cm to 30 cm (7.9 in. to 11.8 in.) gap between the back of the instrument and the wall.
2. Make sure that the power switch on the back of the instrument is in the Off position. SeeTurning the Instrument On and Off on page 74.
3. Connect one end of the supplied USB cable to one of the USB ports on the computer,and then connect the other end of the USB cable to the USB port on the back of theinstrument.
4. Connect the supplied power cord to the power port on the back of the instrument, andthen connect the other end of the power cord to a grounded electrical wall outlet. Itmight be necessary to remove the temporary warning label before connecting the powercord to themicroplate reader.
5. If desired, connect a gas supply to the instrument. See Connecting and Disconnecting aGas Supply on page 68.

SpectraMax i3 Multi-Mode Detection Platform User Guide
68 5025027 A
6. Turn on the power to the host computer.
7. Install the SoftMax Pro Software on the computer. See the SoftMax Pro Software quickstart guide or user guide.
Note: The instrument is supported by SoftMax Pro Software version 6.3 or later.
Connecting and Disconnecting a Gas SupplyA gas supply, such as a CO
2, nitrogen, or other gas supply, can be connected to the
SpectraMax i3 Instrument. This is useful when reading plates as part of a cell-based assay inwhich a CO
2environment needs to be provided to keep cell cultures alive. The gas supply is
not regulated or monitored by the instrument or software.These procedures require the following tools and accessories:
Part Number Description
Not applicable Polyurethane tubing, outside diameter = 4.0 mm
Not applicable Flat-head screwdriver
S MS 135 100 Gas inlet unlock tool (not provided with the instrument)
Table 3-5: Required Tools and Accessories

Chapter 3: Unpacking and Setting Up the Instrument
5025027 A 69
1
3 4 5
2
Item Description
1 USB Port
2 Gas inlet quick-connect fitting
3 Power port
4 Fuse carrier
5 Power switch
Figure 3-8: Power Switch, Fuses, and Connection Ports
WARNING! Use a compressed gas supply in a well ventilated area. Theinstrument is not air-tight, and so gas can escape into the atmosphere surroundingthe instrument. When using potentially toxic gas, always observe the appropriatecautionary procedures as defined by your safety officer to maintain a safe workingenvironment.

SpectraMax i3 Multi-Mode Detection Platform User Guide
70 5025027 A
To connect a gas supply to the instrument:
1. Make sure that the power switch on the back of the instrument is in the off position.
2. Using a flat-head screwdriver, pry off the small black cap on the back of the instrumentalong the right edge to access the quick-connect fitting. Save the cap for later use.
3. Connect the tubing to the quick-connect fitting.
4. Connect the other end of the tubing to the gas supply.
5. Set the gas supply to the desired input pressure.
Note: For themaximum allowable air supply pressure for the gas inlet andpolyurethane tubing specifications, see Instrument Specifications on page 173.
To disconnect the polyurethane tubing from the instrument:
1. Make sure that the power switch on the back of the instrument is in the off position.
2. Turn off the gas supply at the source and wait a sufficient time for the pressure todissipate.
3. Use the gas inlet unlock tool to press the quick-connect fitting and release the tubing.
Note: The gas inlet unlock tool is not supplied with the instrument.
4. Remove the tubing from the quick-connect fitting.
5. Replace the black cap over the quick-connect fitting.
5025027 A 71
Chapter 4: Using the Instrument
Before operating the instrument or performing maintenance operations, make sure that youare familiar with the Safety Information on page 7 and make sure it is set up according to theinstructions in Unpacking and Setting Up the Instrument on page 57.For information on controlling the instrument with the software, see the SoftMax ProSoftware application help or user guide.This section includes the following topics:
Front Panel Controls and Indicators on page 72
Turning the Instrument On and Off on page 74
Loading and Unloading Microplates on page 76
Using Detection Cartridges on page 78
4
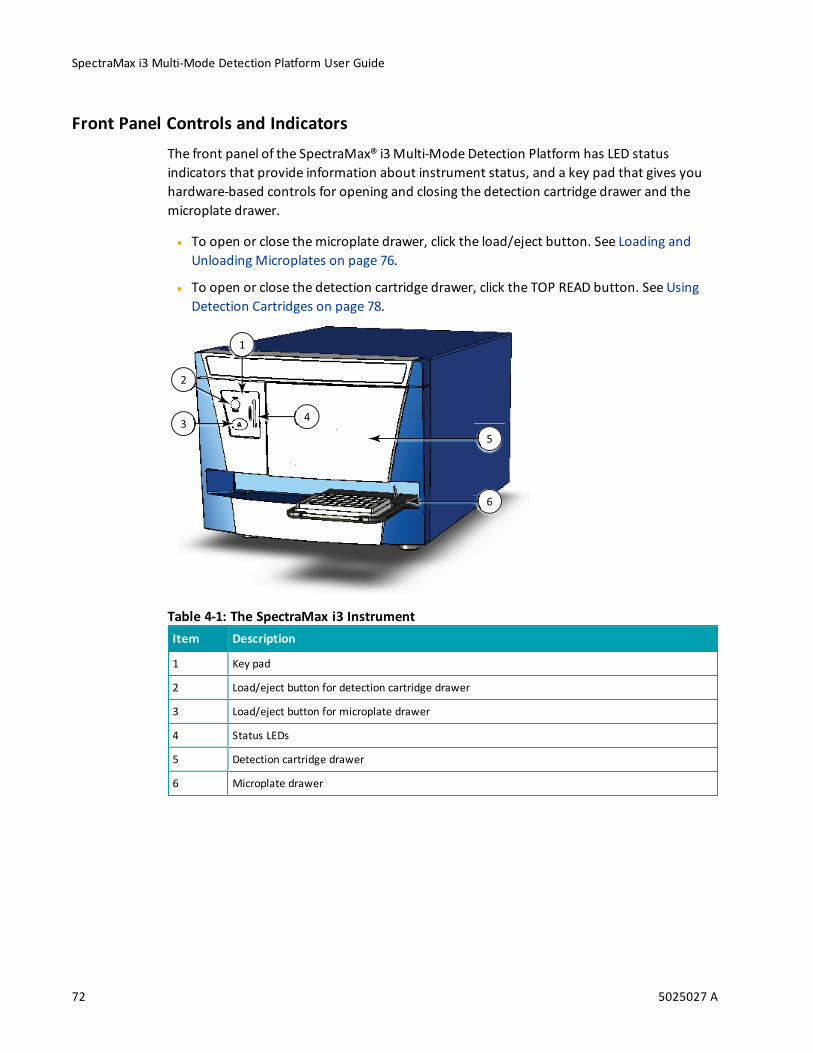
SpectraMax i3 Multi-Mode Detection Platform User Guide
72 5025027 A
Front Panel Controls and IndicatorsThe front panel of the SpectraMax® i3Multi-Mode Detection Platform has LED statusindicators that provide information about instrument status, and a key pad that gives youhardware-based controls for opening and closing the detection cartridge drawer and themicroplate drawer.
To open or close themicroplate drawer, click the load/eject button. See Loading andUnloading Microplates on page 76.
To open or close the detection cartridge drawer, click the TOP READ button. See UsingDetection Cartridges on page 78.
2
4
5
6
3
1
Item Description
1 Key pad
2 Load/eject button for detection cartridge drawer
3 Load/eject button for microplate drawer
4 Status LEDs
5 Detection cartridge drawer
6 Microplate drawer
Table 4-1: The SpectraMax i3 Instrument
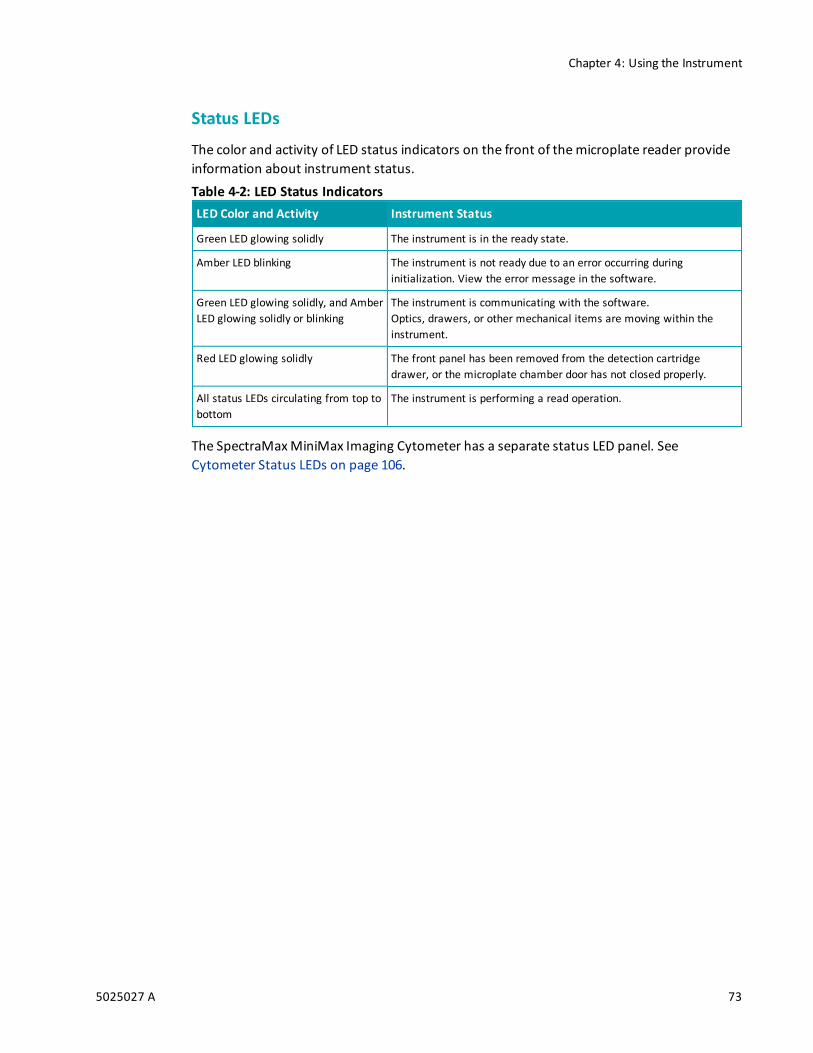
Chapter 4: Using the Instrument
5025027 A 73
Status LEDs
The color and activity of LED status indicators on the front of themicroplate reader provideinformation about instrument status.
LED Color and Activity Instrument Status
Green LED glowing solidly The instrument is in the ready state.
Amber LED blinking The instrument is not ready due to an error occurring duringinitialization. View the error message in the software.
Green LED glowing solidly, and AmberLED glowing solidly or blinking
The instrument is communicating with the software.Optics, drawers, or other mechanical items are moving within theinstrument.
Red LED glowing solidly The front panel has been removed from the detection cartridgedrawer, or the microplate chamber door has not closed properly.
All status LEDs circulating from top tobottom
The instrument is performing a read operation.
Table 4-2: LED Status Indicators
The SpectraMax MiniMax Imaging Cytometer has a separate status LED panel. SeeCytometer Status LEDs on page 106.

SpectraMax i3 Multi-Mode Detection Platform User Guide
74 5025027 A
Turning the Instrument On and OffThe power switch and power connection are on the back of the instrument.
1
3 4 5
2
Item Description
1 USB Port
2 Gas inlet quick-connect fitting
3 Power port
4 Fuse carrier
5 Power switch
Figure 4-1: Power Switch, Fuses, and Connection Ports
To ensure adequate ventilation and allow access for disconnecting power from theinstrument, maintain a 20 cm to 30 cm (7.9 in. to 11.8 in.) gap between the back of theinstrument and the wall.

Chapter 4: Using the Instrument
5025027 A 75
To turn the instrument on or off, press the power switch to place the rocker in the on or offposition.
2
1
3
Item Description
1 Power switch
2 Off
3 On
Table 4-3: Power Switch
Before connecting or disconnecting the power cord, make sure that the power switch on theback of the instrument is in the Off position.

SpectraMax i3 Multi-Mode Detection Platform User Guide
76 5025027 A
Loading and Unloading MicroplatesTo load or unload a microplate:
1. On the front panel of the instrument, press the load/eject button to move themicroplate drawer outside of the instrument.
2. Place themicroplate on or remove it from themicroplate drawer.
Note:Microplates are placed on themicroplate drawer in landscape orientationwith well A1 in the left corner closest to the instrument.
12
3
Item Description
1 Load/eject button for the microplate drawer
2 Microplate drawer
3 Well A1 on the microplate
Figure 4-2: Microplate Drawer with Microplate Loaded
3. Press the load/eject button to move themicroplate drawer inside of the instrument.

Chapter 4: Using the Instrument
5025027 A 77
Selecting Suitable Microplate Types
Depending on the application, the SpectraMax i3 Instrument can read 6, 12, 24, 48, 96, and384-well microplates and strip wells. For micro-volumemeasurements, the instrumentsupports SpectraDrop 24-well micro-volumemicroplates and SpectraDrop 64-well micro-volumemicroplates. The instrument is capable of reading 1536-well microplates when usedwith specific detection cartridges.When reading optical density at wavelengths below 340 nm, special UV-transparent,disposable, or quartz microplates that allow transmission of the far UV spectra must beused.Top and bottom reads are available for fluorescence detection using the built inmonochromator.
Note: For the SpectraMax i3Multi-Mode Detection Platform, the detection cartridgescan be used for top reads.
In addition to themicroplates supported in the SoftMax Pro Softwaremicroplate list, youcan use the software to define a newmicroplate type using the specifications from themanufacturer for well size, spacing, and distance from themicroplate edge.The type ofmicroplate and the way it is handled can affect themeasurement performance ofthe instrument. Select a microplate type with properties suited for the application and foruse with multi-modemicroplate readers.
CAUTION! To prevent damage to the instrument, the height of themicroplatemustnot exceed 25 mm.
Some general microplate handling guidelines include:
Never touch the clear well bottom ofmicroplates.
Visually inspect the bottom and rim of themicroplate before use to make sure it is free ofdirt and contaminants.
Keep unused microplates clean and dry.
Make sure the strips on strip plates are inserted correctly and level with the frame.
Do not use V-bottom microplates for absorbance reads, bottom reads, or imaging.Irregular plastic density in the tip of the well can cause inaccuratemeasurements.

SpectraMax i3 Multi-Mode Detection Platform User Guide
78 5025027 A
Using Detection CartridgesThe read capabilities of the SpectraMax i3 Instrument can be upgraded with user-installabledetection cartridges. A detection cartridge contains its own independent light source, optics,and electrical components needed to perform specific read modes for specific applications.Application notes with specific application protocol suggestions can be found in theInformation Center and the Knowledge Base on theMolecular Devices web site atwww.moleculardevices.com.A detection cartridge can occupy one or more positions, depending on size and functionality.Installation and removal of each detection cartridge is the same regardless of the number ofslots it occupies in the detection cartridge drawer.The detection cartridge drawer has four (4)slots available for installing detection cartridges.For the SpectraMax i3Multi-Mode Detection Platform, the detection cartridges can be usedfor top reads.
CAUTION! To prevent dust accumulation inside the instrument, the detectioncartridge drawer should be open only for as long as necessary to install or removedetection cartridges. Keep the detection cartridge drawer closed whenever possible.
For instructions for installing or removing detection cartridges, see the following topics:
Installing a Detection Cartridge on page 78
Removing a Detection Cartridge on page 82
For information about the applications and read modes enabled for a specific detectioncartridge, see Available Detection Cartridges on page 123.
Installing a Detection Cartridge
The installed detection cartridges are automatically detected by the SoftMax Pro Software.When detected, they appear in the SoftMax Pro Software Settings dialog enabling the readmodes for the installed detection cartridges. The detection cartridges must be installed in theSpectraMax i3 Instrument to enable them for data acquisition in the SoftMax Pro Software.There are four (4) slots available in the detection cartridge drawer. You can install a detectioncartridge into any available slot.
Note:When using the SoftMax Pro Software in offlinemode, all detection cartridgesare available in the Settings dialog.

Chapter 4: Using the Instrument
5025027 A 79
To install a detection cartridge:
1. Press the TOP READ button on the front panel to open the detection cartridge drawer.
CAUTION! To prevent damage to the installed detection cartridges and theinstrument, do not manually slide the detection cartridge drawer in or out whenone or more detection cartridges are installed in the drawer.
Figure 4-3: Detection Cartridge Drawer Open
2. Select the slot or slots on the detection cartridge drawer for the detection cartridge.
3. Remove the red cap from the detection cartridge before installation, if supplied with thedetection cartridge.
4. Position the two small holes and the connector pins on the detection cartridge over theholder pins and connector for the detection cartridge slot.
Note: Some detection cartridges occupy more than one slot. For the installationrequirements for a specific detection cartridge, see Available Detection Cartridgeson page 123.
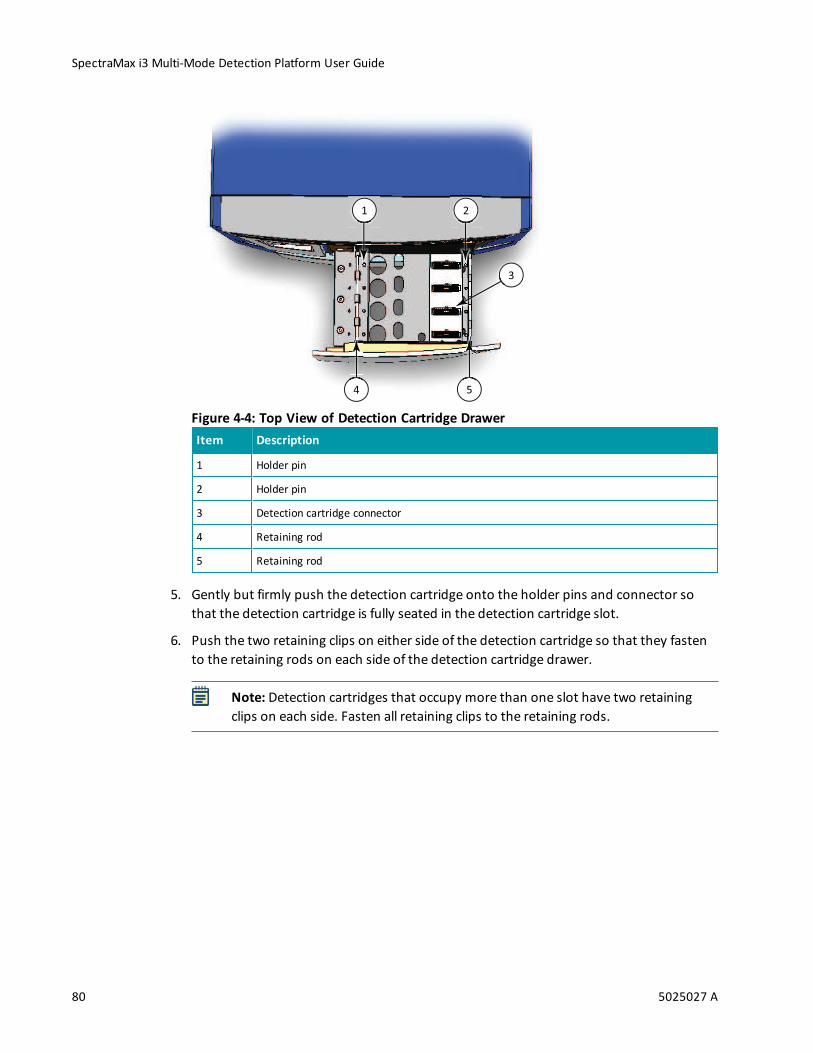
SpectraMax i3 Multi-Mode Detection Platform User Guide
80 5025027 A
4
1
3
2
5
Item Description
1 Holder pin
2 Holder pin
3 Detection cartridge connector
4 Retaining rod
5 Retaining rod
Figure 4-4: Top View of Detection Cartridge Drawer
5. Gently but firmly push the detection cartridge onto the holder pins and connector sothat the detection cartridge is fully seated in the detection cartridge slot.
6. Push the two retaining clips on either side of the detection cartridge so that they fastento the retaining rods on each side of the detection cartridge drawer.
Note: Detection cartridges that occupy more than one slot have two retainingclips on each side. Fasten all retaining clips to the retaining rods.

Chapter 4: Using the Instrument
5025027 A 81
4
1
2
5
3
Item Description
1 Detection cartridge
2 Retaining clip unattached
3 Retaining clip attached
4 Retaining rod
5 Retaining rod
Figure 4-5: Detection Cartridge Retaining Clips and Retaining Rods
7. Install additional detection cartridges, if desired.
8. Ensure that all the installed cartridges are evenly aligned.
9. Press the TOP READ button on the front panel to close the detection cartridge drawer.
10. Start the SoftMax Pro Software and connect to the instrument.
If the software is already running and connected to the instrument, go to theOperationstab in the ribbon and click Refresh to allow the software to detect the installed detectioncartridges.
CAUTION! To prevent dust accumulation inside the instrument, the detectioncartridge drawer should be open only for as long as necessary to install or removedetection cartridges. Keep the detection cartridge drawer closed wheneverpossible.

SpectraMax i3 Multi-Mode Detection Platform User Guide
82 5025027 A
Removing a Detection Cartridge
It is not necessary to remove a detection cartridge when it is not in use. You can, however,remove a detection cartridge to make room for other detection cartridges or when theinstrument is being packed for shipping. After a detection cartridge is removed, it should bestored in its detection cartridge box in a dry, dust-free, controlled environment.To remove a detection cartridge from the instrument:
1. Press the TOP READ button on the front panel to open the detection cartridge drawer.
CAUTION! To prevent damage to the installed detection cartridges and theinstrument, do not manually slide the detection cartridge drawer in or out whenone or more detection cartridges are installed in the drawer.
4
1
2
5
3
Item Description
1 Detection cartridge
2 Retaining clip unattached
3 Retaining clip attached
4 Retaining rod
5 Retaining rod
Figure 4-6: Detection Cartridge Retaining Clips and Retaining Rods
2. Place the end of a flat-head screwdriver in the slot on the retaining clip and use it as alever to unfasten the retaining clips on either side of the detection cartridge.
Note: Detection cartridges that occupy more than one slot have two retainingclips on each side. Unfasten all retaining clips from the retaining rods.

Chapter 4: Using the Instrument
5025027 A 83
3. Lift the detection cartridge straight up off of the connector and holder pins on thedetection cartridge slot.
4. Place the red cap on the detection cartridge, if supplied with the detection cartridge.
5. When not in use, store the detection cartridge in its original packaging.
6. Remove additional detection cartridges, if desired.
7. Press the TOP READ button on the front panel to close the detection cartridge drawer.
CAUTION! To prevent dust accumulation inside the instrument, the detectioncartridge drawer should be open only for as long as necessary to install or removedetection cartridges. Keep the detection cartridge drawer closed wheneverpossible.

SpectraMax i3 Multi-Mode Detection Platform User Guide
84 5025027 A

5025027 A 85
Chapter 5: SpectraMax MiniMax Imaging Cytometer
The SpectraMax® MiniMax™ Imaging Cytometer adds imaging capability to theSpectraMax i3 Instrument to visually inspect your sample and to run cell-based assays atcellular or whole-cell resolution. The cytometer uses solid-state illumination, a digital camera,a 4x objective lens, laser auto-focus, and auto-exposure to capture fluorescent or label-freeimages of a sample at the bottom of themicroplate wells. The cytometer supports 96-welland 384-well, flat-bottom, clear-bottom microplates.To perform brightfield, transmitted-light imaging, you must install the SpectraMax i3Platform Transmitted Light (TL) Detection Cartridge in the detection cartridge drawer. SeeTransmitted Light (TL) Detection Cartridge on page 108.You can create protocols that use the SpectraMax MiniMax Imaging Cytometer in theSoftMax® Pro Software. For information on creating protocols, see “Creating a Protocol” inthe SoftMax Pro Software application help or user guide.
Installing and Setting Up the CytometerThe SpectraMax MiniMax Imaging Cytometer attaches to the bottom of the SpectraMax i3Multi-Mode Detection Platform.
21
Item Description
1 Multi-Mode Detection Platform (microplate reader)
2 Imaging Cytometer (cytometer)
Figure 5-1: Microplate Reader and Cytometer
Note: If you are installing the SpectraMax i3 Instrument at the same time, unpack themicroplate reader before setting up the cytometer, but leave themicroplate readertransport locks in place until after the cytometer is attached to themicroplate reader.See Unpacking and Setting Up the Instrument on page 57.
5

SpectraMax i3 Multi-Mode Detection Platform User Guide
86 5025027 A
Installing and setting up the cytometer includes the following steps:
Remove the cap screws and the optics cover that protect the optical components duringshipping. See Removing the Shipping Protections on page 89.
Attach the cytometer to the bottom of themicroplate reader. See Attaching the ImagingCytometer to theMicroplate Reader on page 92.
Remove the transport locks from themicroplate and detection cartridge drawers. SeeRemoving the Transport Locks on page 63.
Connect the instrument cables and install the controlling software. See Connecting theCables on page 96.
Calibrate the well image for the cytometer. See Calibrating the Cytometer on page 101.
To perform brightfield, transmitted-light imaging, you must install the SpectraMax i3Platform Transmitted Light (TL) Detection Cartridge in the detection cartridge drawer. SeeTransmitted Light (TL) Detection Cartridge on page 108.
Contents of the Cytometer Package
In addition to the imaging cytometer, the package contains the following tools andaccessories required for installing the instrument:
Illustration Part Number Description
5024111 Installation guide
5022671 SpectraMax i3 Platform Transmitted Light (TL) Detection Cartridge
1-5590-0010 Evaluation plate
5018636 SoftMax Pro Software with Product Key
5018968 AC power interconnection cord, 0.5 meter (1.5 foot)
Table 5-1: Cytometer Package Contents

Chapter 5: SpectraMax MiniMax Imaging Cytometer
5025027 A 87
Illustration Part Number Description
5018965 USB interconnection cable, 0.9 meter (3 foot)
5025874 USB computer connection cable, 3 meter (9.8 foot)
5024094 Hex key, 2.5 mm
5025413 Hex key, 3.0 mm
5024095 Open-end wrench, 12 mm
5024986 Laser-interlock brackets (2)with machine screws (4)
Table 5-1: Cytometer Package Contents (continued)
For a complete list of the contents of the package, see the enclosed packing list.

SpectraMax i3 Multi-Mode Detection Platform User Guide
88 5025027 A
Unpacking the Cytometer
The packaging is specifically designed to protect the SpectraMax MiniMax ImagingCytometer during transportation.
WARNING! LIFTING HAZARD. To prevent injury, use at least two people tolift the instrument.
Note: The shipping box and all packaging materials should be retained in case of anyfuture transport needs. Do not use tools that can damage the packaging or theinstrument.
CAUTION!When transporting the instrument, warranty claims are void if damageduring transport is caused by improper packing.
This procedure requires the following tool:
Part Number Description
Not applicable Box cutter
Table 5-2: Required Tool
To unpack the cytometer:
1. Check the box for any visible damage during transportation. In case of damage, informthe supplier immediately and keep the damaged packaging.
2. With the box facing up as indicated on the packaging, use a box cutter to carefully cutopen the top of the box.
3. Remove the top layer of packaging foam that holds the tools and accessories.
CAUTION! Keep the instrument upright and level when lifting. Do not tip or shakethe instrument to prevent damage to themoving components inside theinstrument.
4. With one person on each end, lift the instrument out of the box and gently place theinstrument on a dry, flat area. For information about the weight of the instrument, seePhysical Specifications on page 179.
5. Remove the large plastic bag from the instrument. It might be necessary to slightly liftthe instrument to get the bag over the feet.
Note: The feet are sticky and the instrument does not slide well. It can mark thework surface if slid.

Chapter 5: SpectraMax MiniMax Imaging Cytometer
5025027 A 89
Removing the Shipping Protections
To prevent damage during shipping, four (4) purple socket-head cap screws secure the opticsplate on the top of the cytometer, and a cover protects the optical components in the opticstower.
1
2
1
1
1
Item Description
1 Optics plate socket-head cap screws (4)
2 Optics cover
Figure 5-2: Optics Protections for Shipping
CAUTION! Never touch any of the optic mirrors, lenses, filters, or cables. The opticsare extremely delicate, and critical to the function of the instrument.
This procedure requires the following tool:
Illustration Part Number Description
5025413 Hex key, 3.0 mm
Table 5-3: Required Tool
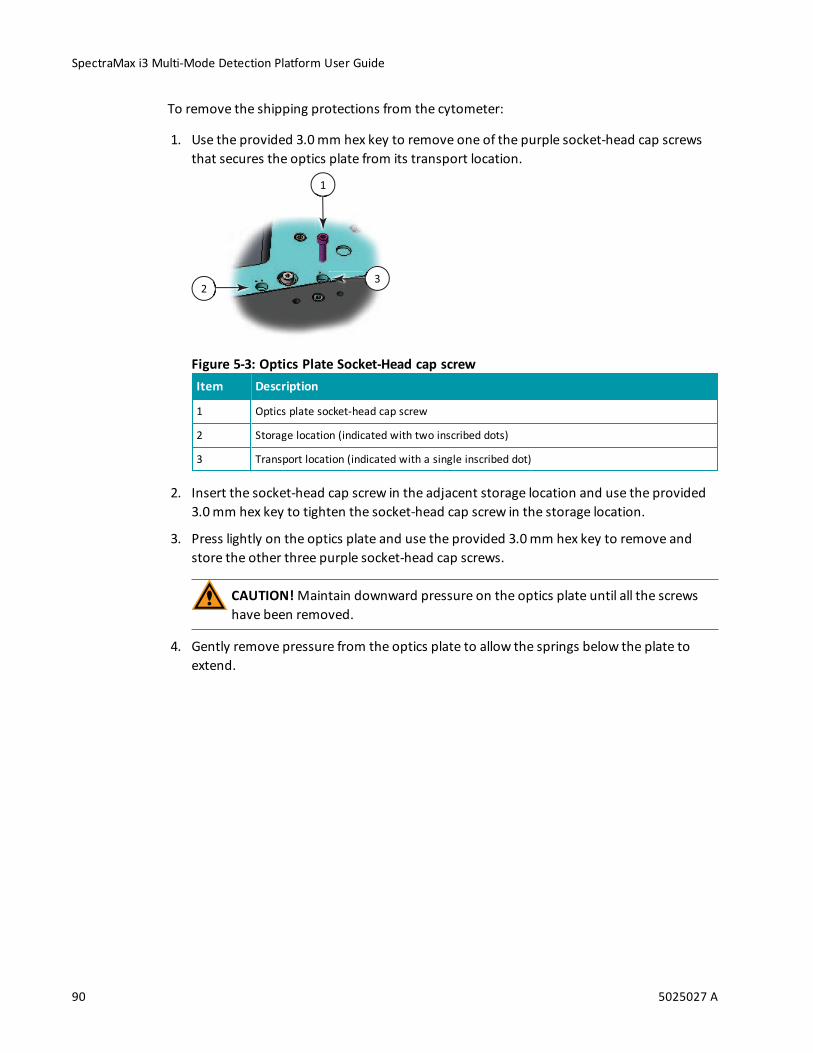
SpectraMax i3 Multi-Mode Detection Platform User Guide
90 5025027 A
To remove the shipping protections from the cytometer:
1. Use the provided 3.0 mm hex key to remove one of the purple socket-head cap screwsthat secures the optics plate from its transport location.
1
2
3
Item Description
1 Optics plate socket-head cap screw
2 Storage location (indicated with two inscribed dots)
3 Transport location (indicated with a single inscribed dot)
Figure 5-3: Optics Plate Socket-Head cap screw
2. Insert the socket-head cap screw in the adjacent storage location and use the provided3.0 mm hex key to tighten the socket-head cap screw in the storage location.
3. Press lightly on the optics plate and use the provided 3.0 mm hex key to remove andstore the other three purple socket-head cap screws.
CAUTION!Maintain downward pressure on the optics plate until all the screwshave been removed.
4. Gently remove pressure from the optics plate to allow the springs below the plate toextend.

Chapter 5: SpectraMax MiniMax Imaging Cytometer
5025027 A 91
5. Use the provided 3.0 mm hex key to remove the three (3) purple socket-head cap screwsthat secure the protective cover on the optics tower and then tighten the screws into thethree storage holes in themiddle of the cover.
1
1 1
2
Item Description
1 Optics cover socket-head cap screws (3)
2 Storage holes
Figure 5-4: Optics Cover
6. Lift the cover straight up to remove it from the cytometer.
7. Store the optics cover and hex key in the original shipping container for the cytometer.

SpectraMax i3 Multi-Mode Detection Platform User Guide
92 5025027 A
Attaching the Imaging Cytometer to the Microplate Reader
Attaching the SpectraMax MiniMax Imaging Cytometer to the SpectraMax i3 Instrumentrequires a work area that is approximately 130 cm (51.2 in.) wide and 65 cm (25.6 in.) deep,preferably with access on all sides for lifting the instruments.If the SpectraMax i3 Instrument has previously been in use, remove any microplate ordetection cartridges from the instrument and install the transport locks on themicroplatedrawer and detection cartridge drawer. See Loading and Unloading Microplates on page 76,Removing a Detection Cartridge on page 82, and Installing the Transport Locks on page 161.
WARNING! LIFTING HAZARD. To prevent injury, use at least two people tolift the instrument.
This procedure requires the following tools and accessories:
Illustration Part Number Description
5024094 Hex key, 2.5 mm
5024095 Open-end wrench, 12 mm
5024986 Laser-interlock brackets (2)with machine screws (4)
Table 5-4: Required Tools and Accessories
Note: All packaging materials, including the optics-access cover and foam block,should be retained in case of any future transport needs. Do not use tools that candamage the packaging or the instrument.
CAUTION!When transporting the instrument, warranty claims are void if damageduring transport is caused by improper packing.
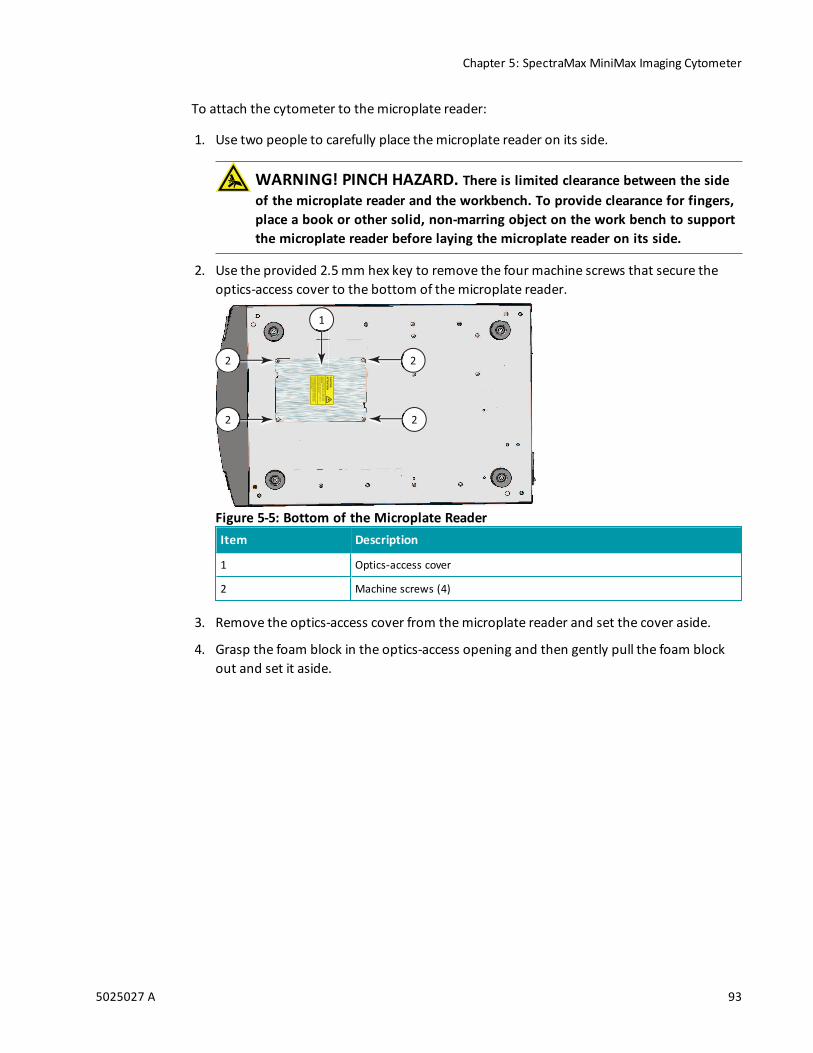
Chapter 5: SpectraMax MiniMax Imaging Cytometer
5025027 A 93
To attach the cytometer to themicroplate reader:
1. Use two people to carefully place themicroplate reader on its side.
WARNING! PINCH HAZARD. There is limited clearance between the sideof the microplate reader and the workbench. To provide clearance for fingers,place a book or other solid, non-marring object on the work bench to supportthe microplate reader before laying the microplate reader on its side.
2. Use the provided 2.5 mm hex key to remove the four machine screws that secure theoptics-access cover to the bottom of themicroplate reader.
2
CAUTION
ATTENTION
CLASS4INVISIBLEAND/ORVISIBLELASER
RADIATIONWHENOPENANDINTERLOCKS
DEFEATED.
AVOIDEYEORSKINEXPOSURETODIRECT
ORSCATTEREDRADIATION.
RAYONNEMENTLASERDECLASSE4-ENCAS
D'OUVERTUREEXPOSITIONDANGEREUSE
AURAYONNEMENTDIRECTOUDIFFUSDES
YEUXOUDELAPEAU
2
2
2
1
Item Description
1 Optics-access cover
2 Machine screws (4)
Figure 5-5: Bottom of the Microplate Reader
3. Remove the optics-access cover from themicroplate reader and set the cover aside.
4. Grasp the foam block in the optics-access opening and then gently pull the foam blockout and set it aside.

SpectraMax i3 Multi-Mode Detection Platform User Guide
94 5025027 A
5. Place one of the laser-interlock brackets over the optics-access opening with theinterlock tab on the bracket inserted into the corresponding alignment slot on thebottom of themicroplate reader.
2
1
4
3
3
2
1
Item Description
1 Laser-interlock brackets (2)
2 Alignment slots (2)
3 Interlock tabs (2)
4 Machine screws (4)
Figure 5-6: Optics-Access Opening Bracket
6. Use the provided 2.5 mm hex key and two of themachine screws provided with thebrackets to secure the laser-interlock bracket to the bottom of themicroplate reader.
7. Attach the other laser-interlock bracket with the interlock tab inserted into thecorresponding alignment slot, and then use the other two provided machine screws tosecure the bracket to the bottom of themicroplate reader.
8. Lightly press on the interlock tabs to make sure that they freely slide in and out of thealignment slots.
Note: The laser-interlock brackets are part of the hardware interlock that preventsthe laser module from turning on unless the cytometer is installed. For theinterlocks to work properly, the interlock tabs must be able to freely slide in andout of the alignment slots.

Chapter 5: SpectraMax MiniMax Imaging Cytometer
5025027 A 95
9. Use two people to carefully stand themicroplate reader upright.
10. Use two people to carefully lift themicroplate reader and hold it above the cytometer,being careful not to strike or otherwise damage the optics tower.
1
4 4
5 5
2 3
1
Item Description
1 Microplate reader feet (4)
2 Optics-access opening
3 Optics tower
4 Microplate reader foot openings (4)
5 Bolt heads (4)
Figure 5-7: Placing the Microplate Reader on the Cytometer
WARNING! PINCH HAZARD. There is limited clearance between thebottom of the microplate reader and the top of the cytometer. The top of thecytometer is beveled to help provide clearance for fingers.
SpectraMax i3 Multi-Mode Detection Platform User Guide
96 5025027 A
11. Lower themicroplate reader onto the cytometer, making sure that the optics tower fitsinto the optics-access opening and the feet on themicroplate reader fit into the footopenings on the cytometer.
12. Use your finger to apply slight upward pressure to one of the bolt heads beneath thecytometer, and then hand tighten the bolt. Use the provided 12 mm open-end wrenchto tighten the bolt until it is snug, but do not over tighten. Do the same to each of theother three bolts to secure the cytometer to themicroplate reader.
13. Store the packing materials, tools, optics-access cover, and foam block in the originalshipping container for the cytometer.
14. Remove the transport locks from the SpectraMax i3 Instrument. See Removing theTransport Locks on page 63.
Connecting the Cables
The power cords and USB cables connect to the ports on the back of the instrument.A power cord and USB cable connect themicroplate reader and the cytometer. A secondpower cord connects the cytometer to an external power source. Two USB cables connectfrom the cytometer to the acquisition computer to separately control the instrument andthe camera.The SpectraMax MiniMax Imaging Cytometer requires additional minimum computersystem specifications beyond those required for the SoftMax Pro Software. See ImagingCytometer Computer System Specifications on page 178.

Chapter 5: SpectraMax MiniMax Imaging Cytometer
5025027 A 97
This procedure requires the following accessories:
Illustration Part Number Description
5018968 AC power interconnection cord, 0.5 meter (1.5 foot), provided with thecytometer
5018965 USB interconnection cable, 0.9 meter (3 foot), provided with thecytometer
5025874 USB computer connection cable, 3 meter (9.8 foot), provided with thecytometer
VN 18S S01or VN 18F F0101
AC power cord, provided with the microplate reader
VZ 000 014 USB computer connection cable, 3 meter (9.8 foot), provided with themicroplate reader
5018636 SoftMax Pro Software with Product Key
Table 5-5: Required Accessories

SpectraMax i3 Multi-Mode Detection Platform User Guide
98 5025027 A
10
5
3
1
4
9
2
4
11
6
7
8
Item Description
1 Microplate reader USB port
2 Gas inlet quick-connect fitting
3 Microplate reader power port
4 Microplate reader fuse carrier
5 Power switch
6 Interconnect power port
7 Cytometer power port
8 Cytometer fuse carrier
9 Interconnect USB port
10 Cytometer USB port 1
11 Cytometer USB port 2
Figure 5-8: Power Switch, Fuses, and Connection Ports

Chapter 5: SpectraMax MiniMax Imaging Cytometer
5025027 A 99
To connect the cytometer cables:
1. Make sure that the instrument and host computer are placed on a dry, flat work areawith sufficient space for both devices and the required cables. To ensure adequateventilation and allow access for disconnecting power from the instrument, maintain a20 cm to 30 cm (7.9 in. to 11.8 in.) gap between the back of the instrument and the wall.
2. Make sure that the power switch on the back of themicroplate reader is in theOff position. See Turning the Instrument On and Off on page 74.
3. Connect one end of the shorter USB cable supplied with the cytometer to theinterconnect USB port labeled SpectraMax® System on the back of the cytometer, andthen connect the other end of the USB cable to themicroplate reader USB port on theback of themicroplate reader.
1
2
3
1 USB interconnection cable, 0.9 meter (3 foot), provided with the cytometer
2 USB computer connection cable, 1.8 meter (6 foot), provided with the cytometer
3 USB computer connection cable, 3 meter (9.8 foot), provided with the microplate reader
Figure 5-9: USB Cable Connections
4. Connect one end of the USB cable supplied with themicroplate reader to one of the USBports on the computer, and then connect the other end of the USB cable to the USB portlabeled COMPUTER USB 1 on the back of the cytometer.

SpectraMax i3 Multi-Mode Detection Platform User Guide
100 5025027 A
5. Connect one end of the longer USB cable supplied with the cytometer to a USB port onthe back of the computer, and then connect the other end of the USB cable to the USBport labeled COMPUTER USB 2 on the back of the cytometer.
The USB port labeled COMPUTER USB 2 is the connection for the camera. For bestresults, use the USB cable provided with the cytometer and use a USB 2.0, or later, porton the back of the computer that has its own USB bus.
6. Connect the short power cord supplied with the cytometer to themicroplate readerpower port on the back of themicroplate reader, and then connect the other end of thepower cord to the interconnect power port on the back of the cytometer. It might benecessary to remove the temporary warning label before connecting the power cord tothemicroplate reader.
7. Connect the power cord supplied with themicroplate reader to the cytometer powerport on the back of the cytometer, and then connect the other end of the power cord toa grounded electrical wall outlet.
8. Turn on the power to the host computer.
9. Install the SoftMax Pro Software on the computer. See the SoftMax Pro Software UserGuide.
Chapter 5: SpectraMax MiniMax Imaging Cytometer
5025027 A 101
Calibrating the Cytometer
When the SpectraMax MiniMax Imaging Cytometer is first installed, the well image needs tobe calibrated. This procedure can be performed only by trained Molecular Devicespersonnel.
Note: If you are installing the SpectraMax i3 Instrument at the same time, remove themicroplate reader transport locks before continuing with this procedure. SeeRemoving the Transport Locks on page 63.
About Whole-Cell ImagingWhole-cell imaging assays are cell-based, or object-based, rather than the single-pointmeasurements found in other types ofmicroplate reads. These types of assays can yieldmore biologically meaningful results that can discriminate the fluorescence associated withobjects, such as cells or beads, from the bulk solution within a microplate well.Themeasurement is primarily fluorescent with quantification of cell size, shape, area, andintensity. Label-free quantification is also supported through brightfield, transmitted lightimaging and visual inspection of the image. The camera resolution in theSpectraMax MiniMax Imaging Cytometer is sufficient to determine the approximate shape ofsmall 8micron objects, such as blood cells.For more information about whole-cell imaging, see Imaging Read Mode on page 53.

SpectraMax i3 Multi-Mode Detection Platform User Guide
102 5025027 A
Selecting the Light Source for Imaging
The SpectraMax MiniMax Imaging Cytometer captures images from the bottom of eachmicroplate well. You can choose to illuminate the sample with white transmitted light fromthe top of themicroplate using the Transmitted Light (TL) Detection Cartridge, or usefluorescent excitation from the bottom of themicroplate.
4
5
1
2
3
Item Description
1 Transmitted Light (TL) Detection Cartridge
2 Path of white light from the Transmitted Light (TL) Detection Cartridge
3 Path of fluorescent excitation
4 Light source for fluorescent excitation
5 Camera lens
Figure 5-10: Path of Selected Light Sources
To illuminate the sample from the top, you need to have the Transmitted Light (TL) DetectionCartridge installed in the detection cartridge drawer. See Transmitted Light (TL) DetectionCartridge on page 108.For best results with transmitted-light reads, use a microplate with no cover. A clear covercan be used, if required. For fluorescent reads, you can use a solid cover on themicroplate.SeeMicroplate Recommendations on page 107.
Note: You must choose either transmitted light illumination or fluorescent excitationfor acquiring images. You cannot use top and bottom illumination at the same time.

Chapter 5: SpectraMax MiniMax Imaging Cytometer
5025027 A 103
Optimizing Your Computer for Image Acquisition
Acquiring images requires a large portion of computer memory and resources. Make surethat your computer meets the requirements in the Imaging Cytometer Computer SystemSpecifications on page 178.Before starting an image acquisition, you must save the data file in a location with enoughcapacity for the image files. When you create a data file for an imaging experiment, theSoftMax Pro Software creates a folder with the same name as the data file. See the SoftMaxPro Software application help or user guide.Each acquired image file can be larger than 2megabytes. Acquiring the image of a single sitein each well of a 96-well microplate can generate 300megabytes of image data. A 384-wellmicroplate can generate 1 gigabyte of image data. Acquiring images ofmultiple sitesincreases the data-storage requirement. Molecular Devices recommends that you employ adata management system.For best results, save your data file on a secondary internal hard drive. You can use anexternal hard drive, but this can slow the data acquisition and is not recommended.Acquiring imaging files and saving them to a network location is not supported by MolecularDevices.Before starting an image acquisition, minimize the demands on computer memory andresources by turning off all other programs. When the SoftMax Pro Software has limitedaccess to computer memory and resources, image acquisition can take a long time. In somecases, images of some of the wells can be lost.For optimum results, turn off all sleep and hibernation settings for the hard disk, the CPU,and the USB ports. Also, disable automatic Windows Updates. You can updateWindowsmanually when the instrument is not being used by the software.You can set these options in Windows Control Panel. See Required Computer Settings onpage 104.

SpectraMax i3 Multi-Mode Detection Platform User Guide
104 5025027 A
Required Computer Settings
Allowing your computer to hibernate or turn off during data acquisition can interrupt thetransfer of data from the instrument to the software and result in data loss.For optimum results, turn off all sleep and hibernation settings for the hard disk, the CPU,and the USB ports. Also, disable automatic Windows Updates. You can updateWindowsmanually when the instrument is not being used by the software.You can set these options in Windows Control Panel.
1. Open Control Panel.
2. Click Hardware and Sound.
3. Under Power Options, click Change when the computer sleeps.
4. Click Change advanced power settings.
5. In the Power Options dialog, set Hard disk > Turn off hard disk after to Never.
6. Set Sleep > Sleep after to Never.
7. Set Sleep > Hibernate after to Never.
8. Set USB settings > USB selective suspend setting to Disabled.
9. Click OK.
10. Return to the home screen of Control Panel.
11. Click System and Security.
12. UnderWindows Update, click Turn automatic updating on or off.
13. Under Important Updates, make sure that Install updates automatically is not selected.Any of the other options can be selected.
14. Click OK.
15. Close Control Panel.

Chapter 5: SpectraMax MiniMax Imaging Cytometer
5025027 A 105
Using the Imaging CytometerBefore operating the SpectraMax MiniMax Imaging Cytometer or performing maintenanceoperations, make sure that you are familiar with the safety information in this guide. SeeSafety Information on page 7.For information on controlling the instrument with the software, see the SoftMax ProSoftware application help or user guide.The key pad on the front panel of the SpectraMax i3Multi-Mode Detection Platform givesyou hardware-based controls for opening and closing the detection cartridge drawer and themicroplate drawer. See Using the Instrument on page 71.The front panel of the SpectraMax MiniMax Imaging Cytometer has LED status indicatorsthat provide information about instrument status. See Cytometer Status LEDs on page 106.
1 2
3
4
5
Item Description
1 Key pad
2 Microplate reader status LEDs
3 Detection cartridge drawer
4 Microplate drawer
5 Cytometer status LEDs
Figure 5-11: The SpectraMax i3 Instrument with the SpectraMax MiniMax ImagingCytometer
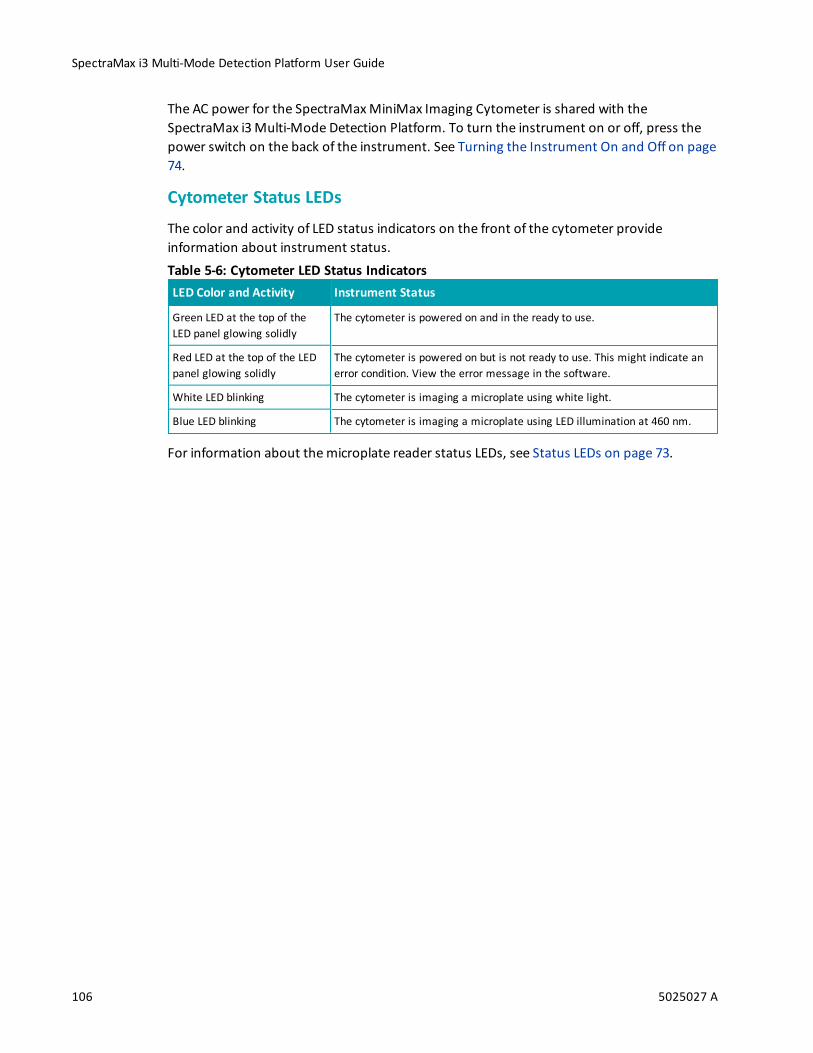
SpectraMax i3 Multi-Mode Detection Platform User Guide
106 5025027 A
The AC power for the SpectraMax MiniMax Imaging Cytometer is shared with theSpectraMax i3Multi-Mode Detection Platform. To turn the instrument on or off, press thepower switch on the back of the instrument. See Turning the Instrument On and Off on page74.
Cytometer Status LEDs
The color and activity of LED status indicators on the front of the cytometer provideinformation about instrument status.
LED Color and Activity Instrument Status
Green LED at the top of theLED panel glowing solidly
The cytometer is powered on and in the ready to use.
Red LED at the top of the LEDpanel glowing solidly
The cytometer is powered on but is not ready to use. This might indicate anerror condition. View the error message in the software.
White LED blinking The cytometer is imaging a microplate using white light.
Blue LED blinking The cytometer is imaging a microplate using LED illumination at 460 nm.
Table 5-6: Cytometer LED Status Indicators
For information about themicroplate reader status LEDs, see Status LEDs on page 73.
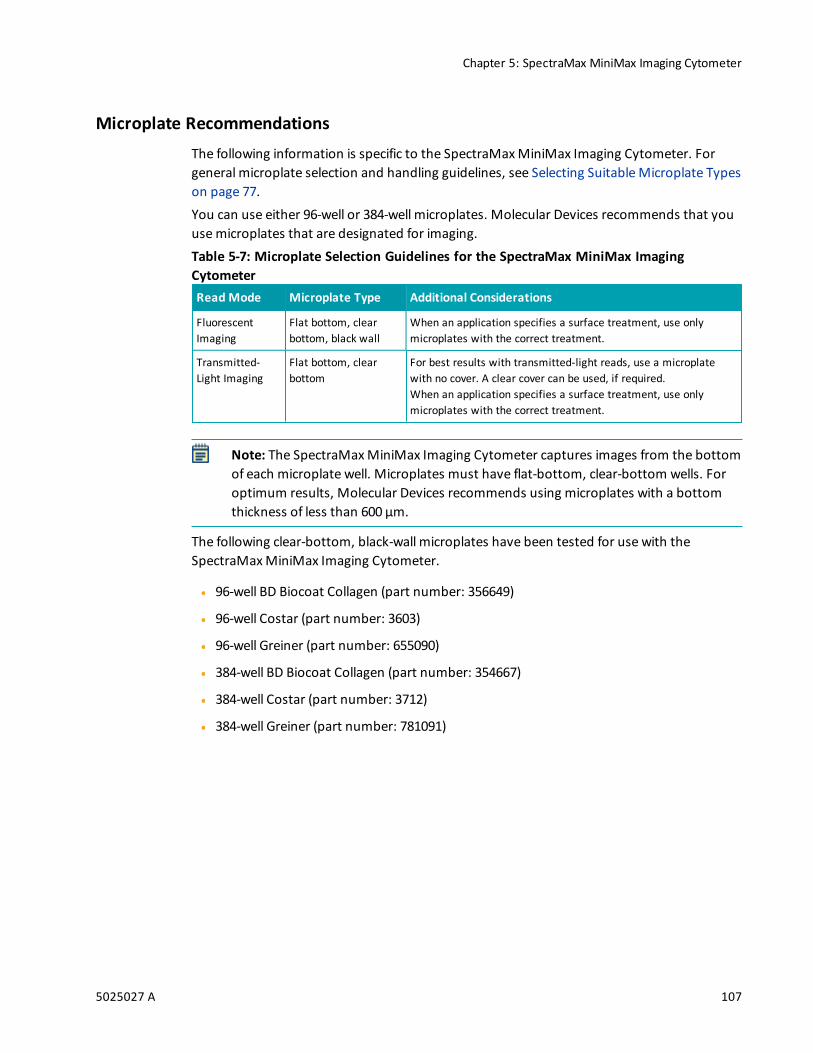
Chapter 5: SpectraMax MiniMax Imaging Cytometer
5025027 A 107
Microplate RecommendationsThe following information is specific to the SpectraMax MiniMax Imaging Cytometer. Forgeneral microplate selection and handling guidelines, see Selecting SuitableMicroplate Typeson page 77.You can use either 96-well or 384-well microplates. Molecular Devices recommends that youusemicroplates that are designated for imaging.
Read Mode Microplate Type Additional Considerations
FluorescentImaging
Flat bottom, clearbottom, black wall
When an application specifies a surface treatment, use onlymicroplates with the correct treatment.
Transmitted-Light Imaging
Flat bottom, clearbottom
For best results with transmitted-light reads, use a microplatewith no cover. A clear cover can be used, if required.When an application specifies a surface treatment, use onlymicroplates with the correct treatment.
Table 5-7: Microplate Selection Guidelines for the SpectraMax MiniMax ImagingCytometer
Note: The SpectraMax MiniMax Imaging Cytometer captures images from the bottomof each microplate well. Microplates must have flat-bottom, clear-bottom wells. Foroptimum results, Molecular Devices recommends using microplates with a bottomthickness of less than 600 μm.
The following clear-bottom, black-wall microplates have been tested for use with theSpectraMax MiniMax Imaging Cytometer.
96-well BD Biocoat Collagen (part number: 356649)
96-well Costar (part number: 3603)
96-well Greiner (part number: 655090)
384-well BD Biocoat Collagen (part number: 354667)
384-well Costar (part number: 3712)
384-well Greiner (part number: 781091)

SpectraMax i3 Multi-Mode Detection Platform User Guide
108 5025027 A
Transmitted Light (TL) Detection CartridgeTo perform brightfield, transmitted-light imaging, you must install the SpectraMax i3Platform Transmitted Light (TL) Detection Cartridge in the detection cartridge drawer. TheTransmitted Light (TL) Detection Cartridge provides white LED illumination for transmitted-light imaging when used in conjunction with the SpectraMax MiniMax Imaging Cytometer.See Selecting the Light Source for Imaging on page 102.The read capabilities of the SpectraMax i3 Instrument can be upgraded with user-installabledetection cartridges. A detection cartridge contains its own independent light source, optics,and electrical components needed to perform specific read modes for specific applications.The Transmitted Light (TL) Detection Cartridge occupies one (1) slot in the detection cartridgedrawer.For installation instructions, see Installing a Detection Cartridge on page 78.You can create protocols that use the Transmitted Light (TL) Detection Cartridge in theSoftMax Pro Software. For information on creating protocols, see “Creating a Protocol” inthe SoftMax Pro Software application help or user guide.
Measurement Specifications
The specifications for measurements using the Transmitted Light (TL) Detection Cartridge areshown in the following table.
Item Description
Detection cartridge name Transmitted Light (TL) Detection Cartridge
Short name TL
Part number 5022671
Weight 1.5 lbs (0.7 kg)
Read modes Imaging
Type Transmitted light
Number of slots 1
Light source Ultra high power LED
Wavelength range White light, brightfield
Table 5-8: Measurement Specification for Transmitted Light (TL) Detection Cartridge

Chapter 5: SpectraMax MiniMax Imaging Cytometer
5025027 A 109
Cytometer Maintenance and TroubleshootingPerform only themaintenance described in this guide. Maintenance other than thatspecified in this guide should be performed only by Molecular Devices service engineers. SeeObtaining Support on page 171.Before operating the instrument or performing maintenance operations, make sure that youare familiar with the safety information in this guide. See Safety Information on page 7.The following topics describemaintenance and troubleshooting procedures that can beperformed by users to ensure optimum operation of the cytometer.
Replacing Fuses in the Cytometer on page 109
Packing the Cytometer for Storage or Service on page 112
For reader maintenance and troubleshooting procedures, seeMaintenance andTroubleshooting on page 155.
WARNING! Service or maintenance procedures other than those specified in thisguide can be performed only by trained service engineers. When service isrequired, contact a Molecular Devices service engineer.
Replacing Fuses in the Cytometer
Fuses burn out occasionally and must be replaced.If the instrument does not seem to be getting power after switching it on, check to seewhether the supplied power cord is securely plugged into a functioning power outlet and tothe power port at the rear of the instrument. Also, check that the power interconnectioncable is securely connected to themicroplate reader and to the cytometer.If the power failed while the instrument was on, check that the power cord is not loose ordisconnected and that power to the power outlet is functioning properly.If these checks fail to remedy the loss of power, replace the fuses. You can obtainreplacement fuses from Molecular Devices. For fuse specifications and part numbers, seePhysical Specifications on page 179.
CAUTION! Do not touch or loosen any screws or parts other than those specificallydesignated in the instructions. Doing so could causemisalignment and possibly voidthe warranty.
The fuses are located in the fuse carrier on the back of the instrument.

SpectraMax i3 Multi-Mode Detection Platform User Guide
110 5025027 A
10
5
3
1
4
9
2
4
11
6
7
8
Item Description
1 Microplate reader USB port
2 Gas inlet quick-connect fitting
3 Microplate reader power port
4 Microplate reader fuse carrier
5 Power switch
6 Interconnect power port
7 Cytometer power port
8 Cytometer fuse carrier
9 Interconnect USB port
10 Cytometer USB port 1
11 Cytometer USB port 2
Figure 5-12: Power Switch, Fuses, and Connection Ports
The SpectraMax i3Multi-Mode Detection Platform holds another pair of fuses in a separatefuse carrier. See Replacing Fuses on page 158.

Chapter 5: SpectraMax MiniMax Imaging Cytometer
5025027 A 111
To replace the fuses in the cytometer:
WARNING! HIGH VOLTAGE Always turn the power switch off and disconnectthe power cord from the main power source before performing any maintenanceprocedure that requires removal of any panel or cover or disassembly of anyinterior instrument component.
1. Switch the power switch on the back of the instrument to the off position.
2. Unplug the power cord from the cytometer power port.
3. Gently press on the carrier-release tab and then pull the fuse carrier to remove it fromthe instrument.
21
Item Description
1 Fuse carrier
2 Carrier-release tab
Figure 5-13: Releasing the fuse carrier
4. Gently pull the old fuses from the carrier by hand.
5. Gently place new fuses into the carrier by hand.
6. Replace the fuse carrier.
7. Plug the power cord into the power port.
8. Turn on power to the instrument.
Note: If the instrument still does not power on after changing the fuses, contactMolecular Devices technical support.

SpectraMax i3 Multi-Mode Detection Platform User Guide
112 5025027 A
Packing the Cytometer for Storage or Service
To minimize the possibility of damage during storage or shipment, the cytometer should berepacked only in the original packaging materials. Correctly repacking the instrumentincludes following appropriate decontamination procedures and replacing the red machinescrews and the optics-access cover that protect the optical components during shipping.
CAUTION!When transporting the instrument, warranty claims are void if damageduring transport is caused by improper packing.
The cytometer should be stored in a dry, dust-free, environmentally controlled area. Formore information about acceptable storage environments, see Physical Specifications onpage 179.Packing up the cytometer includes the following procedures:
Disconnect the instrument cables. See Disconnecting the Cytometer Cables on page 113.
Remove the cytometer from the bottom of themicroplate reader. See Removing theCytometer from theMicroplate Reader on page 115.
Replace the red machine screws and the optics cover that protect the opticalcomponents during shipping. See Attaching the Shipping Protections on page 119.
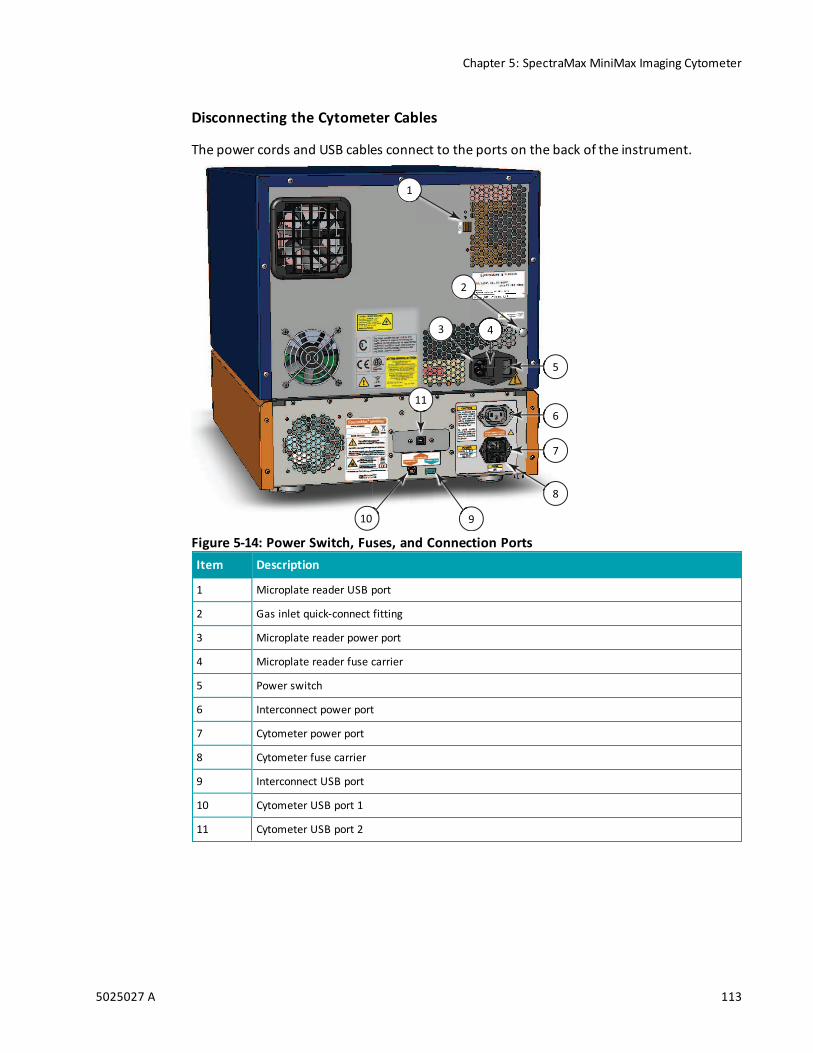
Chapter 5: SpectraMax MiniMax Imaging Cytometer
5025027 A 113
Disconnecting the Cytometer Cables
The power cords and USB cables connect to the ports on the back of the instrument.
10
5
3
1
4
9
2
4
11
6
7
8
Item Description
1 Microplate reader USB port
2 Gas inlet quick-connect fitting
3 Microplate reader power port
4 Microplate reader fuse carrier
5 Power switch
6 Interconnect power port
7 Cytometer power port
8 Cytometer fuse carrier
9 Interconnect USB port
10 Cytometer USB port 1
11 Cytometer USB port 2
Figure 5-14: Power Switch, Fuses, and Connection Ports

SpectraMax i3 Multi-Mode Detection Platform User Guide
114 5025027 A
To disconnect the cytometer cables:
1. Make sure that the SoftMax Pro Software is not running.
2. Turn off the connected computer.
3. Switch the power switch on the back of the instrument to the off position.
4. Unplug the power cord from the cytometer power port on the back of the cytometer,and then unplug the power cord from the grounded electrical wall outlet.
5. Unplug the short power cord from the interconnect power port on the back of thecytometer, and then unplug the short power cord from themicroplate reader powerport on the back of themicroplate reader.
6. Disconnect the USB cable from the USB port labeled COMPUTER USB 2 on the back ofthe cytometer, and then disconnect the USB cable from the USB port on the computer.
7. Disconnect the USB cable from the USB port labeled COMPUTER USB 1 on the back ofthe cytometer, and then disconnect the USB cable from the USB port on the computer.
8. Disconnect the short USB cable from the interconnect USB port labeled SpectraMax®System on the back of the cytometer, and then disconnect the USB cable from themicroplate reader USB port on the back of themicroplate reader.
9. Store the short power cord, the short USB cable, and one of the longer USB cables in theoriginal shipping container for the cytometer.
The longer power cord and one of the longer USB cables can be reattached to or stored withthemicroplate reader.
For information on reattaching these cables to themicroplate reader, see Connectingthe Instrument Cables on page 66.
For information on storing these cables with themicroplate reader, see Disconnectingthe Instrument Cables on page 165.

Chapter 5: SpectraMax MiniMax Imaging Cytometer
5025027 A 115
Removing the Cytometer from the Microplate Reader
Removing the cytometer from themicroplate reader requires a work area that isapproximately 130 cm (51.2 in.) wide and 65 cm (25.6 in.) deep, preferably with access on allsides for lifting the instruments.
WARNING! LIFTING HAZARD. To prevent injury, use at least two people tolift the instrument.
This procedure requires the following tools and accessories:
Part Number Item
5024094 Hex key, 2.5 mm
5024095 Open-end wrench, 12 mm
MK 113 700 Optics-access foam block
MG 115 500 Optics-access cover
Table 5-9: Required Tools and Accessories
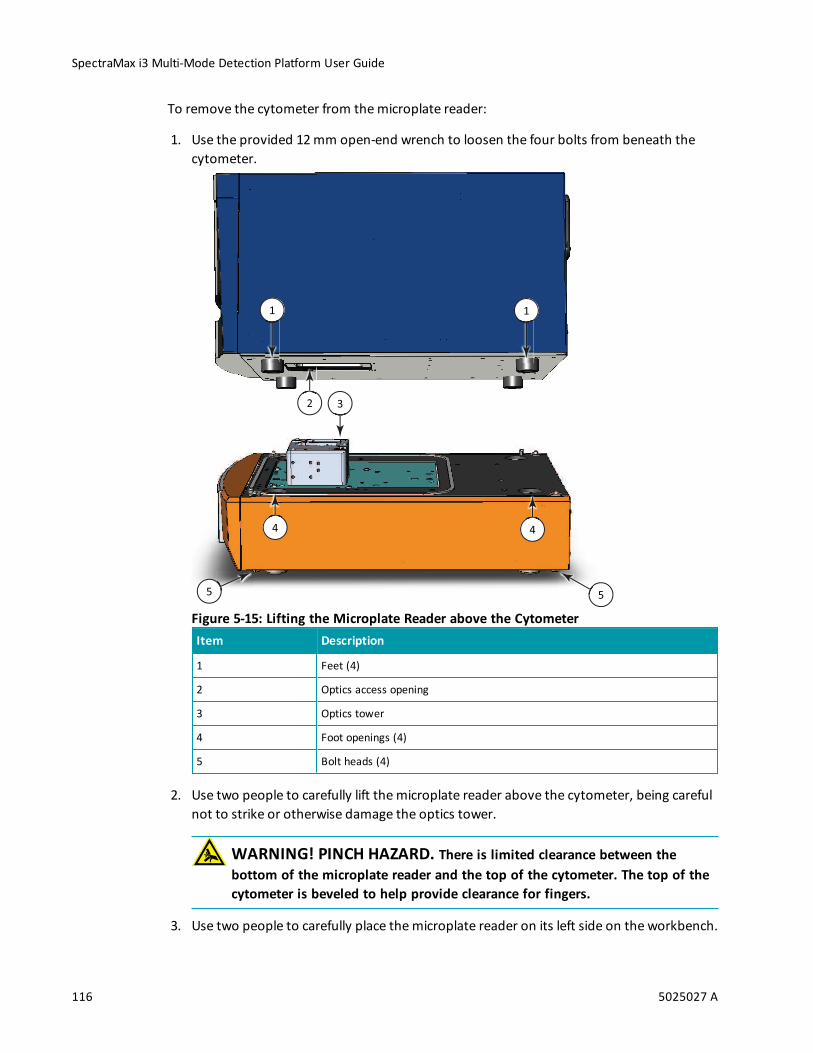
SpectraMax i3 Multi-Mode Detection Platform User Guide
116 5025027 A
To remove the cytometer from themicroplate reader:
1. Use the provided 12 mm open-end wrench to loosen the four bolts from beneath thecytometer.
1
4 4
5 5
2 3
1
Item Description
1 Feet (4)
2 Optics access opening
3 Optics tower
4 Foot openings (4)
5 Bolt heads (4)
Figure 5-15: Lifting the Microplate Reader above the Cytometer
2. Use two people to carefully lift themicroplate reader above the cytometer, being carefulnot to strike or otherwise damage the optics tower.
WARNING! PINCH HAZARD. There is limited clearance between thebottom of the microplate reader and the top of the cytometer. The top of thecytometer is beveled to help provide clearance for fingers.
3. Use two people to carefully place themicroplate reader on its left side on the workbench.
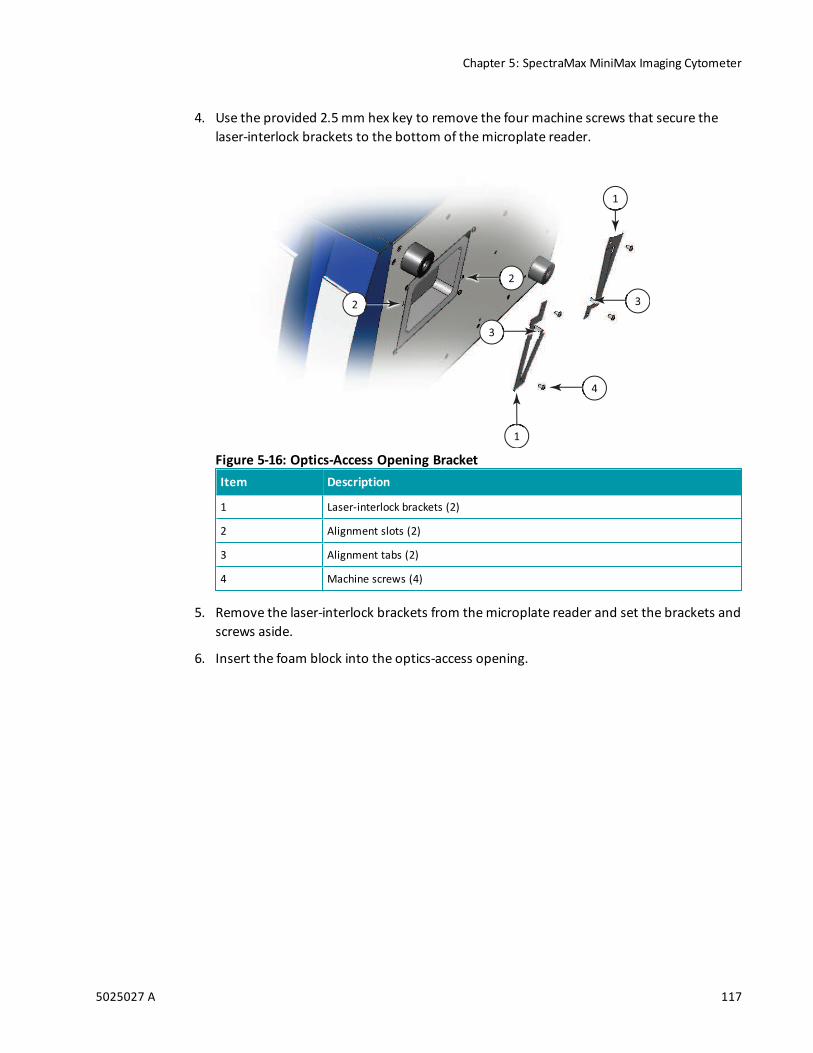
Chapter 5: SpectraMax MiniMax Imaging Cytometer
5025027 A 117
4. Use the provided 2.5 mm hex key to remove the four machine screws that secure thelaser-interlock brackets to the bottom of themicroplate reader.
2
1
4
3
3
2
1
Item Description
1 Laser-interlock brackets (2)
2 Alignment slots (2)
3 Alignment tabs (2)
4 Machine screws (4)
Figure 5-16: Optics-Access Opening Bracket
5. Remove the laser-interlock brackets from themicroplate reader and set the brackets andscrews aside.
6. Insert the foam block into the optics-access opening.

SpectraMax i3 Multi-Mode Detection Platform User Guide
118 5025027 A
7. Place the optics-access cover over the optics-access opening with the alignment tabs onthe cover inserted into the alignment slots on the bottom of themicroplate reader.
2
CAUTION
ATTENTION
CLASS4INVISIBLEAND/ORVISIBLELASER
RADIATIONWHENOPENANDINTERLOCKS
DEFEATED.
AVOIDEYEORSKINEXPOSURETODIRECT
ORSCATTEREDRADIATION.
RAYONNEMENTLASERDECLASSE4-ENCAS
D'OUVERTUREEXPOSITIONDANGEREUSE
AURAYONNEMENTDIRECTOUDIFFUSDES
YEUXOUDELAPEAU
2
2
2
1
Item Description
1 Optics-access cover
2 Machine screws (4)
Figure 5-17: Bottom of the Microplate Reader
8. Use the provided 2.5 mm hex key and the four original machine screws to secure theoptics-access cover to the bottom of themicroplate reader.
9. Use two people to carefully stand themicroplate reader upright.
10. Store the tools and laser-interlock brackets in the original shipping container for thecytometer.
WARNING! LASER LIGHT. The optics-access cover on the bottom of theSpectraMax i3 Multi-Mode Detection Platform has a hardware interlock thatprevents the laser module from turning on, unless the cover is in place. Theinstalled cover acts as the protective housing.

Chapter 5: SpectraMax MiniMax Imaging Cytometer
5025027 A 119
Attaching the Shipping Protections
To prevent damage during shipping, four (4) purple socket-head capscrews secure the opticsplate on the top of the cytometer, and a cover protects the optical components in the opticstower.
1
2
1
1
1
Item Description
1 Optics plate socket-head capscrews (4)
2 Optics cover
Figure 5-18: Optics Protections for Shipping
CAUTION! Never touch any of the optic mirrors, lenses, filters, or cables. The opticsare extremely delicate, and critical to the function of the instrument.
This procedure requires the following tool:
Part Number Item
5025258 Hex key, 3.0 mm
Table 5-10: Required Tool

SpectraMax i3 Multi-Mode Detection Platform User Guide
120 5025027 A
To attach the shipping protections to the cytometer:
1. Carefully place the protective cover onto the optics tower with the foam block resting ontop of the lenses.
1
2
Item Description
1 Optics cover
2 Optics tower
Figure 5-19: Placing the Optics Cover
2. Use the provided 3.0 mm hex key to remove the three (3) purple socket-head cap screwsfrom their storage holes in themiddle of the optics cover.
1
1 1
2
Item Description
1 Optics cover socket-head cap screws in their transport locations
2 Storage holes
Figure 5-20: Optics Cover (top view)
3. Tighten the three (3) purple socket-head cap screws into their transport locations tosecure the cover to the optics tower.

Chapter 5: SpectraMax MiniMax Imaging Cytometer
5025027 A 121
4. Use the provided 3.0 mm hex key to remove one of the purple socket-head cap screwsfrom its storage location in the optics plate.
1
2
3
Item Description
1 Optics plate machine screw
2 Storage location (indicated by two inscribed dots)
3 Transport location (indicated by a single inscribed dot)
Figure 5-21: Optics Plate Machine Screw
5. Insert the purple socket-head cap screw in the adjacent transport location and use theprovided 3.0 mm hex key to tighten the screw to secure the optics plate. You might needto lightly press down the optics plate as you tighten the screws.
6. Use the provided 3.0 mm hex key to remove the other three purple socket-head capscrews from their storage locations and tighten them in their adjacent transportlocations to secure the optics plate.
7. Repackage the cytometer and its tools and accessories in the original shipping containerfor the cytometer.
8. Verify that all the tools and accessories are included in the package. See Contents of theCytometer Package on page 86.
If you are also packing the SpectraMax i3 Instrument, see Packing the Instrument on page166.

SpectraMax i3 Multi-Mode Detection Platform User Guide
122 5025027 A

Chapter 6: Available Detection Cartridges
5025027 A 123
Chapter 6: Available Detection Cartridges
The read capabilities of the SpectraMax i3 Instrument can be upgraded with user-installabledetection cartridges. A detection cartridge contains its own independent light source, optics,and electrical components needed to perform specific read modes for specific applications.Application notes with specific application protocol suggestions can be found in theInformation Center and the Knowledge Base on theMolecular Devices web site atwww.moleculardevices.com.
Note: For the SpectraMax i3Multi-Mode Detection Platform, the detection cartridgescan be used for top reads.
For information about the supported detection cartridges, see the following topics:
AlphaScreen Detection Cartridges , see page 124
Cisbio HTRF Detection Cartridge on page 127
Time Resolved Fluorescence (TRF) Detection Cartridge, see page 130
Fluorescence Intensity (FI) Detection Cartridges, see page 133
Fluorescence Intensity (FI) GeneBLAzer Detection Cartridge, see page 136
Fluorescence Polarization (FP) Detection Cartridge, see page 139
Glow Luminescence (LUM) Detection Cartridges, see page 141
Dual Color Luminescence (LUM) (BRET2) Detection Cartridge, see page 144
Dual Color Luminescence (LUM) (Chroma-Glo) Detection Cartridge, see page 149
SpectraMax i3 Multi-Mode Detection Platform User Guide
124 5025027 A
AlphaScreen Detection CartridgesThe AlphaScreen® Detection Cartridges use a 680 nm laser diode to provide a sensitivereading system for AlphaScreen assays. In addition, a patent-pending design that isolateseach well enables optimal performance for AlphaScreen assays. The detection cartridges alsocapture the Europium emission line of AlphaLISA®.The following AlphaScreen Detection Cartridges are available:
AlphaScreen 384 Std Detection Cartridge
AlphaScreen 384 HTS Detection Cartridge
AlphaScreen 1536 HTS Detection Cartridge
The read capabilities of the SpectraMax i3 Instrument can be upgraded with user-installabledetection cartridges. A detection cartridge contains its own independent light source, optics,and electrical components needed to perform specific read modes for specific applications.Each AlphaScreen Detection Cartridge occupies one (1) slot in the detection cartridge drawer.For installation instructions, see Installing a Detection Cartridge on page 78.The AlphaScreen Detection Cartridges can perform the following read types:
End Point, see Endpoint Read Type on page 20.
Kinetic, see Kinetic Read Type on page 20.
Well Scan, seeWell Scan Read Type on page 21.
You can create protocols that use the AlphaScreen Detection Cartridges in the SoftMax ProSoftware. For information on creating protocols, see “Creating a Protocol” in the SoftMaxPro Software application help or user guide.ALPHASCREEN and ALPHALISA are registered trademarks of PerkinElmer, Inc.

Chapter 6: Available Detection Cartridges
5025027 A 125
About AlphaScreen
ALPHA stands for Amplified Luminescent Proximity Homogeneous Assay. AlphaScreen is abead-based chemistry used to study molecular interactions between moieties A and B, forexample. When a biological interaction between A and B brings beads—coated with A and B,respectively—together, a cascade of chemical reactions acts to produce a greatly amplifiedsignal.An AlphaScreen measurement includes a light pulse, by turning on the laser diode for aspecified time, turning off the laser diode, followed by themeasurement of the AlphaScreensignal, as specified in the protocol parameters.
Parameter Value Comment
Excitation time 40 ms The period when the sample is exposed to the laser.
Integration time 80 ms The period when the signal is read from the sample.
Table 6-1: AlphaScreen Timing Parameters
For more information about AlphaScreen, see AlphaScreen Read Mode on page 49.
Microplate Recommendations
The following information is specific to this detection cartridge. For general microplateselection and handling guidelines, see Selecting SuitableMicroplate Types on page 77.
Read Mode MicroplateType
Additional Considerations
AlphaScreen(ALPHA)
Solid white When an application specifies a surface treatment, use only microplates withthe correct treatment.White plates are recommended for reading AlphaScreen (such as, Optiplate-384 white opaque, Perkin Elmer #6007290). Black plates absorb light and leadto reduced signals.
Table 6-2: Microplate Selection Guidelines for the AlphaScreen Detection Cartridge

SpectraMax i3 Multi-Mode Detection Platform User Guide
126 5025027 A
Measurement Specifications
The specifications for measurements using the AlphaScreen Detection Cartridges are shownin the following table.
Item Description Description Description
Detectioncartridgename
AlphaScreen 384 StdDetection Cartridge
AlphaScreen 384 HTSDetection Cartridge
AlphaScreen 1536 HTSDetection Cartridge
Short name ALPHA 384 Std ALPHA 384 HTS ALPHA 1536 HTS
Part number 0200-7017 0200-7018 0200-7019
Weight 1.5 lbs (0.7 kg) 1.5 lbs (0.7 kg) 1.5 lbs (0.7 kg)
Microplateformats
Compatible with 6, 12, 24, 48,96, and 384-well microplates.
Compatible with 6, 12, 24, 48,96, and 384-well microplates.
Compatible with 6, 12, 24, 48,96, 384, 1536-wellmicroplates.
Read Mode AlphaScreen AlphaScreen AlphaScreen
Type Single emission Single emission Single emission
Number ofslots
1 1 1
Light source Laser diode (1 watt) Laser diode (1 watt) Laser diode (1 watt)
Filter Set EX: 680EM: 570-100
EX: 680EM: 570-100
EX: 680EM: 570-100
Labels AlphaScreen reagents andassay kits
AlphaScreen reagents andassay kits
AlphaScreen and AlphaLISAreagents and assay kits
Detectionlimit*
384-well (2 µl)<100 amol/well
384-well (25 µl)<100 amol/well
NA
Table 6-3: Measurement Specifications for AlphaScreen Detection Cartridges
*AlphaScreen detection limit <100 amol of biotinylated-LCK-P peptide, 25 µL/well in 384-well plate.AlphaScreen detection limit of biotinylated-LCK-P peptide was determined with 3 x SD over backgroundmethod using AlphaScreen Phosphotyrosine (PT66) Assay Kit (Cat. No. 6760602C). Serial dilutions weremade into assay buffer by diluting 10 nMb-LCK-P reaction mix containing Acceptor and Donor beads.Measurement was performed after a 1 hour incubation.

Chapter 6: Available Detection Cartridges
5025027 A 127
Cisbio HTRF Detection CartridgeThe Cisbio HTRF® Detection Cartridge uses a high-energy Xenon flash lamp for sensitivereading of HTRF reagents. In addition, the standard dual-emission design gives themostaccurate results in short overall read time. This detection cartridge enables time-resolvedfluorescence read modes for europium cryptate and europium acceptors.The fluorescence ratio associated with the HTRF readout is a correction method developedby Cisbio and covered by the US patent 5,527,684 and its foreign equivalents, for whichCisbio has granted a license to Molecular Devices. Its application is strictly limited to the useof HTRF reagents and technology, excluding any other TR-FRET technologies such as IMAPTR-FRET calculations of acceptor to donor ratios.The read capabilities of the SpectraMax i3 Instrument can be upgraded with user-installabledetection cartridges. A detection cartridge contains its own independent light source, optics,and electrical components needed to perform specific read modes for specific applications.The Cisbio HTRF Detection Cartridge is a dual-emission detection cartridge and occupies two(2) slots in the detection cartridge drawer.For installation instructions, see Installing a Detection Cartridge on page 78.The Cisbio HTRF Detection Cartridges can perform the following read types:
End Point, see Endpoint Read Type on page 20.
Kinetic, see Kinetic Read Type on page 20.
Well Scan, seeWell Scan Read Type on page 21.
You can create protocols that use the Cisbio HTRF Detection Cartridges in the SoftMax ProSoftware. For information on creating protocols, see “Creating a Protocol” in the SoftMaxPro Software application help or user guide.HTRF is a registered trademark of Cisbio Bioassays.

SpectraMax i3 Multi-Mode Detection Platform User Guide
128 5025027 A
About Homogeneous Time-Resolved Fluorescence
Homogeneous Time-Resolved Fluorescence (HTRF) is a measurement technique based onfluorescence resonance energy transfer (FRET) using the advantages of time-resolvedfluorescence (TRF) reading.The Cisbio HTRF Detection Cartridge uses a Xenon flash lamp. The excitation filter selectswavelengths suitable for the excitation of Europium cryptates below 330 nm. Emission filtersdetect signal for Europium cryptate (616 nm) and typical Europium acceptor labels (665 nm).The Cisbio HTRF Detection Cartridge provides optimal performance for key applications fordrug discovery, bioprocess development, and others.
GPCR Assays
Cytokine Assays
cAMP Quantitation
Human mAb Screening
Kinase Assays
For more information, see HTRF Read Mode on page 41.
Microplate Recommendations
The following information is specific to this detection cartridge. For general microplateselection and handling guidelines, see Selecting SuitableMicroplate Types on page 77.
Read Mode MicroplateType
Additional Considerations
Time-Resolved FluorescenceResonance Energy Transfer(TR-FRET)
Solid white When an application specifies a surface treatment, useonly microplates with the correct treatment.
Table 6-4: Microplate Selection Guidelines for the Cisbio HTRF Detection Cartridge

Chapter 6: Available Detection Cartridges
5025027 A 129
Measurement Specifications
The specifications for measurements using the Cisbio HTRF Detection Cartridge are shown inthe following table.
Item Description
Detection cartridge name Cisbio HTRF Detection Cartridge
Short name HTRF
Part number 0200-7011
Weight 2.6 lbs (1.2 kg)
Read mode Time-Resolved Fluorescence Resonance Energy Transfer(TR-FRET)
Type Dual emission
Number of slots 2
Light source Xenon Flash Lamp
Filter set EX: HTRFEM1: 616-10EM2: 665-10
Labels Europium cryptate, Europium acceptors
Applications HTRF certified by Cisbio Bioassays
Table 6-5: Measurement Specification for Cisbio HTRF Detection Cartridge

SpectraMax i3 Multi-Mode Detection Platform User Guide
130 5025027 A
Time Resolved Fluorescence (TRF) Detection CartridgeThe Time Resolved Fluorescence (TRF) Detection Cartridge enables time-resolvedfluorescence read modes for Europium and Samarium. It is ideal for protein interaction,GPCR, and enzyme activity applications.The read capabilities of the SpectraMax i3 Instrument can be upgraded with user-installabledetection cartridges. A detection cartridge contains its own independent light source, optics,and electrical components needed to perform specific read modes for specific applications.The Time Resolved Fluorescence (TRF) Detection Cartridge occupies one (1) slot in thedetection cartridge drawer.For installation instructions, see Installing a Detection Cartridge on page 78.The Time Resolved Fluorescence (TRF) Detection Cartridge can perform the following readtypes:
End Point, see Endpoint Read Type on page 20.
Kinetic, see Kinetic Read Type on page 20.
Well Scan, seeWell Scan Read Type on page 21.
Well scan is not available for dual-label assays.You can create protocols that use the Time Resolved Fluorescence (TRF) Detection Cartridgein the SoftMax Pro Software. For information on creating protocols, see “Creating aProtocol” in the SoftMax Pro Software application help or user guide.

Chapter 6: Available Detection Cartridges
5025027 A 131
About Time-Resolved Fluorescence
Time-resolved fluorescence (TRF) is a measurement technique that depends on threecharacteristics that lead to better discrimination between the specific signal, proportional tothe amount of label, and the unspecific fluorescence resulting from background andcompound interference:
Pulsed excitation light sources
Time-gated electronics faster than the fluorescence lifetime
Labels with prolonged fluorescence lifetime
The time-gating electronics introduce a delay between the cut off of each light pulse and thestart of signal accumulation. During the delay, the unspecific fluorescence (caused by testcompounds, assay reagents, and themicroplate) vanishes while only a small portion of thespecific fluorescence from the label is sacrificed. Enough of the specific signal remains duringthe decay period with the added benefit of reduced background.The Time Resolved Fluorescence (TRF) Detection Cartridge uses an ultraviolet LED that emitsin the range between 350 nm and 380 nm for excitation of Europium chelates, and comesequipped with emission filters for both europium and samarium. This enables single-labeleuropium and samarium assays as well as dual-label assays involving both europium andsamarium to be run. SeeMeasurement Specifications on page 132.
Note: Europium cryptate and terbium require excitation wavelengths below 330 nmand cannot bemeasured with this detection cartridge.
For more information about time-resolved fluorescence, see Time-Resolved FluorescenceRead Mode on page 36.
Microplate Recommendations
The following information is specific to this detection cartridge. For general microplateselection and handling guidelines, see Selecting SuitableMicroplate Types on page 77.
Read Mode MicroplateType
Additional Considerations
Time-ResolvedFluorescence (TRF)
Solid white When an application specifies a surface treatment, use onlymicroplates with the correct treatment.
Table 6-6: Microplate Selection Guidelines for the Time Resolved Fluorescence (TRF)Detection Cartridge

SpectraMax i3 Multi-Mode Detection Platform User Guide
132 5025027 A
Measurement Specifications
The specifications for measurements using the Time Resolved Fluorescence (TRF) DetectionCartridge are shown in the following table.
Item Description
Detection cartridge name Time Resolved Fluorescence (TRF) Detection Cartridge
Short name TRF-EUSA
Part number 0200-0723
Weight 1.5 lbs (0.7 kg)
Read modes Time-Resolved Fluorescence (TRF)Time-Resolved Fluorescence, Dual-Label (TRF-Dual)
Type Dual emission
Number of slots 1
Light source Ultra high power LED
Filter set EX: 370-80EM1: 616-10EM2: 642-10
Labels Europium chelate, Samarium chelate
Detection limit 384-well plate (75 µL): 5 amol1536-well plate (8 µL): 1.5 amol
Linear dynamic range 6 logs in a single microplate read
Table 6-7: Measurement Specification for Time Resolved Fluorescence (TRF) DetectionCartridge

Chapter 6: Available Detection Cartridges
5025027 A 133
Fluorescence Intensity (FI) Detection CartridgesThe Fluorescence Intensity (FI) Detection Cartridges use an ultra high power LED for theexcitation of various fluorescent labels, enabling fluorescence intensity read modes. Inaddition, the standard dual-emission design enables simple, straightforward fluorescenceresonance energy transfer (FRET)measurement.The following Fluorescence Intensity (FI) Detection Cartridges are available:
Fluorescence Intensity (FI) (coum-fluor) Detection Cartridge
Fluorescence Intensity (FI) (fluor-rhod) Detection Cartridge
Fluorescence Intensity (FI) (Cy3-Cy5) Detection Cartridge
Fluorescence Intensity (FI) (CFP-YFP) Detection Cartridge
Other Fluorescence Intensity (FI) Detection Cartridges include the Fluorescence Intensity (FI)GeneBLAzer Detection Cartridge on page 136.The read capabilities of the SpectraMax i3 Instrument can be upgraded with user-installabledetection cartridges. A detection cartridge contains its own independent light source, optics,and electrical components needed to perform specific read modes for specific applications.Each Fluorescence Intensity (FI) Detection Cartridge occupies one (1) slot in the detectioncartridge drawer.For installation instructions, see Installing a Detection Cartridge on page 78.The Fluorescence Intensity (FI) Detection Cartridges can perform the following read types:
End Point, see Endpoint Read Type on page 20.
Kinetic, see Kinetic Read Type on page 20.
Well Scan, seeWell Scan Read Type on page 21.
You can create protocols that use the Fluorescence Intensity (FI) Detection Cartridges in theSoftMax Pro Software. For information on creating protocols, see “Creating a Protocol” inthe SoftMax Pro Software application help or user guide.

SpectraMax i3 Multi-Mode Detection Platform User Guide
134 5025027 A
About Fluorescence Intensity
In fluorescence intensity read mode, the source light is directed through a tunable excitationfilter and then focused by an objective lens from above themicroplate. The filter passes onlythe specified wavelength band necessary to excite samples. The objective lens collects theresulting fluorescence and directs it through an emission filter to separate background lightfrom the specific wavelengths generated by samples. This signal is detected by a photomultiplier tube.The Fluorescence Intensity (FI) Detection Cartridges use an ultra high power LED and anoptimized filter set together with the SpectraMax i3 Instrument photon counting detectioncapabilities, resulting in superior detection limits and linear dynamic range at short readtimes. SeeMeasurement Specifications on page 135.For more information about fluorescence intensity, see Fluorescence Intensity Read Modeon page 27.
Microplate Recommendations
The following information is specific to this detection cartridge. For general microplateselection and handling guidelines, see Selecting SuitableMicroplate Types on page 77.
Read Mode MicroplateType
Additional Considerations
FluorescenceIntensity (FL)
Solid black When an application specifies a surface treatment, use onlymicroplates with the correct treatment.
Table 6-8: Microplate Selection Guidelines for the Fluorescence Intensity (FI) DetectionCartridges

Chapter 6: Available Detection Cartridges
5025027 A 135
Measurement Specifications
The specifications for measurements using the Fluorescence Intensity (FI) DetectionCartridges are shown in the following table.
Item Description Description Description Description
Detectioncartridgename
Fluorescence Intensity(FI) (coum-fluor)Detection Cartridge
Fluorescence Intensity(FI) (fluor-rhod)Detection Cartridge
Fluorescence Intensity(FI) (Cy3-Cy5)Detection Cartridge
Fluorescence Intensity(FI) (CFP-YFP)Detection Cartridge
Shortname
FI-COFL FI-FLRH FI-CY3CY5 FI-CFP-YFP
Partnumber
0200-7002 0200-7003 0200-7004 0200-7005
Weight 1.5 lbs (0.7 kg) 1.5 lbs (0.7 kg) 1.5 lbs (0.7 kg) 1.5 lbs (0.7 kg)
ReadMode
Fluorescence Intensity(FL)FluorescenceResonance EnergyTransfer (FRET)
Fluorescence Intensity(FL)FluorescenceResonance EnergyTransfer (FRET)
Fluorescence Intensity(FL)FluorescenceResonance EnergyTransfer (FRET)
Fluorescence Intensity(FL)FluorescenceResonance EnergyTransfer (FRET)
Type Dual emission Dual emission Dual emission Dual emission
Number ofslots
1 1 1 1
Lightsource
Ultra high power LED Ultra high power LED Ultra high power LED Ultra high power LED
Filter Set EX: 360-35EM1: 465-35EM2: 535-25
EX: 485-20EM1: 535-25EM2: 595-35
EX: 535-25EM1: 595-35EM2: LP655
EX: 445-20EM1: 485-20EM2: 535-25
Labels FL: CoumarinFRET: Coumarin-Fluorescein
FL: FluoresceinFRET: Fluorescein-Rhodamine
FL: RhodamineFRET: CY3-CY5
FL: AlexaFluor 430,ThioflavinFRET: CFP-YFP
Detectionlimit
384-well plate(75 µL):10 fmol/well1536-well plate(8 µL):3 fmol/well
384-well plate(75 µL):0.10 fmol/well1536-well plate(8 µL):0.03 fmol/well
384-well plate(75 µL):0.15 fmol/well1536-well plate(8 µL):0.06 fmol/well
384-well plate(75 µL):5 fmol/well1536-well plate(8 µL):5 fmol/well
Lineardynamicrange
4 logs in a singlemicroplate read
6 logs in a singlemicroplate read
6 logs in a singlemicroplate read
5 logs in a singlemicroplate read
Table 6-9: Measurement Specifications for Fluorescence Intensity (FI) DetectionCartridges
*Additional labels compatible with the excitation and emission wavelengths of the cartridge can also beused. All trademarks are the property of their respective owner.
SpectraMax i3 Multi-Mode Detection Platform User Guide
136 5025027 A
Fluorescence Intensity (FI) GeneBLAzer Detection CartridgeThe Fluorescence Intensity (FI) GeneBLAzer Detection Cartridge is designed for use withGeneBLAzer assays from Invitrogen. In addition, the standard dual-emission design enablessimple, straightforward fluorescence resonance energy transfer (FRET)measurement.The read capabilities of the SpectraMax i3 Instrument can be upgraded with user-installabledetection cartridges. A detection cartridge contains its own independent light source, optics,and electrical components needed to perform specific read modes for specific applications.The Fluorescence Intensity (FI) GeneBLAzer Detection Cartridge occupies one (1) slot in thedetection cartridge drawer.For installation instructions, see Installing a Detection Cartridge on page 78.The Fluorescence Intensity (FI) GeneBLAzer Detection Cartridge can perform the followingread types:
End Point, see Endpoint Read Type on page 20.
Kinetic, see Kinetic Read Type on page 20.
Well Scan, seeWell Scan Read Type on page 21.
You can create protocols that use the Fluorescence Intensity (FI) GeneBLAzer DetectionCartridge in the SoftMax Pro Software. For information on creating protocols, see “Creating aProtocol” in the SoftMax Pro Software application help or user guide.
About Fluorescence Intensity and GeneBLAzer
In fluorescence intensity read mode, the source light is directed through a tunable excitationfilter and then focused by an objective lens from above themicroplate. The filter passes onlythe specified wavelength band necessary to excite samples. The objective lens collects theresulting fluorescence and directs it through an emission filter to separate background lightfrom the specific wavelengths generated by samples. This signal is detected by a photomultiplier tube.The Fluorescence Intensity (FI) GeneBLAzer Detection Cartridge includes an ultra high-powerLED for excitation of the FRET donor moiety of the substrate.The Fluorescence Intensity (FI) GeneBLAzer Detection Cartridge is designed for use withGeneBLAzer assays from Invitrogen. The GeneBLAzer technology facilitates fluorescentdetection of β-lactamase reporter activity in mammalian cells by using the reporter gene, bla(M), and a fluorescence resonance energy transfer (FRET)-based substrate (CCF2). SeeMeasurement Specifications on page 138.

Chapter 6: Available Detection Cartridges
5025027 A 137
The GeneBLAzer technology provides a sensitivemethod to quantitate gene expression inmammalian cells. GeneBLAzer Detection Kits enable in vivo (living cells) or in vitro (celllysates) detection of β-lactamase reporter activity using a special fluorescent substrate. TheGeneBLAzer assay system consists of two major components:
The β-lactamase reporter gene, bla(M), a modified form of the E. coli bla gene. Whenfused to promoter sequences or to a gene of interest (in the context of a vector), the bla(M) gene can be used as a reporter of promoter activity or gene expression inmammalian cells, respectively.
CCF2, a FRET-based substrate allowing fluorescent detection of β-lactamase reporteractivity. CCF2 consists of a core (enzyme substrate site) linked to two fluorophores, 7-hydroxycoumarin and fluorescein. In the absence of bla expression, the substratemolecule remains intact. In this state, excitation of the coumarin results in fluorescenceresonance energy transfer to the fluorescein moiety and emission of green light.However, in the presence of bla expression, the substrate is cleaved, separating thefluorophores, and disrupting energy transfer. Excitation of the coumarin in the presenceof β-lactamase activity results in a blue fluorescence signal. The resulting blue:green ratioprovides a normalized reporter response.
For GeneBLAzer data, refer to the Invitrogen GeneBLAzer Detection Kits Instruction Manual,25-0661. Background fluorescence should be determined using sample wells containingmedium plus serum without cells.The ratio of blue and green fluorescence signal is calculated by dividing the 465 nm emission(blue channel) reading by the 535 nm emission (green channel) reading:
Ra�o = (signal at 465 nm - background at 465 nm)
(signal at 535 nm - background at 535 nm)
The ratio obtained from the experimental sample is compared to the ratio obtained from theappropriate negative controls.For more information about fluorescence intensity, see Fluorescence Intensity Read Modeon page 27.

SpectraMax i3 Multi-Mode Detection Platform User Guide
138 5025027 A
Microplate Recommendations
The following information is specific to this detection cartridge. For general microplateselection and handling guidelines, see Selecting SuitableMicroplate Types on page 77.
Read Mode MicroplateType
Additional Considerations
FluorescenceIntensity (FL)
Solid black When an application specifies a surface treatment, use onlymicroplates with the correct treatment.
Table 6-10: Microplate Selection Guidelines for the Fluorescence Intensity (FI)GeneBLAzer Detection Cartridge
Measurement Specifications
The specifications for measurements using the Fluorescence Intensity (FI) GeneBLAzerDetection Cartridge are shown in the following table.
Item Description
Detection cartridge name Fluorescence Intensity (FI) GeneBLAzer Detection Cartridge
Short name G-BLAZER
Part number 0200-7006
Weight 1.5 lbs (0.7 kg)
Read modes Fluorescence Intensity (FL)Fluorescence Resonance Energy Transfer (FRET)
Type Dual emission
Number of slots 1
Light source Ultra high power LED
Filter set EX: 406-15EM1:465-35EM2: 535-25
Labels FL: 7-hydroxycoumarinFRET: Coumarin-Fluorescein, CCF2 GeneBLAzer substrate
Application Designed for use with Invitrogen GeneBLAzer reagents
Table 6-11: Measurement Specification for Fluorescence Intensity (FI) GeneBLAzerDetection Cartridge

Chapter 6: Available Detection Cartridges
5025027 A 139
Fluorescence Polarization (FP) Detection CartridgeThe Fluorescence Polarization (FP) Detection Cartridges enable fluorescence polarizationread modes for specific labels, depending on the cartridge.Fluorescence Polarization (FP) Detection Cartridges are available for the following labels:
Fluorescence Polarization (FP) (Fluorescein) Detection Cartridge
Fluorescence Polarization (FP) (Rhodamine) Detection Cartridge
The read capabilities of the SpectraMax i3 Instrument can be upgraded with user-installabledetection cartridges. A detection cartridge contains its own independent light source, optics,and electrical components needed to perform specific read modes for specific applications.The Fluorescence Polarization (FP) Detection Cartridge occupies one (1) slot in the detectioncartridge drawer.For installation instructions, see Installing a Detection Cartridge on page 78.The Fluorescence Polarization (FP) Detection Cartridge can perform the following read types:
End Point, see Endpoint Read Type on page 20.
Kinetic, see Kinetic Read Type on page 20.
You can create protocols that use the Fluorescence Polarization (FP) Detection Cartridge inthe SoftMax Pro Software. For information on creating protocols, see “Creating a Protocol”in the SoftMax Pro Software application help or user guide.
About Fluorescence Polarization
Fluorescence polarization (FP)modemeasures the relative change of polarization of emittedfluorescent compared to excitation light.Fluorescence polarization detection is similar to fluorescence intensity, with the importantdifference that it uses plane-polarized light, rather than non-polarized light. Plate readersmeasure FP of the sample by detecting light emitted both parallel and perpendicular to theplane of excitation.By using a fluorescent dye to label a small molecule, its binding to another molecule of equalor greater size can bemonitored through its speed of rotation.When molecules are excited with polarized light, the polarization of the emitted lightdepends on the size of themolecule to which the fluorophore is bound. Larger moleculesemit a higher percentage of polarized light, while smaller molecules emit a lower percentageof polarized light because of their rapid molecular movement. For this reason FP is typicallyused for molecular binding assays in high-throughput screening (HTS).For more information on fluorescence polarization, see Fluorescence Polarization ReadMode on page 45.

SpectraMax i3 Multi-Mode Detection Platform User Guide
140 5025027 A
Microplate Recommendations
The following information is specific to this detection cartridge. For general microplateselection and handling guidelines, see Selecting SuitableMicroplate Types on page 77.
Read Mode MicroplateType
Additional Considerations
FluorescencePolarization (FP)
Solid black When an application specifies a surface treatment, use onlymicroplates with the correct treatment.Molecular Devices recommends using unlidded plate for fluorescencepolarization measurements.
Table 6-12: Microplate Selection Guidelines for the Fluorescence Polarization (FP)Detection Cartridge
Measurement Specifications
The specifications for measurements using the Fluorescence Polarization (FP) DetectionCartridges are shown in the following table.
Item Description Description
Detectioncartridge name
Fluorescence Polarization (FP) (Fluorescein)Detection Cartridge
Fluorescence Polarization (FP) (Rhodamine)Detection Cartridge
Short name FP-FLUO FP-RHOD
Part number 0200-7009 0200-0710
Weight 1.5 lbs (0.7 kg) 1.5 lbs (0.7 kg)
Read Mode Fluorescence polarization (FP) Fluorescence polarization (FP)
Type Dual emission Dual emission
Number of slots 1 1
Light source Ultra high power LED Ultra high power LED
Filter Set EXP: 485-20EMP1: 535-25EMP2: 535-25
EXP: 535-25EMP1: 595-35EMP2: 595-35
Labels1 Fluorescein 1 nM Rhodamine 4 nM
Detection limit2 384-well (75 µl):3 mP1536-well (8 µl):6 mP
384-well (75 µl):4 mP1536-well (8 µl):6 mP
Table 6-13: Measurement Specifications for Fluorescence Polarization (FP) DetectionCartridges
1 Additional labels compatible with the excitation and emission wavelengths of the cartridge can also beused.
2 Replicate standard deviation at the label concentration specified under Labels.

Chapter 6: Available Detection Cartridges
5025027 A 141
Glow Luminescence (LUM) Detection CartridgesThe Glow Luminescence (LUM) Detection Cartridges enable luminescence read modes.The three Glow Luminescence (LUM) Detection Cartridges are individually optimized for 1536-well, 384-well, or 96-well microplate formats:
SpectraMax Paradigm Glow Luminescence (LUM) Detection Cartridge
SpectraMax Paradigm Glow Luminescence (LUM) Detection Cartridge (384)
SpectraMax Paradigm Glow Luminescence (LUM) Detection Cartridge (96)
For dual-color luminescence, see the Dual Color Luminescence (LUM) (BRET2) DetectionCartridge on page 144 and the Dual Color Luminescence (LUM) (Chroma-Glo) DetectionCartridge on page 149.The read capabilities of the SpectraMax i3 Instrument can be upgraded with user-installabledetection cartridges. A detection cartridge contains its own independent light source, optics,and electrical components needed to perform specific read modes for specific applications.The Glow Luminescence (LUM) Detection Cartridge occupies one (1) slot in the detectioncartridge drawer.For installation instructions, see Installing a Detection Cartridge on page 78.The Glow Luminescence (LUM) Detection Cartridge can perform the following read types:
End Point, see Endpoint Read Type on page 20.
Kinetic, see Kinetic Read Type on page 20.
Well Scan, seeWell Scan Read Type on page 21.
You can create protocols that use the Glow Luminescence (LUM) Detection Cartridge in theSoftMax Pro Software. For information on creating protocols, see “Creating a Protocol” inthe SoftMax Pro Software application help or user guide.

SpectraMax i3 Multi-Mode Detection Platform User Guide
142 5025027 A
About Luminescence
Luminescence is the emission of light by processes that derive energy from essentially non-thermal changes, themotion of subatomic particles, or the excitation of an atomic system byradiation. Luminescence detection relies on the production of light from a chemical reactionin a sample.Each Glow Luminescence (LUM) Detection Cartridge contains the components for measuringthe light intensity from luminescence. Since the light is emitted as a result of a chemicalreaction, no excitation light and no excitation filters are required to measure luminescence.The luminescence can bemeasured with no emission filters, or an emission wavelengthselected from within the specified range. SeeMeasurement Specifications on page 143.
Note: This detection cartridge is not suitable for measurement of flash luminescencereactions, which require injectors.
For more information about luminescence, see Luminescence Read Mode on page 31.
Microplate Recommendations
The following information is specific to this detection cartridge. For general microplateselection and handling guidelines, see Selecting SuitableMicroplate Types on page 77.
Read Mode MicroplateType
Additional Considerations
Luminescence(LUM)
Solid white When an application specifies a surface treatment, use only microplateswith the correct treatment.Molecular Devices recommends using an unlidded plate forluminescence measurements.
Table 6-14: Microplate Selection Guidelines for the Glow Luminescence (LUM) DetectionCartridges
Note:Whitemicroplates provide significantly higher signal than black microplates,and are recommended if high sensitivity is required. Whitemicroplates can, however,exhibit some detectable phosphorescence which increases background after beingexposed to light (in particular under neon lights). For maximum sensitivity, MolecularDevices recommends to preparemicroplates under reduced ambient light conditions,and to adapt themicroplates to dark for 10 to 30minutes prior to measurement.

Chapter 6: Available Detection Cartridges
5025027 A 143
Measurement Specifications
The specifications for measurements using the Glow Luminescence (LUM) DetectionCartridges are shown in the following table.
Item Description Description Description
Detection cartridgename
Glow Luminescence(LUM) Detection Cartridge
Glow Luminescence (LUM)Detection Cartridge (384)
Glow Luminescence (LUM)Detection Cartridge (96)
Short name LUM LUM 384 LUM 96
Part number 0200-7012 0200-7015 0200-7014
Weight 1.5 lbs (0.7 kg) 1.5 lbs (0.7 kg) 1.5 lbs (0.7 kg)
Microplate formats 6, 12, 24, 48, 96, 384,1536-well microplates
6, 12, 24, 48, 96, and 384-well microplates
6, 12, 24, 48, 96-wellmicroplates
Read mode Luminescence (LUM) Luminescence (LUM) Luminescence (LUM)
Type Single emission Single emission Single emission
Number of slots 1 1 1
Light source None None None
Wavelength range Visible to 650 nm Visible to 650 nm Visible to 650 nm
Labels/Substrates Any compatible withwavelength range
Any compatible withwavelength range
Any compatible withwavelength range
Detection limit 96-well (200 µL)Guaranteed: 25 pMOptimized: 15 pM384-well (50 µL)Guaranteed: 100 pMOptimized: 40 pM1536-well (8 µL)Guaranteed: 250 pMOptimized: 190 pM
96-well (200 µL)Guaranteed: 20 pMOptimized: 12 pM384-well (50 µL)Guaranteed: 40 pMOptimized: 20 pM1536-well (8 µL)NA
96-well (200 µL)Guaranteed: 15 pMOptimized: 10 pM384-well (50 µL)NA1536-well (8 µL)NA
Linear dynamicrange
5 logs in a singlemicroplate read
5 logs in a single microplateread
5 logs in a single microplateread
Table 6-15: Measurement Specifications for Glow Luminescence (LUM) DetectionCartridges

SpectraMax i3 Multi-Mode Detection Platform User Guide
144 5025027 A
Dual Color Luminescence (LUM) (BRET2) Detection CartridgeThe Dual Color Luminescence (LUM) (BRET2™) Detection Cartridge enables read modes forluminescence and is designed to provide optimal performance when used with PerkinElmerBRET2 reagents.For luminescencemeasurements that do not require emission filters, see GlowLuminescence (LUM) Detection Cartridges on page 141.The read capabilities of the SpectraMax i3 Instrument can be upgraded with user-installabledetection cartridges. A detection cartridge contains its own independent light source, optics,and electrical components needed to perform specific read modes for specific applications.The Dual Color Luminescence (LUM) (BRET2) Detection Cartridge occupies one (1) slot in thedetection cartridge drawer.For installation instructions, see Installing a Detection Cartridge on page 78.The Dual Color Luminescence (LUM) (BRET2) Detection Cartridge can perform the followingread types:
End Point, see Endpoint Read Type on page 20.
Kinetic, see Kinetic Read Type on page 20.
Well Scan, seeWell Scan Read Type on page 21.
You can create protocols that use the Dual Color Luminescence (LUM) (BRET2) DetectionCartridge in the SoftMax Pro Software. For information on creating protocols, see “Creating aProtocol” in the SoftMax Pro Software application help or user guide.BRET2 is a trademark of PerkinElmer, Inc.
Chapter 6: Available Detection Cartridges
5025027 A 145
About BRET Luminescence
Bioluminescence Resonance Energy Transfer (BRET) is a measurement technique sharing thekey feature of fluorescence resonance energy transfer (FRET) while using the advantages ofluminescence reading.BRET employs a luminescence substrate that can undergo cleavage due to an enzymaticgroup (donor label) resulting in luminescence emission (channel 1). Unlike other genericluminescence assays, the BRET luminescence can be quenched by a radiationless EnergyTransfer to an acceptor label (a fluorophore) resulting in fluorescence emission at a longerwavelength (red shifted, channel 2). The acceptor must be chosen such that its excitationspectrum overlaps the emission spectrum of the luminescence (Resonance condition). In thepresence of substrate the energy transfer can occur only when the enzymatic group and theacceptor are in close proximity. Because of this fact, when labels are applied to study protein-protein interactions for example, signal measured at the emission wavelength of theacceptor fluorophore indicates binding.The Dual Color Luminescence (LUM) (BRET2) Detection Cartridge contains the componentsfor measuring the light intensity from BRET2 reagents. Since the light is emitted as a result ofa chemical reaction, no excitation light and no excitation filters are required to measureluminescence, and the detection of the acceptor fluorophore (channel 2) can be regarded asa luminescence also. Emission filters differentiate emissions from both the luminescence andthe acceptor fluorophore. So, a dual color luminescence read mode is applied.BRET2 can be used to study various kinds of protein-protein interactions. It employs aluciferase label (where “label” generally means fused by the use of expression vectors) for theone protein and a Green Fluorescent Protein (GFP) variant label for the other. The type ofluciferase (Renilla) metabolizes the luminescent substrate (a coelenterazine derivative)resulting in blue luminescence (emission filter 1). Given the substrate, when the otherprotein with the GFP label is in close proximity to the luciferase, it quenches the blueluminescence and emits a green luminescence (emission filter 2). A high green to blue ratioindicates binding. The energy transfer is possible by the selection of the labels, that is, theoverlap of the blue luminescence spectrum with the excitation spectrum of the GFP(resonance condition). As a result, BRET2 combines the advantage of being a homogeneous(no washing steps required) assay with the generic sensitivity of luminescence detection.Energy Transfer data are generally normalized by taking the red shifted emission and dividingit by the blue shifted emission. In terms of the BRET2 reagents, the normalization of thegreen signal with the blue signal mainly compensates for the decay of the signal due to thedigestion of the substrate. The software supports data reduction in taking ratios of bothemission channels.Because of the signal decay, measure the assay immediately after adding the luminescencesubstrate. The spectral separation of the green from the blue signal conveniently eliminatesthe need for preprocessing the raw data.

SpectraMax i3 Multi-Mode Detection Platform User Guide
146 5025027 A
When performing a binding assay, controls are involved that represent a maximum (high)and a minimum (low) G:B (green to blue) ratio, and the Z´ parameter can be applied. Beyondmerely taking the ratio of high and lowG:B values, the Z´ includes replicate variability tovalidate the actual data quality.Z´ is the standard statistical parameter in the high-throughput screening community formeasuring the quality of a screening assay independent of test compounds. It is used as ameasure of the signal separation between the positive controls and the negative controls inan assay.The value of Z´ can be determined using the following formula:
Z´ = 1 – | Mean
c+ – Mean
c– |
3(SDc+
) + 3(SDc–
)
where SD is the standard deviation, c+ is the positive control, and c– is the negative control.A Z´ value greater than or equal to 0.4 is the generally acceptable minimum for an assay.Higher values might be desired when results aremore critical.Z´ is not linear and can bemade unrealistically small by outliers that skew the standarddeviations in either population. To improve the Z´ value, you can increase the amount oflabel in the sample, if acceptable for the assay, or increase the read time per well.The BRET2 reagents can be applied in various ways to study other types ofmolecularinteractions in cell based assays. For a list of applications, go to www.perkinelmer.com.For more information on luminescence, see Luminescence Read Mode on page 31.

Chapter 6: Available Detection Cartridges
5025027 A 147
Microplate Recommendations
The following information is specific to this detection cartridge. For general microplateselection and handling guidelines, see Selecting SuitableMicroplate Types on page 77.
Read Mode MicroplateType
Additional Considerations
Luminescence (LUM) Solid white When an application specifies a surface treatment, use onlymicroplates with the correct treatment.Molecular Devices recommends using an unlidded plate forluminescence measurements.
Luminescence, Dual Color(LUM-Dual)
Solid white When an application specifies a surface treatment, use onlymicroplates with the correct treatment.Molecular Devices recommends using an unlidded plate forluminescence measurements.
Table 6-16: Microplate Selection Guidelines fro the Dual Color Luminescence (LUM)(BRET2) Detection Cartridge
Note:Whitemicroplates provide significantly higher signal than black microplates,and are recommended if high sensitivity is required. Whitemicroplates can, however,exhibit some detectable phosphorescence which increases background after beingexposed to light (in particular under neon lights). For maximum sensitivity, MolecularDevices recommends to preparemicroplates under reduced ambient light conditions,and to adapt themicroplates to dark for 10 to 30minutes prior to measurement.
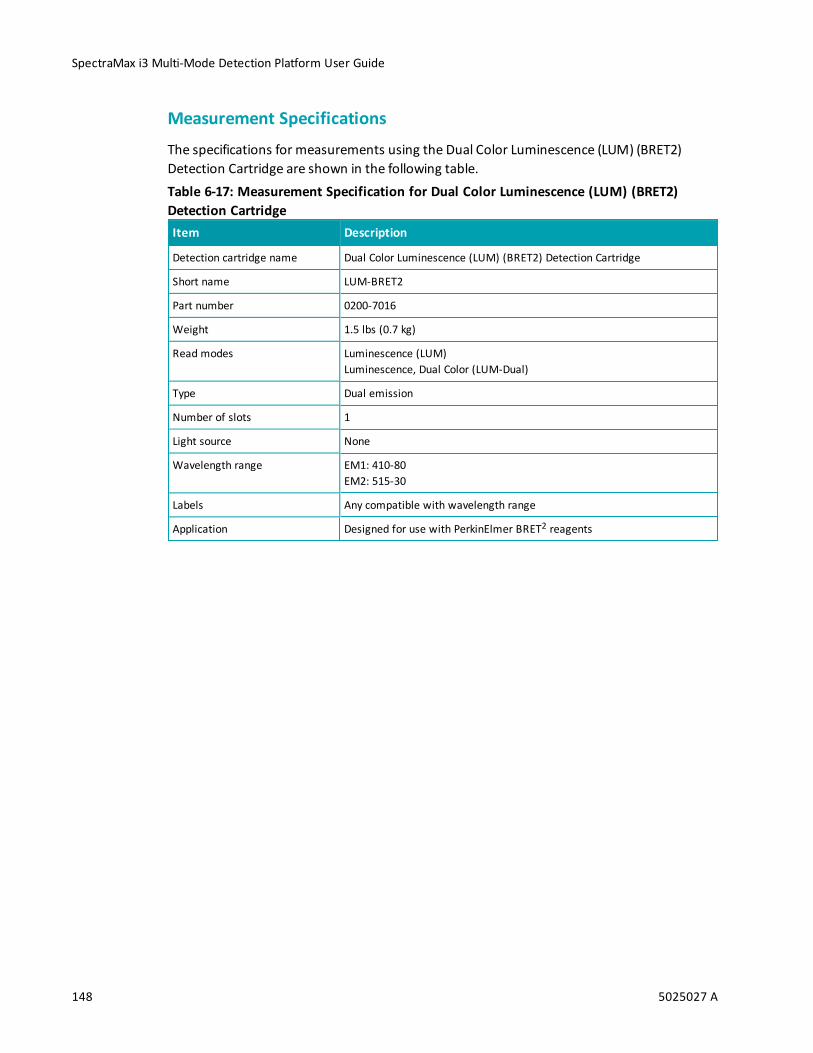
SpectraMax i3 Multi-Mode Detection Platform User Guide
148 5025027 A
Measurement Specifications
The specifications for measurements using the Dual Color Luminescence (LUM) (BRET2)Detection Cartridge are shown in the following table.
Item Description
Detection cartridge name Dual Color Luminescence (LUM) (BRET2) Detection Cartridge
Short name LUM-BRET2
Part number 0200-7016
Weight 1.5 lbs (0.7 kg)
Read modes Luminescence (LUM)Luminescence, Dual Color (LUM-Dual)
Type Dual emission
Number of slots 1
Light source None
Wavelength range EM1: 410-80EM2: 515-30
Labels Any compatible with wavelength range
Application Designed for use with PerkinElmer BRET2 reagents
Table 6-17: Measurement Specification for Dual Color Luminescence (LUM) (BRET2)Detection Cartridge

Chapter 6: Available Detection Cartridges
5025027 A 149
Dual Color Luminescence (LUM) (Chroma-Glo) Detection CartridgeThe SpectraMax® Paradigm®Dual Color Luminescence (LUM) (Chroma-Glo™) DetectionCartridge enables read modes for luminescence and is designed to provide optimalperformance when used with Promega Chroma-Glo™ reagents.For luminescencemeasurements that do not require emission filters, see GlowLuminescence (LUM) Detection Cartridges on page 141.The read capabilities of the SpectraMax i3 Instrument can be upgraded with user-installabledetection cartridges. A detection cartridge contains its own independent light source, optics,and electrical components needed to perform specific read modes for specific applications.The Dual Color Luminescence (LUM) (BRET2) Detection Cartridge occupies one (1) slot in thedetection cartridge drawer.For installation instructions, see Installing a Detection Cartridge on page 78.The Dual Color Luminescence (LUM) (BRET2) Detection Cartridge can perform the followingread types:
End Point, see Endpoint Read Type on page 20.
Kinetic, see Kinetic Read Type on page 20.
Well Scan, seeWell Scan Read Type on page 21.
You can create protocols that use the Dual Color Luminescence (LUM) (BRET2) DetectionCartridge in the SoftMax Pro Software. For information on creating protocols, see “Creating aProtocol” in the SoftMax Pro Software application help or user guide.Chroma-Glo is a trademark of Promega Corporation.
About Dual Color Luminescence
Luminescence is the emission of light by processes that derive energy from essentially non-thermal changes, themotion of subatomic particles, or the excitation of an atomic system byradiation. Luminescence detection relies on the production of light from a chemical reactionin a sample.In a dual color luminescence read mode, dual labels (such as gene reporters) causing theemission of different wavelength bands at the same time aremeasured.The Dual Color Luminescence (LUM) (Chroma-Glo) Detection Cartridge contains thecomponents for measuring the light intensity from luminescence. Since the light is emittedas a result of a chemical reaction, no excitation light and no excitation filters are required tomeasure luminescence. The luminescence can bemeasured with no emission filters, or anemission wavelength selected from within the specified range. SeeMeasurementSpecifications on page 152.
Note: This detection cartridge is not suitable for measurement of flash luminescencereactions, which require injectors.

SpectraMax i3 Multi-Mode Detection Platform User Guide
150 5025027 A
The Chroma-Glo assay system is a further development of the Dual-Glo™ luciferase genereporter assays. Both types of assays are designed to normalize the activity of the one, morespecific reporter of gene expression with the activity of another reporter, to cancel outvariations in the experimental (biological) assay parameters.In the Dual-Glo Luciferase assay system, the one reporter is activated, and then measured.During the activation of the other reporter, the emission induced by the first reporter isextinguished. The Dual-Glo Luciferase assay system requires no emission filters, and can bemeasured using a Glow Luminescence (LUM) Detection Cartridge.The Dual Color Luminescence (LUM) (Chroma-Glo) Detection Cartridge contains emissionfilters designed for the Chroma-Glo reagents. Onemajor benefit of the Chroma-Glo assaysystem over the Dual-Glo luciferase system is it requires only a single reagent addition step.However, this also requires a compensation for overlap in the emission spectra induced bythe concurrent activity of the Chroma-Glo dual luciferases.For maximum sensitivity, the Chroma Glo reagents should be read within the first hour afterpreparation.For typical applications and a discussion on the advantages of the one over the other assaysystem, go to www.promega.com.For information on analyzing dual color luminescence data, see the following topics:
Color Separation and Red to Green Ratios on page 150
Normalized Ratios and Relative Response Ratios on page 151
For more information about luminescence, see Luminescence Read Mode on page 31.Dual-Glo and Chroma-Glo are trademarks of Promega Corporation.
Color Separation and Red to Green Ratios
As suggested by Promega, before ratios can be taken from the Chroma-Glo red and greenemission channels, somemutual overlap of the emission spectra needs to be considered.This spectral overlap can be exactly quantified by the help of controls which contain only theone or the other reporter, respectively (red control, green control).The spectral overlap is defined by two coefficients (CT
GRand CT
RG, see Calculations on page
152), which depend on the individual emission filters (the detection cartridge), and therelative sensitivity of the PMTs (the detection platform) in the red and the green wavelengthrange. Therefore, the values of these two coefficients need to be established for eachdetection system (combination of detection cartridge and SpectraMax i3 Instrument). Ifdetermined once for a system, the two values can be carried over into further protocols,although it is good practice to provide such controls in replicates for each assay.

Chapter 6: Available Detection Cartridges
5025027 A 151
Normalized Ratios and Relative Response Ratios
The decay of the red signal is considerable, with a half-life of about 30minutes, whencompared with the decay of the green signal. Thus, the color corrected red to green ratios(R:G, see Color Separation and Red to Green Ratios on page 150) are normalized with thevalue of, for example, a negative control, which is then named the Normalized Ratio (NR).
NR = (R / G)sample
/ (R / G)neg
In the case that both a negative and a positive control have been defined in the plate layout,the software can calculate a Relative Response Ratio (RRR), quantifying a sample in the rangebetween the negative and the positive control. RRR can become negative in some cases.
RRR = [(R / G)sample
– (R / G)neg
] / [(R / G)pos
– (R / G)neg
] x 100%which can be read as
RRR = [NRsample
– 1] / [NRpos
– 1] x 100%
Microplate Recommendations
The following information is specific to this detection cartridge. For general microplateselection and handling guidelines, see Selecting SuitableMicroplate Types on page 77.
Read Mode MicroplateType
Additional Considerations
Luminescence (LUM) Solid white When an application specifies a surface treatment, use onlymicroplates with the correct treatment.Molecular Devices recommends using an unlidded plate forluminescence measurements.
Luminescence, Dual Color(LUM-Dual)
Solid white When an application specifies a surface treatment, use onlymicroplates with the correct treatment.Molecular Devices recommends using an unlidded plate forluminescence measurements.
Table 6-18: Microplate Selection Guidelines for the Dual Color Luminescence (LUM)(Chroma-Glo) Detection Cartridge
Note:Whitemicroplates provide significantly higher signal than black microplates,and are recommended if high sensitivity is required. Whitemicroplates can, however,exhibit some detectable phosphorescence which increases background after beingexposed to light (in particular under neon lights). For maximum sensitivity, MolecularDevices recommends to preparemicroplates under reduced ambient light conditions,and to adapt themicroplates to dark for 10 to 30minutes prior to measurement.

SpectraMax i3 Multi-Mode Detection Platform User Guide
152 5025027 A
Measurement Specifications
The specifications for measurements using the Dual Color Luminescence (LUM) (Chroma-Glo)Detection Cartridge are shown in the following table.
Item Description
Detection cartridge name Dual Color Luminescence (LUM) (Chroma-Glo) Detection Cartridge
Short name LUM-CHROM
Part number 0200-7013
Weight 1.5 lbs (0.7 kg)
Read modes Luminescence (LUM)Luminescence, Dual Color (LUM-Dual)
Type Dual emission
Number of slots 1
Light source None
Wavelength range EM1: 510-60EM2: LP610
Labels Any compatible with wavelength range
Application Designed for use with Promega Chroma-Glo reagents
Table 6-19: Measurement Specification for Dual Color Luminescence (LUM) (Chroma-Glo)Detection Cartridge
Calculations
Formulas used for the color separation are derived from the following set of equations:Equation 1: L
rf = Red x CT
GR + Green x CT
RG
Equation 2: Lgf = Red x CT
GR + Green x CT
RG
where Lrfis the luminescence of a sample as measured through the red filter, L
gfis the
luminescence of a sample as measured through the green filter, Red quantifies samplecontent of luciferase inducing the red emission spectrum, Green quantifies sample contentof luciferase inducing the green emission spectrum, CT
RGis the relative overlap (spectral
cross talk) of green spectrum seen in the red emission channel, and CTGR
is the relativeoverlap (spectral cross talk) of red spectrum seen in the green emission channel.

Chapter 6: Available Detection Cartridges
5025027 A 153
The algebraic solutions to (Equation 1) and (Equation 2) are:Equation 3: Green = (L
rf – [L
gf x CT
RG]) / (1 – CT
GR x CT
RG) Red
Equation 4: Green = (Lgf – [L
rf x CT
GR]) / (1 – CT
RG x CT
GR)
The unknown coefficients for the overlap (CT) are determined by measuring and inserting thered only and green only controls into (Equation 1) and (Equation 2), respectively, yieldingEquation 5: R
rf = Red
Control x CT
GR + 0 x CT
RG
Equation 6: Rgf = Red
Control x CT
GR + 0 x CT
RG
andEquation 7: G
rf = 0 x CT
GR + Green
Control x CT
RG
Equation 8: Ggf = 0 x CT
GR + Green
Control x CT
RG
where RedControl
is the control inducing the red emission spectrum only, GreenControl
is thecontrol inducing the green emission spectrum only, R
rfis the red control as measured
through the red filter, Rgfis the red control as measured through the green filter, G
rfis the
green control as measured through the red filter, and Ggfis the green control as measured
through the green filter.Paired equations (Equation 5) and (Equation 6), and (Equation 7) and (Equation 8) can beresolved into
Equation 9: CTGR
=R
gf
Rrf
Equation 10: CTRG
=G
rf
Ggf
Because (Equation 9) and (Equation 10) are ratiometric, the concentration of the red andgreen only controls can be undefined, though shall be considerable to yield accuratemeasurement values.By inserting the solutions for the coefficients CT enumerated above in (Equation 9) and(Equation 10) into (Equation 3) and (Equation 4) above, it can be confirmed that theresulting equations comply with those provided by Promega, after normalization with thefilter efficiencies E
rf= (R
rf/ R) and E
gf= (G
gf/ G), respectively. The values for filter efficiencies
are stored in the cartridge, thus making a additional measurement to achieve R and G(without emission filter) unnecessary.All the equations in this section make no assumption on the nature of the signal, thus couldbe similarly applied to any other dual label detection with overlapping spectra, for example inan absorbance or a fluorescence reading.

SpectraMax i3 Multi-Mode Detection Platform User Guide
154 5025027 A

5025027 A 155
Chapter 7: Maintenance and Troubleshooting
Perform only themaintenance described in this guide. Maintenance procedures other thanthose specified in this guide can be performed only by Molecular Devices service engineers.See Obtaining Support on page 171.Before operating the instrument or performing maintenance operations, make sure that youare familiar with the safety information in this guide. See Safety Information on page 7.The following topics describemaintenance and troubleshooting procedures that can beperformed by users to ensure optimum operation of the instrument.
Performing PreventiveMaintenance on page 156
Cleaning the Instrument on page 157
Replacing Fuses on page 158
Moving the Instrument on page 160
Packing the Instrument for Storage or Service on page 161
Troubleshooting on page 170
For SpectraMax MiniMax Imaging Cytometer maintenance and troubleshooting procedures,see Cytometer Maintenance and Troubleshooting on page 109.
WARNING! Service or maintenance procedures other than those specified in thisguide can be performed only by trained service engineers. When service isrequired, contact a Molecular Devices service engineer.
7

SpectraMax i3 Multi-Mode Detection Platform User Guide
156 5025027 A
Performing Preventive MaintenanceTo ensure optimum operation of the instrument, perform the following preventivemaintenance procedures as necessary:
Wipe up any spills immediately.
Open the detection cartridge drawer only when installing or removing a detectioncartridge.
When a detection cartridge is not in use and removed from the instrument, always storethe detection cartridge in the detection cartridge box.
Follow appropriate decontamination procedures as instructed by your laboratory safetyofficer.
Use an appropriate Validation Plate to regularly test the functionality of the instrument.For more details, contact Molecular Devices sales or service.
Contact Molecular Devices or an authorized dealer for annual preventivemaintenance.Molecular Devices recommends a yearly preventivemaintenance be performed on theinstrument by a trained and qualified service engineer.
Respond appropriately to any error messages displayed by the software.

Chapter 7: Maintenance and Troubleshooting
5025027 A 157
Cleaning the Instrument
WARNING! BIOHAZARD Always wear gloves during any cleaning procedurethat could involve contact with either hazardous or biohazardous materials orfluids.
CAUTION! Never clean the inside of the instrument. Cleaning the interior can causedamage to the instrument.
Wipe up any spills immediately.Periodically clean the outside surfaces of the instrument using a cloth or sponge that hasbeen lightly dampened with water.If required, clean the surfaces using a mild soap solution diluted with water or a glass cleanerand then wipe with a damp cloth or sponge to remove any residue.
CAUTION! Do not use abrasive cleaners.
CAUTION! Do not spray cleaner directly onto the instrument.
CAUTION! Do not allowwater or other fluids to drip inside the instrument.
If needed, clean themicroplate drawer using a cloth or sponge that has been lightlydampened with water.

SpectraMax i3 Multi-Mode Detection Platform User Guide
158 5025027 A
Replacing FusesFuses burn out occasionally and must be replaced.If the instrument does not seem to be getting power after switching it on, check to seewhether the supplied power cord is securely plugged into a functioning power outlet and tothe power port on the back of the instrument.If the power failed while the instrument was on, check that the power cord is not loose ordisconnected and that power to the power outlet is functioning properly.If these checks fail to remedy the loss of power, replace the fuses. You can obtainreplacement fuses from Molecular Devices. For fuse specifications and part numbers, seePhysical Specifications on page 179.
CAUTION! Do not touch or loosen any screws or parts other than those specificallydesignated in the instructions. Doing so could causemisalignment and possibly voidthe warranty.
The fuses are located in the fuse carrier on the back of the instrument.
1
3 4 5
2
Item Description
1 USB Port
2 Gas inlet quick-connect fitting
3 Power port
4 Fuse carrier
5 Power switch
Figure 7-1: Power Switch, Fuses, and Connection Ports

Chapter 7: Maintenance and Troubleshooting
5025027 A 159
With a SpectraMax MiniMax Imaging Cytometer installed, another pair of fuses exist in aseparate fuse carrier. See Replacing Fuses in the Cytometer on page 109.To replace the fuses:
WARNING! HIGH VOLTAGE Always turn the power switch off and disconnectthe power cord from the main power source before performing any maintenanceprocedure that requires removal of any panel or cover or disassembly of anyinterior instrument component.
1. Switch the power switch on the back of the instrument to the off position.
2. Unplug the power cord from the power port.
3. Use a small flat-head screwdriver to gently press on the carrier-release tab and then pullthe fuse carrier to remove it from the instrument.
2
1
Item Description
1 Fuse carrier
2 Carrier-release tab
Figure 7-2: Releasing the fuse carrier
4. Gently pull the old fuses from the carrier by hand.
5. Gently place new fuses into the carrier by hand.
6. Replace the fuse carrier.
7. Plug the power cord into the power port.
8. Turn on power to the instrument.
Note: If the instrument still does not power on after changing the fuses, contactMolecular Devices technical support.

SpectraMax i3 Multi-Mode Detection Platform User Guide
160 5025027 A
Moving the Instrument
WARNING! LIFTING HAZARD. To prevent injury, use at least two people tolift the instrument.
Beforemoving the SpectraMax i3 Instrument, make sure that the new location is a dry, flatwork area that has sufficient space for the instrument, host computer, and required cables.To ensure adequate ventilation and allow access for disconnecting power from theinstrument, maintain a 20 cm to 30 cm (7.9 in. to 11.8 in.) gap between the back of theinstrument and the wall. See Instrument Specifications on page 173.
CAUTION!When transporting the instrument, warranty claims are void if damageduring transport is caused by improper packing.
To move the instrument:
1. Disconnect the gas supply line, if applicable. See Connecting and Disconnecting a GasSupply on page 68.
2. Install the transport locks on themicroplate drawer and the detection cartridge drawer.See Installing the Transport Locks on page 161.
3. If you are transporting the instrument to another building, pack the instrument in theoriginal packaging. See Packing the Instrument on page 166.
CAUTION! Keep the box upright. Do not tip or tilt the box or place it on its side.
Chapter 7: Maintenance and Troubleshooting
5025027 A 161
Packing the Instrument for Storage or ServiceTo minimize the possibility of damage during storage or shipment, the instrument should berepacked only in the original packaging materials. Correctly repacking the instrumentincludes following appropriate decontamination procedures and installing the transportlocks on themicroplate drawer and detection cartridge drawers.
CAUTION!When transporting the instrument, warranty claims are void if damageduring transport is caused by improper packing.
The instrument should be stored in a dry, dust-free, environmentally controlled area. Formore information about acceptable storage environments, see Instrument Specifications onpage 173.Packing up the instrument includes the following procedures:
Disconnecting the gas supply line, if applicable. See Connecting and Disconnecting a GasSupply on page 68.
Installing the transport locks on themicroplate and detection cartridge drawers. SeeInstalling the Transport Locks on page 161.
Packing the instrument in the original packaging. See Packing the Instrument on page166.
Installing the Transport Locks
Beforemoving or packing the SpectraMax i3 Instrument, install the transport locks on themicroplate drawer and the detection cartridge drawer to protect the instrument fromdamage during shipping.This procedure requires the following tool:
Part Number Description
YW 000 006 Hex key, 2.0 mm
Table 7-1: Required Tool
CAUTION! Do not touch or loosen any screws or parts other than those specificallydesignated in the instructions. Doing so could causemisalignment and possibly voidthe warranty.
CAUTION! The front cover is held onto the front of the instrument by powerfulmagnets. Keep magnetic storage devices or strips, such as hard drives, key cards, andcredit cards, away from the instrument covers.

SpectraMax i3 Multi-Mode Detection Platform User Guide
162 5025027 A
To install the transport locks:
1. Turn on the power switch on the back of the instrument.
2. Remove any detection cartridges from the detection cartridge drawer. See Removing aDetection Cartridge on page 82.
3. Close the detection cartridge drawer.
4. Remove any microplate from themicroplate drawer. See Loading and UnloadingMicroplates on page 76.
5. Leave themicroplate drawer open.
6. Switch the power switch on the back of the instrument to the off position.
7. Unplug the power cord from the power port on the back of the instrument.
8. Place themicroplate drawer transport lock on the end of themicroplate drawer.
9. Use the 2.0 mm hex key to tighten screws #2 and #3 until the lock is attached to themicroplate drawer.
5
12
43
6
Item Description
1 Screw #1 fastens the lock to the internal frame of the instrument
2 Screw #2 fastens the lock to the microplate drawer
3 Screw #3 fastens the lock to the microplate drawer
4 Microplate drawer
5 Microplate chamber door in open position
6 Microplate drawer transport lock
Figure 7-3: Microplate Drawer Transport Lock

Chapter 7: Maintenance and Troubleshooting
5025027 A 163
10. Gently push themicroplate drawer into the instrument and as far to the left as possibleuntil screw #1, which fastens the lock to the internal frame of the instrument, is lined upwith the hole on the internal frame. Themicroplate chamber door must be held openmanually until the transport lock is fastened.
11. Tighten screw #1 until themicroplate drawer is securely locked in place.
12. Route the yellow tab connected to the transport lock so that it will pass over the top ofthemicroplate chamber door when closed.
13. Gently close themicroplate chamber door.
14. Firmly pull on the front cover to remove it and then set it aside. The front cover is heldonto the front of the instrument by powerful magnets.
Tip: It is easiest to remove the front cover by pulling from the bottom.
15. Slide the detection cartridge drawer forward until it is outside themain instrument.
16. Place the tab on the detection cartridge drawer transport lock into the slot on thebottom of the detection cartridge drawer.
1 2
Item Description
1 Detection cartridge drawer transport lock tab
2 Detection cartridge drawer transport lock slot
Figure 7-4: Detection Cartridge Drawer Bottom View
17. Gently push the detection cartridge drawer back inside the instrument.

SpectraMax i3 Multi-Mode Detection Platform User Guide
164 5025027 A
2
1
DON’T MOVE
CARTRIDGE
DRAWER
MANUALLY
ONLY LOAD / REMOVE
CARTRIDGES BY PRESSING
TOP READ BUTTON ON LEFT
Item Description
1 Detection cartridge drawer
2 Detection cartridge drawer transport lock
Figure 7-5: Detection Cartridge Drawer Transport Lock
18. Align the detection cartridge transport lock with the threaded hole on the floor of thedetection cartridge drawer chamber, and then turn the transport lock clockwise to lockthe detection cartridge drawer in place.
19. Replace the front cover by aligning themagnets on the inside of the front cover with themagnets on the instrument base.
For information on packing the instrument in its original container, see Packing theInstrument on page 166.

Chapter 7: Maintenance and Troubleshooting
5025027 A 165
Disconnecting the Instrument Cables
Before disconnecting the cables, make sure that you have disconnecting the gas supply line,if applicable. See Connecting and Disconnecting a Gas Supply on page 68.
Note: If you are disconnecting the SpectraMax MiniMax Imaging Cytometer, do notuse this procedure. See Packing the Cytometer for Storage or Service on page 112.
1
3 4 5
2
Item Description
1 USB Port
2 Gas inlet quick-connect fitting
3 Power port
4 Fuse carrier
5 Power switch
Figure 7-6: Power Switch, Fuses, and Connection Ports

SpectraMax i3 Multi-Mode Detection Platform User Guide
166 5025027 A
To disconnect the instrument cables:
1. Make sure that the SoftMax Pro Software is not running.
2. Turn off the connected computer.
3. Switch the power switch on the back of the instrument to the off position.
4. Unplug the power cord from the power port on the back of the instrument.
5. Unplug the power cord from the grounded electrical wall outlet.
6. Disconnect the USB cable from the USB port on the back of the instrument.
7. Disconnect the USB cable from the controlling computer.
8. Store the power cord and the USB cable in the instrument accessories toolbox.
Packing the Instrument
The original packaging is specifically designed to protect the instrument duringtransportation.Detection cartridges must be packed and shipped separately from the instrument.
WARNING! LIFTING HAZARD. To prevent injury, use at least two people tolift the instrument.
CAUTION!When transporting the instrument, warranty claims are void if damageduring transport is caused by improper packing.
To pack the instrument in the original packaging:
1. Make sure that all detection cartridges and microplates have been removed and thetransport locks have been installed. See Installing the Transport Locks on page 161.
2. Make sure that the SoftMax Pro Software is not running and that the computer is turnedoff.
3. Make sure that the power switch on the back of the instrument is in the off position andthat the power cord and USB cables are disconnected from the instrument. SeeDisconnecting the Instrument Cables on page 165.
4. Store the power cord and the USB cable in the instrument accessories toolbox.
5. If applicable, make sure the gas supply line is disconnected. See Connecting andDisconnecting a Gas Supply on page 68.
6. If applicable, make sure the SpectraMax MiniMax Imaging Cytometer has been removedand stored. See Packing the Cytometer for Storage or Service on page 112.

Chapter 7: Maintenance and Troubleshooting
5025027 A 167
7. Wrap the SpectraMax i3 Instrument in static-free plastic.
8. Replace the two pieces ofmolded foam packaging on each end of the instrument.
1
2
Item Description
1 Accessory Tool Box
2 SpectraMax i3 Instrument
Figure 7-7: Removing the Accessory Tool Box and the Foam Packing
CAUTION! Keep the instrument upright and level when lifting. Do not tip or shakethe instrument to prevent damage to themoving components inside theinstrument.
9. Place the accessories box in the foam packaging above the instrument.

SpectraMax i3 Multi-Mode Detection Platform User Guide
168 5025027 A
10. Place the instrument and accessories box on the flat cardboard piece and slide it into theoriginal box.
Figure 7-8: Sliding the Instrument into the Box
11. Fold the cardboard flap up inside the box.
Figure 7-9: Folding the Cardboard Flap Inside the Box

Chapter 7: Maintenance and Troubleshooting
5025027 A 169
12. Along the side labeled Open Here, close the box and seal it with packing tape.
OPEN HERE
Figure 7-10: Closing the Box

SpectraMax i3 Multi-Mode Detection Platform User Guide
170 5025027 A
Troubleshooting
WARNING! Service or maintenance procedures other than those specified in thisguide can be performed only by trained service engineers. When service isrequired, contact a Molecular Devices service engineer.
Perform the following troubleshooting techniques when necessary.
If Then
All LEDs on the status indicator areout.
Check the fuses. See Replacing Fuses on page 158.
The fuses appear burned or thefilaments are broken.
Replace the fuses. See Replacing Fuses on page 158.
All LEDs on the status indicator areout, the power is on, the fuses areokay, and the instrument does notoperate.
Contact Molecular Devices technical support.
The instrument does not respond tocommands from the software.
Check the LED status indicators and respond appropriately. See StatusLEDs on page 73.
Check the USB connections to the instrument and the controllingcomputer.
In the software, verify that the configured USB port matches theUSB port connecting the instrument to the computer. See “Selectingan Instrument” in the SoftMax Pro Software application help or userguide.
Contact Molecular Devices technical support.
Functional failure of a detectioncartridge
Contact Molecular Devices technical support.
Table 7-2: Troubleshooting the Instrument
For more information about the LED status indicators, see Status LEDs on page 73 andCytometer Status LEDs on page 106.

Chapter 7: Maintenance and Troubleshooting
5025027 A 171
Obtaining SupportMolecular Devices is a leading worldwidemanufacturer and distributor of analyticalinstrumentation. We are committed to the quality of our products and to fully supportingour customers with the highest possible level of technical service.Our support web site, www.moleculardevices.com/support.html, has a link to theKnowledge base with technical notes, software upgrades, and other resources. If you do notfind the answers you are seeking, follow the links to the Technical Support Service RequestForm to send an email message to a pool of technical support representatives.You can contact your local representative or contact Molecular Devices Technical Support bytelephone at 800-635-5577 (U.S. only) or +1 408-747-1700. In Europe call +44 (0) 118 944 8000.Please have the system ID number, system serial number, software version number, and thesystem owner’s name available when you call.
WARNING! BIOHAZARD. It is your responsibility to decontaminatecomponents of the instrument before requesting service by a service engineer orreturning parts to Molecular Devices for repair. Molecular Devices will not acceptany items which have not been decontaminated where it is appropriate to do so.If any parts are returned, they must be enclosed in a sealed plastic bag stating thatthe contents are safe to handle and are not contaminated.

SpectraMax i3 Multi-Mode Detection Platform User Guide
172 5025027 A

5025027 A 173
Appendix A: Instrument Specifications
This appendix provides specifications for the SpectraMax i3 Instrument base unit and theSpectraMax MiniMax Imaging Cytometer.The specifications for each of the optional detection cartridges are in the section describingthe specific cartridge. See Available Detection Cartridges on page 123.
Measurement SpecificationsThe following tables list themeasurement specifications of the SpectraMax i3 Instrument.For the specifications of each of the optional detection cartridges, see the section describingthe specific cartridge in Available Detection Cartridges on page 123.For measurement specifications of the SpectraMax MiniMax Imaging Cytometer, seeCytometer Measurement Specifications on page 176.
Item Description
Wavelength range 230 nm to 1000 nm
Wavelength selection Monochromator tunable in 1 nm increments
Wavelength bandwidth ~4.0 nm full width half maximum
Wavelength accuracy ±2.0 nm across wavelength range
Wavelength repeatability ±1.0 nm
Photometric range 0.000 to 4.000 OD
Photometric resolution 0.001 OD
Photometric accuracy/linearity, 0.0 to2.0 OD
< ±0.010 OD ±1.0%, 0 to 2 OD
Photometric precision (repeatability) < ±0.003 OD ±1.0%, 0 to 2 OD
Stray light ≤ 0.05% at 230 nm
Photometric stabilization Instantaneous
Photometric drift None (continuous referencing of monochromatic input)
Calibration Automatic before every endpoint read and before the first kineticread
Optical alignment None required
Light source High power Xenon flash lamp
Average lamp lifetime(Based on specifications from themanufacturer. Individual average lamplifetime can vary.)
1 billion flashes or 2 years normal operation(approx. 500,000 96-well microplates at normal speed or 400,000384-well microplates at speed read)
Photodetectors Silicon photodiode
Table A-1: Absorbance Measurement Specifications of the SpectraMax i3 Instrument
A

SpectraMax i3 Multi-Mode Detection Platform User Guide
174 5025027 A
Item Description
Sensitivity (top read)For properly functioning, operating, andmaintained equipment
96-wellGuaranteed: 3 pM fluoresceinOptimized: 0.5 pM fluorescein384-wellGuaranteed: 4 pM fluoresceinOptimized: 1 pM fluorescein
Sensitivity (bottom read)For properly functioning, operating, andmaintained equipment
96-wellGuaranteed: 10 pM fluoresceinOptimized: 5 pM fluorescein384-wellGuaranteed: 20 pM fluoresceinOptimized: 5 pM fluorescein
Wavelength range EX: 250 nm to 830 nmEM: 270 nm to 850 nm
Wavelength accuracy ±2 nm
Wavelength precision ±1 nm
Wavelength selection Monochromators tunable in 1.0 nm increments
Bandwidth EX: 9 nm or 15 nmEM: 15 nm or 25 nm
Number of excitation/emission pairs permicroplate
4
Dynamic range >106 in 96-well black plates: auto gain circuitry
System validation Self calibrating with built-in fluorescence calibrators
Light source High power Xenon flash lamp; LEDs in the visible range
Average lamp lifetime 1 billion flashes or 2 years normal operation
Detector Photo multiplier tube
Table A-2: Fluorescence Intensity Measurement Specification of the SpectraMax i3Instrument

Appendix A: Instrument Specifications
5025027 A 175
Item Description
Sensitivity (top read)For properly functioning, operating, and maintainedequipment
96-wellGuaranteed: 75 pM ATP-GlowOptimized: 15 pM ATP-Glow384-wellGuaranteed: 200 pM ATP-GlowOptimized: 30 pM ATP-Glow
Wavelength range 300 nm to 850 nm
Wavelength accuracy ±2 nm
Wavelength precision ±1 nm
Dynamic range >6 decades
Crosstalk <0.3% in white 96-well<0.3% in white 384-well
Table A-3: Luminescence Measurement Specifications of the SpectraMax i3 Instrument

SpectraMax i3 Multi-Mode Detection Platform User Guide
176 5025027 A
Cytometer Measurement SpecificationsThe following tables list themeasurement specifications of the SpectraMax MiniMax ImagingCytometer and the SpectraMax i3 Platform Transmitted Light (TL) Detection Cartridge.
Item Description
Light source Proprietary, solid-state illumination
Wavelength range EX: 460 nmEM: 535 nm
Detector 1.25 megapixel, 12-bit, high-sensitivity CCD camera
Objective Single 4X objective
Resolution 1.8 μm x 1.8 μm pixel size
Autofocus Proprietary laser-scanning autofocus
Microplates 96-well and 384-well, flat-bottom, clear-bottom, ANSI/SBS-conformant microplates
Table A-4: Measurement Specification for SpectraMax MiniMax Imaging Cytometer
Item Description
Detection cartridge name Transmitted Light (TL) Detection Cartridge
Short name TL
Part number 5022671
Weight 1.5 lbs (0.7 kg)
Read modes Imaging
Type Transmitted light
Number of slots 1
Light source Ultra high power LED
Wavelength range White light, brightfield
Table A-5: Measurement Specification for Transmitted Light (TL) Detection Cartridge

Appendix A: Instrument Specifications
5025027 A 177
Computer System SpecificationsSoftMax Pro Software version 6 can be installed on a computer with the following systemspecifications.The SpectraMax i3 Instrument requires a computer with at least one USB 2.0 port forconnecting the instrument to the computer.
Item Minimum Recommended
Processor Single-core, 2 GHz or faster Quad core or faster
Operating system Windows XP, 32-bit (x86), withService Pack 3 and.NET Framework 4.0(.NET Framework 4.0 is installedautomatically by the SoftMax ProSoftware installer if necessary.)
Windows 7, 32-bit or 64-bit (x86 or x64)
Data connection USB 2.0 port USB 2.0 ports
Memory 2 GB RAM 4 GB RAMIf running on a virtual machine, MolecularDevices recommends at least 6 GB RAM. Forautomation, Molecular Devices recommends atleast 8 GB RAM.
Hard disk 500 MB of available space 1 GB of available space, or more
Graphics display Graphics display adapter1024 x 768 or higher-resolutiondisplay
32-bit graphics display with 256 MB video RAM1280 x 1024 or higher-resolution display
Software installationand activation
CD/DVD driveInternet connection or external USBdrive
CD/DVD driveInternet connection
Table A-6: Minimum and Recommended Requirements for SoftMax Pro Software
The SpectraMax MiniMax Imaging Cytometer requires additional minimum computersystem specifications beyond those required for the SoftMax Pro Software. See ImagingCytometer Computer System Specifications on page 178.

SpectraMax i3 Multi-Mode Detection Platform User Guide
178 5025027 A
Imaging Cytometer Computer System SpecificationsThe SpectraMax MiniMax Imaging Cytometer requires additional minimum computersystem specifications beyond those required for the standard SoftMax Pro Softwareinstallation.
Item Requirement
Processor Intel i5, 2.8 GHz, quad core or greater
Operating system Windows 7, 64-bit (x64)
Data connection Two (2) or more USB 2.0 ports
Memory 8 GB or more DDR3 SDRAM at 1333 MHz
Hard disk 500 GB or larger, 7200 RPM or faster hard disk with a 32 MB or morebuffer
Graphics display 512 MB nVIDIA graphics display1280 x 1024 or higher-resolution display
Software installation andactivation
CD/DVD driveInternet connection or external USB drive
Table A-7: Minimum Computer System Requirements for the SpectraMax MiniMaxImaging Cytometer
For optimum results, turn off all sleep and hibernation settings for the hard disk, the CPU,and the USB ports. Also, disable automatic Windows Updates. You can updateWindowsmanually when the instrument is not being used by the software. You can set these optionsin Windows Control Panel.

Appendix A: Instrument Specifications
5025027 A 179
Physical SpecificationsThe following tables list the physical specifications of the SpectraMax i3 Instrument and theSpectraMax MiniMax Imaging Cytometer.
Item Description
Environment Indoor use only
Power requirementsSpectraMax i3 Instrument alone
100 VAC to 240 VAC ±10%, 2 amps, frequency range: 50/60 Hz
Power requirementsSpectraMax i3 Instrument andSpectraMax MiniMax ImagingCytometer together
100 VAC to 240 VAC ±10%, frequency range: 50/60 Hz, Max. 350 VA
DimensionsSpectraMax i3 Instrument alone
39.20 cm W x 32.50 cm H x 60.55 cm L(15.43 in. W x 12.80 in. H x 23.84 in. L)
DimensionsSpectraMax MiniMax ImagingCytometer alone
39.20 cm W x 20.09 cm H x 60.55 cm L(15.43 in. W x 7.91 in. H x 23.84 in. L)
DimensionsSpectraMax i3 Instrument andSpectraMax MiniMax ImagingCytometer together
39.20 cm W x 44.43 cm H x 60.55 cm L(15.43 in. W x 17.49 in. H x 23.84 in. L)
WeightSpectraMax i3 Instrument alone
Without detection cartridges: 31 kg (68.3 lbs)For detection cartridge weights, see the detection cartridge chapters.
WeightSpectraMax MiniMax ImagingCytometer alone
17.7 kg (39 lbs)
WeightSpectraMax i3 Instrument andSpectraMax MiniMax ImagingCytometer together
48.7 kg (107.3 lbs)
Power disconnect and ventilationclearance (rear)
20 cm to 30 cm (7.9 in. to 11.8 in.) between the back of the instrumentand the wall
Drawer clearance (front) 18 cm (7.1 in.) for the microplate drawer and 15 cm (5.9 in.) for thedetection cartridge drawer
Ambient operating temperature 15°C to 40°C (59°F to 104°F)
Ambient storage temperature -5°C to 40°C (23°F to 104°F) continuous;-20°C to 50°C (-4°F to 122°F) transient(up to 10 hours)
Humidity restrictions 15% to 75% (non-condensing) at 30°C (86°F)
Altitude restrictions Up to 2000 m (6562 ft)
Air pressure restrictions 54 kPa to 106 kPa (7.8 PSI to 15.4 PSI)
Table A-8: Physical Specifications of the SpectraMax i3 Instrument

SpectraMax i3 Multi-Mode Detection Platform User Guide
180 5025027 A
Item Description
Sound pressure level Maximum sound pressure: 73 dBAMaximum sound pressure at one meter: 68 dBA
Installation category II
Pollution degree 2
Fuses 250 V, 4 amp, 5 x 20 mm, slow-blow,UL recognized/CSA/VDE(part number: S US 400 153)
Data connectionSpectraMax i3 Instrument alone
One (1) USB 2.0 port
Data connectionSpectraMax i3 Instrument andSpectraMax MiniMax ImagingCytometer together
Three (3) USB 2.0 ports
Table A-8: Physical Specifications of the SpectraMax i3 Instrument (continued)
Item Description
Temperature range 4°C (7.2°F) above ambient to 45°C (113°F)
Displayed 1°C (1.8°F) increments
Accuracy ±1°C (1.8°F) at 37°C set point
Uniformity ±0.75°C (1.4°F)
Gas inlet specification Maximum air supply pressure: 0.4 MPa
Gas tubingspecification
Polyurethane tubing, outside diameter = 4.0 mm
Table A-9: Environmental Controls of the SpectraMax i3 Instrument
WARNING! Use a compressed gas supply in a well ventilated area. Theinstrument is not air-tight, and so gas can escape into the atmosphere surroundingthe instrument. When using potentially toxic gas, always observe the appropriatecautionary procedures as defined by your safety officer to maintain a safe workingenvironment.
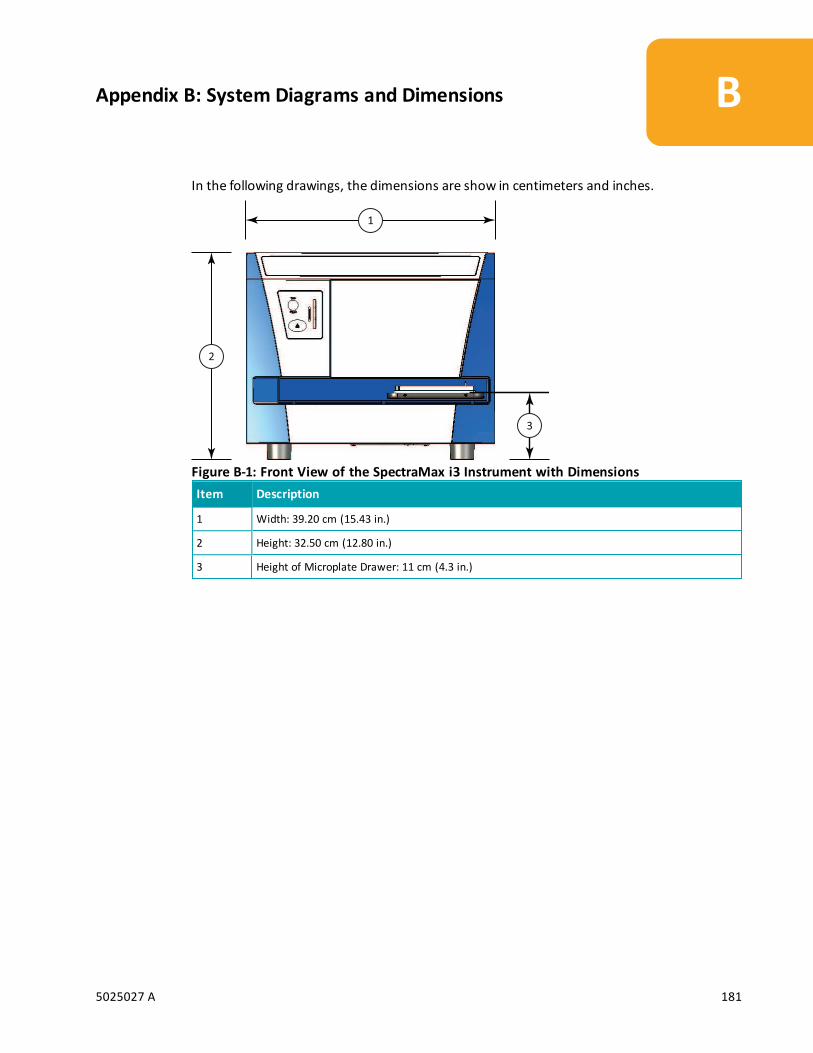
5025027 A 181
Appendix B: System Diagrams and Dimensions
In the following drawings, the dimensions are show in centimeters and inches.
3
1
2
Item Description
1 Width: 39.20 cm (15.43 in.)
2 Height: 32.50 cm (12.80 in.)
3 Height of Microplate Drawer: 11 cm (4.3 in.)
Figure B-1: Front View of the SpectraMax i3 Instrument with Dimensions
B
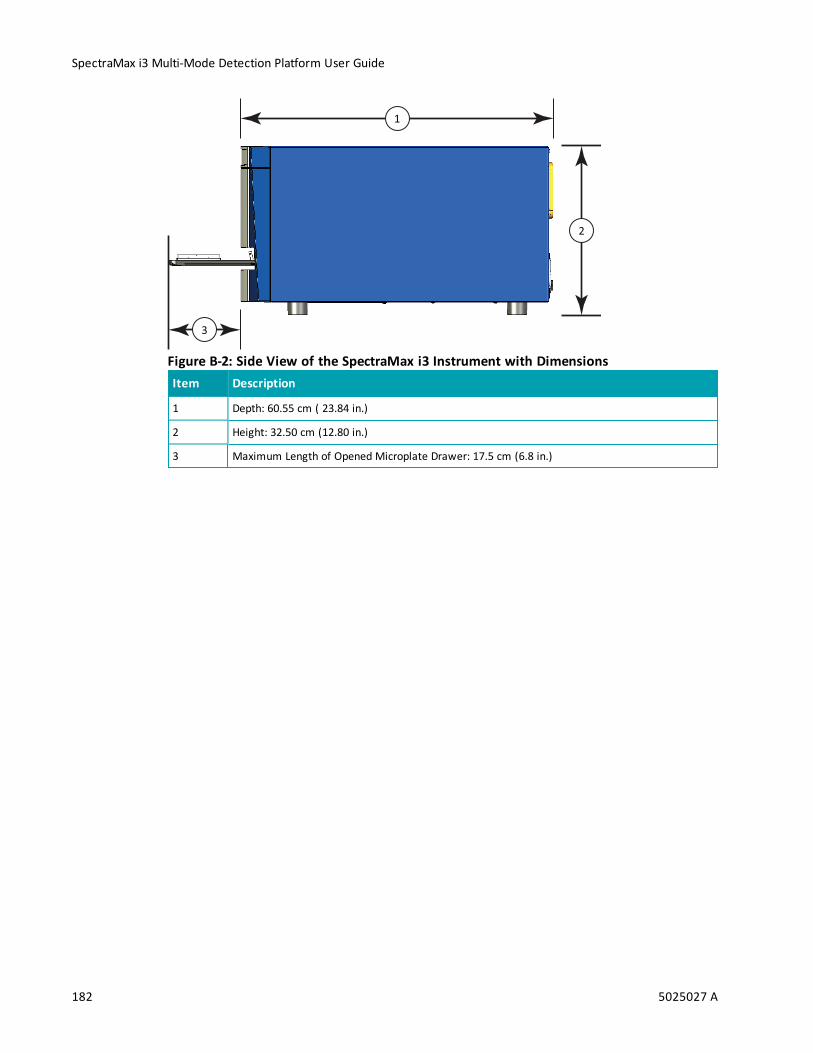
SpectraMax i3 Multi-Mode Detection Platform User Guide
182 5025027 A
3
1
2
Item Description
1 Depth: 60.55 cm ( 23.84 in.)
2 Height: 32.50 cm (12.80 in.)
3 Maximum Length of Opened Microplate Drawer: 17.5 cm (6.8 in.)
Figure B-2: Side View of the SpectraMax i3 Instrument with Dimensions

Appendix B: System Diagrams and Dimensions
5025027 A 183
3
2
1
Item Description
1 Full Height: 20.09 cm (7.91 in.)
2 Height of Housing: 14.43 cm (5.68 in.)
3 Width: 39.20 cm (15.43 in.)
Figure B-3: Front View of the SpectraMax MiniMax Imaging Cytometer with Dimensions
3
2
1
Item Description
1 Full Height: 20.09 cm (7.91 in.)
2 Height of Housing: 14.43 cm (5.68 in.)
3 Depth: 60.55 cm ( 23.84 in.)
Figure B-4: Side View of the SpectraMax MiniMax Imaging Cytometer with Dimensions
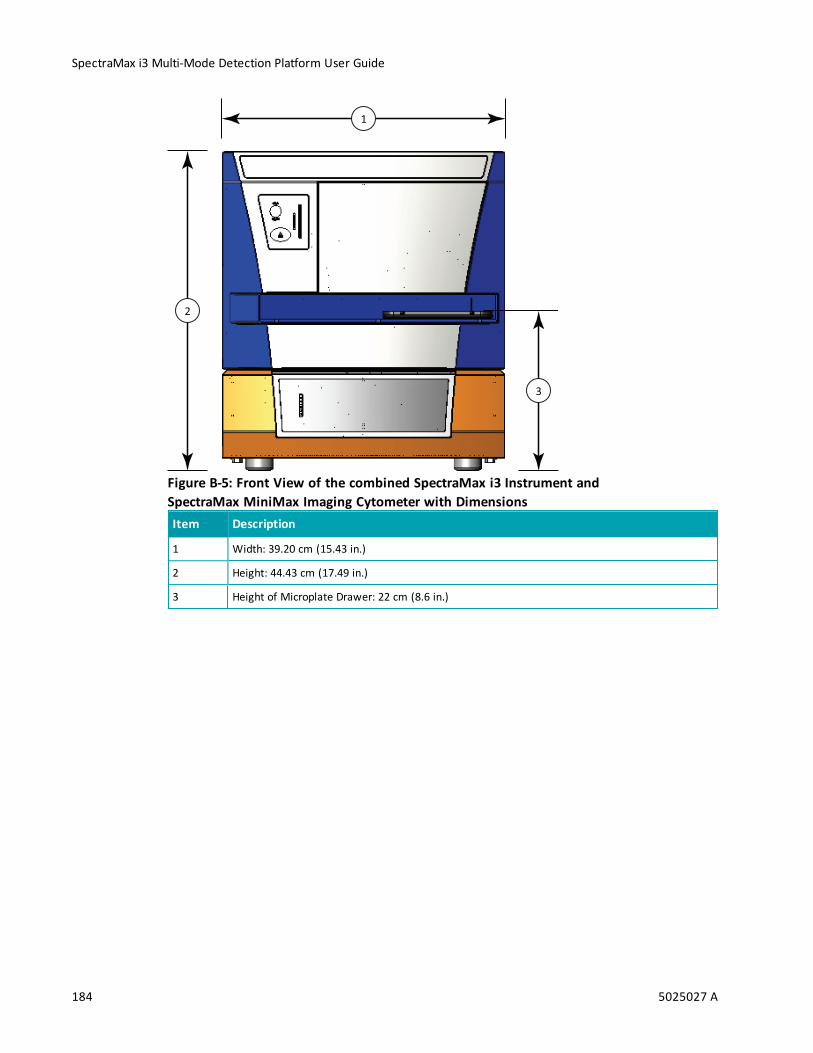
SpectraMax i3 Multi-Mode Detection Platform User Guide
184 5025027 A
1
2
3
Item Description
1 Width: 39.20 cm (15.43 in.)
2 Height: 44.43 cm (17.49 in.)
3 Height of Microplate Drawer: 22 cm (8.6 in.)
Figure B-5: Front View of the combined SpectraMax i3 Instrument andSpectraMax MiniMax Imaging Cytometer with Dimensions

Appendix B: System Diagrams and Dimensions
5025027 A 185
3
1
2
Item Description
1 Depth: 60.55 cm ( 23.84 in.)
2 Height: 44.43 cm (17.49 in.)
3 Maximum Length of Opened Microplate Drawer: 17.5 cm (6.8 in.)
Figure B-6: Side View of the the combined SpectraMax i3 Instrument andSpectraMax MiniMax Imaging Cytometer with Dimensions

SpectraMax i3 Multi-Mode Detection Platform User Guide
186 5025027 A
5025027 A 187
Appendix C: Electromagnetic Compatibility
REGULATORY INFORMATION FOR CANADA (ICES/NMB-001:2006)This ISM device complies with Canadian ICES-001.Cet appareil ISM est confomre à la norme NMB-001 du Canada.
ISM EQUIPMENT CLASSIFICATION (Group 1, Class A)This equipment is designated as scientific equipment for laboratory use that intentionallygenerate and/or use conductively coupled radio-frequency energy for internal functioning,and are suitable for use in all establishments, other than domestic and those directlyconnected to a low voltage power supply network which supply buildings used for domesticpurposes.
INFORMATION TO THE USER (FCC NOTICE)This equipment has been tested and found to comply with the limits for non-consumer ISMequipment, pursuant to part 18 of the FCC Rules. These limits are designed to providereasonable protection against harmful interference in a non-residential installation. Thisequipment generates, uses, and can radiate radio frequency energy and if not installed andused in accordance with the instructions, may cause harmful interference to radiocommunications. However, there is no guarantee that interference will not occur in aparticular installation. If this equipment does cause harmful interference to radio ortelevision reception, which can be determined by turning the equipment off and on, the useris encouraged to try to correct the interference by one or more of the following measures:
Reorient or relocate the receiving antenna.
Increase the separation between the equipment and receiver.
Connect the equipment into an outlet on a circuit different from that to which thereceiver is connected.
Consult the dealer or an experienced radio/TV technician for help.
In order to maintain compliance with FCC regulations, shielded cables must be used with thisequipment. Operation with non-approved equipment or unshielded cables is likely to resultin interference to radio and TV reception. The user is cautioned that changes andmodifications made to the equipment without the approval of themanufacturer could voidthe user's authority to operate this equipment.
C

SpectraMax i3 Multi-Mode Detection Platform User Guide
188 5025027 A
5025027 A 189
Glossary
A
AbsorbanceAbsorbance is the amount of light absorbed by a solution. To measure absorbanceaccurately, it is necessary to eliminate light scatter. In the absence of turbidity,absorbance = optical density.
A = log10(I0 /I) = –log
10(I/I
0)
where I0is incident light before it enters the sample, I is the intensity of light after it passes
through the sample, and A is themeasured absorbance.See Absorbance Read Mode on page 22.
AlphaScreenALPHA stands for Amplified Luminescent Proximity Homogeneous Assay. AlphaScreen® is abead-based chemistry used to study molecular interactions between moieties A and B, forexample. When a biological interaction between A and B brings beads (coated with A and B,respectively) together, a cascade of chemical reactions acts to produce a greatly amplifiedsignal.The cascade finally resulting in signal is triggered by laser excitation (680 nm), making aphotosensitizer on the A-beads convert oxygen to an excited (singlet) state. That energizedoxygen diffuses away from the A-bead. When reaching the B-bead in close proximity, it reactswith a thioxene derivative on the B-bead generating chemiluminescence at 370 nm. Energytransfer to a fluorescent dye on the same bead shifts the emission wavelength into the 520nm to 620 nm range. The limited lifetime of singlet oxygen in solvent (~4microseconds)allows diffusion reach only up to about 200 nm distance. Thus, only B-beads in the proximityof A-beads yield signal, which indicates binding between moieties A and B.An AlphaScreen measurement includes a light pulse, by turning on the laser diode for aspecified time, turning off the laser diode, followed by themeasurement of the AlphaScreensignal, as specified in themeasurement protocol timing parameters.
Note: AlphaScreen beads are light sensitive. Beads are best handled under subdued(<100 lux) or green filtered (Roscolux filters #389 from Rosco, or equivalent) lightconditions. Perform incubation steps in the dark.
See AlphaScreen Read Mode on page 49.

SpectraMax i3 Multi-Mode Detection Platform User Guide
190 5025027 A
E
Emission Spectrum ScanAn emission spectrum scan measures fluorescence or luminescence across a spectrum ofwavelengths. Fluorescent reads use the emitted light from a fixed excitation wavelength. Thedefault value reported for each well is the wavelength ofmaximum emission in either RFU forfluorescencemode or RLU for luminescencemode.See Excitation Spectrum Scan on page 190.
EndpointIn an Endpoint read, a reading of each microplate well is taken in the center of each well, at asingle wavelength or at multiple wavelengths. Depending on the read mode, raw data valuesare reported as optical density (OD), %Transmittance (%T), relative fluorescence units (RFU),or relative luminescence units (RLU).See Endpoint Read Type on page 20.
Excitation Spectrum ScanAn excitation spectrum scan measures fluorescence at a single emission wavelength for theemitted light across a spectrum of excitation wavelengths. The default value reported foreach well is the wavelength ofmaximum fluorescence excitation in RFU.See Emission Spectrum Scan on page 190.
F
FluorescenceFluorescence occurs when absorbed light is re-radiated at a longer wavelength. In theFluorescence Intensity (FL) read mode, the instrument measures the intensity of the re-radiated light and expresses the result in Relative Fluorescence Units (RFU).The governing equation for fluorescence is:
Fluorescence = extinction coefficient × concentration × quantum yield ×excitation intensity × pathlength × emission collection efficiency
See Fluorescence Intensity Read Mode on page 27.

Glossary
5025027 A 191
Fluorescence PolarizationFluorescence polarization detection is similar to fluorescence intensity, with the importantdifference that it uses plane-polarized light, rather than non-polarized light. Plate readersmeasure FP of the sample by detecting light emitted both parallel and perpendicular to theplane of excitation.By using a fluorescent dye to label a small molecule, its binding to another molecule of equalor greater size can bemonitored through its speed of rotation.See Fluorescence Polarization Read Mode on page 45.
FluorophoreA fluorophore is a material that absorbs light energy of a characteristic wavelength,undergoes an electronic state change, and instantaneously emits light of a longerwavelength.See Fluorescence Intensity Read Mode on page 27, Time-Resolved Fluorescence Read Modeon page 36, and Fluorescence Polarization Read Mode on page 45.
G
G FactorThe G factor, or grating factor, is used in fluorescence polarization to correct polarizationdata for optical artifacts, converting relativemP data to theoretical mP data. Opticalsystems, particularly with reflective components, pass light of different polarization withdifferent efficiency. G factor corrects this instrumental bias.See Data Reduction on page 47.
I
ImagingImaging read mode conducts whole-cell imaging assays.Whole-cell imaging assays are cell-based, or object-based, rather than the single-pointmeasurements found in other types ofmicroplate reads. These types of assays can yieldmore biologically meaningful results that can discriminate the fluorescence associated withobjects, such as cells or beads, from the bulk solution within a microplate well.See Imaging Read Mode on page 53.

SpectraMax i3 Multi-Mode Detection Platform User Guide
192 5025027 A
Intensity ThresholdThe intensity threshold defines the level of intensity in an image where cells are detected. Aglobal intensity threshold is applied evenly across all the pixels in the image. Only thoseobjects that fall within the boundaries of the defined intensity threshold are detected. A localintensity threshold is applied separately to each pixel in the image. As the backgroundintensity rises and falls, the defined intensity threshold rises and falls at the same rate abovethe background. This "local" threshold analysis helps to detect cells in areas of the imagewhere the intensity is uneven.See Global Intensity Threshold and Local Intensity Threshold on page 55.
K
KineticIn a Kinetic read, the instrument collects data over timewith multiple readings taken atregular intervals.The values calculated based on raw kinetic data include VMax, VMax per Sec, Time to VMax,and Onset Time. Kinetic readings can be single-wavelength or multiple-wavelength readings.See Kinetic Read Type on page 20.
L
LuminescenceLuminescence is the emission of light by processes that derive energy from essentially non-thermal changes, themotion of subatomic particles, or the excitation of an atomic system byradiation. Luminescence detection relies on the production of light from a chemical reactionin a sample.See Luminescence Read Mode on page 31.

Glossary
5025027 A 193
O
Optical Density (OD)Optical density (OD) is the amount of light passing through a sample to a detector relative tothe total amount of light available. Optical Density includes absorbance of the sample pluslight scatter from turbidity and background. You can compensate for background usingblanks.A blank well contains everything used with the sample wells except the chromophore andsample-specific compounds. Do not use an empty well for a blank.Some applications are designed for turbid samples, such as algae or other micro-organismsin suspension. The reported OD values for turbid samples are likely to be different when readby different instruments.See Absorbance Read Mode on page 22.
P
PathCheck TechnologyThe temperature-independent PathCheck® Pathlength Measurement Technologynormalizes your absorbance values to a 1 cm path length based on the near-infraredabsorbance of water.The Beer–Lambert law states that absorbance is proportional to the distance that lighttravels through the sample:
A = εbcwhere A is the absorbance, ε is themolar absorbtivity of the sample, b is the pathlength, andc is the concentration of the sample. The longer the pathlength, the higher the absorbance.Microplate readers use a vertical light path so the distance of the light through the sampledepends on the volume. This variable pathlength makes it difficult to perform extinction-based assays and also makes it confusing to compare results between microplate readersand spectrophotometers.The standard pathlength of a 1 cm cuvette is the conventional basis for quantifying theunique absorptivity properties of compounds in solution. Quantitative analysis can beperformed on the basis of extinction coefficients, without standard curves (for example,NADH-based enzyme assays). When using a cuvette, the pathlength is known and isindependent of sample volume, so absorbance is directly proportional to concentration inthe absence of background interference.See PathCheck Pathlength Measurement Technology on page 23.

SpectraMax i3 Multi-Mode Detection Platform User Guide
194 5025027 A
Photomultiplier Tube (PMT)A Photomultiplier Tube (PMT) is a vacuum tube that can detect light from dim sourcesthrough the use of photo emission and successive instances of secondary emission toproduce enough electrons to generate a useful current.
R
Raw DataRaw data is the signal reported from the instrument with no alteration. This is reported asoptical density (OD), relative fluorescence units (RFU), or relative luminescence units (RLU),depending on the read mode.
Read ModeFor more information on the supported read modes, see the following topics:
Absorbance Read Mode on page 22
Fluorescence Intensity Read Mode on page 27
Luminescence Read Mode on page 31
Time-Resolved Fluorescence Read Mode on page 36
Fluorescence Polarization Read Mode on page 45
AlphaScreen Read Mode on page 49
HTRF Read Mode on page 41
Imaging Read Mode on page 53
Read TypeFor more information on the supported read types, see the following topics:
Endpoint Read Type on page 20
Kinetic Read Type on page 20
Well Scan Read Type on page 21
Spectrum Read Type on page 21
Reduced DataData reduction causes the raw signal values reported by the instrument to be calculated anddisplayed according to user-defined formula settings.

Glossary
5025027 A 195
S
SpectrumDepending on the read mode selected, a Spectrum read measures optical density (OD),%Transmittance (%T), relative fluorescence units (RFU), or relative luminescence units (RLU)across a spectrum ofwavelengths.See Spectrum Read Type on page 21, Emission Spectrum Scan on page 190, and ExcitationSpectrum Scan on page 190.
Stokes ShiftThe Stokes shift is the difference between the wavelengths of the excitation and emissionmaxima, or peaks.See Emission Spectrum Scan on page 190 and Excitation Spectrum Scan on page 190.
T
Time-Resolved Fluorescence (TRF)Time-resolved fluorescence (TRF) is a measurement technique that depends on threecharacteristics that lead to better discrimination between the specific signal, proportional tothe amount of label, and the unspecific fluorescence resulting from background andcompound interference:
Pulsed excitation light sources
Time-gated electronics faster than the fluorescence lifetime
Labels with prolonged fluorescence lifetime
The time-gating electronics introduce a delay between the cut off of each light pulse and thestart of signal accumulation. During the delay, the unspecific fluorescence (caused by testcompounds, assay reagents, and themicroplate) vanishes while only a small portion of thespecific fluorescence from the label is sacrificed. Enough of the specific signal remains duringthe decay period with the added benefit of reduced background.See Time-Resolved Fluorescence Read Mode on page 36.
%Transmittance%Transmittance is the ratio of transmitted light to the incident light for absorbance reads.
T = I/I0
%T = 100Twhere I is the intensity of light after it passes through the sample and I
0is incident light
before it enters the sample.

SpectraMax i3 Multi-Mode Detection Platform User Guide
196 5025027 A
W
Well ScanAWell Scan read can take readings at more than one location within a well. AWell Scan readtakes one or more readings of a single well of a microplate on an evenly spaced grid inside ofeach well at single or multiple wavelengths.Some applications involve the detection of whole cells in large-area tissue culture plates. WellScan reads can be used with such microplates to allowmaximum surface area detection inwhole-cell protocols. Sincemany cell lines tend to grow as clumps or in the corners ofmicroplate wells, you can choose from several patterns and define the number of points tobe scanned to work best with your particular application.SeeWell Scan Read Type on page 21.
Z
Z´Z´ is the standard statistical parameter in the high-throughput screening community formeasuring the quality of a screening assay independent of test compounds. It is used as ameasure of the signal separation between the positive controls and the negative controls inan assay.The value of Z´ can be determined using the following formula:
Z´ = 1 – | Mean
c+ – Mean
c– |
3(SDc+
) + 3(SDc–
)
where SD is the standard deviation, c+ is the positive control, and c– is the negative control.A Z´ value greater than or equal to 0.4 is the generally acceptable minimum for an assay.Higher values might be desired when results aremore critical.Z´ is not linear and can bemade unrealistically small by outliers that skew the standarddeviations in either population. To improve the Z´ value, you can increase the amount oflabel in the sample, if acceptable for the assay, or increase the read time per well.

5025027 A 197
Index
A
ABS
absorbance 22, 189
read mode 22
absorbance
ABS 22, 189
read mode 22
ALPHA
AlphaScreen 49, 125
detection cartridge 124
read mode 49, 125
AlphaLISA 49, 124
AlphaScreen
ALPHA 49, 125
Automix 17
B
biological safety 12
bioluminescence resonance energy transfer(BRET2) 145
BRET2 145
detection cartridge 144
C
carbon dioxide
connection 68
control 18
cartridges, see detection cartridges 78
chemical safety 12
Chroma-Glo
detection cartridge 149
Cisbio HTRF 36
cleaning instrument 157
computer requirements 177
control buttons 72, 105
customer support 171
cytometer 85
D
detection cartridges
ALPHA 124
BRET2 144
Chroma-Glo 149
FI 133, 136
FP 139
GeneBLAzer 136
HTRF 127
installing 78
LUM 141, 144, 149
removing 82
TRF 130
dimensions, instrument 181
drawer
buttons 72, 105
drawings, instrument 181
dual-color luminescence
BRET2 145
ChromaGlo 149
E
electrical safety 9
endpoint
read type 20, 190

SpectraMax i3 Multi-Mode Detection Platform User Guide
198 5025027 A
environmental control 18
F
fast reads 18
FI
detection cartridge 133, 136
FL
fluorescence intensity 27, 190
read mode 27, 190
fluorescence intensity
FL 27, 190
read mode 27, 190
fluorescence polarization
FP 45, 139, 191
read mode 45, 139
FP
detection cartridge 139
fluorescence polarization 45, 139, 191
read mode 45, 139
front panel 72, 105
fuses
replacing 109, 158
G
gas supply
connection 68
control 18
GeneBLAzer
detection cartridge 136
H
hardware requirements 177
homogeneous time-resolved fluorescence(HTRF) 36, 41
HTRF
detection cartridge 127
homogeneous time-resolvedfluorescence 36, 41
read mode 41
I
imaging
acquisition 103
read mode 53
imaging cytometer 85
interfering substances 26
K
key pad 72, 105
kinetic
read type 20, 192
L
laser specifications 10
LED status indicators 73, 106
locking
optics plate 119
locks
removing transport locks 64
LUM
BRET2 145
detection cartridge 141, 144, 149
luminescence 31, 142, 149, 192
read mode 31
luminescence
LUM 31, 142, 149, 192
read mode 31

Index
5025027 A 199
M
maintenance
cleaning 157
fuses 109, 158
packing cytometer 112
packing instrument 161, 166
preventive 156
troubleshooting 170
measurement specifications
instrument 173
microplate
Automix 17
handling 77
loading and unloading 76
on-the-fly detection 18
shaking 17
sizes 77
types 77
moving instrument 160
moving parts 13
O
on-the-fly detection 18
optics plate
locking 119
unlocking 89
optimize
read speed 18
organic solvents 12, 16
P
packing instrument 166
PathCheck technology
settings 23, 193
Peak Pro Analysis 20
physical specifications 179
power cable
connecting 66, 96
disconnecting 113, 165
power switch 66, 96, 113, 165
preventivemaintenance 156
R
read modes 19
ABS 22
ALPHA 49, 125
FL 27, 190
FP 45, 139
HTRF 41
imaging 53
LUM 31
TRF 36
read types
endpoint 20, 190
kinetic 20, 192
spectrum 21, 195
well scan 21, 196
requirements
system 177
S
safety
biological 12
chemical 12
electrical 9
labels 8

SpectraMax i3 Multi-Mode Detection Platform User Guide
200 5025027 A
laser specifications 10
moving parts 13
serial port 177
settings
PathCheck technology 23, 193
water constant 24
shaking microplates 17
shipping protections
removing 89
replacing 119
specifications
instrument dimensions 181
instrument measurements 173
laser 10
physical 179
SpectraMax iLume Imaging Cytometer 85
spectrum
read type 21, 195
status LEDs 73, 106
system requirements 177
T
technical support 171
temperature control 18
time-resolved fluorescence
read mode 36
TRF 36, 131, 195
transport locks
removing 64, 89
replacing 119
TRF
detection cartridge 130
read mode 36
time-resolved fluorescence 36, 131, 195
troubleshooting 170
U
unlocking
optics plate 89
removing transport locks 64
unpacking
cytometer 88
instrument 59
USB adapter 177
USB cable
connecting 66, 96
disconnecting 113, 165
W
water constant
settings 24
well scan
read type 21, 196
Windows 7 177

www.moleculardevices.com