Spectral analysis Kenneth D. Harris 18/2/15. Continuous processes A continuous process defines a...
21
Spectral analysis Kenneth D. Harris 18/2/15
-
Upload
adela-hill -
Category
Documents
-
view
215 -
download
1
Transcript of Spectral analysis Kenneth D. Harris 18/2/15. Continuous processes A continuous process defines a...

Spectral analysisKenneth D. Harris
18/2/15

Continuous processes
• A continuous process defines a probability distribution over the space of possible signals
Sample space =all possible LFP signals
Probability density 0.000343534976
Multivariate Gaussian distribution
• is a random vector (N-dimensional)
• Parameters are mean vector and covariance matrix .
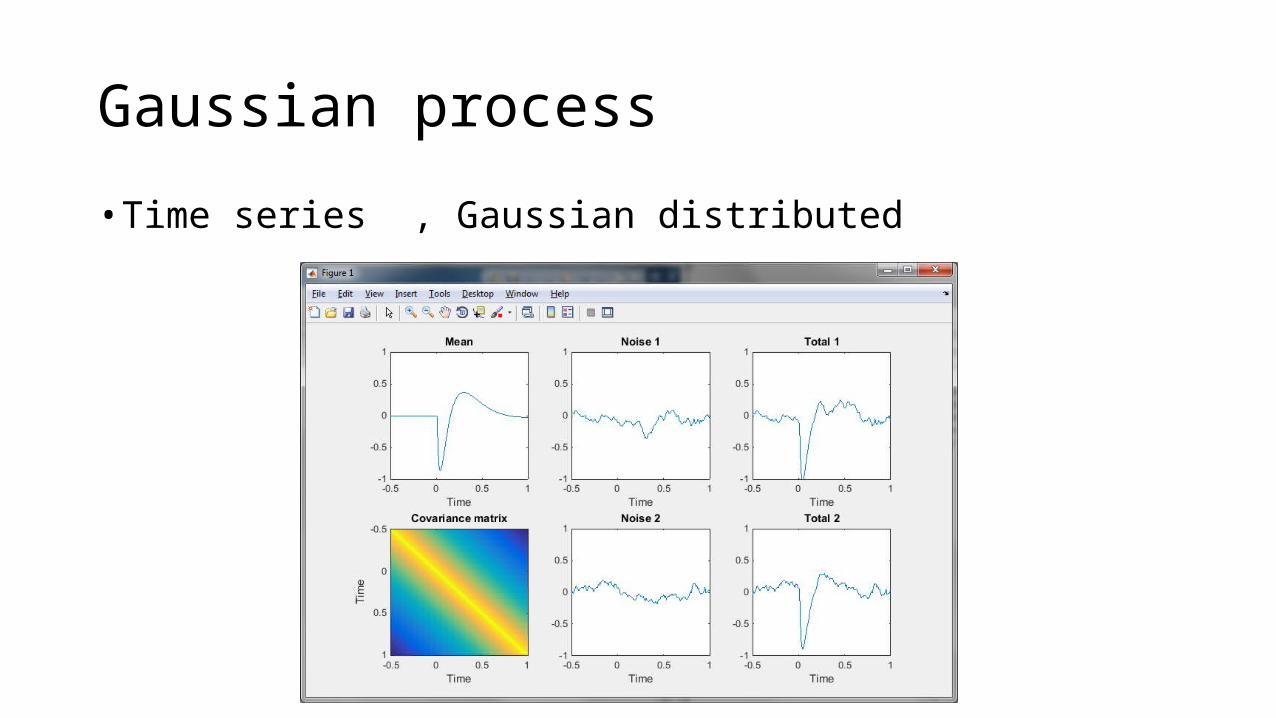
Gaussian process
• Time series , Gaussian distributed
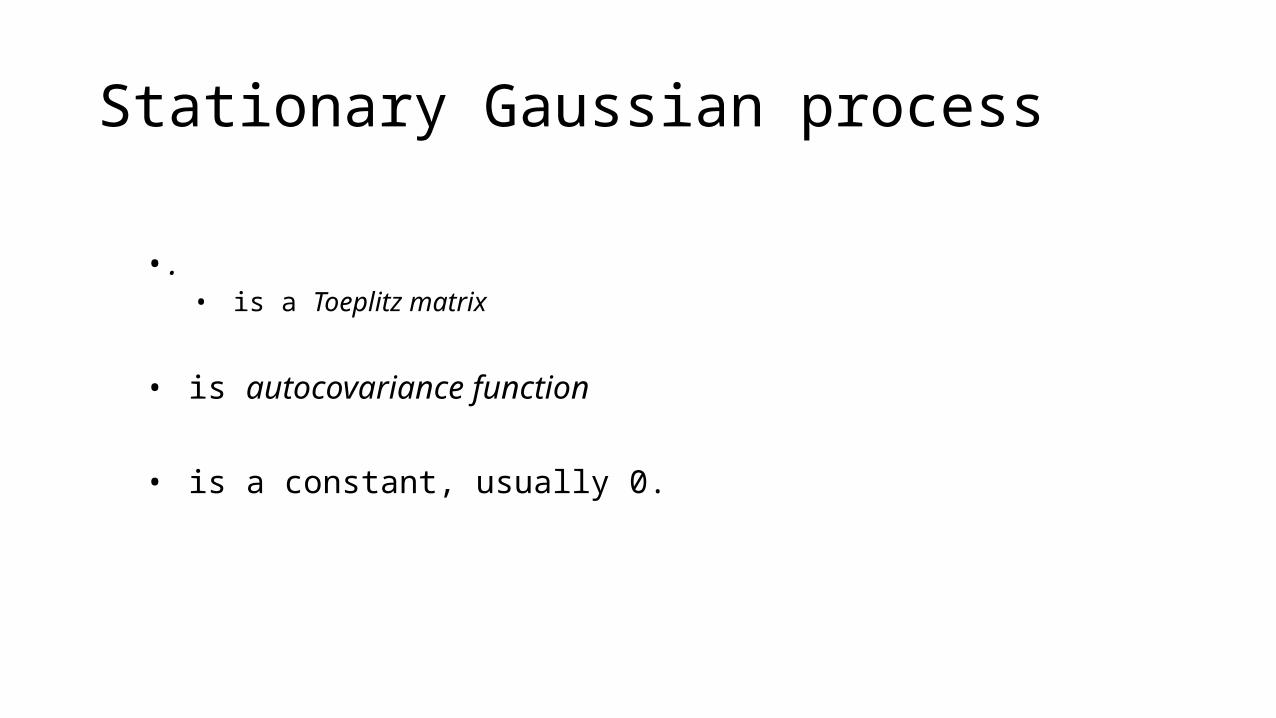
Stationary Gaussian process
• . • is a Toeplitz matrix
• is autocovariance function
• is a constant, usually 0.

Types of covariance matrix
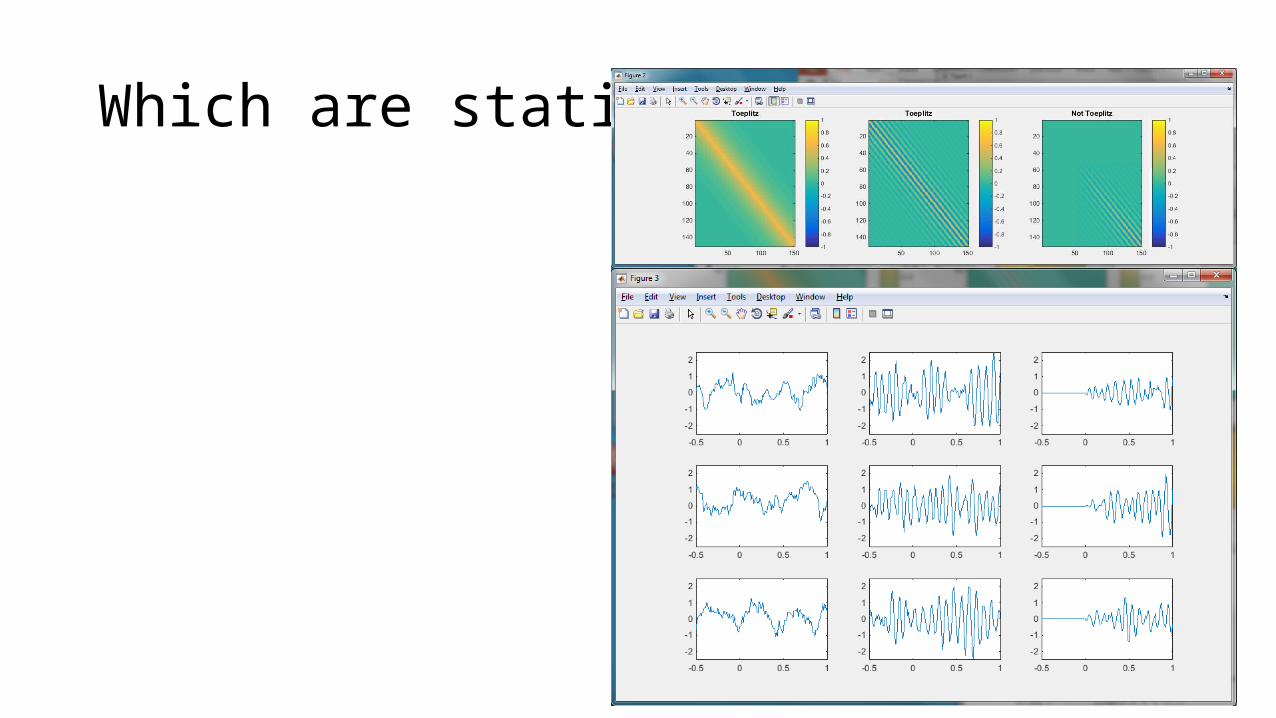
Which are stationary?
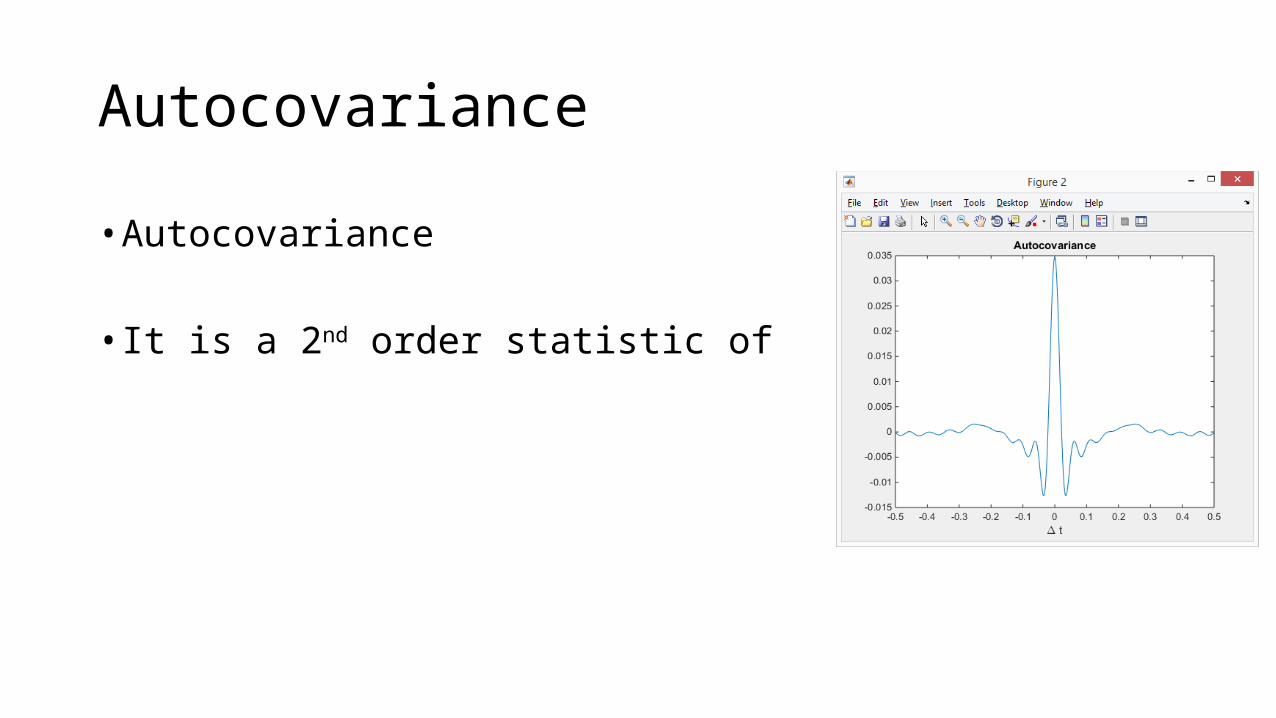
Autocovariance
• Autocovariance
• It is a 2nd order statistic of

Power spectrum estimation error
• Power spectrum is Fourier transform of • Also a second order statistic
• For a Gaussian process, is proportional to a distribution.• Std Dev = Mean, however much data you have
• That’s why estimating power spectrum as is so noisy
Power spectrum estimation
• Need to average to reduce estimation error
• If you observe multiple instantiations of the data, average over them• E.g. multiple trials

Tapering
• Fourier transform assumes a periodic signal
• Periodic signal is discontinuous => too much high-frequency power
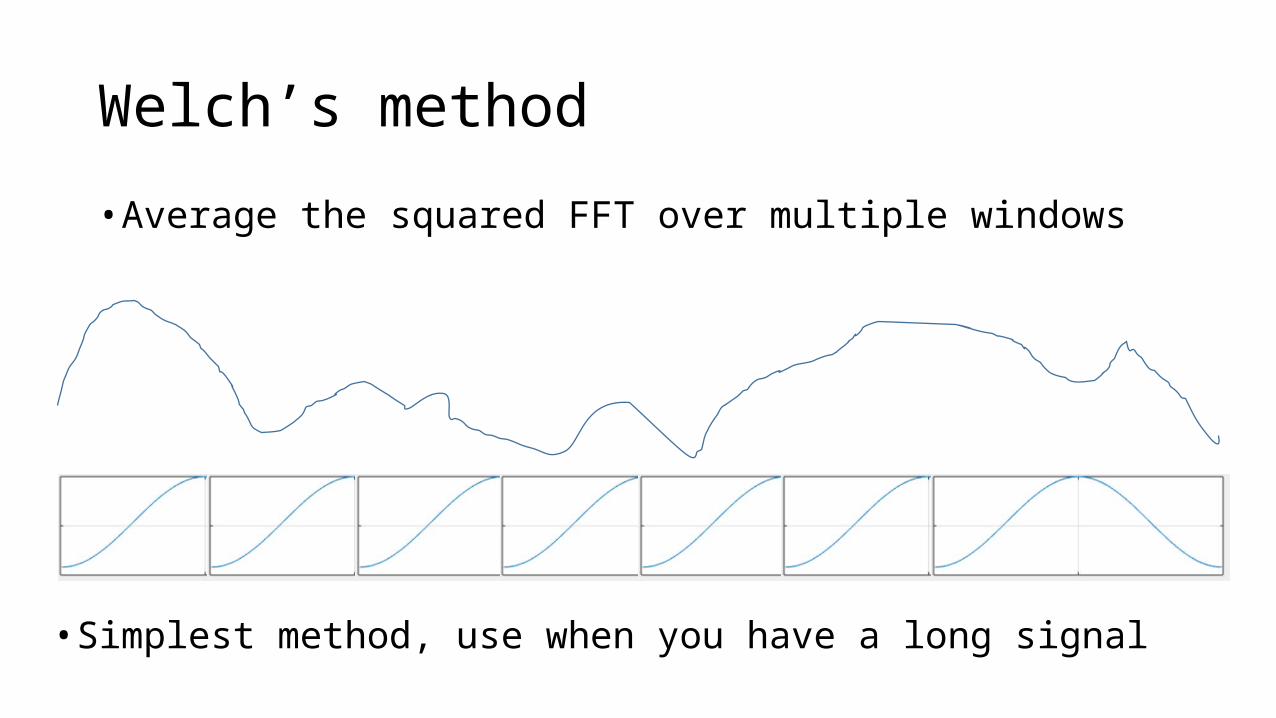
Welch’s method
• Average the squared FFT over multiple windows
• Simplest method, use when you have a long signal
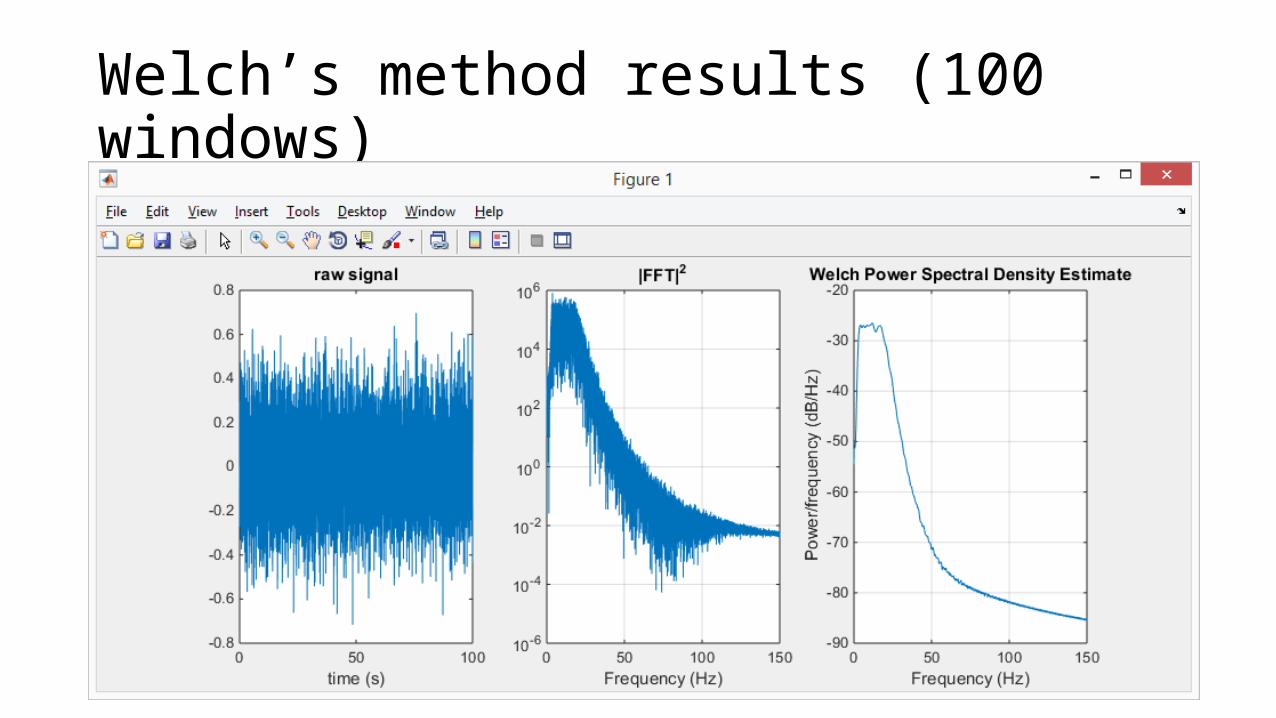
Welch’s method results (100 windows)
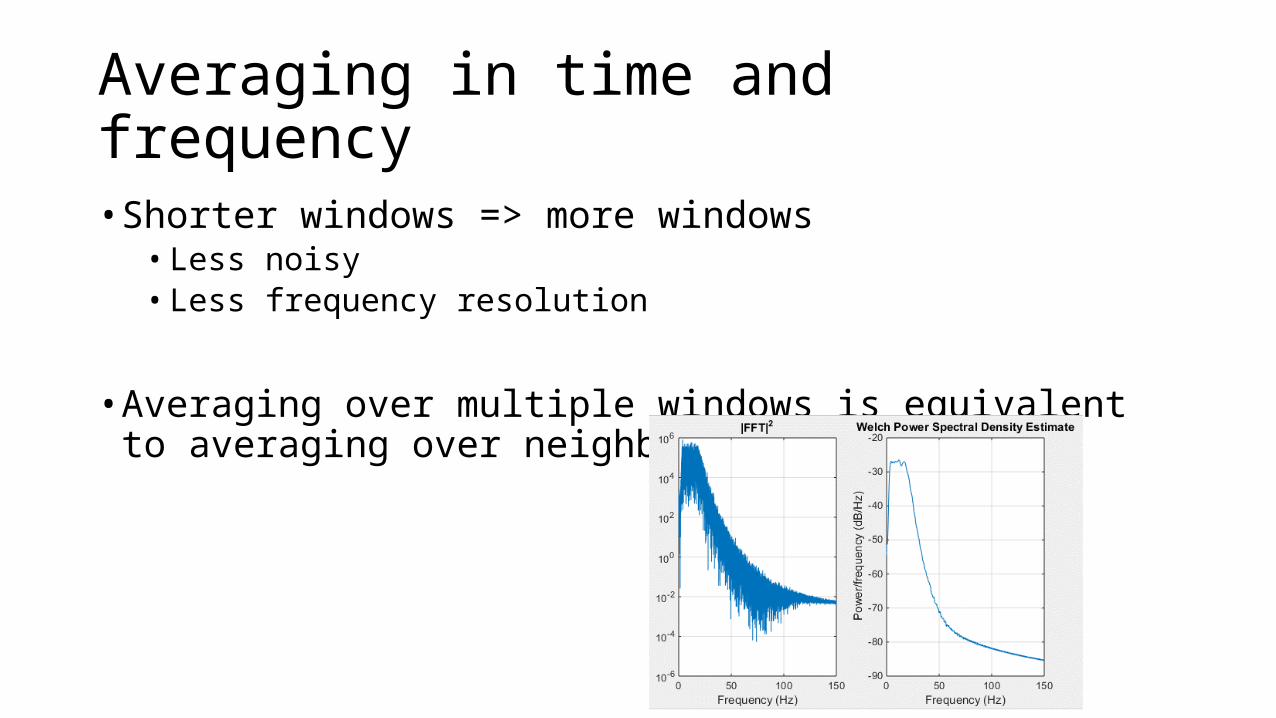
Averaging in time and frequency
• Shorter windows => more windows • Less noisy• Less frequency resolution
• Averaging over multiple windows is equivalent to averaging over neighboring frequencies

Multi-taper method
• Only one window, but average over different taper shapes• Use when you have short signals• Taper shapes chosen to have fixed
bandwidth

Multitaper method (1 window)

http://www.chronux.org/
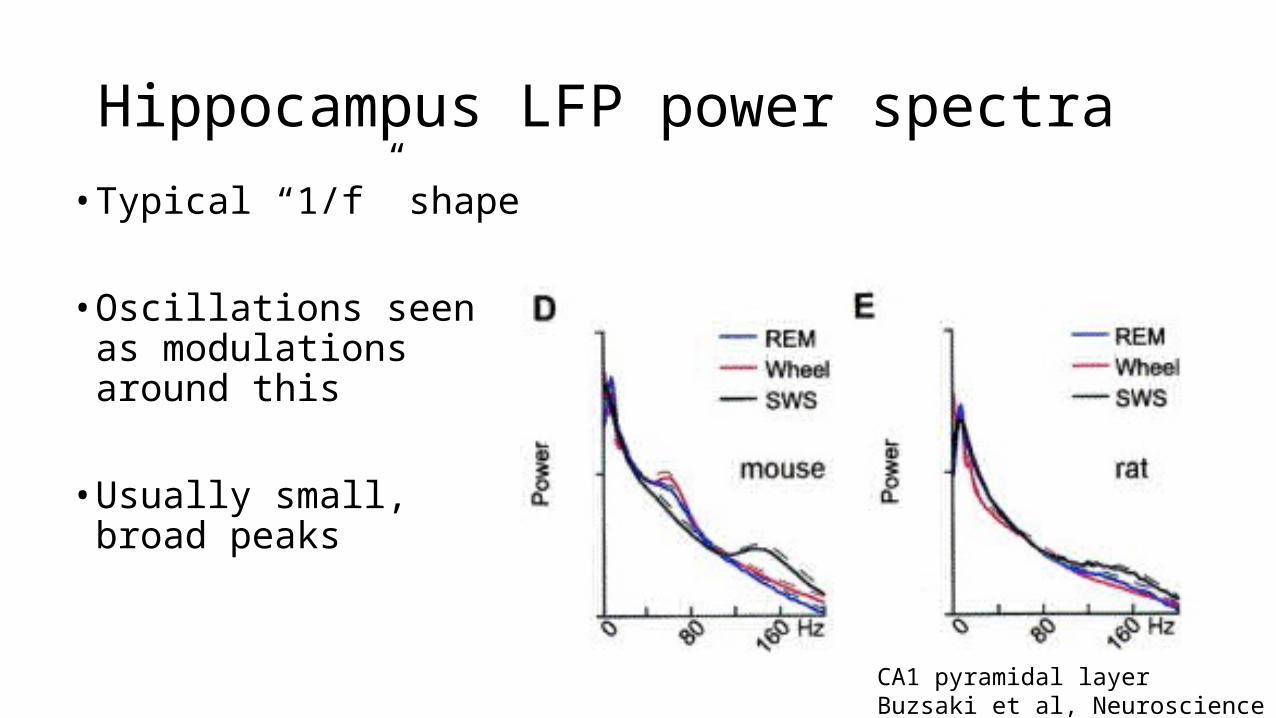
Hippocampus LFP power spectra
• Typical “1/f” shape
• Oscillations seen as modulations around this
• Usually small, broad peaks
CA1 pyramidal layerBuzsaki et al, Neuroscience 2003

Connexin-36 knockout
Buhl et al, J Neurosci 2003

Stimulus changes power spectrum in V1
• High-frequency broadband power usually correlates with firing rate• Is this a gamma oscillation?
Henrie and Shapley J Neurophys 2005
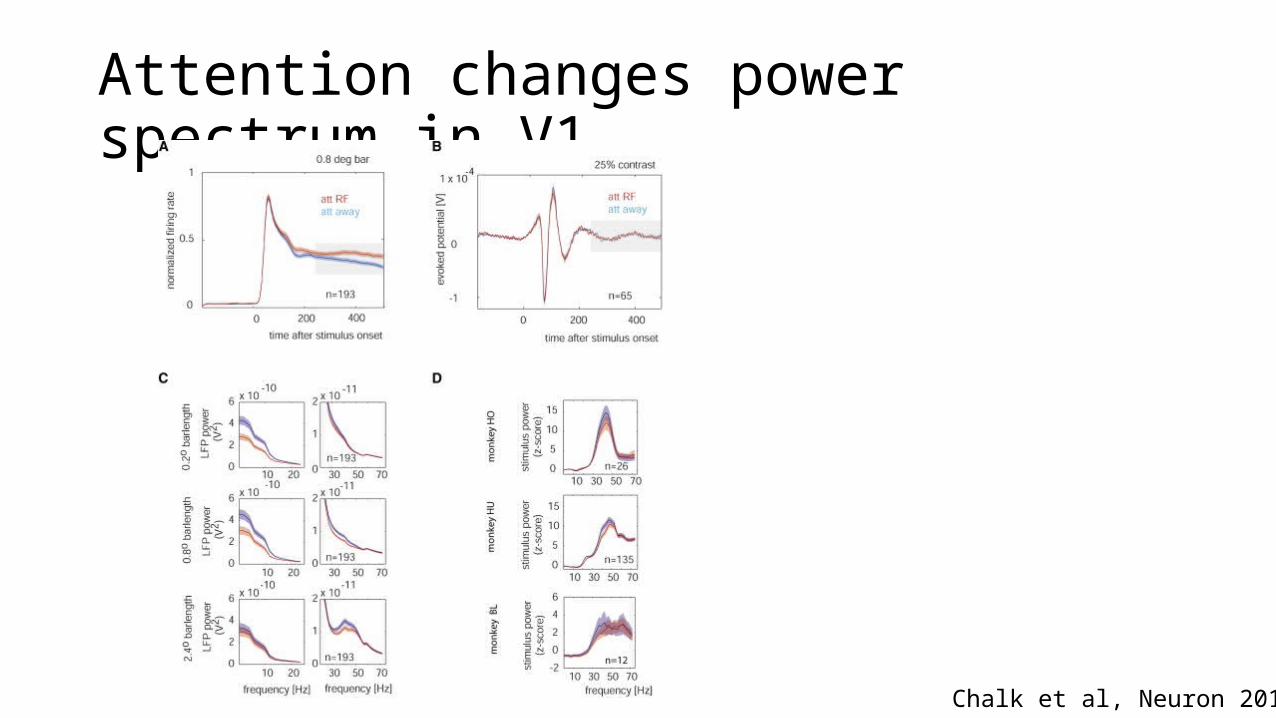
Attention changes power spectrum in V1
Chalk et al, Neuron 2010


![Pancreatic cancer: What defines resectabilityWhat defines …gicancers.org/syllabus/1[1].1 Evans.Pancreatic Cancer.pdf · 2010-11-01 · Pancreatic cancer: What defines resectabilityWhat](https://static.fdocuments.in/doc/165x107/5f57a92ea7197928bc5ea35f/pancreatic-cancer-what-defines-resectabilitywhat-defines-11-evanspancreatic.jpg)