Specific Mortality Japan: Contour Mapa Approach T...
18
NOT FOR QUOTATION WITHOUT THE PERMISSION OF THE AUTHORS Cause Specific Mortality in Japan: Contour Mapa Approach B. Cambill A. Yashin J. Vaupel 2. Nanjo T. Shigematsu December 1986 WP-86-78 Working Papers are interim reports on work of the International Institute for Applied Systems Analysis and have received only limited review. Views or opinions expressed herein do not necessarily represent those of the Institute or of its National Member Organizations. INTERNATIONAL INSTITUTE FOR APPLIED SYSTEMS ANALYSIS A-2361 Laxenburg, Austria
Transcript of Specific Mortality Japan: Contour Mapa Approach T...
NOT FOR QUOTATION WITHOUT THE PERMISSION OF THE AUTHORS
Cause Specific Mortality in Japan: Contour Mapa Approach
B. Cambill A. Yashin J. Vaupel 2. Nanjo T. Shigematsu
December 1986 WP-86-78
Working Papers are interim repor t s on work of the International Institute f o r Applied Systems Analysis and have received only limited review. Views or opinions expressed herein do not necessarily represent those of the Institute or of i t s National Member Organizations.
INTERNATIONAL INSTITUTE FOR APPLIED SYSTEMS ANALYSIS A-2361 Laxenburg, Austria

An important p a r t of the activity of IIASA's Population Program is related to the development of data visualization techniques. The pape r i s devoted to the analysis of cause specific mortality data for Japan using the shaded aontour map approach which was recently developed in the program by a n international team of scientists.
Anatoli Yashin Deputy Leader Population Program

Cause Specific Mortality in Japan: Contour Maps Approach
1. Introduction The fluctuating mortality history of Japan provides f o r a remarkably interest-
ing study. Mosk (1979) divided modern Japanese demographic history into five periods. The ear l ies t , encompassing the eighteenth and nineteenth centuries, i s characterized by l o w mortality. The second period, which includes the late nineteenth and ear ly twentieth centuries, demonstrates increasing mortality, while the third, running until the outset of World W a r 11, is marked by slowly decreasing mortality rates. The final two periods span the post-war period and will be the focal point of o u r cause specific investigation of mortality among Japanese males. The rapid progress and changability of mortality during these periods i s astonish- ing. Investigation of cause specific mortality provides s o m e clues about the nature and future of total mortality in Japan, and perhaps, the rest of the Western World.
The method tha t w e use f o r analyzing mortality t rends i s called "shaded con- tour maps." This is a n effective means of representing thousands of demographical data simultaneously, e i t he r on a piece of paper or on the color monitor of a com- puter. Data which might be used in such an analysis are age and time specific demographical character is t ics such as mortality, fertility, population, migration ra tes , etc.
W e begin o u r discussion of mortality trends showing the map of Japanese male mortality from 1891 to 1982 and age categories 0 to 89. The contour map i s com- pared with a three-dimensional plot of the mortality surface. Analfling the map, one may like to look at different profiles of mortality through age or time. These profiles can be readily provided making the appropriate cuts through the demo- graphical surface. Examples of such cuts are also shown. Maps of six cause specific mortality rates f o r Japanese males are presented, together with the i r proportions of total m a l e mortality. The four maps of leading causes of death over age and time are presented at the end.
2. f i l e Mortality in Japan The mortality rate in Japan declined steadily from the end of the 19th century
until World War 11. Right a f t e r the war major prograss w a s observed f o r ages from 5 to 40 years. Later, progress against mortality w a s achieved also f o r adults over 40 and younger children. The contour map in Figure l a displays this progress even f o r elderly males. The lines on the contour map represent points of equal mortality. One would see these lines cutting the three-dimensional plot of male mortality (Figure l b ) by horizontal planes fixed on the respective m o r t l i t y levels.
Figures l c and I d demonstrate vertical cuts in the three-dimensional m o r t a l - ity surface. In Figure l c one can see the age specific mortality pat terns observed in the years 1900,1945 and 1980. One sees tha t the mortality rate among Japanese
l". Rowe Price Association, 100 East Pratt Street Baltimore, Maryland 21202, USA 2~opulation Program, IIASA, A-2361 Laxenburg, Ausria ' ~ u m ~ h r e ~ Institute of Public Affairs, University of Mnnesota, 301 19th Avenue South, Mlnneapo- is, Minnesota 55455, USA
bukushima Medical College, Japan %ublic Health Institute, Fukuoka University, Japan

1910 1930 1950 1970 y e a r s
FIGURE 1. Japanese male mortality from 1891 to 1982 and age 0 to 89: (a) contour map; (b) three-dimensional plot; (c) age profile; (d) time profile.
m a l e s in 1945 w a s higher than in 1900 f o r all age groups, especially f o r the age group interval from 18 to 40. However, the mortality rate in 1980 is more than t w o times less than at the beginning of the century f o r all ages. In o r d e r to be t te r understand the reasons f o r such significant changes, i t i s useful to look at the t rends of cause specific mortalities a f t e r World War 11.
3. Six C a m of Death over Age and Time Figures 2-7 present pictures of cause specific mortality among the male
population in Japan from 1947 to 1982 and age 0 to 89. Each figure contains t w o contour maps: map (a) represen ts mortality due to one par t icular cause; map (b) designates this par t icular cause as a proportion of total m a l e mortality. Map (a) w a s drawn using lines t ha t begin at 0.0000667 and increase to 0.0195 at intervals of fifty percent. These lines are exactly one-tenth of t he lines normally used to draw total mortality maps. The darkes t areas of map (b) correspond to approxi- mately one-third of total male mortality at the corresponding age and time.
Tuberculosis is t h e subject of Figure 2. The progress made against this infec- tious disease t ha t w a s at one time largely responsible f o r mortality among young m a l e s in Japan is instantly clear. The rate of mortality from tuberculosis was at i ts highest point from 1947 to 1950 at ages 20 to 33. A t these points, and o thers around them, i t accounted f o r a l m o s t one-third of all Japanese m a l e mortality. By t h e 1970s and 1980s i t w a s almost non-existent at sfmilar ages.
Additionally, notice t ha t mortality from tuberculosis follows diagonal lines ove r t he 35 y e a r period. The pa t te rn indicates tha t t he percentage of people who die from tuberculosis i s nearly constant at all ages throughout the cohort. Because tuberculosis is a chronic disease, w e mfght explain this phenomenon through debilitation. With exposure to tuberculosis now nearly negligible, deaths at older ages along t h e cohor t line are probably due to infection at ea r l i e r ages, when exposure w a s much g rea t e r . Since each cohort suffered different levels of exposure at younger ages, t he rate of mortality tha t each cohort c a r r i e s with i t i s different. Figure 2b il lustrates t ha t a constant rate of tuberculosis mortality over the life of t he cohor t leads to a decrease in the proportion of people succumbing to tuberculosis in t he cohor t direction.
Another peculiarity of t h e map i s t ha t the rate of mortality from tuberculosis w a s g r e a t e r in 1982 at ages above 70 than i t w a s in 1947 f o r similar age groups. Though cause of death s ta t is t ics are not available f o r the period before 1947, Shf- gematsu and Yanagawa (1983) and Okubo (1981) mention that tuberculosis played a major role in mortality among men in t h e i r twenties during the pre-war period. If this i s t r ue , one would believe that selection might be responsible f o r t he curious increase in tuberculosis mortality at older ages. A high rate of exposure to tuber- culosis would mean tha t all but the most robust individuals would contract the disease at younger ages. A s a result , t h e r e would be fewer "weak" individuals remaining to be afflicted at older ages. Now that exposure to the disease is very low, these weaker, m o r e susceptible individuals are living to older ages and con- tracting the disease Later in life.
This point however does not ge t any support from the data. Indeed, individu- als aged 70 and above in 1982 lived the i r twenties in t he 19209 and 1930s when TB w a s m o s t prevalent in Japan and they cannot be regarded as "weaker" who escaped from TB infection. On t h e o t h e r hand, those aged 70 and above in 1947 lived the i r twenties in the 1890s when TB w a s less prevalent than in the ear ly 1900s. Their ea r ly life exposure to the disease w a s relatively l o w compared with t he experi- enaes of similar ages in 1982. The high TB mortality of similar ages in 1982 i s regarded as residuals of the high rates at the i r younger age r a t h e r than selection.

FIGURE 2. (a) Mortality rates from tuberculosis for Japanese males from 1947 to 1982 and age 0 to 89. (b) Tuberculosis as a proportion of total mortality for Japanese males from 1947 to 1982 and age 0 to 89.

Shigematsu and Yanagawa (1983) point out that a reduction in death f r o m tuberculosis w a s the largest contributor to the decline of mortality in Japan af ter 1950. The rapid and a l m o s t complete eradication of tuberculosis is largely the result of improved economic conditions, the development and use of the BCG (Bacillus CalmetteGuerin) innoculation, and a massive public health program implemented in the early post-war period. The Japanese economic prosperity of the 1950s m o s t certainly played a role in reducing death f r o m tuberculosis in that country. A preventative innoculation that gained acceptance and use in Europe and the United States during the 1930s and 1940s was not widely available in Japan until the late 1940s and early 1950s. The TB Prevention Law employed i t and wide scale x-raying as effective measures in reducing mortality from tuberculosis.
It is worth mentioning, however, that BCG, public health programs, and economic prosperity alone are not enough to explain the rapid decline in TB mor- tality in Japan from the 1950s onward, when economic reconstruction had only star ted and could not be regarded as prosperous. During this time, the improve- ment in medical treatment - especially the introduction of effective chemotherapy, anti-TB drugs - certainly played an important role in the decline in TB mortality.
Figure 3 displays total and proportional malignant neoplasm mortality. From Figure 3a i t is apparent that the rate of death from cancer has increased signifi- cantly only at ages grea ter than 70. Figure 2b illustrates, however, that malignant neoplasms have assumed a much g rea te r role in determining the rate of total mor - tality at each age. In 1947, only 15 percent of all deaths between the ages 50 and 65 resulted from cancer. In 1982, this proportion more than doubled to grea ter than 31 percent. Even m o r e striking i s that among ten year old males, only about one percent of all deaths resulted from aancer in 1947. By 1982 this number had increased approximately 30 times so that over 31 percent of mortality at age 10 w a s directly the result of s o m e form of cancer.
The pictures provide a remarkable illustration of how much total mortality has declined relatlve to mortality from malignant neoplasms. In 1982, malignant neoplasms w e r e responsible f o r at least 11 percent of the deaths at each age. In 1947, this w a s t rue only fo r ages 43 to 71. Though maligant neoplasm mortality rates have not increased at m o s t ages, the increasing proportion results from a decrease in the mortality rates fo r other causes of death. In other words, the probability that any healthy person will die from cancer at a particular age i s not increasing, but the probablity that death will result from cancer at some age is.
Projecting current rates of progress against cancer mortality, Own and Vau- pel (1985) predict that a male born in the U.S. in 1984 has a 67 percent chance of eventually succumbing to cancer, though his life expectancy is increased from those born in years before him. The Lexis maps of malignant neoplasm rates lead us to believe that results will be similar f o r Japanese males . As other causes of death are eliminated and natural selection becomes less important in the aging process, people will likely live longer but eventually die from cancer, leading to higher rates of neoplasm mortality at older ages.
Looking at Figure 4 w e see a similar picture f o r heart disease in Japan. For all ages less than 70, the rate of mortality from hear t disease remained constant or decreased from 1947 to 1982, though increased, as expected, with age. As a proportion of total mortality, however, hear t disease increased over age and time. In Figure 4a there is evidence of post-war progress against heart disease m o r t a l - ity at ages less than 40. For Japanese m a l e s in their eighties frcm 1960 to 1982, the probability of death from hear t disease w a s around 0.2.
When compared with o ther countries in the western world, Japanese mortality from hear t disease is relatively low, especially at older ages. Kono and Takahashi (1985) explain that cultural and behavioral eating patterns may be responsible fo r

FIGURE 3. (a) Mortality rates from cancer for Japanese males from 1947 to 1982 _ and age 0 to 89. (b) Cancer as a proportion of total mortality for Japanese males from 1947 to 1982 and age 0 to 89.

FIGURE 4. (a) Mortality rates from heart disease for Japanese males from 1947 to 1982 and age 0 to 89. (b) Heart disease as a proportion of total mortality for Japanese males from 1947 to 1982 and age 0 to 89.

the a d v a n w e d position of the Japanese males. The fat and overall calor ic input of Japanese males has not reached the level of t he i r pee r s in the w e s t . In blue- skinned fish, they also consume more eicosapentaenoic acid which many biologists and physicians believe prevents coagulation in human blood vessels and therefore lessens the r isk of myocardial infarction. Perhaps a contributing factor i s selec- tion. A comparison with o t h e r western data shows tha t Japanese males suffer g r e a t e r rates of h e a r t disease mortality from bir th until t he i r thirt ies, but then less mortality from h e a r t disease at middle and older ages. If those born with weaker cardiovascular sys t ems die ea r ly in life, w e would expec t the mortality rate to be less at older ages. A m o r e careful analysis of diseases by type in child- and in adult-hood is needed, however, to justify this idea.
Figure 4b reveals tha t the proportion of total mortality t ha t resul ts from h e a r t disease increases with successive cohorts. For a Japanese male who died at age 80 in 1950, t he probability tha t his death resulted from h e a r t disease w a s around 0.05. This probability thir ty yea r s later w a s 0.21, a n increase of 400 per- cent. Comparisons of proportional mortality at o the r ages would reveal a similar, though perhaps less drast ic , pattern. The map provides additional indications of a shift from exogeneous to endogeneous mortality.
Figure 5 presen ts maps of cerebrovascular mortality. Figure 5a shows tha t cerebrovascular mortality rates decreased by 1 0 to 20 percent at m o s t ages from the mid-1960s to 1982, though the rates at middle and upper ages are high relative to mortality from o the r causes. For Japanese males, the probability of dieing from cerebrovascular disease at any age above 80 w a s close to 0.02, while i t w a s less than seven in 100,000 f o r all ages less than 31 throughout t he period.
Figure 5 b shows the g r e a t proportion of death at t r ibutable to cerebrovascu- lar mortality. especially at older ages from 1960 to 1980. Though Figure 5a eluci- dated t he f ac t t ha t mortality from cerebrovascular causes is decreasing, w e now see tha t the rate of decrease has not kep t pace with reductions in total mortality. Kono and Takahashi (1985) suggest t ha t the salty food typical of the traditional Japanese diet could b e one f ac to r in making cerebrovascular mortality dispropor- tionately high relat ive to o the r countries and o the r causes. They point out t ha t the changing pa t te rn of diet toward less salty food and m o r e protein and f a t i s par t ly responsible f o r t he reduction in rate and proportion of mortality t ha t i s apparen t in the maps and believe the continuing t rend will lead to g r e a t reductions in future mortality.
The diagonal pa t te rns of Figure 5 b are an interesting fea ture of t ha t Lexis map. Strong evidence of debilitation can be discerned through close scrutiny. For cohorts born before between 1890 and 1910, the mortality from cerebrovascular disease resulted in diagonal lines perpendicular to the cohort . The pa t te rn indi- cates tha t the rate of mortality varied from age to age and from cohor t to cohort , with later cohor t s experiencing a smaller proportion of mortality from cerebro- vascular disease. W e even see a decline in mortality at older ages along these cohorts.
For males born a f t e r 1910, however, cerebrovascular mortality remains rela- tively constant ove r the cohort , but var ies from one cohor t to the next. Year of bir th determines t he a lmos t constant proportion of death t ha t results from this cause, possibly a n a r t i f ac t of debilitation. Okubo (1981) suggests t ha t the malnu- tri t ion and lack of protein-rich food during the pre-war and post-war yea r s left adolescents of t he period with weaker blood vessel tissue, making them m o r e sus- ceptible to c e r e b r a l hemorrhage. Assuming this i s t rue , w e might expec t mortality to b e constant ove r a cohor t as bir th y e a r and variable exposure lead to different levels of mortality fo r each of the b i r th groups, and the endogeneous condition resul ts in constant mte of mortality with age.

FIGURE 5. (a) Mortality rates from cerebrovascular disease for Japanese males from 1947 to 1982 and age 0 to 89. (b) Cerebrovascular disease as a proportion of total mortality for Japanese males from 1947 to 1982 and age 0 to 89.

Figure 6a displays the age-specific mortality from suicide f o r Japanese males. Perhaps the most noticable feature of the map i s the high area of mortality at ages 20 to 25 between 1952 and 1960. This region represents the mortality of men born from 1928 to 1940 - those who were children and adolescents during World W a r 11. Following the map in the cohort direction, the mortality rates drop substantially at ages a f t e r the high region. Selection might be one cause of the cohor t effect, since i t appears over age in only the cohort, not the period, direction. Notice, however, tha t the region of high suicides at ages 42 to 57 from 1979 to 1982 corresponds t o the same cohort tha t suffered a high suicide rate in i t s twenties. This does not support the selection idea. Throughout the period, suicide a f t e r age 70 appears t o follow an age r a t h e r than cohort pat tern, with some progress made over time.
Suicide mortality is strongly influenced by social and economic conditions in the community. The high rate of suicide mortality in the 1950s w a s brought about by the social conditions tha t were very difficult and competitive in the course of economic reconstruction from the chaos a f t e r the W a r . The decline in suicide mor- tality follows both cohort and period directions s o the explanation by selection only is not completely suitable.
Figure 6b - proportional mortality from suicide - i l lustrates dramatically the suicide among young people throughout the period. The peak tha t appears f i r s t chronologically corresponds to the local maximum discussed ear l ier . More strik- ing, however, is the high proportional mortality among men less than 40 throughout the 1970s and ear ly 1980s. Over time, suicide w a s responsible f o r a n increasing proportion of mortality among men between the ages of 30 and 50. After an ititial surge in the ear ly 1950s. progress against suicide mortality at most ages seems to have kept pace with progress against total mortality, and even surpassed i t at various ages and times. Hishunuma (1981) expects the trend to change, however, predicting tha t suicide rates in 2010 will be 50 percent higher than in 1978.
Figure 7a is a Lexis map of mortality rates from accidents among Japanese males. The global minumum falls around age 10 o r 11 over the la test years of the map, while the maximum is at the highest ages from 1960 to 1982. A noticable feature of the map is the decreasing rate of mortality from accidents at almost all ages from the ear ly 1970s to 1982. The decrease followed peak mortality from accidents in the year 1970. The patterns exhibited are a fine example of the effect of technology on demography. While increasing t rends w e r e perhaps at t r i - butable to the introduction of modern technology, i t i s noticable tha t the lowest mortality from accidents occurred in the latest years of the map, a f t e r an initial adjustment to the effects of science on daily life. A detailed analysis shows tha t the largest contributor t o the increase of accident mortality a f t e r the W a r w a s the rapid progress of motorization in Japan. The decreasing t rend a f t e r 1970 has resulted from the improvement of road conditions and facilities and of t raff ic sys- tems and regulations.
Figure 7b displays the proportion of mortality attributable to accidents among m a l e s in Japan. For males less than 30, accidents have accounted f o r more than 31 percent of nearly all mortality since 1959. The one striking exception i s around age 1 0 and in infancy, where the proportion i s much lower. From Figure 7a, w e see tha t this results not only from progress against total mortality, but also from a decrease in the rate of accident mortality among these age groups. The rapid increase in the proportion around 1957, however, is probably an ar t i fac t only of progress against infectious disease mortality. such as tuberculosis, tha t w a s once responsible f o r a g rea t proportion of mortality among young men and children (see Flgure 2b).

FIGURE 6. (a) Mortality rates from suicides for Japanese males from 1947 to 1982 and age 0 to 89. (b) Suioides as a proportion of total mortality for Japanese males from 1947 to 1982 and age 0 to 89.

FIGURE 7. (a) Mortality rates from accidents for Japanese males from 1947 to 1982 and age 0 to 89. (b) Accidents as a proportion of total mortality for Japanese males from 1947 to 1982 and age 0 to 89.

4. h d i q Causes of Death Figures 8 and 9 illustrate a ranking for nine major causes of death from 1947
to 1982 and age 0 to 89. Unlike o ther Lexis maps presented to this point, the third variable is discrete and the surface discontinuous. For these maps, the level represents the particular cause at each age, time and rank f o r the six leading causes of death. F r o m these, w e see clearly how the composition of total mortality has changed substantially over the 35 yea r period under study. W e did not include "other" as a aause of death, and some important causes, such as cirrosis of the l iver, will not appea r because the data w a s not available to us.
Figure 8a displays leading causes of death over age and time. Notice tha t four causes completely dominate the map. Tuberculosis, once a major cause of death f o r males 1 2 to 52, has been replaced by accidents, cancer , and, in s o m e small areas, suicide. Cerebrovascular disease w a s consistantly the leading cause of death fo r those aged g r e a t e r than 78, but by 1982 malignant neoplasms replaced i t as the leading cause among middle-aged Japanese males. Overall, accidents seem to occupy the grea tes t area of the map, though suicides and cancer were beginning to replace i t as the major cause of death by 1982.
Among the second leading causes of death displayed in Figure 8b, suicide stands out as a major fac tor in mortality among males 17 to 43. Notice also tha t cerebrovascular disease and malignant neoplasms together are the primary causes of death among males aged 50 to 80. Heart disease becomes a factor in determining mortality f o r males aged g r e a t e r than 80 a f t e r 1950. In the late 1940s and early 1950s, accidents were second to tuberculosis as a cause of death among males aged 1 2 to 41.
A s the rankings progress , the pat terns become more complex as different causes play different roles in determining the makeup of mortality. One interest- ing .feature of t he maps, however, i s tha t diagonal effects become striking. Notice the diagonal pat terns of tuberculosis in the maps representing the third and sixth leading causes of death. Also apparent are particular cohorts tha t carry a cause specific mortality with them. They can be seen by looking in the bottom co rne r of the fourth and fifth cause maps.
Taken together, the cause of death maps displayed in Figures 2-9 provide an interesting decomposition of mortality. They give demographers, medical scien- Lists, and policy makers some idea of how progress against cause mortality might change the s t ruc tu re of mortality and population in Japan. Indeed, the maps con- tain information about changing t rends in cause specific mortality tha t could pro- vide important clues about mortality s t ruc ture in the future.

FIGURE 8. (a) E'irst leading causes of death for Japanese males froln 1947 to 1982 and age 0 to 89. (b) Second leading causes of death for Japanese males from 1947 to 1982 and age 0 to 89.
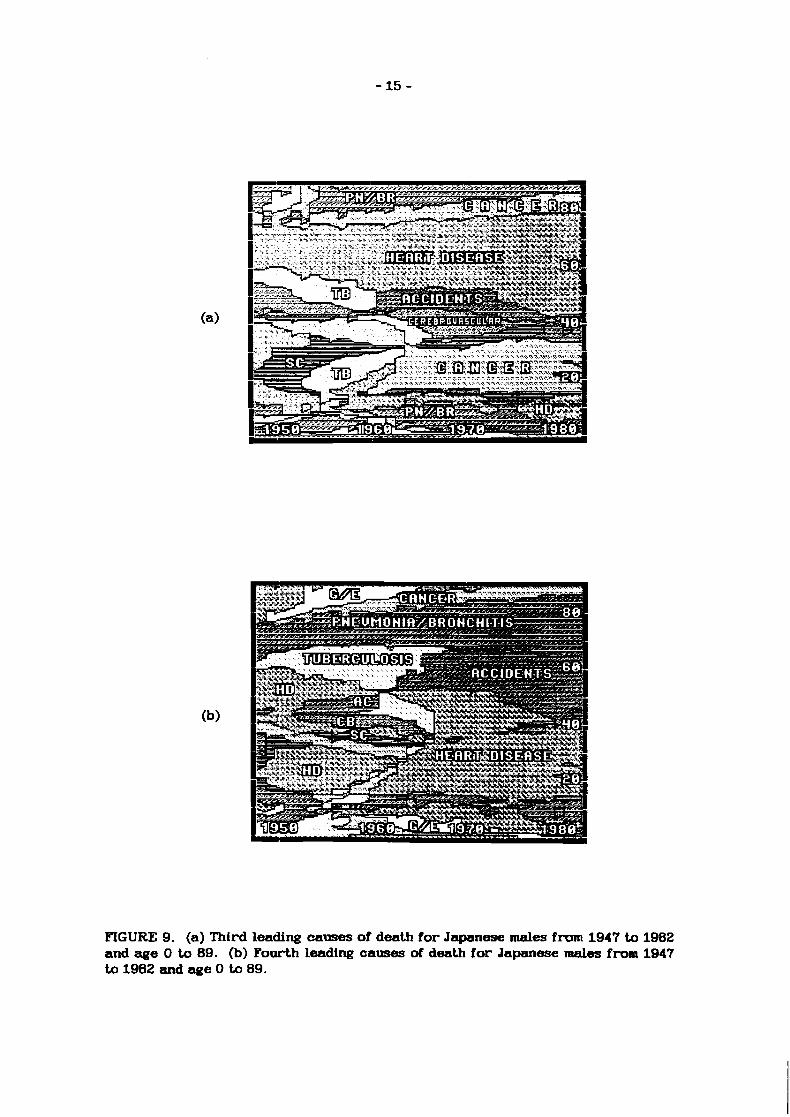
FIGURE 9. (a) Third leading causes of death for Japanese males from 1947 to 1982 and age 0 to 89. (b) Fourth leading causes of death for Japanese males fron 1947 to 1982 and age 0 to 89.

Hishunurna, Shigekazu (1981) Mortality Trends in Japan and their Possible Causes. M e d M Aspects of Mortcrlit y S ta t i s t i c s . Stockholm: Almquis t & Wiksell Inter- national, pp. 121-140.
Kono, Shigemi and Shigesato Takahashi (1985) Mortcrltty ZYehds in Japan- Why H a s the J a p a w s e Lm E z p e c t a n q Kept o n I w e c l s i n g ? Informal Meeting 1.5, Reversals in Declining Mortality, IUSSP Florence Center.
Mosk, Carl (1979) The Decline of Marital Fertility in Japan. PopuLatwn S t t ld i s s 33:19-38.
Okubo, Masakazu (1981) Increase in Mortcrltty of Middle-Aged Males in Japan. NUPRI Research Paper. Nihon University, Tokyo, Japan.
Owen, John and James W. Vaupel(1985) An Exercise in Life Expectancy. Amsrtcan DBnrographics 7(11):37-39.
Shigematsu, Itsuzo and Hiroshi Yanagawa (1983) Socicrl a n d Economic Policies and thdr m t s of Mortcrlity tn Japan. Presented at the Seminar on Sooial Policy, Health Policy and Mortality Prospects, Institute National d9Etudes Demographiques.


![VALUE€¦ · Contour Drawing [Project One] Contour Drawing. Contour Line: In drawing, is an outline sketch of an object. [Project One]: Layered Contour Drawing The purpose of contour](https://static.fdocuments.in/doc/165x107/60363a1e4c7d150c4824002e/value-contour-drawing-project-one-contour-drawing-contour-line-in-drawing-is.jpg)