
SPECIFIC MITIGATION OPPORTUNITIES WORKING GROUP · Working Group on Specific Mitigation...
209
SPECIFIC MITIGATION OPPORTUNITIES WORKING GROUP FINAL REPORT
Transcript of SPECIFIC MITIGATION OPPORTUNITIES WORKING GROUP · Working Group on Specific Mitigation...

SPECIFIC MITIGATION OPPORTUNITIES
WORKING GROUP
FINAL REPORT

Aussi disponible en français
SPECIFIC MITIGATION OPPORTUNITIES
WORKING GROUP
FINAL REPORT

SPECIFIC MITIGATION OPPORTUNITIES
WORKING GROUP
FINAL REPORT


Working Group on Specific Mitigation Opportunities Final Report
iii
TABLE OF CONTENTS
1 EXECUTIVE SUMMARY ............................................................................................................................51.1 Introduction ......................................................................................................................51.2 List of Policy Options ......................................................................................................10
2 OVERVIEW ............................................................................................................................................122.1 Introduction ....................................................................................................................122.2 The Mitigation Working Group: Mandate and Process .........................................................14
2.2.1 Estimating emissions reductions .............................................................................152.2.2 Estimating costs per tonne .....................................................................................162.2.3 Integration with Other Working Groups ....................................................................162.2.4 Inclusion of Indigenous Peoples .............................................................................172.2.5 Public and stakeholder engagement ........................................................................18
3 KEY FINDINGS AND CONSIDERATIONS ....................................................................................................193.1 Estimated Emissions Reductions and Costs .......................................................................193.2 Economic and Employment Impacts .................................................................................223.3 Competitiveness ..............................................................................................................243.4 Interactions with Carbon Pricing .......................................................................................243.5 Foundational and Transformative Change ...........................................................................263.6 Co-benefits and Other Impacts ..........................................................................................273.7 Short-Lived Climate Pollutants ..........................................................................................283.8 Policy Tools .....................................................................................................................293.9 Regional Diversity ............................................................................................................313.10 Indigenous Perspectives and Opportunities for Leadership and Partnership ...........................323.11 Northern and Remote Communities ...................................................................................333.12 Accelerating Technological Development ............................................................................353.13 Infrastructure Investments ................................................................................................353.14 Access and Supply of Clean, Renewable Energy ..................................................................363.15 Links to Adaptation .........................................................................................................383.16 Linkages with the Canadian Energy Strategy ......................................................................38
4 INPUT FROM NATIONAL INDIGENOUS ORGANIZATIONS ............................................................................404.1 Assembly of First Nations ................................................................................................404.2 Métis National Council .....................................................................................................41
5 PUBLIC AND STAKEHOLDER INPUT .........................................................................................................435.1 Submissions Received .....................................................................................................435.2 Key Themes from Submissions ........................................................................................445.3 Consultation with Key Experts and Stakeholders .................................................................46
6 SECTOR PROFILES .................................................................................................................................486.1 Introduction ....................................................................................................................486.2 Large Industrial Emitters ..................................................................................................48
6.2.1 Sector Portrait ......................................................................................................486.2.2 Summary of Key Options to Reduce Emissions in 2030 ............................................51
6.3 Transportation ................................................................................................................536.3.1 Sector Portrait ......................................................................................................536.3.2 Summary of Key Options to Reduce Emissions in 2030 ............................................55
6.4 Built Environment ..........................................................................................................586.4.1 Sector Portrait ......................................................................................................586.4.2 Summary of Key Options to Reduce Emissions in 2030 ............................................60
6.5 Electricity Generation and Transmission .............................................................................626.5.1 Sector Portrait ......................................................................................................62

Working Group on Specific Mitigation Opportunities Final Report
iv
6.5.2 Summary of Key Options to Reduce Emissions in 2030 ............................................646.6 Agriculture ......................................................................................................................66
6.6.1 Sector Portrait ......................................................................................................666.6.2 Summary of Key Options to Reduce Emissions in 2030 ............................................69
6.7 Forestry .........................................................................................................................706.7.1 Sector Portrait ......................................................................................................706.7.2 Summary of Key Options to Reduce Emissions in 2030 ............................................72
6.8 Waste .............................................................................................................................746.8.1 Sector Portrait ......................................................................................................746.8.2 Summary of Key Options to Reduce Emissions in 2030 ............................................76
6.9 Government Operations and Leadership .............................................................................776.9.1 Summary of Key Options to Reduce Emissions in 2030 ............................................78
6.10 Individual actions ...........................................................................................................806.11 Internationally Transferred Mitigation Outcomes .................................................................81
7 CONCLUSION ........................................................................................................................................84
ANNEX 1: SUMMARY TABLE OF POLICY OPTIONS ............................................................................................87Large Industrial Emitters ..................................................................................................87Transportation ................................................................................................................89Built Environment ...........................................................................................................92Electricity Generation and Transmission ............................................................................94Agriculture ......................................................................................................................96Forestry ..........................................................................................................................98Waste ............................................................................................................................. 99Government Operations ....................................................................................................99
ANNEX 2: POLICY OPTION PROFILES .............................................................................................................100Large Industrial Emitters ................................................................................................100Built Environment .........................................................................................................144Electricity Transmission and Generation ...........................................................................164Agriculture ....................................................................................................................176Forestry ........................................................................................................................186Waste ...........................................................................................................................194Government Operations and Leadership ...........................................................................200Internationally Transferred Mitigation Outcomes ...............................................................203
ANNEX 3: KEY METHODOLOGICAL CHOICES ..................................................................................................205

Working Group on Specific Mitigation Opportunities Final Report
ivWorking Group on Specific Mitigation Opportunities Final Report
5
1 EXECUTIVE SUMMARY
1.1 Introduction
In response to the urgent global challenge of climate change, Canada’s First Ministers came together in March 2016 and issued the Vancouver Declaration on Clean Growth and Climate Change (Vancouver Declaration). First Ministers affirmed Canada’s commitment to act on climate change and support a transition to a sustainable, low-carbon economy. The Vancouver Declaration launched four federal, provincial, and territorial (FPT) working groups mandated to identify specific actions to grow Canada’s economy while reducing greenhouse gas (GHG) emissions and adapting to climate change.
This report presents the work of the Working Group on Specific Mitigation Opportunities (‘Mitigation Working Group’ or MWG), which was tasked with developing a broad menu of policy options to reduce emissions across all sectors of Canada’s economy. This reflects Canada’s commitment to the international community that it will reduce emissions to at least 30% below 2005 levels by 2030. Meeting this goal will require new and ambitious policy measures. This report is intended to support the Canadian Council of Ministers of the Environment, who will review this report and provide their recommendations to First Ministers by October 2016.
The MWG, supported by technical sub-groups, has developed 46 illustrative policy options designed to meet multiple objectives. In developing options, the goal of each sub-group was to:
• Cover all of the principal opportunities for emissions reductions;• Include highly ambitious policy options to ensure deep reductions;• Present options from a jurisdictionally-neutral, national perspective;• Reflect options proposed by Indigenous peoples, the public and stakeholders; and• Provide enough detail where possible to be considered as practical, implementable options.
These policy options are intended as a broad menu or toolbox, from which Ministers can choose and adapt the most relevant options for future plans. To ensure broad consideration of possible opportunities, the MWG has included many ambitious policy options that may not be relevant or feasible for all jurisdictions, and that could have significant economic impacts in some cases. Therefore, importantly, the report includes policy options that not all jurisdictions endorse or would be prepared to implement. In many cases, these policies are examples of the types of approaches that could be taken, with the understanding that they would be adjusted and refined before being implemented.
This report is the result of a collective effort by officials from across Canada, based on input from expert and stakeholder groups and the general public who contributed a wealth of thoughtful policy solutions, and National Indigenous Organizations who consulted broadly with Indigenous communities and communicated their perspectives and priorities. All of these groups played an important role in informing the development of the policy options presented in this report.
The Mitigation Working Group received input from the Assembly of First Nations (AFN) and the Métis National Council (MNC). The Inuit Tapiriit Kanatami (ITK) opted to provide their input directly to Ministers. The submission from the Assembly of First Nations emphasizes human and Indigenous rights should be central to shaping further climate action, and advocates for energy democracy and security, food sovereignty and water purity for Indigenous peoples as key outcomes for Canada’s climate action. The AFN proposes several policy options, including targeted funds to promote cleaner and more efficient energy, technology, infrastructure, and capacity in First Nations communities, and measures to improve the efficiency of buildings in First Nations communities, which would have important co-benefits. The submission from the Métis National Council outlines overarching rights-based principles to inform Canada’s action on climate

Working Group on Specific Mitigation Opportunities Final Report
6
change, with an emphasis on the need for ongoing dialogue, engagement, and partnership with the Métis Nation as policies are developed and implemented. The MNC provides general support for mitigation measures that complement carbon pricing, while identifying some potential opportunities in Métis communities, such as energy efficient buildings, electricity generation, forestry, and government operations.
Key FindingsLarge Industrial Emitters: The industrial sector, including oil and gas, is the largest source of Canada’s emissions and offers the most significant opportunities for emissions reductions. Mitigation options for the industrial sector include transitioning to lower carbon fuels, like electricity, natural gas, or renewable fuels; capturing emissions from industrial processes; and improving energy efficiency. There are a broad range of costs and potential emissions reductions across this diverse sector. In some cases, there are remaining opportunities to reduce emissions at a low cost. For instance, the cost savings generated by some energy efficiency measures could completely offset their upfront costs in relatively short timeframes. Recently announced federal regulations to reduce methane emissions from the oil and gas sector are expected to achieve up to 20Mt of reductions at a cost of under $50 per tonne. However, many mitigation options remain costly and further development of new and transformative technologies will be needed to achieve deep reductions from industrial emissions over the longer term. As a major driver of Canada’s economy, the impacts of climate change policies on the competitiveness of the industrial sector are a central consideration. It will be important to ensure that policies in this sector contribute to future innovation, job creation, and better outcomes for environmental and human health.
Transportation: Canada is a large country; people and goods move across it using a variety of transportation – including passenger cars and trucks, airplanes, freight vehicles like heavy-duty trucks, trains, and marine vessels, public transit, walking and biking, and off-road vehicles such as those used in mining, construction and agriculture. In general, options to reduce emissions from transportation include improving the energy efficiency of vehicles and systems; shifting to lower carbon fuels, either with zero-emission vehicles or by using renewable fuels in conventional vehicles; reducing vehicle use (e.g., by driving less) and choosing lower emitting modes (e.g., moving freight by rail rather than trucks). Energy efficiency standards could be applied across modes of transportation to reduce fuel use, which generally offsets upfront costs. A low-carbon fuel standard could be used to scale up the renewable content of fuels and achieve significant (10-20 Mt by 2030) reductions at a relatively low cost (under $50 per tonne). Investments in infrastructure are key to reducing emissions in the transportation sector. For example, infrastructure investments can support better access to public transportation, safe spaces to walk and bike, and charging or fueling stations for alternative vehicles. Investments to ensure adequate access to low-carbon fuels, refueling infrastructure for low-carbon freight vehicles and other measures to support freight efficiency and modal shifts could also be considered. In some areas, such as the electrification of freight transportation, further research, development, and demonstration may be needed.
Built Environment: The majority of emissions from Canada’s residential, commercial and institutional buildings are from space and water heating. Reducing emissions will mean moving towards highly-insulated buildings, improved building operations, better-performing equipment, and in the long-term, transitioning from fossil fuels to low-emissions electricity and other lower-carbon fuels. Ambitious equipment standards and ‘net-zero-ready’ building codes can achieve significant reductions in 2030 (about 10-15Mt) and lay the foundation for deeper reductions in the longer-term. Retrofit and fuel-switching programs can also achieve substantial reductions, and policies to help consumers use energy more efficiently show potential as well. Costs for these measures vary widely because of the impact of fuel savings on net costs. Policies for this sector have the potential to stimulate the economy via construction-related jobs, making training and technical assistance particularly important.

Working Group on Specific Mitigation Opportunities Final Report
6Working Group on Specific Mitigation Opportunities Final Report
7
This sector also includes analysis of urban form and spatial planning policies, which can reduce emissions by helping to reduce building energy use, encouraging district heating, and helping shift transportation patterns towards public transit and active transportation. These policies are driven by multiple objectives, with emissions reductions only one of many goals. However, reductions could be significant, particularly in the longer term post-2030.
Electricity Generation and Transmission: To reduce emissions in the electricity sector, Canada will need to continue to strengthen its capacity for clean electricity leadership and accelerate the shift away from fossil fuels. There are a number of options that could support scaled-up clean electricity generation, including emissions performance standards or regulations, a non-emitting portfolio standard, or financial incentives. Investment in grid infrastructure could also help to connect existing and new clean electricity generation resources with electricity demand. Most of these options as presented in this report have significant potential for reductions (up to about 20 Mt), but there are important regional differences in access to clean electricity across Canada that will need to be accommodated. There are also important considerations around the economic impacts of shutting down electricity generation assets before the end of their useful life, and infrastructure investments that would be needed to ensure clean electricity is available at a reasonable cost to consumers across Canada. Of equal importance is the potential for major health and environmental benefits from reduced air pollution associated with decreased reliance on fossil fuels like coal. There are also specific areas where additional, targeted investments could be warranted, such as to help Northern and remote communities to reduce their reliance on diesel for energy generation.
Clean electricity is fundamental to the transition to a low-carbon economy; a number of electrification options for reducing emissions in other sectors, like transportation, industry and the built environment, depend on access to increasing amounts of clean, reliable electricity. Electricity sector policies will need to account for the probability that policies to promote electrification in other sectors could substantially increase overall electricity demand.
Agriculture: Opportunities for emissions reductions in the agricultural sector using current technologies are generally small. Market forces and past government programs have already encouraged farmers to adopt management practices such as no-till farming that substantially reduce emissions. Remaining opportunities focus primarily on managing methane emissions from livestock and manure storage, using fertilizers more efficiently, and increasing planting of cover crops or nitrogen-fixing crops and forages. The options presented in this report primarily propose incentive programs to help expand or accelerate environmentally-beneficial practices, taking into account the need to manage impacts on food prices for consumers and international competitiveness. Further research and development in areas like reduction and treatment of methane from livestock could contribute to lower costs and increase the potential for future emissions reductions.
Forestry: Building on current best practices by planting more trees and adjusting forest management, Canada could achieve significant emissions reductions (potentially beyond 15 Mt by 2030) at a relatively low cost (under $50 per tonne). Furthermore, trees continue to store carbon dioxide and remove it from the atmosphere over their lifetime, meaning that the impact of measures in the forestry sector will grow and become even more significant beyond 2030. In the long-term – for instance, by 2050 - carbon sequestration in forests and wood products could represent one of the largest mitigation opportunities for Canada. In addition, forestry measures can also have other environmental benefits, and contribute to climate change adaptation objectives as well as economic development in remote communities. Increasing the use of wood as a building material could also help to lower the environmental impact of construction materials.

Working Group on Specific Mitigation Opportunities Final Report
8
Other Areas for Action: The Mitigation Working Group also identified options to reduce emissions from the waste sector, such as increasing the capture and use of landfill gas; increasing diversion of recyclables and organics from landfills; and reducing food waste. As these measures would reduce demand for raw materials, emissions from transporting and processing these inputs, as well as emissions from landfills, they could have significant impacts across multiple sectors, both within and outside Canada, at relatively low costs.
Individuals and governments have an important leadership role to play in driving forward ambitious action on climate change. Small changes in behaviour by individual Canadians - like using less energy at home, reducing the use of personal vehicles, and purchasing more environmentally-friendly products – can have huge aggregate impact when multiplied millions of times. A successful national approach to climate change will need the active participation and support of Canadians. Efforts to promote education and awareness would have an important role in supporting many of the policy options included in this report.
Governments have a role in leading by example, by adopting ambitious measures to reduce emissions from their facilities, fleets, and other assets, as well as by using procurement to drive market demand for low-carbon goods and services. A carbon-neutral government policy is one example of a tool that can be used to enable this type of change.
Finally, Canada could also consider acquiring credits for emissions reductions in other parts of the world where costs are lower. Known as “internationally transferred mitigation outcomes,” emissions reductions from outside of Canada’s borders may have lower costs and contribute to investment in sustainable development abroad. Canada is actively participating in ongoing international discussions on this issue, and exploring which types of tools may be beneficial to Canada.
Considerations While this report does not rank or prioritize options, it provides information and analysis about relevant considerations for policy makers, including:
Emissions reductions: Estimated emissions reductions are provided for each individual measure, based on either economic modelling or analysis by technical experts. Note that estimated emissions reductions for each individual policy cannot be added together; this would greatly overestimate total reductions, as there are significant overlaps and interactions between many of these policies. These estimates are most useful as an indication of the relative contribution of each policy.
Costs: The estimated ranges of the cost per tonne of emissions reductions in this report are intended to give a general indication of which measures have low, modest, or high costs. Costs are presented as high-level, national averages and therefore do not fully capture important regional variations. Costs also do not include related infrastructure investments or stranded assets for most options, nor do they take into consideration the indirect public expenditure savings that may result from the options (e.g., improved public health). Finally, as they rely on existing estimates in the available literature and/or calculations by technical experts, cost estimates may not be fully comparable.
Economic and consumer impacts: The report includes a qualitative assessment of potential positive and negative impacts on job creation, competitiveness, and economic growth. The report also considers which policy measures have the potential to contribute to longer-term, structural shifts towards a low-carbon economy.
Interactions with carbon pricing: As one of the principal policy tools for reducing GHG emissions, carbon pricing was studied by the Working Group on Carbon Pricing Mechanisms. Carbon pricing options are therefore not included in this report. However, the report includes some analysis of how the mitigation options presented could interact with carbon pricing.

Working Group on Specific Mitigation Opportunities Final Report
8Working Group on Specific Mitigation Opportunities Final Report
9
Regional impacts, including on Northern and remote communities: The presentation of policy options in this report aims to be ‘jurisdictionally neutral,’ meaning that the policies are national in scope and do not specify which order of government would potentially implement them. Some considerations around the regional impacts of each policy option are included. In addition, this report highlights considerations specific to Northern and remote communities, as the policy solutions that are appropriate to these regions may be different from the rest of Canada.
Other types of benefits: Many of the policies in this report would also help to improve health; contribute to other environmental goods like biodiversity, clean water, or soil health; or reduce short-lived climate pollutants such as black carbon, which also have an important warming effect. In addition, some mitigation policies can reinforce climate change adaptation objectives.
Technology and infrastructure requirements: The feasibility of many of the measures in this report would depend on investments in infrastructure (the costs of which are not included in the estimated cost per tonne of each policy) as well as future improvements in the availability and affordability of innovative new technologies. Specific policies related to research, development and demonstration (RD&D) are included in the report by the Working Group on Clean Technology, Innovation, and Jobs.
A number of other considerations, such as linkages to the Canadian Energy Strategy and to other working group reports, are also incorporated throughout this report.
StructureThe report is organized into seven chapters and three annexes, as described below:
• Chapter 2 contextualizes the work of the Mitigation Working Group, and describes its mandate, process, and approach
• Chapter 3 summarizes key findings• Chapter 4 highlights the input that was received from National Indigenous Organizations • Chapter 5 summarizes input received from the general public and key stakeholders,
and explains how their solutions were integrated into the development of policy options. • Chapter 6 provides profiles of each major economic sector, which briefly describe economic and
emissions trends, policies currently in place, and key opportunities for further emissions reductions. • Chapter 7 provides concluding thoughts • Annex 1 provides a summary table of all policy options • Annex 2 presents short profiles of each policy option • Annex 3 provides more detail on key methodological choices and the economic modeling approach
used to assess emissions reductions from each policy option.
The core content of this report references and builds on the policy options that are summarized in Annex 1 and explored more fully in Annex 2. Each policy option is identified by a letter, corresponding to the economic sector with which it is associated (e.g., B for Built Environment) and a number. Specific policy options are referred to throughout this report by a letter and number (e.g., option B1 is Net-Zero Ready Codes for New Housing). A summary list of all policy options and the corresponding letter/ number by which they are identified in this report follows below.

Working Group on Specific Mitigation Opportunities Final Report
10
1.2 List of Policy Options
The following is a list of the policy options presented in this report. These options are referenced in Chapter 3, Key Findings and Considerations, are summarized in Annex 1 and are explored in greater detail in Annex 2.
Large Industrial EmittersI1. Use Incentives to Promote CogenerationI2. Transitioning to ElectrificationI3. Mandate or Use Incentives to Promote Energy Efficiency I4. Zero Routine Flaring I5. Fuel Switching to Lower Carbon Alternatives I6. Methane Reductions I7. Limiting Carbon Emissions through Abatement and Sequestration (CCS and other) Technology I8. Emission intensity regulations to drive transformative changes in technology throughout the industrial sectors
TransportationT1: Passenger Vehicle Emission Regulations and IncentivesT2: Increased Availability and Use of low-carbon Fuel for On-road and Off-road VehiclesT3: Energy Efficiency in the Aviation, Rail, Marine and Off-road Industrial SectorsT4: Heavy Duty Vehicle and Engine Emission Regulations and IncentivesT5: Vehicle and Engine Fuel Efficiency in the Aviation, Marine, Rail and Off-road SectorsT6: Fuel Efficiency of On-road VehiclesT7. Freight EfficiencyT8: Changing Transportation Usage Patterns T9: Reducing Congestion and Vehicle-kilometers TravelledT10. Increased Availability and Use of Low Carbon Fuels in the Domestic Marine, Rail and Aviation Sectors
Built EnvironmentB1. Net- Zero Ready Codes for New Housing B2. Existing Housing B3. Net-Zero Ready Codes for New Commercial-Institutional Buildings B4. Existing Commercial-Institutional Buildings B5. Equipment Efficiency B6. Renewable Power and Fuel Switching B7. Demand Response Opportunities and Behaviour Change B8. Urban Form & Spatial Planning
ElectricityE1. Emissions Intensity Performance Standard for Fossil Fuel-fired Electricity Generation E2. Accelerated Phase-out of Coal-Fired ElectricityE3. Non-Emitting Portfolio Standard for Electricity Generation E4. Provide Financial Support to New Non Emitting Electricity Generating FacilitiesE5. Financial Support to Reduce Reliance on Diesel Energy in Northern and Remote Communities E6. Increase Interjurisdictional Transfers of Non-Emitting Electricity

Working Group on Specific Mitigation Opportunities Final Report
10Working Group on Specific Mitigation Opportunities Final Report
11
AgricultureA1. Reduction of Methane Emissions from Cattle A2. Convert Marginal Land from Annual Crop Land to Permanent Cover A3. Increase Acres of Nitrogen Fixing Crops, Pulses/Forages in Rotation A4. Increase Adoption of Zero TillA5. Enhance Adoption of Available Technologies That Capture and Destroy/ Treat Methane from Manure Storage Systems on Large Farms A6. Increase the Total Crop Area on Which Precision Application Methods for Nitrogen Fertilizers Are Used
ForestryF1. Increase Domestic Wood Use as a Substitute Material for More Emissions-Intensive Building Products F2. The New Forest Program F3. Increased Forest Rehabilitation F4. Change in Forest Management Practices
Waste W1. Landfill Gas Capture and Utilization W2. Reduce Avoidable Food Waste W3. Diversion of Organics W4. Diversion of Recyclable Materials
Government Operations and LeadershipG1. Carbon Neutral Government

Working Group on Specific Mitigation Opportunities Final Report
12
2 OVERVIEW
2.1 Introduction
In Canada and abroad, the impacts of climate change are already becoming evident. The science is clear that human activities are driving unprecedented changes in the Earth’s climate, which pose significant risks to human health and economic growth. Ambitious global action is needed to avoid severe negative impacts of climate change, some of which are already being felt in Canada, such as rising sea levels, coastal erosion, melting permafrost, thinning sea ice, shifting precipitation patterns, increases in heat waves, droughts and flooding, risks to critical infrastructure and food security, and the spread of invasive species and diseases.
The international community has broadly agreed that tackling climate change is an urgent priority, and also a historic opportunity to shift towards a low-carbon economy. The adoption of the Paris Agreement in December 2015 was the culmination of years of negotiations under the United Nations Framework Convention on Climate Change (UNFCCC). The Paris Agreement is a commitment to accelerate and intensify the actions and investments needed for a sustainable low carbon future. In order to limit global average temperature rise to well below 2°C and pursue efforts to limit the increase to 1.5°C, all Parties to the agreement are required to put forward their best efforts through “nationally determined contributions” (NDCs) and to strengthen these efforts in the years ahead.
Provincial, territorial, federal, municipal, and Indigenous leaders all contributed constructively to the development of the Paris Agreement. Canada’s collective task is now to ensure that domestic action on climate change is consistent with the long-term low-carbon development objectives set out in the Paris Agreement. Canada has submitted an NDC that sets a target of a 30% reduction below 2005 levels of emissions by 2030. The current federal government has stated that this will be Canada’s minimum contribution and has committed to working with provinces and territories to achieve this target. Commitments and actions already taken by provinces and territories provide a strong foundation for Canada’s climate action. However, there is still a significant gap between business-as-usual emissions projections to 2030 and Canada’s 2030 target. Based on Canada’s most recent emissions projections which were published in Canada’s Second Biennial Report on Climate Change (in February 2016) and which take into account measures in place as of September 2015, Canada’s emissions in 2030 will exceed the target of 30% below 2005 levels by 291 megatonnes (Mt) unless further action is taken.
There are a number of recently announced policies that are not included in these emissions projections that will help to reduce the gap to Canada’s 2030 target.1 These include, for instance, proposed federal regulations for hydrofluorocarbons (HFCs), heavy-duty vehicles, and methane emissions from the oil and gas sector; Ontario’s (ON) cap-and-trade system and Climate Change Action Plan; Alberta’s (AB) Climate Leadership Plan; Saskatchewan’s (SK) renewable energy target; Newfoundland and Labrador’s (NL) Management of Greenhouse Gases Act; and British Columbia’s (BC) Climate Leadership Plan; as well as the federal government’s endorsement of the World Bank’s Zero Routine Flaring by 2050 initiative. Nevertheless, concerted, collaborative, and coordinated action by all orders of government will be needed to fulfill Canada’s climate change commitments.
While the scale of Canada’s emissions reduction challenge is significant, and compounded by factors such as a cold climate and a population that is dispersed over a large geographic area, Canada also benefits from a highly educated population and rich endowments of natural resources. With careful, forward-looking planning and strategic investments, Canada can position itself to be a leader in the global transition to a low-carbon economy.
1 Time constraints and lack of detail for some announced policies meant it was not possible to update the baseline or business as usual scenario for this report. An updated business as usual scenario will be available later in 2016/17.

Working Group on Specific Mitigation Opportunities Final Report
12Working Group on Specific Mitigation Opportunities Final Report
13
Figure 1: Canada’s Emissions Projections in 2020 and 2030 (Mt CO2e)2
Meeting Canada’s climate change mitigation target will require action across all economic sectors. Historical emissions by major economic sector in Canada, as presented in Canada’s Second Biennial Report, are shown in the graph below.
Figure 2: 2013 Emissions by Economic Sector
An important aspect of Canada’s GHG emissions that is not fully captured in the trends and emissions described above is the impact of Short Lived Climate Pollutants (SLCPs). SLCPs are GHGs and/or air pollutants with short atmospheric lifetimes compared to longer-lived GHGs that have a warming impact
2 The range of projected emissions in this graph is based on a range of different scenarios that reflect the impact of key drivers of GHG emissions in Canada, notably oil and gas prices and economic growth. Projections exclude emissions and removals from the Land Use, Land-use Change and Forestry Sector (LULUCF). Please see Canada’s Second Biennial Report for a complete discussion of these scenarios.

Working Group on Specific Mitigation Opportunities Final Report
14
on climate. Because of their short atmospheric lifetimes, reducing SLCPs is particularly relevant for slowing the rate of climate change in the short term. While some SLCPs, such as methane, are included in emissions trends, an important air pollutant that is not is black carbon, a component of fine particulate matter released by the incomplete combustion of fossil fuels and biomass. The biggest sources of black carbon in Canada are on- and off-road diesel vehicles and engines, followed by residential wood burning. Stationary diesel engines are another regionally significant source in the North.
The Vancouver DeclarationBuilding on the commitments and actions already taken by provinces and territories and the momentum of the Paris Agreement, Canada’s First Ministers met on March 3, 2016 and issued the Vancouver Declaration on Clean Growth and Climate Change (Vancouver Declaration). Under the Declaration, First Ministers affirmed Canada’s commitment to taking action to address climate change while supporting a transition to a sustainable, low-carbon economy, and launched four federal, provincial, and territorial (FPT) working groups mandated to identify specific actions to grow Canada’s economy while reducing greenhouse gas emissions and adapting to climate change. These working groups were tasked with developing reports identifying options for action in the following areas: clean technology, innovation and jobs; carbon pricing mechanisms; specific mitigation opportunities; and adaptation and climate resilience.
2.2 The Mitigation Working Group: Mandate and Process
The Vancouver Declaration sets out the following mandate for the Mitigation Working Group (MWG):
The Working Group on Specific Mitigation Opportunities will provide a report with options on how to promote clean growth and achieve a range of ambitious reductions in key sectors, including large industrial emitters, transportation, electricity generation and transmission, built environment, agriculture and forestry, and government operations as well as individual energy conservation actions. The working group will also look at approaches to internationally transferred mitigation outcomes, in the context of the Paris Agreement. The working group, supported by technical subgroups, will consider various emissions reduction opportunities, taking into consideration existing and planned policies.
The core deliverable of the MWG was a report with a broad range of practical, implementable policy options for each key sector to achieve ambitious GHG emissions reductions by 2030. As per the Vancouver Declaration, this report was delivered to the Canadian Council of Ministers of the Environment in September 2016.
The report does not rank or prioritize policy options, as the development of recommendations falls under the purview of Ministers. However, it provides relevant analysis and considerations to support Ministerial discussions on policy options.
The MWG was co-chaired by the Government of Canada and the Provinces of British Columbia (BC) and Alberta (AB). It established six technical subgroups in mid-April 2016, comprised of FPT government experts. The subgroups conducted their work from mid-April to mid-July 2016. The subgroups were:
• Large Industrial Emitters (including oil and gas)• Transportation• Built Environment• Electricity Generation and Transmission• Agriculture and Forestry• Government Operations and Leadership3
3 These subgroups follow direction from the Vancouver Declaration and the breakdown of emissions in these sectors varies somewhat from the way they are presented in the Biennial Report (as in Figure 2). For instance, the Large Industrial Emitter subgroup includes emissions from the oil and gas sector, Emissions-Intensive and Trade-Exposed (EITE) industries sector, and light manufacturing, which

Working Group on Specific Mitigation Opportunities Final Report
14Working Group on Specific Mitigation Opportunities Final Report
15
• The Mitigation Working Group provided guidance to subgroups, and examined specific policy options related to internationally transferred mitigation outcomes (ITMOs) and the waste sector. Individual energy conservation actions were considered across all subgroups.
Sub-groups developed a wide range of policy options that met multiple objectives.
Policy options for each sector needed to:
• Cover all of the principal opportunities for emissions reductions;• Include highly ambitious policy options to ensure deep reductions;• Be presented from a jurisdictionally-neutral, national perspective;• Reflect options proposed by Indigenous peoples, the public and stakeholders; and• Provide enough detail where possible to be considered as practical, implementable options.
This report is intended as a broad menu or toolbox, from which Ministers can choose and adapt the most relevant options for future plans. Sub-groups were asked to develop a comprehensive set of illustrative policy options, rather than an exhaustive description of all possible policy design variations. To ensure broad consideration of possible opportunities, the MWG has included many ambitious policy options that may not be relevant or feasible for all jurisdictions, and that could have significant economic impacts in some cases. Therefore, importantly, the report includes policy options that not all jurisdictions endorse or would be prepared to implement. In many cases, these policies are examples of the types of approaches that could be taken, with the understanding that these policies would be adjusted and refined before being implemented.
As this was a joint FPT initiative, the MWG considered policy options that can be implemented by one or more orders of government, either independently or in collaboration with other jurisdictions. Wherever possible, this report is neutral regarding which order of government is best placed to implement each option and presents potential emissions reductions and costs from a national perspective.
Options in this report focus on GHG emissions reductions in the 2030 timeframe, to support efforts to meet Canada’s international commitment under the Paris Agreement. Options do not include specific measures aimed at reducing black carbon emissions, which could have an important role in reaching temperature goals. However, potential black carbon reductions from measures are identified for each measure as a co-benefit, and measures for future consideration are discussed under key findings and considerations.
Annex 3: Report Scope and Limitations provides more detail on key methodological choices in developing policy options for this report.
2.2.1 Estimating emissions reductions
Greenhouse gas (GHG) reductions in 2030 were estimated wherever possible using modeling from Environment and Climate Change Canada using its Energy, Emissions and Economy Model for Canada (E3MC). Where it was not possible to model the impacts of a given policy, subgroups estimated reductions using the best available information from existing studies and policies in other jurisdictions.
Emissions reductions were estimated separately for each policy option against a baseline or business-as-usual scenario of emissions projections to 2030 that included all existing policies as of September 2015. Estimated reductions do not account for overlaps or interactions between policy options and any of the many new policies announced by all orders of government since September 2015. Consequently, reductions from proposed policies need to be considered separately – they cannot be added together without greatly overestimating total reductions.
in the Biennial Report is found in the ‘Waste and Others’ category. The sector profiles in this report reflect emissions profiles that align with subgroup areas identified in the Vancouver Declaration.

Working Group on Specific Mitigation Opportunities Final Report
16
While most options consider only emissions reductions that would be directly associated with the policy, a few options have taken a broad ‘lifecycle’ approach that also considered the indirect emissions reductions that would occur across multiple sectors as a result of changes to inputs and processes associated with the policy measure.
2.2.2 Estimating costs per tonne
Climate change mitigation policies are often compared based on how much it costs society to avoid a tonne of carbon dioxide equivalent (CO2e), known as the cost per tonne of the policy.
Policy options in this report generally include estimates of the costs of proposed policies presented in terms of the “economic cost per tonne” of the policy. Where possible, this is estimated to be the total lifetime incremental economic costs generated by the policy, including all costs to businesses, consumers, and government, net of easily quantifiable benefits (principally fuel savings), divided by the amount of tonnes of CO2e reduced over the lifetime of the implemented measure. Costs were incremental to a business-as-usual scenario. Costs can be negative if the savings realized over time (e.g., reduced fuel use from an energy efficiency policy) are greater than the costs associated with implementing the policy.
For example, a proposed policy to improve building codes included the additional cost of building a new home to a more stringent code, instead of the current code (e.g. additional insulation). Fuel savings from reduced heating and cooling costs over the lifetime of the home were subtracted from these costs. This net cost was divided by the total tonnes of CO2e avoided due to reduced energy use over the lifetime of the home.
Where costs included capital expenditures, net present value costs applied discount rates to any fuel savings over the lifetime of equipment. However, no discounting was applied to GHG reductions achieved over the same duration.
The cost estimates in this report are intended to give a general indication of which measures have low, modest, or high costs. As they rely on existing estimates in the available literature and/or calculations by technical experts, cost estimates may not be fully comparable because of differing assumptions on key variables such as future fuel costs, building costs, technology costs, capital turnover rates, discount rates and exchange rates. As such, they are subject to considerable uncertainty. There are additional—and potentially significant—costs and benefits that were not calculated in this report, such as infrastructure needs, financial impacts of retiring carbon-intensive assets before the end of their useful life (i.e. stranded assets), or benefits from reduced health costs. More specific details on the calculation of cost per tonne estimates for each policy can be found in the policy option profiles in Annex 2.
• Economic cost per tonne estimates are generally expressed as broad ranges: » < $0/t (negative cost, i.e., savings are greater than cost) » $0-50/t » $50-100/t » $100-250/t » > $250/t
2.2.3 Integration with Other Working Groups
The three other working groups established by the Vancouver Declaration – on Carbon Pricing Mechanisms; Innovation, Clean Technology and Jobs; and Adaptation and Resilience – address other important elements of a national climate change plan.

Working Group on Specific Mitigation Opportunities Final Report
16Working Group on Specific Mitigation Opportunities Final Report
17
A number of the mitigation policies in this report would also help to advance climate change adaptation objectives, or could be implemented alongside adaptation measures. A detailed discussion of options for climate change adaptation can be found in the report of the Working Group on Adaptation and Resilience, but linkages between adaptation and mitigation options have been highlighted in this report where relevant.
Carbon pricing is another type of mitigation measure, which has been addressed by the Working Group on Carbon Pricing Mechanisms. The MWG report includes measures that can complement carbon pricing, measures that can be used as an alternative to carbon pricing, and measures that drive long-term change or achieve other benefits alongside carbon pricing. Interactions between pricing and other policies are discussed in Chapter 3.
There are practical limits to regulations and other mitigation measures (e.g. high compliance costs, infrastructure needs) that can be addressed by support for research, development, and demonstration (RD&D) and investments in key infrastructure. Such actions can help bring down the cost of mitigation opportunities. This provides an important feedback loop between these measures, enabling more ambitious pricing and mitigation measures as more low and non-emitting technologies become available. Options for investment in RD&D and innovation are addressed in the report produced by the Working Group on Clean Technology, Innovation, and Jobs. Some of the options developed by the Mitigation Working Group identify key technological gaps that could benefit from the options to support clean technology and innovation proposed by the Working Group on Clean Technology, Innovation, and Jobs.
In important ways, the mandates of these working groups reflect three essential elements of a comprehensive approach to mitigating GHG emissions: broad, economy-wide carbon pricing; specific and targeted regulations and other policy instruments; and support for research, development and demonstration (RD&D) for new technologies.4 Each plays a particular role when implemented together.
2.2.4 Inclusion of Indigenous Peoples
Working group membership was limited to FPT officials; however, the co-chairs of the working groups held regular teleconference calls or face-to-face meetings with the Assembly of First Nations (AFN), the Métis National Council (MNC), and Inuit Tapiriit Kanatami (ITK) to provide updates on their work. These National Indigenous Organizations were also invited to discussion sessions with the full working group at face-to-face meetings.
In parallel to the working group process, the AFN, MNC, and ITK engaged with their respective memberships to develop input on climate change solutions that meet the needs and priorities of Indigenous peoples. However, the timelines and structure of the working group process posed significant challenges. An ongoing process of meaningful engagement with Indigenous peoples will be needed in order to ensure that the priorities of Indigenous communities are reflected in a pan-Canadian framework on clean growth and climate change.
Input received from the AFN and MNC is reflected in Chapter 4, as well as incorporated into the section on Indigenous Perspectives in Chapter 3 and in various policy options throughout this report. The ITK chose to provide their input directly to Ministers.
4 See also OECD/IEA/NEA/ITF (2015), Aligning Policies for a Low-carbon Economy, OECD Publishing, Paris. http://dx.doi.org/10.1787/9789264233294-en.

Working Group on Specific Mitigation Opportunities Final Report
18
2.2.5 Public and stakeholder engagement
The MWG and other working groups engaged the public and key experts and stakeholders via two approaches:
• Public engagement, through an interactive website, email, regular mail, and publically organized town halls, and• Consultation with key experts and stakeholders, through a series of three full-day roundtable events.
In April, the Government of Canada launched an interactive website where Canadians could share their ideas on how to address climate change and promote clean growth. This platform allowed Canadians to share their ideas, comment on the ideas of others, and be part of a national conversation on climate change. The website also gave Canadians the tools to hold town halls and discuss these issues within their communities. The public was further encouraged to submit comments by email and mailed correspondence.
All four working groups incorporated public input received through the interactive website and by email into their work. Chapter 5 outlines key themes and presents statistics describing the input received from the public and stakeholders.

Working Group on Specific Mitigation Opportunities Final Report
18Working Group on Specific Mitigation Opportunities Final Report
19
3 KEY FINDINGS AND CONSIDERATIONSThe process of selecting and designing climate policies is complex. Climate policies can have direct and indirect impacts on a broad range of economic activities and social outcomes, as well as varying impacts across regions and populations. These impacts need to be carefully weighed and managed.
When considering whether to implement a specific mitigation policy, key questions for policymakers to ask include:
• What are the potential emissions reductions, and at what cost?• What are the potential positive and negative impacts on economic growth, jobs, and competitiveness?• Is this policy still necessary if other policies, such as a carbon price, are in place?• Is this policy needed to enable foundational, transformative changes that will facilitate the transition
to a low-carbon future in the long term?• Are there other benefits from this policy, like improved health outcomes?• Does this policy contribute to other key policy objectives beyond climate policy?
Once a policy has been selected, the details of how it ought to be designed are crucial to ensure it achieves its objectives while minimizing negative impacts. Some of the key questions to ask related to policy design include:
• Which type of policy tool(s) are best suited to implement this policy?• How does this policy need to be tailored to address different regional circumstances?• Does this policy address the unique considerations and priorities of Indigenous peoples?• Is it appropriate to the needs of Northern and remote communities?• What types of infrastructure or technology would be needed to support this policy?• Can this policy contribute to or reinforce climate change adaptation objectives?
The ranking and weighting of all of the above factors depend on the priorities of each decision-maker. While this report does not attempt to prioritize options, the sections that follow provide more detailed information on the relationship between the options in this report and the considerations listed above.
3.1 Estimated Emissions Reductions and Costs
Two important issues to consider in weighing the policies presented in this report are the amount of emissions reductions each policy will achieve, and the relative cost of the policy in terms of costs per tonne of emissions reduced.
There are important limitations to keep in mind when looking at these two factors. Many of these policies overlap and interact with each other or represent alternative approaches. As such, reductions cannot be summed together. Policies in this report may also interact with some of the new provincial, federal and territorial measures announced since September 2015. As an illustration, when added up, estimated reductions from these policies are a minimum of 400 Mt - far more than the 291 Mt gap to Canada’s 2030 emissions. This vastly overestimates the combined impact of these policies if they were all implemented together. Understanding the real impact of these policies will require choosing packages of mitigation policies to model together. However, reduction estimates do give a sense of the relative impact of each policy and where the biggest opportunities lie.
Similarly, the costs per tonne discussed below are most useful as a tool for comparing policies at a national level and identifying relatively low-cost measures. These estimates used broad, indicative ranges and are net of any direct cost savings, such as reduced fuel use. They do not, however, reflect regional differences or costs related to enabling infrastructure, which could be very high for some policies in some jurisdictions.

Working Group on Specific Mitigation Opportunities Final Report
20
For example, moving away from coal-fired electricity may require new natural gas pipelines in some regions, or new electricity transmission infrastructure in others. More indirect benefits, such as reduced health costs due to lower air pollution levels, are also not reflected. The costs presented in this report also do not reflect who would bear the cost – e.g., industry, individuals, and/or government. This will depend on the chosen policy tool as well as the competitiveness of the sector, with some sectors more able to pass costs on to consumers.
With these caveats in mind, policy options are discussed below in order of estimated cost per tonne.5 Some Built Environment policies, which broke costs out by fuel type, are discussed separately, as are policies that estimated emissions reductions on a lifecycle basis.
Policies with negative costs ($<0/t)Significant opportunities (5-10 Mt): A handful of policy options have estimated negative costs – i.e., savings will outweigh the costs over time. Recently announced federal regulations for heavy-duty vehicles (T4) could achieve 3-6 Mt, and ambitious retrofit and recommissioning policies for commercial and institutional buildings (B4) could achieve up to 6 Mt.
Other policies with negative costs that achieve small (<5 Mt) reductions include transportation measures such as improving freight logistics (T7a) and allowing for heavier and longer trucks on roads (T4e) as well as measures that target behavioural changes of building users (B7) and commuters (T8, T9).
Policies with costs in the range of $0-$50 per tonneMajor opportunities (>10Mt): Major reductions in this cost range could be achieved by policies aimed at increasing the availability and use of low carbon fuels, including a low carbon fuel standard (T2). Industrial energy efficiency measures (I3) could achieve reductions of 10 Mt or more in this cost range, as could announced federal and provincial methane reduction measures (I6). Changes in forest management practices (F4) could also reduce emissions by up to 10 Mt.
Significant opportunities (5-10 Mt): Ambitious tree-planting programs (F2a) could achieve over 5 Mt of reductions, as could changes in forest management practices to focus on climate change mitigation (F4). Requiring domestic flights to compensate for most or all of their emissions by purchasing emissions offset credits (T3a) could also achieve substantial reductions, although costs could be higher if offset credit prices increase. Eliminating heavy oil use in industrial combustion equipment (I5a) could also achieve up to 6 Mt of reductions.
Other opportunities: Policies that could achieve smaller amounts of reductions include incentives to enhance the use of cogeneration (combined production of heating/cooling and electrical power) in the industrial and electricity sectors (I1); efforts to reduce speeding (T6); policies to increase the use of wood in construction (F1); and regulations or incentives to reduce methane emissions from landfills (W1). Various agricultural measures (A1, A2, A3, A4, A6) could achieve modest reductions (<1-1Mt each) at low cost.
Policies with costs in the range of $50-$100 per tonneMajor opportunities (>10Mt): Most policy options for reducing electricity generation emissions fall into this cost range and produce substantial reductions (E1, E2, E3, E4, E6).6
5 Some policies options only include very wide ranges for costs (e.g., $0-250/t) – they are presented here in terms of the high end of their cost ranges.
6 However, Nova Scotia estimates that the cost of some of these measures in their jurisdiction would be over $250/t.

Working Group on Specific Mitigation Opportunities Final Report
20Working Group on Specific Mitigation Opportunities Final Report
21
Significant opportunities (5-10 Mt): Ambitious standards for light-duty vehicle and/or policies to increase the market share of zero-emissions vehicles (T1) could achieve significant reductions, a portion of which may be available to a cost below $50/ tonne. Policies to reduce emissions from off-road vehicles could potentially also reduce emission by over 5 Mt.
Other opportunities: Smaller reductions (<5 Mt) are available from policies that encourage purchasing low-emission vehicles (T9), increase the use of carbon capture and sequestration in industrial sectors (I7), rehabilitation of crown land affected by natural disturbances (F3), and better road pricing and measures for in-use heavy-duty vehicles (T7c and T4). Limiting carbon emissions through abatement and sequestration (CCS and other) technology (I7) could also achieve reductions of up to 5 Mt.
Policies with costs in the range of $100-$250 per tonneMajor opportunities (>10Mt): Industrial policies to encourage the use of lower carbon alternatives to fossil fuels such as renewable natural gas (I5), accelerate electrification (I2), and adopt transformative technologies (I8) could achieve more than 10 Mt of reductions each. More ambitious methane reduction targets for industrial sectors could also produce significant incremental reductions (I6b), in a wide cost range ($0-$250/t).
Significant opportunities (5-10 Mt): Policies to scrap older passenger vehicles (T1b) could achieve more than 5 Mt of reductions.
Other opportunities: More modest reductions could be driven by various transportation policies aimed at fuel efficiency (T6), measures targeting the marine, rail and aviation sectors (T3, T10, T5), changing transportation usage patterns (T8), and providing financial incentives to purchase zero emission vehicles (T1); targeted financial incentives for non-emitting generation in northern and remote communities (E5); and some agricultural policies (A1, A3, A6).
Policies with costs greater than $250 per tonnePolicies with costs of over $250 per tonne that were included in this report generally achieved small reductions (i.e., in the range of <1 – 3 Mt). Examples of these policies include efforts to eliminate routine flaring in the oil and gas and other sectors; a few specific transportation options to change transportation usage patterns (T8d, g), support modal shift (T7b), scrap older heavy-duty vehicles (T4d) and regulate in-use vehicles in the off-road, aviation, marine or rail sectors (T5d); programs targeting solar photovoltaic installations for residential buildings (B6); and agricultural manure management programs (A5).
Some policies have broad cost ranges that stretch above $250, suggesting a portion of emissions may require significant expenditures. These include industrial electrification (I2), heavy-duty vehicle retrofits (T4), energy efficiency measures in the aviation, marine, rail and off-road sectors (T5), and targeted financial incentives for non-emitting generation in northern and remote communities (E5).
Other policies:
Built Environment policies with variable costs based on fuel typeCosts for many built environment policies vary substantially by fuel type, because differences in fuel prices affect the potential cost savings from these policies. In particular, current natural gas prices are roughly one third those for electricity. Where buildings use natural gas, building codes, retrofit programs, and fuel switching to electricity have relatively high costs per tonne, reaching over $250/t in some cases. Where these measures target electrically heated buildings, on the other hand, costs are negative. Costs for oil-heated

Working Group on Specific Mitigation Opportunities Final Report
22
buildings are also relatively low. Estimated costs for retrofit programs are also likely conservative, since they don’t reflect the fact that the older, more inefficient buildings can be retrofitted at low or negative costs per tonne in some cases, even when fueled by natural gas.7
Ambitious, ‘net-zero-ready’ residential (B1) and commercial (B3) building codes could produce roughly 5 Mt of reductions in 2030 each, as could the most ambitious residential retrofit programs (B2) and residential fuel-switching programs (B6). More stringent standards for equipment and appliances (B5) could achieve up to 8 Mt of reductions, with costs also varying by equipment and fuel type and potentially low for some equipment.
As discussed below in the section on Foundational and Transformative Change, the longer-term transition to a low carbon economy will likely require moving away from natural gas heating towards low-emissions electricity and/or other low-emissions fuels. This is an important factor to keep in mind when considering the relative costs of built environment policies.
Lifecycle emissions reductionsSeveral policies in this report estimate ‘lifecycle’ emissions reductions – reductions caused across the economy, and in some cases at a global rather than national level. Notably, an ambitious policy to reduce food waste by 50% (W2) could achieve 10-15 Mt of lifecycle reductions at a negative cost, and policies to divert recyclable materials (W4) from the waste stream could achieve similar reductions at low cost (under $50/t). Many of these reductions would occur outside of Canada. Policies to divert organics from the waste stream (W3) and encourage more use of wood in buildings (F1) would achieve more modest reductions (<5 Mt), all within Canada.
While the emissions reductions and costs are central considerations in determining which mix of policy options is most appropriate, there are many other factors that should also be carefully weighed by decision-makers. The sections that follow highlight a number of these considerations.
3.2 Economic and Employment Impacts
There are likely to be opportunities for significant economic and employment growth in the development and provision of materials, technologies and fuels needed to transition to a low-carbon economy. However, this transition will also be costly; most sectors will face new costs, largely in proportion to their emissions intensity. Consumers could see the prices of goods and services rise, in particular carbon-intensive activities such as transportation and home heating. It is, however, important to consider these costs in relation to global direct and indirect economic benefits, which could be considerable, as well as the long-term costs of not taking action on climate change, which some have argued could have severe negative impacts on the global economy.
A number of sectors will likely experience positive economic spinoffs due to mitigation policies. In jurisdictions that have already taken action, some of these trends are already underway. For example, the construction sector would likely expand to meet demand for building retrofits, and may also have to reorient some of its work practices to incorporate new techniques for net-zero ready energy construction on a large scale (B1-B5). Studies have shown that investments in energy efficiency for buildings can lead to increases in GDP (B2). Another domestic industry that has the potential for considerable growth is the renewable and low-carbon fuels sector. Policies requiring increased use of low-carbon fuels would create strong demand, although policy design can impact whether the fuels are produced domestically or imported (T10, T2, I5). Building new, clean electricity generation such as wind turbines, hydroelectric facilities and solar panels,
7 Differences in costs per tonne between the energy efficiency policy option in the Large Industrial Emitters sector (I3) and those in the Built Environment sector (B2, B4) are due to the emissions-intensive nature of industry. Buildings—in particular low-rise residential housing—are not emissions-intensive, and thus reduction potential is lower and costs per tonne are higher.

Working Group on Specific Mitigation Opportunities Final Report
22Working Group on Specific Mitigation Opportunities Final Report
23
as well as power lines to transmit the electricity would also generate jobs and growth through construction and, potentially, domestic technology development (E1, E3, E4 , E6). Another key opportunity is in the development of carbon capture and storage (CCS) technology. This is an area where Canadian industry has an opportunity not just to deploy their technology at home, but to become a global market leader (I7). Domestic natural gas production may also experience growth in the short-to-medium term as industries switch away from heavier fuels (I5).
There may be opportunities for Indigenous leadership and economic development across a number of sectors, in particular in buildings, electricity and forestry. Indigenous communities have an urgent need for housing solutions that are safe, sustainable, culturally appropriate, and also energy efficient. Construction to meet these needs may represent an opportunity for Indigenous-owned businesses. Electricity and energy solutions for Indigenous communities, such as reducing reliance on diesel (E5) and increasing use of renewable and distributed generation, could support local economic growth. The AFN has proposed designing policies to allow for home or community renewable energy solutions or community ownership and operation of renewable energy projects. The AFN has also noted that Indigenous communities face significant barriers to economic development due to the high cost of doing business in their communities, and that improved access to capital as well as partnership and training programs could help overcome some of these barriers. The AFN also advocates that resource sharing and co-management agreements as well as impact benefit agreements should be designed to guarantee that First Nations are agents and drivers in the new economy. The MNC also identified housing and energy solutions, including reduced reliance on diesel, as two priority areas for Métis communities. The submission from the MNC also recommended the creation of Métis -specific contract capacity set asides for Métis businesses in government procurement strategies, including those businesses that have a clean technology focus. In addition, the MNC proposes establishing regional collaboration/ impact benefit agreements in Métis Nation Traditional Territories that include effective procurement provisions, particularly in the purchase of clean technologies, training, employment, community investment and equity participation benefits
The up-front costs associated with cutting emissions could be substantial. Near-term capital investments may be significant across a number of sectors, in particular those that have to install new equipment to reduce their emissions. Where financial incentives are provided to help accelerate these investments and reduce the economic burden on businesses, it is important to note that these incentives also represent costs to governments and taxpayers. In many cases, investments to cut emissions can pay off over the medium- to long-term through fuel and other operational savings. Examples include energy efficiency measures in the industrial (I3), transportation (T6, T3, T5) and buildings (B1-B5) sectors, capturing marketable products like methane that are currently being wasted (I4, I6, A6, W1), and broader structural changes to buildings, cities and transportation networks (B1, B3, B8, T3, T8, T7).
This general finding about upfront costs that pay back over time applies to consumers, businesses, industries, and governments, and points to the need for policies to consider the distributional impacts of the costs they impose. Care must be taken to minimize the burden on low income, rural and northern Canadians.
Impacts on consumers could be variable. There are opportunities for considerable savings due to greater efficiencies and lowered fuel costs (T6). At the same time, many costs will likely increase. Electricity prices would likely rise in provinces currently reliant on fossil fuels for their power generation (E1-E4). The costs of emission-intensive activities would also rise, such as driving large or inefficient vehicles and flying. The costs of consumer goods may be affected by changes to the freight sector, but it is difficult to project net impacts – increased fossil fuel prices could push the price of goods higher, but investments in efficiency and logistical coordination could bring prices down, making definitive conclusions difficult to reach (T4).

Working Group on Specific Mitigation Opportunities Final Report
24
The policies identified in this report vary widely in terms of cost and feasibility. Some are easy to implement measures that will realize quick cost savings. Others are ambitious ideas that could require aggressive action with considerable associated costs. In the latter cases in particular, further analysis is needed to better understand regional and national economic impacts and policies would have to be carefully designed to limit impacts and distribute the burden equitably.
3.3 Competitiveness
A large part of Canada’s economy is driven by international trade. Canada has a wealth of natural resources – from forests to oil deposits to hydro-electric resources – and industries whose products are sold to other countries in international markets. These trade-based industries that sell commodities to buyers outside of Canada face a particular set of economic and political challenges. They are generally “price takers,” meaning they have less control over the prices they can charge. The oil and gas sector is a prime example where price is determined through international markets. Producers can make decisions that affect their costs – but these costs are also in part influenced by government policy. Similarly, some manufacturing industries, such as the automotive sector, operate in integrated, competitive markets. For instance, policies to improve the energy efficiency of vehicles or increase the share of electric vehicles (T1) should be designed to enable Canadian manufacturers to maintain their competitiveness.
There are a number of considerations in designing mitigation policies that will impact these “trade-exposed” industries. Harmonizing policies across jurisdictions wherever possible helps set a level playing field for all actors. It also helps minimize “leakage” – that is, the movement of firms away from jurisdictions with ambitious policies toward those with weaker policies. Harmonization also simplifies regulatory compliance. Where harmonization is not possible, domestic policies can be designed to allow all businesses to comply without overly harming the competitive position of trade-exposed industries. This can be accomplished through tools such as exemptions or financial support.
There are also beneficial opportunities for some trade-exposed industries. In some energy-intensive sectors, developing new industrial technologies has the potential to actually provide Canadian firms with a competitive advantage over their international rivals by improving the efficiency of their processes (I8). Improvements to electrical grid infrastructure to facilitate inter-jurisdictional transfers could expand export markets for some provinces and allow them to sell excess supply of clean electricity (E6).
It is worth noting that industrial policy options presented in this report estimate costs across a variety of industries. The impact on each industry will vary depending on their profit margins or ability to pass these costs on to consumers. Even within trade-exposed sectors, some sectors may have the profit margin to absorb a certain level of costs, while other would be more challenged to do so.
Finally, the transition to a low-carbon economy could open new market opportunities for Canada and help to increase export markets for Canadian firms that offer innovative, low-carbon goods and services.
3.4 Interactions with Carbon Pricing
As detailed in the report by the Working Group on Carbon Pricing, a broad, economy-wide carbon price implemented via policies such as a carbon tax or a cap-and-trade system is widely regarded as one of the most efficient policy tools for reducing GHG emissions, as it provides flexibility to industry and consumers to identify the least-cost way to reduce their own emissions, and spur innovation to find new opportunities for emissions reduction.

Working Group on Specific Mitigation Opportunities Final Report
24Working Group on Specific Mitigation Opportunities Final Report
25
However, carbon pricing alone cannot address Canada’s GHG emissions. There are four reasons why other policy tools should be considered:
A. To complement pricing by overcoming barriers that carbon pricing cannot addressB. As an alternative to pricing – in particular, where pricing levels are not sufficiently stringent
on their own to achieve emissions reduction targetsC. To drive long-term change aimed at facilitating the transition to a low-carbon economyD. To achieve other benefits not reflected in carbon pricing
Complementary PoliciesTargeted complementary policies address specific barriers and could be implemented regardless of the level of pricing in place. Key barriers include:
• Emissions cannot be covered by a carbon price: It can be impractical to price emissions that are hard to quantify (e.g., fugitive methane emissions) or where both emissions and removals are associated with the same activity (e.g., forestry). Targeted policies are needed to address these emissions – for example, methane regulations (I6), waste stream diversion policies (W2-4), or targeted agriculture and forestry programs.
• Lack of information: Consumers and emitters may not have enough information about their own carbon emissions or low-carbon alternatives to take action. Policies such as labeling programs (B2, B4, B5) and technical assistance programs can close these gaps.
• Lack of alternatives: Without access to reasonably-priced alternatives, behaviour will not change as quickly or as much in response to a carbon price. Policies that increase the supply of alternatives can complement carbon pricing. Some examples include support for renewable energy in the north (E5), equipment and appliance standards (B5) or low carbon fuel standards (T2). More broadly, technological innovation is an important means to develop alternatives and to lower costs.
• Pricing does not fully support public goods: Carbon pricing does not fully drive investments in public goods such as transit (T8, B8), some electricity infrastructure (E6) and research and development (R&D). Technological advances spurred by R&D will be vital to achieve low cost reductions in the long term.8 These public goods continue to need to be delivered and/or funded by government.
• “Split incentives” between actors: Carbon pricing is not effective where the actor making an investment does not receive the benefits of that investment. For example, increased energy prices may not lead a landlord to invest in energy efficiency improvements in a rental property if the tenant pays the heating and power bills. Similarly, tenants may not reduce energy use where landlords pay energy bills. Building codes (B1, B3) and retrofit programs (B2, B4) can overcome this issue.
• Delayed response: Some activities do not respond to a carbon price quickly. For example, drivers may not buy more efficient vehicles in the near term to respond to a carbon price, making demand for gasoline relatively steady in the short term even with a carbon price. Targeted policies like codes and standards (B5) and low carbon fuel standards (T2) can help drive short term change.
• Lack of access to capital or structure of financial instruments: Some consumers or businesses may not have access to sufficient capital to make changes in response to a carbon price, for example low-income families, small businesses, and small/remote communities. Even where financing exists, people may not want to invest if payback periods are long and they do not expect to own the investment long enough to see future cost savings. These barriers can be addressed by targeted support such as building retrofit programs (B2, B4) or support for remote communities (E5). New financing instruments can also help to overcome these issues (see ‘Policy Tools’).
8 More broadly, research and development is hindered by persistent market failures (e.g. knowledge spillovers) and barriers (e.g. capital and time intensity).

Working Group on Specific Mitigation Opportunities Final Report
26
Alternative policiesOther policies act as potential alternatives to a carbon price – they are aimed at emissions or activities that would be addressed by a sufficiently stringent carbon price. The importance of these policies will depend on whether there is a price on carbon and how high it is.
For example, regulations for electricity generation (E1, E2) and industry (I1, I2, I3, I5, I7, I8) might not be needed if sufficiently stringent pricing is in place. However, without a price on carbon, or where such a price is relatively low, these measures can be designed to achieve similar outcomes as a carbon price.
Longer-term policiesFinally, even with relatively stringent pricing in place, specific and targeted mitigation policies will be needed to avoid investments and ‘lock-in’ of carbon-intensive equipment and infrastructure, drive transformative changes, and help ensure a consistent transition for all key economic sectors towards a low-carbon economy. For example, building codes and equipment standards (B1, B3, B5) ensure new equipment and buildings are highly efficient.
Realizing other benefitsGovernments may want to pursue specific policies that provide additional benefits beyond those associated with pricing. For example, transit investments provide mobility benefits for various populations and reduce congestion (B8, T8).
3.5 Foundational and Transformative Change
This report focuses on developing policies to reduce GHG emissions in order to help meet Canada’s 2030 emission reduction target.9 As challenging as it is, getting to 2030 is only the beginning of the battle. Ultimately Canada and the world will need to transition to a low-carbon economy by 2050; along with its G7 partners, Canada has recognized the need to reduce emissions by 40-70% or beyond by 2050, and many stakeholders have called for reductions of 80% or more. Some provinces and territories have set 80-95% reduction targets for 2050. Achieving this longer-term mid-century transition will not be possible without fundamental changes in the technologies and systems that power our society. Consequently, some policies that are important for reaching Canada’s 2030 goal may be less important for the longer-term transition, in particular those that target incremental changes such as some energy efficiency measures, or those that rely on a transition to lower-emitting fossil fuels such as natural gas. In these cases, careful planning will be needed to minimize the risk of stranded assets in the long term. Other policies may have limited impact in 2030 but will need to be put in place now in order to realize larger impacts in 2050. The latter category includes RD&D to continue developing cleaner technologies and stringent ‘net-zero ready’ building codes (B1, B3).
There are a few key large-scale transitions that will likely be central to building a low-carbon economy by 2050. There is broad agreement that electrification across multiple sectors, including industry, transportation and buildings, coupled with dramatic decarbonization of electricity generation is a promising pathway toward a low carbon economy. Canada’s electric grid is already about 80% non-emitting, and provinces and territories are taking further action to increase that percentage. This report identifies a number of policies to help accelerate the push to decarbonize electricity production, as well as policies to help other sectors to convert their operations to run off electricity.
9 Many provinces and territories have their own 2030 emission reduction targets, some have 2020 targets and some have 2050 targets. Some provinces also have targets by sector.

Working Group on Specific Mitigation Opportunities Final Report
26Working Group on Specific Mitigation Opportunities Final Report
27
Electrification may not be the solution in all sectors. For example, significant electrification may not be practical in Canada’s oil and gas sector, the country’s largest and fastest growing source of GHG emissions. In this sector, new transformative technologies hold great potential to reduce emissions. In some cases these technologies have already moved from the research lab to real-world trials. Continued investments today, together with forward-looking and aggressive expectations for efficiency improvements, can help scale up these next-generation technologies to commercial competitiveness in time for 2050. Transformative technologies can play a similar role in decarbonizing other sectors as well; a prime example is the potential for zero-emission vehicles to cut emissions from transportation. This report includes policy options that will indirectly support and incent the development and deployment of new technologies. Policies focused on technology development are explored in greater detail in the report of the Working Group on Clean Technology, Innovation and Jobs.
Another central consideration in transitioning to a low carbon economy is how to plan and design cities in order to support low-emission technologies and lifestyles. This kind of structural change will take time to realize, but governments can start building momentum in the short-term by deciding to take a holistic approach to development through integrating land use, transportation, energy production and community planning (B8, T8).
Another sector that will require time to realize its mitigation potential is the forestry sector. Trees take time to grow, and by 2050 Canada’s forests could be sequestering very significant amounts of CO2. This report identifies a number of policies (e.g., F2, F3, F4) that, if enacted in the near-term, could help the forest sector contribute in a major way to achieve Canada’s climate goals.
3.6 Co-benefits and Other Impacts
By reducing GHGs, climate change policies can help to minimize or avoid the future risks of climate change. However, climate policies may also positively and substantively contribute to other types of benefits, such as reduced air pollution and improved health, energy security, better quality of life, or reduced noise pollution. Climate policies can also help to maintain or improve other types of environmental goods like clean water, soil health, biodiversity, and ecosystem services. These multiple benefits from climate change policies are referred to as ‘co-benefits.’ Typically, the primary goal of climate change policies is to reduce GHGs, and other types of benefits are secondary effects. In some cases, however, the primary objective of a policy could be to reduce air pollution or achieve another type of benefit, and GHG reductions could be a secondary benefit. For example, investments in public transportation may not generate large GHG reductions in the near term, but would contribute to improved health and quality of life, as well as facilitate longer-term shifts between transportation modes.
It can be complex to compare the costs of climate change policies with these types of co-benefits, which are often non-monetary goods. The balance of costs and benefit vary by policy, but in some cases the total benefits of the climate policies may significantly outweigh the costs. For example, recently published Multi-Sector Air Pollutants Regulations (MSAPR) have an expected benefit to cost ratio of 5:1 for boilers and heaters equipment used to generate heat and steam for various purposes in many industrial facilities, and 16:1 for stationary engines equipment used for compression, electric power generation and pumping in many industrial facilities.10
10 www.ec.gc.ca/lcpe-cepa/default.asp?lang=En&n=FEA2BB78-1&printfullpage=true

Working Group on Specific Mitigation Opportunities Final Report
28
Climate change policies can also contribute to job creation and advances in clean technology and innovation. In some cases, climate change policies can generate direct cost savings and have negative costs. Some policies can have multiple benefits or objectives that are mutually reinforcing, such as reducing GHGs while contributing to innovation or adaptation objectives, creating jobs, or advancing priorities identified by Indigenous communities.
Burning fossil fuels generates air pollutants that have very serious negative implications for human health, such as particulate matter, black carbon, and others. Reducing air pollutants is a major co-benefit of climate policies, given their profound impact on health, the environment, and the economy. These benefits could be realized by policies that reduce the use of fossil fuels by improving efficiency and using less fuel (e.g.,I3, T6, T3, T7, T1, T4, T5, B1, B2, B3, B4, B5), by transitioning to lower-carbon fuels (e.g., I1, I2, I5,T2, E1, E2, E3, E4, B6), or by implementing management practices to capture and manage emissions that contribute to air pollution (e.g., I4, I6, I7, A6, W1).
Climate policies can also contribute to social goods, like livable cities, improved productivity, and quality of life. For instance, measures to reduce the use of personal vehicles and increase the use of public and active transportation (e.g., T9, T8) can help to alleviate traffic congestion, improve road safety, and promote active lifestyles, which can in turn reduce health care costs. A number of studies have indicated that highly efficient buildings (e.g., B1, B4) can help to enhance productivity and comfort.
There may also be other environmental benefits associated with climate change policies. For example, afforestation and forest rehabilitation policies (F2, F3) could contribute to enhanced habitat for wildlife and biodiversity. Soil health could be improved by cover crops on marginal land (A2) and nitrogen-fixing crops (A3), as well as increasing the diversion of organic matter from waste (W3), which would contribute to soil nutrient structure and improved water retention. Reducing fossil fuel use (e.g., coal) in the electricity sector could decrease water intake and discharge used for cooling as well as reductions in solid waste disposal.
Unless appropriately designed, however, climate policies can also have unintended negative impacts. For example, changes to industrial processes to achieve GHG reduction could produce additional air pollutants (e.g., increased temperature in cement kilns could lead to a significant increase in NOx emissions under I5). Rapidly increasing demand for building retrofits and/or imposing new building codes (B1-4) without sufficient time for training could raise construction costs and create potential health, safety, and building durability issues for homeowners. In the transportation sector, some operational efficiency measures (e.g., T3) could have negative impacts, such as increased noise. In some cases, the benefits would still outweigh the potential negative impacts, but these types of risks nevertheless need to be identified and managed.
3.7 Short-Lived Climate Pollutants
Short-lived climate pollutants (SLCPs) are GHGs and/or air pollutants with short atmospheric lifetimes compared to longer-lived GHGs, such as carbon dioxide, that have a warming impact on the climate. SLCPs include methane, hydrofluorocarbons (HFCs), black carbon, and tropospheric ozone. Methane, HFCs and ozone are GHGs. Black carbon and ozone are air pollutants. Methane is a precursor to ozone. As such action on SLCPs provides an opportunity to concurrently advance climate and air quality priorities.
The Intergovernmental Panel on Climate Change estimates that methane and black carbon are the second and third largest contributors to current warming, following CO2. Due to their short atmospheric lifetimes, reducing emissions of SLCPs will quite quickly lead to reduced atmospheric levels, and will help to slow the rate of warming. In fact, recent scientific studies indicate that the only way to meet temperature commitments in the Paris Agreement is to take early global action on CO2 and SLCPs. These expected benefits are particularly relevant for Canada as an Arctic nation. In Canada, the Arctic warmed by 2.2°C

Working Group on Specific Mitigation Opportunities Final Report
28Working Group on Specific Mitigation Opportunities Final Report
29
between 1948 and 2013 resulting in significant impacts to local populations and sensitive ecosystems. Black carbon is of particular significance in the Arctic due to its additional warming effect when deposited onto snow or ice, which accelerates melting.
The biggest opportunities to reduce methane emissions come from industrial sector (e.g., I4 and I6) and policies aimed at reducing landfill emissions and/or diverting organics from landfills (W1, W4). Some agricultural measures may also reduce methane emissions slightly (A1, A4). Multiple measures will reduce black carbon emissions as a cobenefit, either by reducing the use of fossil fuels by improving efficiency (e.g.,I3, T6, T3, T7, T1, T4, T5, B1, B2, B5), by transitioning to cleaner fuels (e.g.I1, I2, I5,T2, E1, E2, E3, E4, B6), or by implementing management practices to capture and manage emissions that contribute to air pollution (e.g., I4, I6, I7, A6, W1). Measures that target on and off-road diesel emissions (T6, T7, T2, T4,T5) are particularly relevant.
Potential areas for future consideration and action include:• Retrofitting or early retirement of equipment or engines• Regulations for new stationary diesel engines• Regulations, funding support, or awareness campaigns targeted wood-burning appliances
3.8 Policy Tools
Multiple policy tools could be used to implement many of the options presented in this report. The best policy tool is often dependent on the specific circumstances and priorities of the jurisdiction implementing the policy. In Canada, federal, provincial and territorial governments, along with municipal and Indigenous governments, all use multiple policy tools to achieve a variety of environmental goals.
The options in this report focus primarily on various types of regulatory, incentive and other non-pricing tools, since pricing instruments are considered under the Working Group on Carbon Pricing Mechanisms. Regulations can be used to require or prohibit particular work practices, processes or equipment, or can specify a level of performance that must be met (e.g., an acceptable level of emissions and/or an ambient environmental threshold) and allow regulatees to determine the best means of compliance.
Incentives are subsidies, generally financial, provided to encourage desirable action. Incentives should be designed carefully in order to minimize unintended consequences, ‘free ridership’ and potentially high government costs. Incentives, including environmental tax subsidies generally privilege one or a few avenues for emissions reduction over others, meaning they are less flexible than broad market instruments like carbon pricing.
Beyond direct incentives, there are a range of other fiscal tools that governments can use to support mitigation. These include measures to help fund mitigation actions and technology development such as green bonds and green banks, as well as measures to impose costs on emitters, such as royalties and rules around corporate disclosure of climate change-related risks. Reviewing existing subsidies is another important tool. Canada, along with the United States and other G20 countries, has committed to rationalize and phase out inefficient fossil fuel subsidies that encourage wasteful consumption over the medium term.11
Other important tools are targeted education programs and public awareness campaigns. These can support and complement other policy actions by, for example, providing people eligible for an incentive program with the information they need to take advantage of the incentive program. Training and technical assistance
11 This commitment was most recently affirmed in that G20 Leaders’ Communique Hangzhou Summit www.g20.org/English/Dynamic/201609/t20160906_3396.html

Working Group on Specific Mitigation Opportunities Final Report
30
programs are particularly important to facilitate the adoption of new technologies or techniques, e.g., in the building industry. In other cases, education and awareness alone can help drive behavioural changes. Some key educational and awareness-focused policy tools include:
• Informational tools such as labelling that allow consumers and businesses to include emissions intensity and energy efficiency in their decision-making;
• Training and technical assistance programs that help individuals and industries gain the skills needed to implement mitigation measures and/or shift industries when programmatic measures to sequester carbon or reduce emissions are not feasible for their industry;
• Awareness activities aimed at encouraging individual action.
Many GHG mitigation opportunities identified in this report could potentially be incented by carbon offset programs. A carbon offset represents one tonne of GHG reductions that can be used by another emitter to compensate for one tonne of GHG emissions. Generally programs are voluntary. Offset programs already exist within some emissions trading programs, for example in Quebec and Alberta, where entities can purchase offsets as one compliance option to meet regulatory requirements (e.g., instead of reducing emissions or using emission allowances or emission performance credits). Some sector-specific regulations, such as BC’s low carbon fuel standard, also allow for the use of reductions outside the regulated scope for compliance, similar to an offset program.The private sector has also created various offset programs for consumers and businesses interested in voluntarily compensating for their emissions. Input from the MNC suggests that Métis-driven offset programs could be considered as a means of involving Métis communities and ensuring that they benefit from climate change policies.
Offsets have a similar impact to incentive programs, but tend to have a high administrative burden which may prevent smaller proponents from moving ahead with valid projects. To be effective, offsets need to meet various environmental integrity criteria. For example, offsets must be ‘additional’ –i.e. they are not reductions that would have happened anyway. Offsets awarded for carbon sequestration projects need to be accompanied by rigorous rules to monitor and ensure the permanence of GHG emissions reductions. Offset programs are particularly relevant for activities that are more difficult to directly regulate, such as some of the agriculture and forestry measures identified in this report, when programmatic measures to sequester carbon or reduce emissions are not feasible. However, in practice they are limited by the need to develop and apply rigorous quantification protocols at a scale to justify the administrative costs
Considering distributional impacts is important in policy development – in particular, policies should be designed to limit negative consequences on specific groups. There are a variety of ways to achieve this. Regulations can include exemptions or other provisions that limit their application. Incentives and funding programs can include targeted carve-outs for specific populations; for example, an infrastructure funding program could include a portion that is earmarked specifically for infrastructure in Indigenous communities and/or for Indigenous-owned businesses. For instance, the MNC recommends providing financial support for growth of both Métis capital corporations and equity capital funds in each of the Métis Nation Traditional Territories, including flexible terms for use of capital funds to allow investment and loans to Métis Nation corporations that have a clean technology focus.
Table 1 below provides a high-level summary of the policy tools included in the options outlined in this report. In many cases, options include references to multiple types of policy tools, either as alternative approaches or levels of ambition, or as complementary measures. Therefore the number of policy tools included in the table is larger than the number of options.

Working Group on Specific Mitigation Opportunities Final Report
30Working Group on Specific Mitigation Opportunities Final Report
31
Table 1: Policy Tools
Sector Policy Tool
RegulationFinancial
Incentive (e.g., grant, tax, etc.)
Other fiscal instrument (e.g., loan)
Action Plan/ Management
Practices
Education/ awareness
Agriculture 5 1 2
Built Environment 13 10 4 3 13
Electricity 4 3 3 1
Forestry 3 2 2
Large Industrial Emitters 9 8 1 1
Transportation 19 14 15 5 3
Waste 3 3 2 1 2
Total 48 46 25 13 23
3.9 Regional Diversity
Not all options included in this report are appropriate for all jurisdictions. The majority of options presented could be national in scope, but would need to be tailored to take into account the economic structure and resource endowments of Canada’s diverse regions, as well as provincial and territorial policies that are currently in place or have been recently announced. This report does not analyze whether specific policy options are feasible or practical in individual jurisdictions.
Electricity generation is a prime example of the important variation that can exist between Canada’s provinces and territories. While some provinces and territories have abundant sources of clean energy, like hydroelectricity, others will require significant capital and infrastructure investments to shift towards cleaner generation sources. This means that policies to reduce emissions in the electricity sector would have very different costs in some regions relative to others. Furthermore, policies that aim to reduce emissions through electrification (e.g., I2, T1, B6) will have limited impacts unless the electricity is primarily supplied by non-emitting sources.
Differences in industries and resources across provinces and territories would also affect many of the proposed policy options. For example, differences in forest characteristics and farming conditions and activities across Canada make it difficult to define ‘one size fits all’ approaches for the forestry and agricultural sectors, although flexible policies can be designed around broad common objectives. Policy options targeting large industrial emitters could have widely variable costs and impacts across jurisdictions, depending on factors such as the type of industrial activity, available infrastructure, and policies already in place.
Different provinces and territories have various mixes of transportation systems. Some modes of transport are more concentrated in certain regions, such as domestic marine transportation, freight rail, and passenger rail. Policies targeting these modes of transportation would thus affect some provinces and territories more than others (T5).
The importance and design of policies for the built environment also varies widely by region. Building codes and retrofit programs (B1, B2, B3, B4) need to be adapted to local climates and construction industries. Differences in fuel availability and fuel cost also affect these programs. Urban planning policies must also reflect regional differences in population density and the needs of rural versus urban populations.

Working Group on Specific Mitigation Opportunities Final Report
32
In general, these differences mean that more detailed analysis and tailored design will be important in implementing the majority of options included in this report.
Finally, responsibility for environmental policy is shared between provinces and territories and the federal government. Municipalities also have an important role in many areas related to climate policy, like urban planning and transportation. Provinces and territories have significant authority over environmental policies in their jurisdiction, leading to a variety of different types of policy regimes in place across Canada. While there are many advantages to this diversity, challenges related to regulatory duplication or overlap and competitiveness must also be managed.
3.10 Indigenous Perspectives and Opportunities for Leadership and Partnership
Both domestically and internationally, Canada has made significant commitments to work in collaboration with Indigenous peoples on climate action. More specifically, the Paris Agreement commits to, “strengthen knowledge, technologies, practices and efforts of local communities and indigenous peoples related to addressing and responding to climate change,” and the Vancouver Declaration agrees to strengthen collaboration with Indigenous peoples “based on recognition of rights, respect, cooperation and partnership.” Additional commitments to collaboration with Indigenous and local communities and leaders were included in the Leader’s Statement on a North American Climate, Clean Energy, and Environment Partnership issued in June 2016, including to “respectfully include traditional knowledge in decision making, including in natural resource management, where appropriate” and to “promote universal energy access and integration in the Americas, and to mobilize finance for the development of sustainable energy projects with a particular focus on indigenous communities, marginalized groups, and more vulnerable regions.” In May 2016, the Government of Canada officially announced its full support, without qualification, of the United Nations Declaration on Rights of Indigenous Peoples, which describes both individual and collective rights of Indigenous peoples around the world. It offers guidance on cooperative relationships with Indigenous peoples to states, the United Nations, and other international organizations based on the principles of equality, partnership, good faith and mutual respect. It addresses the rights of Indigenous peoples on issues such as governance, culture, environment, and health.
There are a number of factors that contribute to the particular vulnerability of Indigenous peoples to climate change; however, Indigenous peoples are also uniquely positioned to be leaders and agents of climate change action.
Many Indigenous communities are in northern or remote geographic locations; rely heavily on the natural environment for livelihoods; and face social and economic disadvantages, including a legacy of colonialism, sub-standard infrastructure and limited access to services, and lower quality of overall well-being (e.g., income, education) compared to the Canadian national average.
These conditions contribute to the exposure of Indigenous peoples to the negative impacts of climate change. For instance, sub-standard infrastructure increases the risks to Indigenous communities from extreme weather events, and exposure to vector-borne diseases (e.g., due to lack of access to clean water). The shortened winter road season is preventing critical shipments of necessary infrastructure, medical supplies, equipment, and fuel. A decline in access to traditional food, medicine, and other materials has economic and health impacts on Indigenous communities. The impacts of climate change may also damage social and cultural well-being and diversity, including diminished ability to pass on Traditional Knowledge and other knowledge to youth.

Working Group on Specific Mitigation Opportunities Final Report
32Working Group on Specific Mitigation Opportunities Final Report
33
In the face of these challenges, Indigenous peoples are taking adaptive measures both formally and informally, to respond to the impacts of a changing climate and taking tangible steps to become active drivers of change. Indigenous peoples have been strong advocates for ambitious climate change action and have an important stewardship role over lands and resources. In addition, Traditional Knowledge can support managing complex ecosystems and addressing climate challenges.
However, adequate support will be required to enable the full and meaningful involvement of Indigenous peoples on climate action. Current economic realities in many Indigenous communities include inadequate access to capital, low rates of investment in Indigenous communities, and low employment rates. All of these factors impede the ability of Indigenous communities to diversify economies or invest in new infrastructure, which makes it harder for Indigenous peoples to address the increased resource needs associated with mitigating the impacts of climate change. Some potential solutions to overcome some of these barriers and challenges could include improving access to capital for Indigenous communities, designing resource sharing and co-management agreements to help Indigenous peoples be agents and drivers of change, and partnership with all levels of government and other institutions in order to strengthen Indigenous voices in climate change decision making. While further consultation with Indigenous peoples will be required to develop specific policy solutions, a number of options in this report point to areas where targeted programs or policies could respond to priorities identified by Indigenous peoples and enable opportunities for Indigenous leadership (e.g., B1, B2, B3, B6, B8, E3, E4, E5, E6, F3, F4, W4).
3.11 Northern and Remote Communities
Northern and remote communities account for a small portion of Canada’s total emissions, and each of these communities faces specific challenges that affect the feasibility and cost of mitigation initiatives, and their capacity to implement and sustain these initiatives. Each community’s circumstances vary by its climate, size, distance from other communities, access to transportation networks, access to energy and electricity, local industries and economic activity, the availability of skilled labour, and a variety of other factors. Climate solutions that benefit urban centers may not be equally relevant to Northern and remote communities. Regionally-appropriate policies are needed to respond to the needs and priorities of these jurisdictions.
One important area for further action is to reduce the reliance of off-grid communities on the use of diesel to generate heat and power. An estimated 200,000 Canadians live in remote communities that continue to rely primarily on diesel. In addition to its association with significant environmental and health risks, diesel fuel is expensive, vulnerable to risks associated with winter road delivery, and generates black carbon emissions. Limits to energy supply can also impede economic growth and have important social consequences.
Connecting to the electric grid or transitioning to natural gas may be a viable option for some Northern and remote communities. For others, scaling up use of on-site low-carbon energy generation from sources such as wind, solar, biomass, or hydroelectric development may be preferable. High upfront capital costs are a central challenge associated with deploying renewable energy technologies, developing or expanding hydro capacity, and grid extension projects. While savings from reduced diesel use could help to recover costs over time, near-term support would be required. Trained personnel would also be needed to install and maintain more complex systems.
This report presents some preliminary analysis of options to reduce diesel use for energy generation in off-grid communities (E5, E6). Biomass or combined heat and power may be an alternative option to diesel or heating oil in homes, buildings, and some industrial operations in Northern and remote communities. Since remote communities often have higher electricity prices and many of their grids are already at maximum load, this may be an alternative to some of the options for electrification presented in this report.

Working Group on Specific Mitigation Opportunities Final Report
34
The governments of Manitoba, Quebec, Newfoundland and Labrador, the Northwest Territories, Yukon, British Columbia, and Ontario recently established a Pan-Canadian Task Force to reduce the use of diesel fuel to generate electricity in remote communities, which will develop and publish a report by the spring of 2017. In Budget 2016, the Federal Government also committed funds to implement renewable energy projects in off-grid Indigenous and northern communities that rely on diesel and other fossil fuels to generate heat and power.
Technological mitigation solutions must be appropriate to the weather, climate, and infrastructure of Northern and remote communities. Harsh northern climates can affect durability and reliability of some greenhouse gas mitigation technologies, rendering them inoperable or ineffective. For example, electric heat pumps experience reduced efficiency in cold temperatures. Some Northern and remote communities may not have ready access to the materials or skills required for servicing some technologies, and geographic distance and limited transportation options may affect the feasibility and costs of maintenance and repair.
Energy efficiency standards (I3, B5) and building codes (B1,B3) will need to continue to take account of the unique energy challenges of the North. Options to improve energy efficiency or transition to lower carbon fuels for buildings and industry (e.g., I1, I5, I3, B2, B4, B6) may also require incremental incentives or other types of accommodation to make them economically feasible in Northern and remote communities. Some options to reduce emissions from the transportation sector, such as electrification of passenger vehicles or increasing use of public transit, are less applicable to Northern and remote communities. Northern and remote communities rely on air and marine transportation and winter roads due to the great distances that must be traversed. Long-distance medical travel is also necessary for residents living in small, remote communities with limited health care services, as well as for hospital patients requiring medical procedures that are not available locally. Measures to limit aviation emissions (e.g.,T5, T10 ) could have a notable impact, particularly on smaller operators servicing the North and remote communities. While emissions from marine shipping are relatively low, they are predicted to grow as the open water season extends due to climate change, which could increase the importance of implementing measures to limit GHG and black carbon emissions from shipping (T10,T5).
In addition, options to reduce shipping costs could be explored. For instance, as suggested in option W4, a case could be made for processing paper along with organic waste locally (e.g. via composting), which would reduce the need to ship these waste products out of communities.
The Northern economy is less diversified than Canada’s national economy and the industries that are prevalent are fuel-intensive. For example, mining, quarrying and oil and gas extraction, along with public administration, accounted for over 40 per cent of the North’s GDP in 2011. Oil and gas reserves, as well as mining and forestry operations, represent potential sources of future emissions growth in some Northern and remote communities. It will be important to continue to develop these resources responsibly, for instance by limiting venting, flaring, and fugitive emissions from oil and gas operations (I4, 16), addressing emissions from off-road vehicles (T5), and improving industrial efficiency (I3), while balancing impacts on operating costs for these industries. In forest-based remote communities, options that increase the use of biomass and/or wood production (e.g. F1, E1, E2, B6), or contribute to afforestation or forest rehabilitation (F2, F3, F4) could potentially contribute to economic development.
Islands and island communities, which are not necessarily considered to be northern or remote, may face similar challenges depending on their isolation relative to the mainland. For example, there may be limited access to alternative fuels or other electrical grids. These communities may face higher transportation costs, which could have an impact on the cost of all goods and services in those communities.

Working Group on Specific Mitigation Opportunities Final Report
34Working Group on Specific Mitigation Opportunities Final Report
35
3.12 Accelerating Technological Development
Developing, optimizing and deploying new technologies will be crucial to help reduce emissions across most sectors. In some sectors, such as buildings and electricity generation, low-carbon technologies are already quite mature, and research, development and demonstration (RD&D) requirements focus on optimizing existing technologies or filling key gaps. In other sectors such as large industry, more significant technological advances are required and so the need for R&D is greater. In some cases these technologies have reached the pilot deployment stage but considerable work remains to prove them at scale before they can be rolled out in commercial applications.
RD&D-focused policies were assessed by the Working Group on Clean Technology, Innovation and Jobs, and are beyond the scope of this report. However, many of the policies identified here will create a strong market ‘pull’ for RD&D efforts, either through direct financial incentives that scale up technologies or indirectly through regulations that set ambitious performance targets that require technological advances to achieve (e.g., I8). Governments can also play a direct role through procurement and showcasing new technologies in their own operations.
Specific enabling technology requirements in the industrial sector include R&D to support codes, standards and guidelines for biomass used in cogeneration cogeneration (the combined production of heat and power) (I1); process optimization for industrial energy efficiency (I3); and research on improving the efficiency and lowering the cost of carbon capture and storage technology (I7). As mentioned above, industry also needs substantial RD&D to accelerate the development and adoption of next-generation technologies and to bring down costs. Specific technologies and research needs vary by sub-sector and technical challenge.
In the transportation sector, technological requirements include R&D to reduce production costs and facilitate expanded supply for low-carbon fuels, as well as to support codes and standards and improve process reliability (T2); deployment of pilot intelligent transportation systems (T6); R&D on converting marine vessels and locomotives to accept low-carbon fuels (T10); and demonstrations of novel charging technologies and hydrogen fuel cell vehicle applications as well as R&D on specific components (T1).
In the buildings sector, key technology needs include demonstrations of net-zero ready energy communities (B1) and targeted RD&D for specific equipment such as heat pumps for cold climates (B5). In the electricity sector, RD&D of grid integration technologies such as energy storage could help lower the cost of integrating renewable energy (E3, E6). In agriculture, research on optimizing planting, fertilizer placement and harvesting could help increase the potential from nitrogen fixation (A3) and carbon sequestration (by increasing levels of soil organic carbon), and research to optimize catalytic oxidation could help reduce methane emissions from manure (A6). In forestry, research to improve forest monitoring and reporting could help better track the effects of mitigation actions (F4).
3.13 Infrastructure Investments
Many policies rely on access to various types of infrastructure. Some key areas in which infrastructure investments may be needed include improvements to the electricity grid; transmission capacity (e.g., pipelines) for natural gas, renewable natural gas, and carbon capture and geological storage; and transportation infrastructure, including public transit and active transportation, infrastructure to support intermodal transfers, and zero emissions vehicle charging infrastructure. It should be noted that the costs associated with building new infrastructure are not included in the cost-per-tonne estimates in this report.
Careful planning and significant investment will be required in order to ensure that Canada’s electricity grid can incorporate additional clean energy capacity to displace fossil fuel generation (e.g., E1, E2, E3), and respond to potential growth in demand from increased electrification in transportation, industry, and

Working Group on Specific Mitigation Opportunities Final Report
36
buildings (e.g., T1, I2, B6). As outlined in option E6, investments to increase cross-border trade in non-emitting electricity could help reduce emissions, while also supporting intermittent renewable power (e.g., wind and solar) and improving reliability and flexibility. Advance planning will be important, as new electricity projects and transmission lines often take a long time to build and are costly. To support electrification policies, some industrial facilities may require additional infrastructure (capital investment) to support new electrical equipment (I2). Scaling up use of zero-emissions vehicles would require policies such as incentives, building codes and standards, and government investments for charging and fueling infrastructure (T1, T2). Some provinces are already heavily investing in public fast-charging infrastructure and offering incentives for home and work charging infrastructure.
Infrastructure to support a transition to lower-carbon fuels may also require significant investment. For example, reduced flaring from oil and gas facilities, petroleum refineries, and chemical plants (I4) may require new gas-gathering infrastructure (e.g., pipelines). The availability of lower carbon fuels is critical to options for industrial fuel switching (I5). Infrastructure investments for natural gas distribution, electric grid expansion, or renewable energy production may be necessary in some regions that currently lack access to alternatives to carbon-intensive fuels. Similarly, options to convert waste to power (e.g., W1, W3) or enhance industrial cogeneration (I1) would require access to the electricity grid and/or natural gas distribution pipelines. More generally, additional infrastructure may be required to scale up capacity for processing and producing renewable fuels. Limiting carbon emissions through abatement and sequestration (CCS and other) technology (I7) would require pipeline infrastructure to transport captured carbon dioxide to underground storage sites for facilities in locations without local storage opportunities.
Investments in active transportation networks (e.g. cycling and walking paths) and public transportation, and investments in inter-city rail can help to encourage people to shift away from emissions-intensive transportation modes such as personal vehicles (T8, B8). Urban planning policies that support higher-density communities can also significantly reduce the life-cycle costs of hard infrastructure. Strategic investments could also be made to encourage modal shifts for freight transportation (T7), including infrastructure improvements for rail terminals and ports. Over the longer term, infrastructure investments in electrified truck highways or other alternative transportation fuelling infrastructure could also help to reduce emissions from freight transportation (T4, T2). In the North, investment in basic infrastructure is needed before investment in such things as electric vehicle charging stations and large-scale active transportation networks. For example, highways are needed to replace winter roads and bridges to replace ferries.
Indigenous communities have a variety of infrastructure needs, from renewable energy and transmission infrastructure to help reduce reliance on diesel to improvements to housing. In order to improve the ability of First Nations to invest in needed infrastructure, the AFN has proposed improving access to capital and other financing mechanisms, mentorship, partnership and skills training, as well as ensuring these tools are designed to accommodate the fiscal realities of remote communities.
3.14 Access and Supply of Clean, Renewable Energy
Ensuring an adequate supply of clean electricity and other low-carbon and renewable fuels will be essential to powering a low-carbon economy. Renewable energy sources such as geothermal, wind and solar have an opportunity to replace a significant portion of emitting generation including coal and natural gas, and to meet additional demand of a low-carbon economy. Measures to improve energy efficiency (e.g., I3, T6, T3, T4, T5, B1, B2, B3, B4, B8) play a crucial role in lowering demand for electricity and other fuels. Maximizing efficiency and reducing demand will be an important first step towards an economy run by renewable and alternative fuels, and can help to counterbalance potentially significant increased demand

Working Group on Specific Mitigation Opportunities Final Report
36Working Group on Specific Mitigation Opportunities Final Report
37
from measures to promote electrification and fuel switching (e.g., I1,I2, I5, T2, T10, T1, B6). In some cases, however, efficiency measures could result in lower than expected fuel savings, to the extent decreased fuel costs contribute to increased use (i.e., the ‘rebound effect’).
Although electrification is a central element of a low-carbon economy, shifting to electricity is not always the most practical or cost-effective choice. Low-carbon and renewable fuels, in particular those produced from wastes, including ethanol, biodiesel, biomass, and renewable natural gas, as well as transition fuels such as natural gas will also be important sources of energy.
For example, industrial co-generation of heat and power (I1) could be fueled by waste wood biomass, renewable natural gas, or biogas. In the electricity sector, biomass could be co-fired with or replace coal (E1, E2). Biomass fuel sources, such as wood pellets, may also help move Northern and remote communities off heating oil (B6). Alternative fuels for various industrial operations (I5) could include renewable natural gas, biogas, biomass, pyrolysis oil, biodiesel, or renewable diesel. In the transportation sector, a low-carbon fuel standard could help increase the use of a range of low-carbon and renewable fuels across all modes of transportation, including on-road light and heavy-duty vehicles (T2) and marine, aviation, and rail transportation (T10).
However, there could be significant barriers to scaling up renewable fuels that would require policy support to overcome. Feedstock supply could present a major challenge. Supporting domestic production and distribution of low carbon fuels may be done through financial incentives (e.g., grants, tax preferences, low interest loans) as well as continued support for research, development and demonstrations (e.g. RD&D to support codes and standards, optimization of production pathways and to bring down costs). Otherwise there is a risk that requirements to use low-carbon fuels could result in significant and potentially costly imports. It will also be important to demonstrate that renewable fuels achieve lifecycle emissions reductions. Further research and development may be required to reduce the price premium of renewable fuels relative to fossil fuels, in particular if a strong carbon pricing regime is not in place. Finally, compatibility with engines and equipment may also be a consideration when blending higher levels of some renewable fuels with fossil fuel.
Canada has existing sources of feedstock (e.g. forest and agricultural residues, canola and other crops) but supply chains need further development and the supply of these crops would have to be significantly increased. Recycled oils and animal fats could be another source of feedstock if quality specifications could be met. Captured methane emissions from the agricultural sector (A6) and landfill gas (W1, W3) could provide some supply of renewable natural gas. In the forestry sector, forest management and rehabilitation policies (F3. F4) could support increased extraction of harvest residues for bioenergy.
Additional study of requisite infrastructure associated with other low-carbon or renewable fuels will be an essential part of implementing ambitious policies. Utilities and electric systems operators will also need to take into account new electrification policies when designing their systems.
Indigenous groups and some stakeholders have raised the concept of energy equity as foundational in order to ensure a just transition to a low carbon economy. Energy equity means that all Canadians should have access to modern energy services delivered safely and from clean sources. In particular, vulnerable populations or those who currently have poor energy access could be prioritized, including Indigenous peoples, people living in Northern and remote communities, and low-income Canadians. Input from the AFN has highlighted the importance of allowing for decentralized and distributed community-owned energy generation as a way of improving equity and access to clean energy for First Nations.
Renewable energy can play a role in helping Indigenous communities reduce reliance on diesel for heating and electricity (E5). The AFN proposes a number of measures to support deployment of renewable energy technologies in Indigenous communities, such as creating a central institution to streamline processes, introducing incentives for small-scale renewable energy and strengthening the grid to absorb more renewable generation.

Working Group on Specific Mitigation Opportunities Final Report
38
3.15 Links to Adaptation
Many mitigation and adaptation policies can be designed to be complementary. For example, adaptation-focused ecosystem management and land-use-based activities used to manage climate risks associated with extreme weather, such as natural and wetlands conservation to reduce flood risks and protect biodiversity, can also reduce GHG through carbon sequestration and storage. Similarly, the use of urban canopies and other measures (e.g., green roofs, lighter pavement, reflective surfaces, etc.) to reduce the urban heat island effect can also lead to reductions in energy demands for cooling (B8).
In the same vein, mitigation policies in this report should be implemented with adaptation goals in mind wherever relevant. In some cases, policies can be designed to have adaptation benefits. For example, forestry policies aimed at rehabilitating crown land or increased afforestation (F2, F3) could be designed to protect biodiversity or reduce flood risks. Agriculture policies can also be designed to enhance food security.
Best practices from adaptation policies can help to inform the design of mitigation policies. For example, many of the policy options within this report require infrastructure investments, such as in public transit (T8) or electricity transmission (E6). These investments would need to incorporate adaptation considerations – e.g., be built to reflect changing weather patterns and flood risks. Similarly, mitigation policies should consider current and predicted climate impacts in their design and implementation, so as not to lead to maladaptation, jeopardize the permanence of emission reductions, or miss potential opportunities (e.g., increased potential for hydro power as a result of increase precipitation in some areas).
Lastly, some mitigation and adaptation policies could be implemented together. For example, efforts to accelerate building code improvements (B1, B3) and to support tree plantings, green roofs and permeable surfaces (B8) for mitigation could be implemented at the same time as improvements focused on adaptation.
3.16 Linkages with the Canadian Energy Strategy
In summer 2015, Provincial and Territorial Premiers finalized the Canadian Energy Strategy (CES), a demonstration of their commitment to strengthening the economy, creating jobs, ensuring a secure supply of energy for all Canadians, supporting energy innovation and addressing climate change. In conjunction with provincial and territorial Energy Ministers, Premiers identified three themes to inform the future of energy in Canada: sustainability and conservation, technology and innovation, and delivering energy to people. The CES outlines ten main goals related to these themes.
Under the CES, Premiers agreed to form committees focused on energy efficiency, delivering energy to people; the transition to a lower carbon economy; and technology and innovation. At their summer 2016 meeting in Whitehorse, Premiers reaffirmed their commitment to the CES and welcomed the participation of the federal government in certain areas, including reducing diesel use in remote communities, supporting clean energy technology and innovation, and enhancing energy efficiency policies and mechanisms.
Table 2 below provides some examples of linkages between goals articulated by the CES and options presented in the Mitigation Working Group report.

Working Group on Specific Mitigation Opportunities Final Report
38Working Group on Specific Mitigation Opportunities Final Report
39
Table 2: Linkages between the Canadian Energy Strategy and Mitigation Working Group Options
Canadian Energy Strategy Goal Examples of Linkages with Mitigation Working Group Policy Options
1.2 Maximize access to energy savings by all energy consumers.
• B2. Existing Housing
• B4. Existing Commercial-Institutional Buildings
• B5. Equipment Efficiency
1.3 Encourage market transformation through targeted energy efficiency and conservation policies, including regulations and building retrofit codes
• B1: Net-Zero Ready Codes for New Housing
• B3. Net-Zero Ready Codes For New Commercial-Institutional Buildings
• B4. Existing Commercial-Institutional Buildings
• B5. Equipment Efficiency
• I3. Improve Energy Efficiency of Industrial Facilities
2.2 Foster an understanding by governments on the use of market-oriented policies to reduce greenhousegas emissions across Canada
• E1. Emissions Intensity Performance Standard for Fossil Fuel-fired Electricity Generation
• E3. Non-Emitting Portfolio Standard for Electricity Generation
2.3 Actively pursue greenhouse gas emissions reductions with targets based on sound science.
• E1. Emissions Intensity Performance Standard for Fossil Fuel-fired Electricity Generation
• E3. Non-Emitting Portfolio Standard for Electricity Generation
3.2 Increase awareness and understanding of energy in Canada.
• B7. Demand Response Opportunities and Behaviour Change
6.1 Support the efficient deployment of clean and renewable energy sources across Canada.
• B6. Renewable Power And Fuel Switching
• E4. Financial Support for New Non-Emitting Electricity Generating Facilities
6.2 Support greater access to affordable, clean, and reliable supplies of energy for all Canadians.
• E5. Targeted Financial Incentives for Non-Emitting Generation in Northern and Remote Communities
• E6. Increase Interjurisdictional Transfers of Non-Emitting Electricity
7.3 Facilitate greater exchanges and transfers of energy between or across the provinces and territories
• E6. Increase Interjurisdictional Transfers of Non-Emitting Electricity

Working Group on Specific Mitigation Opportunities Final Report
40
4 INPUT FROM NATIONAL INDIGENOUS ORGANIZATIONS The section below highlights key messages from the submissions that the Mitigation Working Group received from the Assembly of First Nations (AFN) and the Métis National Council (MNC), and discusses how this input was incorporated into the report. As noted above, the Inuit Tapiriit Kanatami (ITK) intends to provide input directly to Ministers.
4.1 Assembly of First Nations
The Assembly of First Nations (AFN) is a national advocacy organization representing First Nation citizens in Canada, which includes more than 900,000 people living in 634 First Nation communities and in cities and towns across the country. Every Chief in Canada is entitled to be a member of the Assembly, and the National Chief is elected by the Chiefs in Canada, who in turn are elected by their citizens. The AFN National Executive is made up of the National Chief, 10 Regional Chiefs and the chairs of the Elders, Women’s and Youth councils.
The AFN’s submission to the Mitigation Working Group emphasizes that any discussion pertaining to climate change needs to be based on full respect for the constitutional, treaty and internationally recognized rights of Indigenous peoples, and advocates for energy democracy and security, food sovereignty and water purity for Indigenous peoples as key outcomes for Canada’s climate action. Indigenous or Traditional Knowledge has a critical role in managing and addressing climate-related challenges, but also in developing climate policies and related programs.
“When we talk about climate change we need to keep our language very real. When we say climate change, people tend to gloss over, even though we are in a crisis – it’s just a word now. For me, climate change is going to change my way of life, it is changing my way of life, it has changed my way of life and it is very real today.”
Lorraine Netro, AFN Women’s Council Representative (2016)
The AFN advises that Indigenous communities must be directly involved in policy development, decision-making, and implementation going forward , and recommends that this engagement be delivered primarily by First Nations communities, tribal councils and organizations to ensure the widest possible support and maximum absorption of information and decision making. The model of shared decision making recommended by the AFN would require a more inclusive process for more meaningful engagement on climate action, supported by adequate resources.
The AFN’s submission proposes three funds to reduce emissions, build capacity, and contribute to sustainable economic development in First Nations communities:
Fund A: Reducing Diesel in Northern & Remote Off-Grid Communities Fund: 50% reduction of diesel used for heating and electricity in Canada’s ~140 remote and northern First Nations and other Indigenous communities by 2022 through energy efficiency/conservation, renewable energy, local smart grids, transport electrification, transmission connection, housing/facility design, and community energy planning. Funding: $900 million - $1.7 billion over 10 years
Fund B: Indigenous Clean Energy Technologies & Infrastructure Fund: 2,500 MW in renewable energy generating electricity technologies and large-scale infrastructure projects replacing existing coal and natural gas generation, or offsetting fossil fuel reliant electricity growth by 2024. Funding: $400-500 million over 10 years

Working Group on Specific Mitigation Opportunities Final Report
40Working Group on Specific Mitigation Opportunities Final Report
41
Fund C: First Nations Clean Energy Community Capacity & Entrepreneurs Fund: Building community clean energy capacity through a national-wide cadre of First Nations clean energy entrepreneurs, through initiatives which build clean energy capacity and networks, in communities and through partnerships with clean energy and Cleantech companies and electric utilities. Funding: $50 million over 10 years
In addition to the proposed funds above, input from the AFN presents a range of general principles and specific recommendations across various economic sectors. For the large industrial emitters sector, including oil and gas, the AFN points to the need to work together on a process to address specific issues around engaging and partnering with First Nations in energy and extractive industries. Fundamental principles for this interaction outlined by the AFN include acknowledgement of ownership over traditional territories and associated rights; Supreme Court of Canada’s Decisions on the Duty to Consult; and the importance of Free Prior and Informed Consent. The AFN also proposes some possible uses of carbon pricing revenue, including reinvestment in clean technology and reinvestment in the agricultural sector to ensure food security for low-income Canadians and those at risk of food insecurity.
Key themes from the AFN’s submission have been incorporated in the policy options throughout this report, notably in the built environment, electricity and forestry sectors. The section below outlines some of the key ideas included in the AFN’s submission, and suggests ways in which they could be addressed by the policy options in this report.
• Support for culturally sensitive and energy efficient housing, including net-zero housing and communities » Could be enabled: by net zero ready building codes that are sufficiently flexible to reflect Indigenous
culture in building design (B1, B3); programs or incentives targeted to Indigenous communities for energy efficiency retrofits (B2), switching to less carbon-intensive energy systems and solar solutions (B6)
• Stable and transparent clean energy policies that support renewable energy, including First Nations home-based or community owned and operated systems. The AFN notes that scaled up deployment of renewable and distributed energy technologies will require action to address grid integration risks, favourable pricing policies, and incentives such as feed in tariffs and stable net metering that are accessible to First Nations Communities. » Could be enabled by: set-asides for renewable energy generation by Indigenous communities as part
of broader strategies to scale up the use of renewable energy technologies (E3, E4), investments in electricity grid infrastructure (E6)
• Incorporation of Indigenous knowledge and stewardship practices in the forestry sector » Could be incorporated into forest rehabilitation policies (F3) and changes in forestry
management practices (F4).
4.2 Métis National Council
The Métis National Council (MNC) is the Métis-specific national representative body, which receives its mandate and direction from the democratically elected leadership of the Métis Nation’s governments from Ontario westward. The Métis National Council is represented by the Governing Members, namely the Métis Nation – British Columbia, Métis Nation of Alberta, Métis Nation – Saskatchewan, Manitoba Métis Federation, and the Métis Nation of Ontario through representative democratic governments.
Based on the national definition of Métis for citizenship within the Métis Nation adopted in September 2002, it is estimated that there are 350,000 to 400,000 Métis Nation citizens in Canada.
The MNC’s submission emphasizes that climate change actions must be based on full respect for human rights and the rights of Indigenous peoples. Their support for effective action on climate change is contingent on permanent engagement with Métis during implementation, efforts to counter disproportionate impacts

Working Group on Specific Mitigation Opportunities Final Report
42
of policies on lower income households and remote communities, and assistance to strengthen Métis capacity for mitigation and adaptation. The MNC advises that efforts to address climate change must not be overshadowed or displaced by economy specific discussions, and seeks the implementation of the United Nations Declaration on the Rights of Indigenous Peoples within this and every process in relation to climate change.
The MNC suggests that the Low-Carbon Economy Fund, a $2 billion fund to support emissions reductions that the federal government announced in Budget 2016, could include set-asides for the Métis Nation. They also recommend establishing a fund for Métis communities to complete climate risk assessments and planning (similar to funding available to the Federation of Canadian Municipalities) and a new engagement process with the Métis Nation on an incentive and support program specifically targeting initiatives in Métis communities, such as the greening of Métis governance and institutional operations and retrofitting buildings, identifying opportunities for more local food, water, and energy conservation. The MNC also recommends creating Métis specific contract capacity set asides for Métis businesses in government procurement strategies, including those businesses that have a clean technology focus.
The MNC provided a submission to all four working groups, which noted that providing input to the Mitigation Working Group was particularly challenging given the broad scope and complexity of its mandate. The MNC notes that greater sector-specific engagement will be needed moving forward, including Métis specific dialogue at the regional and national levels as mitigation policies are developed and implemented. The MNC’s submission points to some potential measures for further development, specifically related to the built environment, electricity, forestry, and government operations sectors. The section below provides a brief overview of how these areas could be addressed under options included in this report.
• Support for energy efficient houses, businesses, and government buildings. The MNC notes that Governing Members have housing authorities, some of which are significant property owners and managers. Energy efficiency initiatives could help to lower emissions and energy costs for Métis homes and businesses
» Could be enabled by programs or incentives targeted to Indigenous communities for energy efficiency retrofits (B2), switching to less carbon-intensive energy systems and solar solutions (B6), and policies to support efficient government operations (G1)
• Clean energy generation initiatives, including Métis delivery of new energy options (e.g., biomass, solar, geothermal) and identification of pilot projects to move communities away from diesel and towards alternative means of electricity and heat generation, identified in cooperation with Governing Members. The MNC’S submission notes that some Governing Members are engaged with the management of Métis consumers within their areas and coordinate spending as part of an incentive and support program
» Could be enabled by set-asides for renewable energy generation by Indigenous communities as part of broader strategies to scale up the use of renewable energy technologies (E3, E4), targeted support to reduce reliance on diesel energy in Northern and remote communities (E5)
• Métis-driven carbon offset programs, which could, for instance, support northern communities that rely on existing old growth forests for maintenance of traditional livelihoods, manage forest fires on a regular basis, and have a direct interest in forest land management, in some cases through land use agreements or licenses
» Could be enabled by measures to expand new forest areas (F2), forest rehabilitation policies (F3), and changes in forestry management practices (F4).

Working Group on Specific Mitigation Opportunities Final Report
42Working Group on Specific Mitigation Opportunities Final Report
43
5 PUBLIC AND STAKEHOLDER INPUTThe Mitigation Working Group received significant and substantive input from the general public and stakeholder groups, such as non-profit organizations, think tanks, and industry associations, which has been carefully considered and integrated to the greatest extent possible throughout this report. Some ideas that were ultimately outside the scope of this analysis or could not be fully explored in the options presented due to time constraints are flagged in the areas for further consideration in the sector profiles found in Chapter 6.
Public Engagement: Interactive Website and Town HallsIn April, an interactive website was launched to seek input from Canadians on how to address climate change and promote clean growth. This engagement tool allowed Canadians to share their ideas, comment on others, and be part of a national conversation on climate change. The website also gave Canadians the tools to hold town halls and discuss these issues within their communities, and many such groups submitted the results of their town halls to the interactive website. The public was also encouraged to submit comments by email and mailed correspondence.
Inclusion of submissions in working group reportsAll four working groups have incorporated public input received through the interactive website and by email into their work. Weekly summaries of public input were circulated to representatives from the Mitigation Working Group, including subgroup co-chairs, and sub-groups systematically reviewed all submissions related to their respective sectors. The suggestions, views, and constructive comments in the submissions received have been included through this report.
5.1 Submissions Received
As of late August, 2016, almost 5000 submissions, of which about 3300 are related to mitigation, have been received by mail, email and through Canada’s interactive website, letstalkclimateaction.ca/. Based on an analysis of the ideas in each submission related to mitigation, almost 5000 unique ideas were identified.
Submissions were received from Canadians and organizations across all provinces and territories, with 88% coming from individuals, while organizations account for 12% of submissions. The outcomes of over 50 town hall events, which took place in communities across Canada, have been submitted to the interactive website or by email.
The majority of comments submitted by Canadians were supportive of the Pan Canadian Framework process and provided constructive input that was helpful for assessing options in this report. Some views submitted by Canadians were more broadly critical of the pan-Canadian Framework process and/or the consultation process. These comments have been useful feedback on the development and implementation of the process. A small minority of comments were skeptical of climate change science, and of the need to mitigate climate change.
A significant number of submissions expressed general support for ambitious climate action by individuals, businesses, and governments, or provided general policy ideas such as setting new greenhouse gas reduction targets. Other submissions focused on a number of key themes; these themes are summarized below, along with a brief discussion of how this input was incorporated into the policy options included in this report.

Working Group on Specific Mitigation Opportunities Final Report
44
5.2 Key Themes from Submissions
• Clean energy investment and incentives » Number of submissions: 1131 » Reflected in various options in the electricity, large industrial emissions, and built environment
sectors. Examples include: financial support for new non-emitting electricity generating facilities (E4); transitioning to electrification (I2); renewable power and fuel switching (B6)
• Reducing dependence on fossil fuels and promoting the transition to a low carbon economy (e.g., phasing out fossil fuel subsidies, and support to train workers in clean energy industries); » Number of submissions: 1136 » Options across multiple sectors (e.g., large industrial emitters, built environment, transportation,
electricity, etc.) include measures that would reduce reliance on fossil fuels and promote the transition to a low-carbon economy
• Promoting and improving public transportation » Number of submissions: 315 » Public transportation investments are included in option T8, changing transportation usage patterns » Option B8, urban form and spatial planning, also includes a discussion of measures to promote public
transportation
• Incentivizing energy efficient improvements in homes and commercial buildings; » Number of submissions: 287 » Options in the built environment sector that would improve the efficiency of new and existing residential
and commercial buildings include net-zero ready building codes (B1, B3); retrofit policies (B2, B4); and policies to improve the efficiency of equipment and appliances (B5)
• Supporting the transition towards electric cars, and building electric vehicle infrastructure; » Number of submissions: 279 » Policies to promote electric vehicles are addressed in option T1, passenger vehicle emission regulation
and incentives, which discusses consumer incentives, education initiatives, and mandates or standards (voluntary or regulatory) to promote zero emissions vehicles.
» Option T9, reducing congestion and vehicle-kilometers travelled, also includes measures that would help to promote zero-emissions vehicles, such as registration and excise taxes based on vehicle emissions ratings, and financial incentives
» Option B8, urban form and spatial planning, discusses support for electric vehicles including EV parking and charging equipment in new buildings
• Reducing emissions from electricity production; » Number of submissions: 272 » Could be addressed by various options included for the electricity sector, including emissions intensity
performance standards for fossil fuel-fired electricity generation (E1); an accelerated phase-out for coal-fired electricity (E2); a non-emitting portfolio standard (E3); financial support for non-emitting electricity generating facilities (E4), support to reduce reliance on diesel energy in Northern and remote communities; or increasing interjurisdictional transfers of non-emitting electricity (E6)
• Other means to reduce emissions from transportation (e.g. promoting changes in personal behaviour, incentivizing the development of cleaner means of transportation, reducing emissions from shipping, aviation, and commercial transportation) » Number of submissions: 268 » Various options in the transportation sector could help to facilitate access to low-carbon
transportation options

Working Group on Specific Mitigation Opportunities Final Report
44Working Group on Specific Mitigation Opportunities Final Report
45
» Various options in the transportation sector could help to promote shifts in personal transportation choices. For example, option T8 (changing transportation usage patterns) includes investments in public and active transportation as well as measures to promote car sharing, carpooling and ride sharing, while option T9 (reducing congestion and vehicle-kilometers travelled) proposes a range of economic instruments that would target shifts in driving behaviour
» Measures to improve energy efficiency and reduce the carbon intensity of fuels from shipping, aviation, and commercial transportation are included in options T3 (energy efficiency in the aviation, rail, marine and off-road industrial sectors, T4 (heavy duty vehicle and engine emissions regulations and incentives), T5 (vehicle and engine fuel efficiency in the aviation, marine, rail and off-road sectors), and T10 (increased availability and use of low-carbon fuels in the domestic marine, rail, and aviation sectors)
• Promoting and incentivizing cycling and walking, and building infrastructure to support active transportation; » Number of submissions: 239 » Infrastructure to promote active transportation is addressed in option T8, changing transportation
usage patterns » Option B8, urban form and spatial planning, also discusses measures to promote active transportation
• Develop and implementing building codes that promote the use of cleaner technologies and higher energy efficiency; » Number of submissions: 171 » Options for net zero-ready building codes for new residential and commercial buildings (B1, B3) are
included in the report, as are options that would include the development of retrofit codes and energy use disclosure standards for existing buildings (B2, B4)
• Reducing meat production and consumption; and » Number of submissions: 113 » This idea is discussed in the section on individual actions » Other key themes found in submissions that have been incorporated into policy options include:
• Providing education on climate change » Various options include an education and awareness component » For example, T1 (passenger vehicle regulations and incentives) includes an option on funding for
consumer awareness programs for zero emissions vehicles. T6 (fuel Efficiency of on-road vehicles) includes an option for outreach and education programs to improve the efficiency of driver behaviour. Options in the waste sector – such as a strategy to reduce avoidable food waste (W2) – include consumer education initiatives.
• Supporting local farms and food growing » This idea is discussed in the section on individual actions
• Creating clean energy infrastructure » Infrastructure needs, including for clean energy infrastructure, are noted in a number of options,
as discussed in greater detail in the section on infrastructure in Chapter 3 » Some examples of options related to clean energy infrastructure include electricity grid investments (E6)
and investments in charging and fueling infrastructure for low or zero emissions vehicles (T1, T2)
• Reducing waste and improving recycling » Options for the waste sector include increasing the diversion of organic materials and recyclables
from landfills (W3, W4), and reducing avoidable food waste (W2)
• Incentivizing the greening of cities and communities » Options B8 (urban form and spatial planning) and T9 (reducing congestion and vehicle-kilometers
travelled) include a variety of measures that are primarily targeted to reducing emissions in urban areas
Working Group on Specific Mitigation Opportunities Final Report
46
• Incentivizing and investing in technology and development of new and more sustainable practices in agriculture » Options in the agricultural sector include incentives to adopt practices and technologies to reduce
or capture methane emissions (A1, A4), use fertilizers more efficiently (A5), convert marginal land to permanent cover (A2), and increase acres of nitrogen-fixing crops (A3)
• Promoting afforestation, protection, and sustainable development of forests » The forestry sector includes options to substantially increase the area of newly forested land (F2),
increase forest rehabilitation (F3), and implement changes to forestry management practices (F4).
• Promoting the greening of federal buildings » Options to reduce emission from government buildings are discussed in the government operations sector
profile, and would also be covered by a carbon neutral government policy (G1)
5.3 Consultation with Key Experts and Stakeholders
Three roundtables were held with invited stakeholders and National Indigenous Organizations on June 7 (Montreal), June 8 (Ottawa) and June 21 (Vancouver), 2016. These sessions were jointly hosted by the Mitigation Working Group and the Working Group on Carbon Pricing Mechanisms. Participants at the roundtable sessions were highly engaged, and brought forward a wide variety of issues, considerations, and ideas. There was broad agreement on the need for ambitious climate change action, with a range of perspectives on priorities and next steps. Participants also generally agreed on the need for a carbon price high enough to change behavior without decreasing public support; the importance of price certainty for business; and the value of learning from international experiences with different carbon pricing approaches.
Some of the other key messages that emerged from these sessions are summarized below.
• Participants identified opportunities for emissions reductions across all sectors of the economy, and pointed to several cross-cutting enabling conditions – such as investment in clean electricity, inter-jurisdictional transmission grids and vehicle charging infrastructure to prepare for more electric vehicles, updated building codes and adequate access to capital to allow businesses to invest in new technologies.
• There are a number of emerging trends that could be accelerated to drive deeper emissions reductions. These include urban densification; social innovation and the sharing economy; consideration of financial liabilities and investment risks related to climate change; and changing business models, such as the move towards a circular economy.
• Individual Canadians can be agents of change. Public outreach and educations efforts are needed to make people aware of the impacts of their choices and to build broad support and understanding of the action being taken. Policies should avoid hidden costs in order to send clear signals to consumers; however, there is also a need to make low-carbon choices convenient and attractive. Governments have a responsibility to lead by example.
• Environmental, economic, and social criteria need to be balanced when evaluating policies. In addition to metrics such as total costs and emissions reductions (e.g., cost per tonne), other considerations include potential for transformative change, competitiveness impacts, potential for job creation and skills development, social acceptability, and impacts on vulnerable populations. High-quality data and consistent reporting on progress is needed to develop and evaluate policies effectively and to inform data-driven decisions.
• Some key areas of potential partnership with Indigenous people include enhancing carbon sinks, electricity and distributed energy production, particularly in Northern and remote communities.

Working Group on Specific Mitigation Opportunities Final Report
46Working Group on Specific Mitigation Opportunities Final Report
47
• Some participants suggested that Canada could consider purchasing ITMOs to help meets its climate change targets, provided that sufficient investments are also made in achieving domestic emissions reductions. Some participants suggested that there may also be potential for Canada to receive credit for exporting low-carbon technologies, products, or resources.
• Effective climate change policy requires a full suite of tools, including regulations, incentives, outreach and education, and investment in research and development. Carbon pricing is a key tool, but complementary measures are also needed to reach emissions that are not effectively addressed through pricing. Governments should focus on achieving emissions reduction outcomes rather than being prescriptive.
• When designing climate policies, governments can either choose to use carbon pricing as the main driver for GHG reduction (high carbon price, few complementary measures) or decide to rely on a wider array of measures (low carbon price, multiple complementary measures).
• Competitiveness needs to be carefully considered, both in terms of impacts of new costs on industry, as well as steps industry can take to enhance its competitiveness in a carbon-constrained world. Emissions-Intensive and Trade-Exposed (EITE) sectors should be clearly defined and regularly reviewed.
• There is a need for policy coherence, including between carbon pricing and other mitigation policies, and between policies developed by different orders of government (federal, provincial, territorial). A patchwork of systems across the country can be difficult for business. Identifying and addressing unintended barriers or areas of overlap between policies is a key challenge.
• A collection of approaches, including infrastructure spending, regulations, and carbon pricing are needed to achieve step changes, such as a transition to low-carbon fuels.
Beyond the engagement specifically led by the MWG, several provinces and territories have conducted significant climate action engagement exercises over the past several months to inform their respective climate change policy plans. The input gathered through those sessions has also been considered as the MWG prepares its report.

Working Group on Specific Mitigation Opportunities Final Report
48
6 SECTOR PROFILES
6.1 Introduction
This chapter of the report provides an overview of Canada’s major economic sectors and the policy options developed by technical sub-groups for each sector. The sectors profiled are: large industrial emitters, transportation, the built environment, electricity generation and transmission, agriculture, forestry, waste, and government operations and leadership. The chapter also includes sections on individual actions and Internationally Transferred Mitigation Outcomes.
6.2 Large Industrial Emitters
6.2.1 Sector Portrait
The large industrial emitters sector covers a range of industries that help drive the economy and create jobs, and generate a significant portion of Canada’s GHG emissions. Industries in this sector include oil and gas; mining; smelting and refining; pulp and paper; iron and steel; cement; lime and gypsum; chemicals and fertilizers; and light manufacturing. This sector includes facilities of varying sizes that perform a wide range of different activities.
Sector EmissionsIn 2013, this sector was responsible for approximately 271 Mt CO2e or 35% of Canada’s GHG emissions.
Figure 3: Emissions from Large Industrial Emitters from 2013 data in Mt CO2e
Emissions from this sector are projected to grow due to increased production across these industries as demand for Canadian-produced goods grows domestically and internationally.

Working Group on Specific Mitigation Opportunities Final Report
48Working Group on Specific Mitigation Opportunities Final Report
49
Figure 4: Emission Trends for Industrial Subsectors (Mt CO2e)12
While emissions across the industries in this sector are expected to increase, some will likely grow more than others. According to Environment and Climate Change Canada’s “business as usual” projections, oil and gas emissions are projected to increase about 35% by 2030, largely due to growth in oil sands production. Oil sands emissions are projected to grow 82% by 2030, in part due to the energy intensive nature of in-situ production.13
The light manufacturing industry — composed of non-emissions-intensive industrial production, such as the food and beverage industry — produced 6% of the sector’s emissions in 2013, but is projected to more than double by 2030. Other areas where significant emissions growth is anticipated by 2030 include chemicals and fertilizers (44% growth) and iron and steel (36%). Not all industrial sectors will see their emissions grow. The forest products industry may actually contribute to significant emission reductions through production of new bio-products and bioenergy. If these products replace carbon-intensive fuels and materials in other sectors, they could offset substantial GHG emissions.
Economic ImpactIn 2013, the large industrial emitters sector generated about $160 billion or 11% of national GDP, and employed two million Canadians in direct jobs and another two million in supporting industries. Many of the large industrial emitters are export-oriented and vulnerable to international competition. Increases in production costs can make it harder to compete in international markets. For example, in the oil and gas sector, any new production costs cut into profits since prices are set internationally. Given that oil and gas prices are currently at historic lows, the industry’s ability to bear new costs may be limited.
The oil and gas industry has the largest economic impact, generating $120 billion or 8% of national GDP in 2013. Crude oil production has grown steadily over the past two decades and is expected to continue growing, primarily driven by the oil sands. While natural gas production has fallen since 2005, it is expected
12 Canada’s Second Biennial Report on Climate Change, ECCC 2016.
13 This projection is consistent with Alberta’s 100 Mt/year cap on emissions from the oil sands, a recently announced policy which excludes emissions from upgraders and cogeneration.

Working Group on Specific Mitigation Opportunities Final Report
50
to increase 15% by 2030, and there is potential for significant growth in the export of liquefied natural gas if a number of proposed projects go forward. In 2014, Canada exported 76% of its annual crude oil production and 52% of its annual natural gas production, with the vast majority going to the U.S.
The chemicals and fertilizers industry is anticipated to grow due to new and expanded facilities in areas such as ethylene and polyethylene manufacturing. Ammonia manufacturing for fertilization is expected to increase due to the agricultural needs of a growing North American population. There are also other expected plant expansions.
The iron and steel industry exports around 50% of its annual production, primarily to the U.S., and is expected to increase its production so it is operating at 80% of its full capacity by 2030.
The forest products industry, with approximately 95 pulp and paper mills, and over 1000 wood products mills, is operating below capacity and limited growth is expected. In 2014, it generated $16.6 billion. In many rural communities, this industry is the primary or sole economic driver, and is also a major employer for Indigenous communities, providing jobs for approximately 9,000 Indigenous people across Canada.
Canadian ContextCanada’s oil and gas production is located primarily in AB, SK, and BC, with offshore production in NL and NS. Bitumen production is concentrated in AB, with some production in SK. Gas production in BC and AB currently consists of a mix of conventional and unconventional gas (i.e. shale and tight gas); unconventional production is expected to dominate in BC in the future. Refining crude oil into various petroleum fuels occurs in most provinces, with the largest facilities and greatest capacity in AB, ON, QC and NB.
The chemicals and fertilizers industry is primarily located in AB, ON and QC. However, 75% of its reported GHG emissions come from the ethylene, ammonia and hydrogen manufacturing facilities located in AB and ON. AB has also announced that two or three new petrochemical plants could be built under its economic diversification strategy.
ON is the largest base for steel production, with three facilities. QC has a major iron and steel company and one ilmenite smelter that produces steel as a by-product. Together, these facilities account for about 68% of national steel production and 90% of the industry’s emissions. Aluminum production is the largest source of emissions in the non-ferrous smelting and refining of metals industry, with about 60% coming from nine aluminum smelters in QC and one in BC.
The other industries — namely cement, lime, pulp and paper, and mining — together generated about 10% of the sector’s emissions. All are currently operating under capacity, from 55% for lime and gypsum, to 85% for pulp and paper.
Key Policies in PlaceThe federal government has established programs to improve energy efficiency across industries within this sector, such as the Energy Efficiency for Industry program. Other funding programs have targeted the pulp and paper industry, and numerous research and development initiatives specific to the manufacturing and oil and gas industries have been launched to improve environmental performance. The federal government in recent years has phased out a number of tax incentives supporting fossil fuel (coal, oil and gas) exploration or development.
The federal government has committed to introduce regulations to reduce venting and fugitive methane emissions from the oil and gas sector by 40-45% below 2012 levels by 2025. The federal government has also endorsed the World Bank’s Zero Routine Flaring by 2030 Initiative.

Working Group on Specific Mitigation Opportunities Final Report
50Working Group on Specific Mitigation Opportunities Final Report
51
Provincial and territorial governments across the country have proposed or implemented various measures to target emissions in this sector. BC has a $30/tonne carbon tax on fossil fuels. BC has also set an emissions intensity benchmark on facilities in its emerging liquefied natural gas sector (0.16 tonnes CO2e/tonne of LNG). BC is also working with its cement sector to set a combustion emissions intensity benchmark for 2019. BC’s August 2016 Climate Leadership Plan includes a goal of a 45 per cent reduction for fugitive and vented methane from the natural gas sector by 2025. AB has announced it will bring a new $30/tonne carbon levy on transportation and heating fuel into effect in 2017. AB also has the Specified Gas Emitters Regulation that requires facilities with over 100 kt CO2e of annual emissions to meet emission intensity reduction targets and reinvest revenues in reduction opportunities. AB will bring a new carbon pricing approach into effect in 2018 that will include emission performance standards for large industry, and has committed to a 45% reduction in methane emissions from the oil and gas industry by 2025. AB has also set a 100 Mt CO2e cap on emissions from the oil sands.
NL recently announced requirements for facilities generating over 25 kt CO2e of annual emissions. QC has implemented a cap and trade approach that covers facilities emitting over 25 ktCO2e of annual emissions,14 and ON is scheduled to implement a similar system in 2017. A number of programs from QC’s Climate Change Action Plan target large industrial emitters, working to improve energy efficiency and support the transition to lower-carbon fuels. MB provides research and development funding arrangements to support efforts on emission efficiencies.
Federal, provincial and territorial governments have also worked together to reduce industrial emissions, notably by jointly developing the Air Quality Management System. This system creates a framework for working together to set ambient air quality standards and introduce base-level industrial emission requirements, known as BLIERs.
6.2.2 Summary of Key Options to Reduce Emissions in 2030
Analysis to date has shown that policies directed at reducing fossil fuel use, reducing emissions of short lived climate pollutants, and enhancing capture and use of industrial process gases will all serve to mitigate GHG emissions in the short to medium term. Such policy options include provision of direct financial incentives (e.g., grants, tax preferences, low-interest loans), as well as requirements on industrial facilities. Support from governments may be required to ensure necessary infrastructure is available to access reduction opportunities. Over longer timescales, research and development will be required to bring on-line new, less-carbon-intensive technologies.
Consequently, low carbon electrification, carbon capture and storage/use, reducing methane emissions, energy efficiency and increasing the use of zero/low-emitting and renewable fuels and feedstocks are some of the key technical reduction opportunities. These opportunities will require specific and targeted measures coupled with investment in technology and infrastructure development in order to drive reductions to 2030 and beyond. It will be important to realize near-term operational improvements together with a clear longer-term path to implement transformative technologies.
14 QC’s cap and trade system also covers electricity production and imports, fugitive emissions from electricity and natural gas transportation and distribution as well as companies distributing over 200 liters of fuel (automotive gasoline, diesel fuels, propane, natural gas and heating fuel).

Working Group on Specific Mitigation Opportunities Final Report
52
Table 3: Policy Options for Large Industrial Emitters
Policy Tool Estimated Range
of Emissions Reductions in 2030
Estimated Cost per Tonne
I1 Use incentives to promote cogeneration 1-2 Mt <$0-$50
I2 Apply equipment regulations and/or rate based incentives to increase use of electricity throughout the industrial sectors
3-15 Mt $100->$250
I3 Mandate or use incentives to promote energy efficiency
6-41 Mt Varies by policy option, from $0 to $0-$50
I4 Ban on routine flaring from oil and gas facilities, petroleum refineries and chemical plants
<1-2 Mt N/A
I5 Switch fuels with lower carbon alternatives 1-27 Mt Varies by policy option, from $0-$50 to $100-$250
I6 Require methane emissions reductions from upstream oil and gas facilities
18-20 Mt $0 to $50
I7 Additional carbon emissions reductions through abatement and sequestration (CCS and other) technology
3-5 Mt $50-$100
I8 Limit carbon emissions through transformative changes in technology
11-29 Mt $100-$250*
* Costs are presented in standardized ranges. Costs for this policy are based on estimates in the range of $100-$150 per tonne.
Areas for further consideration • The federal government has committed to phase out its inefficient fossil fuel subsidies.15 Ongoing
review of relevant taxes and programs could support this objective.
• Another area to explore is the use of captured carbon in products, as a fuel or feedstock, or alternative storage methods. Capturing carbon emissions is a practical technology in some industrial sectors but the proximity to suitable underground geologic storage sites can be a limiting factor. Technologies and processes that use or store captured carbon are being developed and demonstrated but need to be scaled up in order to make any meaningful impact on industrial emissions.
• The field of industrial ecology holds potential for helping to reduce emissions. This is similar to the concept of the “circular economy,” in which industrial wastes can be used as inputs to other industries and processes. In some cases, this can be achieved through the creation of industrial parks where co-location allows for technologies such as district heating using waste heat or large-scale cogeneration of heat and power for multiple facilities. Some of these individual ideas are already explored in the report but the potential for industrial ecology in the Canadian context could benefit from further analysis.
• There are a number of policy options identified in this report that cut across sectors. Before implementing such policies, careful cross-sectoral analysis would be required to coordinate policies. For instance, the supply for renewable fuels such as biogas, biofuels, biomass or agricultural wastes would require coordination with the waste, transportation, agriculture and forestry sectors. Options to increase electrification could also increase electricity demand and would need to be coordinated with efforts
15 Recent iterations of this commitment by the federal government include the Leaders’ Statement on a North American Climate, Clean Energy, and Environment Partnership (June 2016) http://pm.gc.ca/eng/news/2016/06/29/leaders-statement-north-american-climate-clean-energy-and-environment-partnership and the G7 Ise-Shima Leaders’ Declaration (May 2016)

Working Group on Specific Mitigation Opportunities Final Report
52Working Group on Specific Mitigation Opportunities Final Report
53
to scale up clean electricity generation and transmission. Optimization of new cogeneration potential would require the development of specific scenarios together with the electricity subgroup accounting for availability of waste gases, geography and local non-industrial demand.
6.3 Transportation
6.3.1 Sector Portrait
Transportation plays a vital role in the lives of Canadians and our economy. It links people to jobs, products to consumers, and communities to each other, while connecting Canada with global value chains that serve as the backbone for domestic and international trade.
Sector EmissionsTransportation GHG emissions growth slowed between 2005 and 2013, increasing only 1%. With no further mitigation actions, this sector’s emissions are projected to be 3% lower than 2005 levels by 2030, largely as a result of existing federal regulations limiting GHG emissions from new on-road vehicles. Passenger vehicle emissions have tended to track population growth, although there has been a gradual decoupling since the early 2000s. Freight emissions are linked to economic activity and thus follow GDP.
Figure 5: Transportation Emissions by Mode, 2005-2030
Emissions in this sector can be divided by mode of transportation:On-road emissions include those from vehicles such as cars, buses and trucks, and made up approximately 81% of total transportation emissions in 2013. Light-duty vehicles, which include vehicles such as passenger automobiles, minivans, and SUVs, currently make up the majority of the sector’s emissions. Under the Business as Usual scenario, these emissions are expected to decline to 40% of the sector’s emissions by 2030. However, Canadian consumers increasingly prefer higher GHG-emitting vehicles, such as Sport Utility Vehicles, which may slow this decline. On-road freight accounted for 28% of the sector’s emissions in 2013, and is anticipated to grow to 36% by 2030, largely due to growth in freight activity and the predominance of carbon-intensive fuels.

Working Group on Specific Mitigation Opportunities Final Report
54
Domestic aviation emissions accounted for 4% of the sector’s emissions in 2013, a slight decrease from 2005 despite increased passenger traffic. This decline is due to engine and operational efficiencies. Emissions are expected to increase by 2030 due to increased traffic.
Rail emissions increased slightly between 2005 and 2013, accounting for 4% of the sector total, and are anticipated to grow to 5% by 2030. Freight operations accounted for 97% of these emissions. Rail is more efficient than on-road freight transportation per tonne-kilometre.
Domestic marine emissions decreased nearly 20% between 2005 and 2013, representing 3% of the sector’s emissions, with growth to 5% anticipated by 2030. This mode is largely used for freight and is more efficient per tonne-kilometre than heavy-duty vehicles.
Off-road emissions, which include residential equipment as well as recreational and commercial vehicles, accounted for 7% of the sector’s emissions in 2013. This mode is expected to account for 9% of the sector’s emissions by 2030. Industrial vehicles (primarily agricultural, construction and mining vehicles) are generally accounted for outside the transportation sector, but generated nearly 30Mt in 2013, about 4% of total national emissions. For the purposes of this report, these industrial vehicles are considered within the transportation sector.
Economic ImpactIn 2014, Canada’s transportation system generated 3.7% of national GDP, moved over $1 trillion worth of goods through international trade, and directly provided jobs for 896,000 Canadians, representing 5% of employment across the country.
Canadian ContextThe majority of emissions from transportation are concentrated in southern Canada in urban centres, which are key hubs for passenger and freight transportation. ON accounted for 32% of total transportation emissions in 2013, and together with QC and the Prairie provinces, generated 80% of Canada’s total transportation emissions. The majority of these emissions are from on-road vehicles. As a result of economic and population growth, transportation emissions increased in AB, SK and MB from 2005 to 2013. The Territories accounted for less than 1% of transportation emissions in 2013. Emissions are generally spread proportionally by population across the country, with the exception of rail, where the largest share of emissions comes from AB (42%), and domestic marine emissions, which are concentrated in B.C. (40%) and the Eastern provinces (60%).
Key Policies in PlaceThe federal government has aligned regulations with the U.S. that establish progressively stricter GHG emissions standards for new passenger automobiles (2011-2025 model years), as well as new on-road heavy-duty vehicles and engines (2014-2018 model years). It has also announced its intent to develop a second phase of regulations with more stringent standards for post-2018 model years to further reduce GHG emissions from new heavy-duty vehicles, engines and trailers, which will also be aligned with the U.S. The federal Renewable Fuels Regulation sets minimum volumetric requirements for renewable content of gasoline (5%) and diesel (2%). Existing transportation programs that facilitate improvements in fuel efficiency across this sector include the SmartWay Transport Partnership; driver training; a “green levy” on inefficient vehicles; and funding to advance the deployment of shore power technology at some Canadian ports. Most recently, Canada announced $62.5 million for the demonstration and deployment of electric vehicle charging and alternative fueling stations.

Working Group on Specific Mitigation Opportunities Final Report
54Working Group on Specific Mitigation Opportunities Final Report
55
Canada is a member of the International Civil Aviation Organization, which has launched a framework for alternative fuels, developed a standard for CO2 emissions from new airplanes that comes into effect in 2020, and is developing a market-based approach to carbon neutral growth from 2020 onwards. Domestically, the sector has been improving fuel efficiency through voluntary agreements with the Government of Canada since 2005. In 2013, a memorandum of understanding was renewed with the Railway Association of Canada to encourage voluntary emission reductions between 2011 and 2015. In partnership with the International Maritime Organization, the federal government has also adopted a number of measures to reduce GHG emissions from Canadian-flagged ships navigating in international waters, which includes requiring newly built vessels to meet progressively stricter minimum energy efficiency standards from 2015 onwards.
Transportation and the environment are both areas of shared federal and provincial-territorial jurisdiction. These orders of government, as well as municipal governments, have put in place many initiatives to limit GHG emissions and air pollution across transportation modes. Given that almost 82% of Canadians live in urban areas, efforts have been made by all levels of government to promote alternate modes of transportation such as transit, walking, and cycling. Many municipalities also integrate land-use and transportation planning, as land use decisions have a long-term influence on how people travel.
Several provinces have implemented carbon-pricing measures or taken steps to increase the use of lower carbon fuels16 via renewable fuel regulations that exceed the federal renewable fuel requirements. BC has also implemented a low-carbon fuel standard. Some provinces have implemented initiatives to test emissions from in-use on-road vehicles (e.g. Drive Clean in ON), or to accelerate the replacement of on-road vehicles (e.g. BC SCRAP-IT).
Provinces have also enacted measures to reduce emissions from the on-road sector, including: consumer rebates for electric vehicles (QC, ON and BC); funding for electric vehicle charging stations; and incentives for fuel-efficient retrofits for heavy-duty vehicles. BC has a program allowing natural gas utilities to spend up to $149 million over 5 years on incentives for ferries, heavy-duty vehicles and infrastructure. BC has also announced a doubling of the incentives for renewable natural gas in the transportation sector and fuelling ocean-going marine vessels with LNG. Governments are studying and supporting the trend towards greater connectivity and automation in the transportation network, which is expected to lead to a number of benefits including emissions reductions. Recently, ON became the first province to allow on-road testing of automated vehicles. Both QC and BC are members of the International Zero Emission Vehicle Alliance, a collaboration of national and subnational governments working together to accelerate the adoption of zero emission vehicles. Finally, it is important to note that reductions in GHG emissions from transportation could reduce air pollutant emissions, resulting in overall public health benefits.
6.3.2 Summary of Key Options to Reduce Emissions in 2030
Opportunities exist to reduce emissions across all modes of transportation, from light-duty passenger and commercial vehicles to heavy-duty trucks, marine vessels, rail, aviation, and off-road transportation, including in the mining, agricultural and industrial sectors. The fleet of vehicles currently in use across all sectors represent a significant opportunity given their long life but can be costly to retrofit or replace. Some modes and sectors represent larger opportunities than others. For example, tightening fuel efficiency standards can lead to emission reductions when fleets are renewed; however, turnover rates – and the potential for achieving emission reductions before 2030 – differs from mode to mode. The potential to reduce emissions also varies by region, with limited opportunities in sparsely populated areas such as northern Canada and rural parts of many provinces and territories.
16 LCF: Lower carbon fuels refers to fuels that emit fewer GHGs relative to fossil gasoline or diesel.

Working Group on Specific Mitigation Opportunities Final Report
56
For passenger vehicles, key opportunities include technological changes such as improving fuel efficiencies and expanding the number of Zero Emission Vehicles (ZEVs) on the road. This report includes a suite of policy options aimed at reducing passenger vehicle emissions, including regulatory action on fuel efficiency and measures to increase the share of ZEVs in automakers’s fleets.
Beyond driving cleaner cars and trucks, there are significant opportunities in designing our cities and building public infrastructure to help people drive less by sharing vehicles, walking, cycling and taking transit. There are also opportunities for efficient inter-city transportation. This kind of behavioural shift is best accomplished with integrated and complementary policies that both push people away from polluting activities – such as driving alone – and concurrently pull them toward cleaner modes of transport.
For heavy duty freight vehicles, there are a range of promising technological opportunities, from aerodynamic retrofits to improve efficiencies to new engine technologies powered by alternative fuels to advanced computers to optimize, automate and connect vehicles so they are better coordinated and more efficient. Some of these technologies could be applied to both on-road and off-road heavy duty vehicles and equipment. This report includes a variety of policy tools aimed at supporting deployment of these technologies.
Another major opportunity that cuts across all transportation modes and sectors is the use of low carbon fuels. Light and heavy duty vehicles in Canada mostly run on petroleum-based fuels, with a small amount of biofuels blended in. There is potential to use more biofuels, and also to use a greater variety of alternative fuels which are less polluting than gasoline and diesel, such as compressed or liquefied natural gas, renewable natural gas, and hydrogen produced with clean power.
Table 4 below provides a high-level overview of policy options to target these opportunities, with further detail in Annexes 1 and 2. It should be noted that the cost per tonne ranges below are based on national averages, and therefore do not fully capture important regional differences.
The above policies are intended as a comprehensive set of potential options. Some policies focus on near term improvements while others are meant to drive deeper reductions over the longer term. Some are complementary while others overlap or interact; as a result, the emission reduction estimates shown above should not be added together but rather must be considered separately.
As discussed in Chapter 3, the programs above are largely complementary to carbon pricing: many of them focus on overcoming barriers that pricing cannot fully target. Some, however, might be duplicative of an aggressive price on carbon, such as various targeted pricing policies and some elements of low carbon fuel policies. In most cases, a strong carbon price would strengthen the cost-effectiveness of the above policies

Working Group on Specific Mitigation Opportunities Final Report
56Working Group on Specific Mitigation Opportunities Final Report
57
Table 4: Policy Options for Transportation
Policy Tool Estimated Reductions in 2030 Estimated Cost per Tonne
T1 Passenger vehicle regulations and incentives, including for Zero Emission Vehicles
2-12 Mt Varies by policy tool, from $0-$100 to $100-$250
T2 Regulations and complementary measures to increase the use of low carbon fuels for on-road vehicles and off-road industrial vehicles
10-20 Mt Varies by policy tools, from $0-$50 to $100-$200
T3 Regulations, incentives and other measures to improve energy efficiency in the marine, aviation, rail and off-road industrial sectors
3-17 Mt Varies by policy tool, from $0-$50 to $0-$250
T4 Regulations and incentives for heavy duty vehicles and engines
6-13 Mt Varies by policy tool, from <$0 to >$250
T5 Regulations, incentives and other tools to improve vehicle and engine fuel efficiency in the aviation, marine, rail and off-road sectors
2-6 Mt $0->$250
T6 Regulations, funding and incentives to improve fuel efficiency of the current fleet of on-road vehicles
2-6 Mt Varies by policy tool, from $0-$50 to >$250
T7 Incentives, investments and other mechanisms to improve freight efficiency
1-5 Mt Varies by policy tool, from <$0 to >$250
T8 Transportation demand management plans to change transportation usage patterns
1-4 Mt Varies by policy tool, from <$0 to >$250
T9 Reducing congestion and vehicle-kilometres travelled using prices, taxes and other economic instruments
1-3 Mt Varies by policy tool, from >$0-$100
T10 Regulations and other measures to increase low carbon fuels for marine, rail and aviation
1-2 Mt $100-$250
Areas for further consideration There are number of additional areas that could be explored further for future policy action to target the transportation sector:
• The integration of transportation network design into urban planning is an issue that cuts across multiple sectors, including transportation, buildings, electricity. This could include integrating public and active transportation into urban design and infrastructure projects, basing urban design decisions on analysis and optimization of transportation patterns.
• Further study is needed on opportunities for integrating electric vehicles into the electric grid. This is an issue that cuts across the transportation and electricity sectors. With sufficient numbers of vehicles on the road, electric vehicles can act as a large distributed battery and provide grid storage, which can help allow more renewable energy to come online. Options could also be explored for supporting systems that integrate electric vehicle charging infrastructure with renewable energy on a small scale.
• Further development of alternative fuel options for heavy-duty vehicles (e.g., renewable natural gas, fuel cells, electricity).

Working Group on Specific Mitigation Opportunities Final Report
58
• This report explores options for zero-emission vehicles for passenger use (T1) and compatibility of vehicles with low-carbon fuels (T2) but an area for further study could be policies to drive replacement of urban fleets (e.g. taxis, delivery and service vehicles, municipal government vehicles) and off-road vehicles with alternative fuel or zero emission vehicles.
• Targeted policy support for domestic production of zero-emission and alternative fuel vehicles could be further explored, and potentially supported by options identified by the Working Group on Clean Technology, Innovation and Jobs.
6.4 Built Environment
6.4.1 Sector Portrait
Canada’s built environment includes residential, commercial and institutional buildings, as well as the equipment used within them to power functions like space heating and ventilation.
Sector EmissionsCanada’s built environment produces about 12% of our total GHG emissions. Nearly 85% of emissions from residential buildings and almost 70% of emissions from commercial buildings are a result of fossil fuel combustion for space and water heating. Figure 6 shows past and forecasted direct emissions for the sector, which have been relatively flat between 2005 and 2013. However, direct GHGs in this sector — created by fossil fuel use and fugitive emissions from refrigerants — are anticipated to grow by almost 27% between 2013 and 2030.
Figure 6: Buildings – Historical and Projected Direct GHG emissions (excluding electricity generation)
Although electricity accounted for 38% of the energy used in the built environment in 2013, the emissions associated with electricity generation are not included in the above numbers. If these indirect emissions were included, the sector’s overall share of 2013 national emissions would increase from 12% to 17%. Even though there has been a decoupling of energy use and GHG emissions over the past 10 years due to efficiency improvements and a greener electricity grid, population and economic growth will push emissions up.

Working Group on Specific Mitigation Opportunities Final Report
58Working Group on Specific Mitigation Opportunities Final Report
59
Economic ImpactSince 1990, economic growth in the residential and commercial sectors has been rapid, and is expected to continue — for example, GDP associated with the commercial sector has increased by over 75%. Commercial and institutional floor space is projected to increase by close to 50% between 2005 and 2030, and the number of households will increase by 40%. These projections are influenced by broader macroeconomic trends including population growth (expected to be 1% per year) and overall economic growth (expected to be 2.2% per year).
From a consumer perspective, in 2013 Canadians spent almost $49.1 billion – the equivalent of about 3% of GDP – on energy to heat and cool their homes and offices, and to operate appliances. However, in 2013, Canadians saved over $17 billion in energy costs and avoided over 38 Mt of GHG emissions, as a result of energy efficiency improvements between 1990 and 2013 in the built environment17.
Canadian ContextThe built environment’s emissions vary across provinces, largely driven by different supply mixes for electricity generation and energy use. Regionally, electricity use is most prominent in QC and some Atlantic provinces, while natural gas is the primary fuel used in AB, SK and ON. Gas and electricity use have more equal shares of the total in MB, BC and the North; there is very little gas in NWT. Housing conditions are of particular concern for many Indigenous communities facing shortages, chronic overcrowding and sub-standard housing conditions.
Key Policies in PlaceOver the last 20 years, energy efficiency programs and measures have been the predominant tool at all levels of government used to reduce GHG emissions from the built environment, while also achieving other policy goals such as: conserving energy; improving energy delivery to reduce generation, transmission and distribution costs; and reducing the impact of energy price increases and volatility. Energy efficiency also provides the benefit of healthier indoor environments by improving heating and ventilation systems. Energy efficiency investments and re-investing energy savings can also provide stimulus to the economy18. Research has found that $1 of energy efficiency programs spent by utilities and provincial governments resulted in $4 to $8 of GDP19.
Energy efficiency programs from all levels of government have significantly affected both historical and forecasted emissions. The federal government develops and implements regulations for appliances and equipment that are applied nationally. It also typically provides national standards, codes, and benchmarking systems for use by the provinces, territories and municipalities. In turn, these tools are used to develop local regulations, and to deliver incentives to meet their local circumstances and climate change polices. A 2015 study reviewed 268 programs offered across Canadian jurisdictions by large utilities and government agencies, with spending totalling $613 million.20 Based on input submitted by provinces and territories, and a voluntary listing of energy efficiency programs21, the study found that most of the energy efficiency programs in Canada provide a financial subsidy to incentivize investments in energy efficiency.
17 http://oee.nrcan.gc.ca/corporate/statistics/neud/dpa/data_e/publications.cfm?attr=0#a
18 Capturing the Multiple Benefits of Energy Efficiency, International Energy Agency, 2014
19 Energy Efficiency, Engine of Economic Growth in Canada, Environment Northeast, 2013
20 Leverage Office of Energy Efficiency Spending, Indeco Strategic Consulting., December 2015
21 http://oee.nrcan.gc.ca/corporate/statistics/neud/dpa/policy_e/programs.cfm

Working Group on Specific Mitigation Opportunities Final Report
60
6.4.2 Summary of Key Options to Reduce Emissions in 2030
Opportunities exist to reduce GHG emissions across the built environment, and for the most part, the path to reductions is well understood. Realizing the technical potential will require integration of this knowledge across the sector and reducing costs to ensure affordability. They can be broken out into several key opportunities:
• Increasing building efficiency (insulation, air tightness, design and siting)• Increasing building heating, cooling and mechanical (e.g., ventilation, controls) equipment efficiency• Transitioning space and water heating fuels towards low-carbon alternatives• Increasing the efficiency of appliances, lighting, electronics and other non-heating and cooling equipment• Improving management of commercial buildings and regular recommissioning to optimize performance• Behavioural and operational changes by building users to reduce energy use and shift the timing of energy
use to reduce peak demands on energy systems• Moving towards more compact, higher density, mixed-use community development patterns that support
accelerated shifts to transit and active transportation modes, as well as sustainable energy use
Table 5 below provides a high-level overview of policy options to target these opportunities, with further detail in Annexes 1 and 2. It should be noted that the cost per tonne ranges below are based on national averages, and therefore do not fully capture important regional differences. Costs per tonne also vary by heating fuel because of significant variations in fuel costs.
A key enabling measure across these policies is training and education for consumers and the construction and building operation industries. In many cases improvements can be achieved at low cost but are not implemented due to lack of knowledge or expertise.
While aspects of policies B1 to B5 would interact with one another upon implementation, they have been modelled as targeting separate market segments (e.g. new vs existing buildings; equipment efficiency vs building envelope improvements) to limit overlap between them. The other policies would also interact, but any potential overlap has not been taken into account. For example, residential fuel-switching measures under policy B6 would both interact with and complement B2, Existing Housing and B5, Equipment Efficiency. Implementation of building based solar photovoltaic systems under B6 would interact strongly with electricity sector measures. Urban form and spatial planning measures will largely drive transportation emissions reductions but may also facilitate improvements to new building efficiency by driving more compact design. Demand response opportunities and behavioural change will interact with all other building-related policies. More broadly, policies in the electricity and industry sector aimed at reducing the emissions intensity of fuels will interact strongly with building policies.
As discussed in Chapter 3, the programs above are complementary to carbon pricing: they are focused on overcoming barriers that pricing can’t fully target. However, a strong carbon price would strengthen the cost-effectiveness of many of the above measures, increasing market uptake on voluntary programs such as home retrofits. This is particularly true for policies reducing natural gas consumption.

Working Group on Specific Mitigation Opportunities Final Report
60Working Group on Specific Mitigation Opportunities Final Report
61
Table 5: Policy Options for the Built Environment
Policy Tool Estimated Reductions in 2030 Estimated Cost per Tonne*
B1 Net- Zero Ready Codes For New Housing by 2030 or 2025 (~40% improvement from 2012 model code)
4-5 Mt Electricity: <$0 Natural Gas: >$250
Oil: $0-50/t to $50-100
B2 Existing Housing (retrofits to achieve 1.5%-10% reduction in energy use via incentives, building labeling, regulations, financial instruments)
1-6 Mt Electricity/Oil: < $0 to $0-50 Natural Gas: $50-100 to >250
B3 Net-Zero Ready Codes For New Commercial-Institutional Building by 2035, 2030 or 2025 (~65% improvement from 2015 model energy code)
4-5 Mt Gas/Elec.: $100-250 Oil/Elec.: $0-50
Elec.: <$0
B4 Existing Commercial-Institutional Buildings (energy management and retrofits to achieve 2-17% reduction in energy use via incentives, regulations and information programming)
<1-6 Mt <$0
B5 Equipment Efficiency (more stringent standards; incentives for high efficiency equipment)
6-8 Mt Varies by category: < $0 to >$250 in 2016,
<$0 for all by implementation**
B6 Renewable Power And Fuel Switching (1 million residential solar PV systems; incentives or loans for residential fuel switching to electricity)
<1-6 Mt Solar PV: >$250 Oil to Electricity: <$0
Natural Gas to Electricity: >$250
B7 Demand Response Opportunities and Behaviour Change (enhanced billing, time of use billing, demand response incentives, adaptive thermostats)
<1-2 Mt <$0
B8 Urban Form & Spatial Planning (densification, transit supportive planning, transportation demand management, community energy planning, tree planting, green roofs, permeable surfaces)
N/A N/A
* Costs per tonne for retrofit programs may overstate actual costs as costs are lower for older and inefficient buildings, which are among those most likely to take advantage of these programs. In some cases costs are negative (<$0/t) even for natural gas-fuelled buildings.
** Cost by implementation date for all measures anticipated to be <$0/t due to long ramp-up period, market transformation initiatives and technological improvements
Areas for further consideration • Demand-side management (DSM) programs are widely used in Canada by utilities and provincial
governments as a low-cost alternative to building new electricity generation and transmission capacity or new natural gas distribution capacity. The most successful North American programs have reduced demand by 1-2.5% of total demand per year. Standalone DSM utilities such as Efficiency One (Nova Scotia) are an effective approach to harnessing this potential. Some aspects of the policies identified in this report are similar to DSM programs but have been adapted to focus on GHG mitigation. Further integrating GHG mitigation goals into provincial and utility DSM programs and broader DSM policy work (e.g., regarding changes to the regulatory framework for utilities to align profit incentives with DSM goals) could lead to significant emission reductions and warrants further investigation.
•

Working Group on Specific Mitigation Opportunities Final Report
62
• Building codes and retrofit measures could also further explore how to reduce the embedded carbon in building materials by prioritizing low carbon materials (e.g., wood rather than concrete or steel, where appropriate). Policy option F1 under the Forestry sector proposes specific work on this which could be expanded.
• Programs targeting primary agriculture buildings could offer further possibilities as energy for heating and cooling is a major source of GHG emissions from greenhouses, fruit and livestock production.
• As detailed in Annex 2, this report does not estimate GHG reductions from changes to urban form. These areas warrant further analysis. Substantial reductions are possible through integrated land use, transportation and community energy approaches. Annual urban GHG emissions could be further reduced if population and job growth occurs primarily within existing developed areas; infill areas are prioritized around transit networks; more travel happens by transit, bike and by foot; and more communities are powered by district energy systems and renewable energy.
6.5 Electricity Generation and Transmission
6.5.1 Sector Portrait
Canada is one of the world’s largest and cleanest producers of electricity, ranking second globally in hydroelectricity22 and first in the G7 on the share of renewables in our supply mix23.
Sector EmissionsElectricity generation is Canada’s fourth-largest source of GHG emissions, representing 12% of national emissions in 2013. Emissions in this sector are projected to decline 52% by 2030 from 2005 levels, as a result of policies currently in place.24
Figure 7: Projected Electricity GHG Emissions (Mt CO2e) *Numbers may not add up due to rounding*25
22 “Canada – Canada Statistics,” International Hydropower Association, 2014, www.hydropower.org/country-profiles/canada.
23 IEA’s Electricity Information 2015 with 2013 data, Table 1.2, page III.8.
24 Based on policies in place as of September 2015, as per emissions projections included in Canada’s Second Biennial Report on Climate Change.
25 Canada’s Second Biennial Report on Climate Change www.ec.gc.ca/GES-GHG/default.asp?lang=En&n=02D095CB-1

Working Group on Specific Mitigation Opportunities Final Report
62Working Group on Specific Mitigation Opportunities Final Report
63
Economic ImpactElectricity generation and transmission is a major driver of our economy, contributing $37 billion per year or 2% of direct GDP, while creating an average of 87,250 direct jobs. 26 In 2014, capital and repair expenditure totaled $25.6 billion.27 Canada also has some of the lowest electricity prices in the Organisation for Economic Co-operation and Development countries,28 which makes our industries more competitive.
Canadian ContextCanada’s electricity supply was about 80% non-emitting in 201429, with a supply mix that included 59% hydroelectricity, 16% nuclear and about 5% non-hydro renewables30. However, between 2008 and 2014, wind and solar energy represented the fastest-growing generation sources. 31 There is also substantial coal-, natural gas- and oil-fired generation in Canada, accounting for about 21% of Canada’s generation mix. Much of Canada’s hydroelectric generation happens in remote areas that require high voltage transmission lines to bring power to urban and industrial centers.
Figure 8: Provincial/ Territorial Electricity Generation by Energy Source and total GHG Emissions (2013)32
Sector emissions vary widely by province, as some jurisdictions are already more than 90% emissions-free and/or renewable33, while others are more reliant on GHG-intensive sources.
26 Energy Markets Fact book, 2014-2015, NR Can (2013 figures).
27 Statistics Canada. Table 029-0046 - Capital and repair expenditures by North American Industry Classification System
28 IEA, Energy Prices and Statistics: Quarterly Statistics. www.iea.org/media/statistics/surveys/electricity/mes.pdf
29 Ibid.
30 Ibid.
31 Ibid.
32 Ibid.
33 Statistics Canada CANSIM tables 127-0007 and NRCan internal data for wind/solar. www5.statcan.gc.ca/cansim/a26?lang=eng&id=1270007

Working Group on Specific Mitigation Opportunities Final Report
64
Key Policies in PlaceEfforts by the federal government to reduce emissions in this sector include: regulations for coal-fired electricity; significant incentives for renewable energy programs; funding for research, development and demonstration projects; loan guarantees for major projects; and accelerated capital cost allowances for renewable energy equipment.
Provincial and territorial governments are taking action to reduce reliance on GHG-intensive electricity generation. AB has committed to eliminating GHG emissions from coal-fired electricity by 2030, replacing the coal-fired generating capacity with two-thirds renewable energy, along with implementing a planned carbon levy. ON has eliminated coal-fired electricity, and approximately 90% of its power in 2015 came from non-emitting sources. BC’s carbon tax applies to fossil fuel-fired generation. MB’s last remaining coal facility operates under a standby provision and can only generate electricity under emergency circumstances. This unit will cease all operations in 2019 once new hydro resources come on-line. NWT is targeting renewable energy of up to 20% of the average load in their diesel communities and ranks second in Canada per capita for installed solar capacity. The NWT is proposing to reduce its diesel fuel use for electricity generation by 25% by 2025.
Many jurisdictions are setting requirements or targets to reduce emissions and drive expansions in hydroelectric and other renewable electricity generation. SK has announced plans for a 50% renewables capacity target for 2030. Its Boundary Dam project is the world’s first commercial-scale, coal-fired carbon, capture and storage electricity project, and is able to capture and sequester up to 90% of its GHG emissions. YK has established and met a target to increase renewable energy by 20% by 2020, is implementing energy conservation initiatives at the government and utility levels, and continues to plan for additional renewable energy capacity. NWT is targeting a solar supply of up to 20% of the average load in their diesel communities.
BC, MB, QC, and NS have also announced plans to expand hydroelectric capacity, while NB and PEI have both established targets to expand renewable energy use. BC requires a minimum of 93% of electricity to be clean or renewable and recently announced it intends to make BC’s electricity 100% clean or renewable. ON plans to significantly expand renewables and is refurbishing nuclear stations. QC has established a cap-and-trade program for GHGs and is targeting a 25% increase in renewable energy output by 2030. Once NL’s Lower Churchill hydroelectricity project’s first phase (Muskrat Falls) is completed, 98% of the province’s electricity generation will be renewable. NS has legislated hard caps on GHG emissions in the sector, driving a more than 50% reduction by 2030, with plans to reach at least 40% renewable generation in the grid supply by 2020. These policies are also supported by an equivalency agreement between NS and current federal regulations to phase-out coal-fired electricity.
Provinces are also increasing trade of electricity to expand access to cleaner electricity, including: MB and SK; NL and NS; and ON and QC. Some jurisdictions have also made investments in demand-side management measures. For example, NS requires their electricity utility to invest in energy efficiency when it is the most cost-effective option for ratepayers. ON recently announced a new entity will be created as a low-carbon service provider and financing entity. Efficiency NB and NB Power have merged, allowing NB Power to provide energy efficiency programs. Similarly, BC has legislated requirements that require 66% of all new power demand to be met through conservation by 2020.
6.5.2 Summary of Key Options to Reduce Emissions in 2030
There are two basic ways to reduce emissions from the electricity sector: reduce demand for electricity from fossil fuel-fired electricity or replace fossil-fuel fired electricity with non- or low-emitting sources. Both types of approaches are needed, and should work together to achieve reductions. Demand-side management measures are considered in the Built Environment section of this report. A more thorough

Working Group on Specific Mitigation Opportunities Final Report
64Working Group on Specific Mitigation Opportunities Final Report
65
and comprehensive analysis of the emissions reduction potential of demand-side measures is an area for future work. Policy tools to reduce emissions from electricity generation include performance standards and regulations; non-emitting portfolio standards; financial incentives; and trade between provinces and territories with abundant low-emitting resources and those currently dependent upon fossil fuel combustion.
Additional, targeted policies may be needed to address diesel fuel use in off-grid communities. Estimated total current GHG emissions are small at 1.4 Mt CO2e /year, but reductions would have significant co-benefits for the many remote communities in Canada that rely on diesel fuel combustion for energy generation.
Table 6 below provides a high-level overview of policy options to reduce emissions from electricity generation and transmission. Further detail about these policy options can be found in Annexes 1 and 2. It should be noted that the cost per tonne ranges below are based on national averages, and therefore do not fully capture important regional differences. The impact that these policies would have on consumer electricity prices could vary significantly across jurisdictions. In addition, these costs do not include investments in enabling infrastructure that would be needed or account for stranded assets, both of which could be significant in some jurisdictions. For example, Nova Scotia estimates that the costs of policy options E1 and E2 are much higher than presented. This is due to: limited natural gas accessibility; existing natural gas supplies are far more expensive in Nova Scotia; and the high cost of building new gas pipeline extensions needed for reliability from the rest of Canada into Nova Scotia.
Table 6: Policy Options for Electricity Generation and Transmission
Policy Tool Estimated Range of Emissions Reductions in 2030 Estimated Cost per Tonne*
E1Emissions Intensity Performance Standards 9-21 Mt
$0-50 or $50-100, depending on policy design**
E2 Accelerated Coal Phase-out By 2030, with regulatory flexibility to enable use of CCS technology
15 Mt $50-100**
E3 Non-Emitting Portfolio Standard 8 – 15 Mt $50-100
E4 Financial support for non-emitting electricity generation (30-45 TWh)
13-19Mt $50-100
E5 Financial support to reduce diesel use in Northern/ remote communities
<1 Mt $100->$250
E6Electricity grid investments 1-17 Mt
Site specific $0-100
*Note that cost estimates in the electricity sector are based on conservative assumptions, and may decline as renewable energy technologies continue to improve and the challenges to ensure electric reliability in a changing resource mix are identified and addressed.
**Nova Scotia has estimated the cost of this option at $>250/t for their jurisdiction.
Broadly speaking, the above policies are different tools that target the same sources of emissions and overlap significantly with each other. However, these options could also be complementary under a well-designed and coordinated approach. For example, improving interconnectedness and providing financial support for the construction of new non-emitting forms of electricity generation can facilitate the implementation of a non-emitting portfolio standard or the setting of an emissions intensity performance standard for fossil fuel-fired electricity generation. A price on carbon could also be used to drive reductions in the electricity sector, with appropriate complementary measures that would depend on the level of the carbon price.

Working Group on Specific Mitigation Opportunities Final Report
66
Areas for further consideration
There are numerous other costs and considerations that should inform any future policy approach. These include the potential costs of stranded assets; the cost of associated infrastructure; potential impacts on the stability and reliability of the electricity grid; the pace of technological improvement in renewable energy and storage technologies; and the impact of health and air quality co-benefits.
In addition, there are several areas that were not fully explored while developing options for this report but could merit further consideration:
• Other financial incentives (e.g., grants, tax preferences, low interest loans) to support the deployment of renewable energy technologies
• Options to increase decentralized generation, including community-based energy strategies. Further development of possible approaches in areas such as microgeneration, district energy, and combined heat and power, and others could be explored in coordination with the built environment and industrial sectors (Options in included in this report include some preliminary analysis – e.g., B6)
• Best practices for utility legislation and regulation in a low-carbon world. Model guides for energy regulators could be developed, for instance to encourage performance-based rate setting in support of increased investments in energy efficiency, storage, and grid reliability
• Further analysis on how different market structures might interact with various policy options • Future demand for cross-border clean energy trade with the United States • Further study of the potential to increase grid interconnectedness, flexibility, and stability, including
solutions to address barriers to scaled up East-West linkages, and options for grid modernization to optimize new transmission assets
• The impact on electricity demand associated with policies to reduce emissions by transitioning from fossil fuels to clean electricity in key sectors such as transportation, the built environment, and industrial sectors
6.6 Agriculture
6.6.1 Sector Portrait
Agriculture is a foundational industry in Canada that drives employment, creates trade opportunities and sustains our communities. This portrait largely focuses on primary agricultural production.
Sector EmissionsEmissions in this sector are largely produced by the biological processes inherent to animal and crop production. While agriculture contributes to GHG emissions, agricultural soils have the capacity to sequester carbon, which offsets the sector’s overall impact.
Total emissions from this sector have been relatively stable since 2000, despite agricultural productivity increasing. This is due to advances in efficient farm management practices, which has resulted in a reduction in the aggregate emission intensity of the sector by about 20% since 2000. Aggregate emissions include GHG emissions from crop production, livestock production and energy use on farms, as well as emissions and removals from agricultural land use.
Non-energy GHG emissions directly related to animal and crop production accounted for 59 Mt CO2e in 2014 — approximately 8% of Canada’s total GHG emissions. Agriculture contributed 27% of national methane and 70% of national nitrous oxide emissions. The two main sources of agricultural emissions are ruminant animals and fertilizer application. In addition to non-energy GHG emissions, on-farm fuel use generated 14 Mt CO2e in 2014.
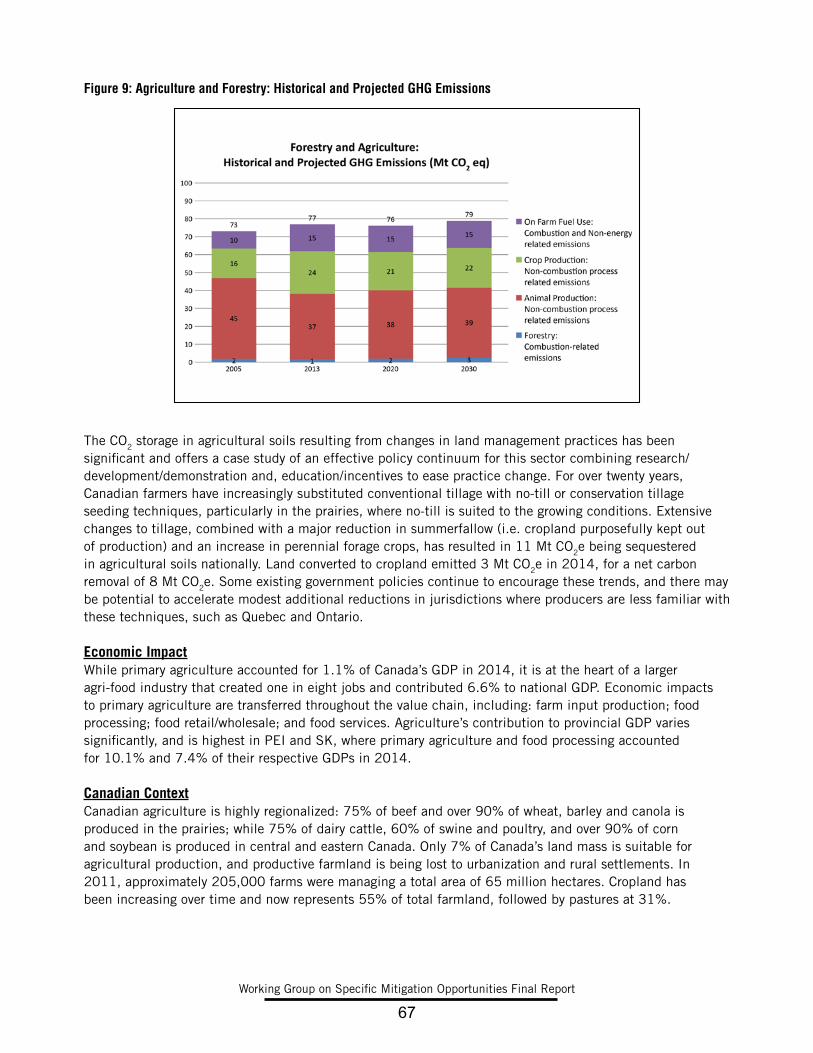
Working Group on Specific Mitigation Opportunities Final Report
66Working Group on Specific Mitigation Opportunities Final Report
67
Figure 9: Agriculture and Forestry: Historical and Projected GHG Emissions
The CO2 storage in agricultural soils resulting from changes in land management practices has been significant and offers a case study of an effective policy continuum for this sector combining research/development/demonstration and, education/incentives to ease practice change. For over twenty years, Canadian farmers have increasingly substituted conventional tillage with no-till or conservation tillage seeding techniques, particularly in the prairies, where no-till is suited to the growing conditions. Extensive changes to tillage, combined with a major reduction in summerfallow (i.e. cropland purposefully kept out of production) and an increase in perennial forage crops, has resulted in 11 Mt CO2e being sequestered in agricultural soils nationally. Land converted to cropland emitted 3 Mt CO2e in 2014, for a net carbon removal of 8 Mt CO2e. Some existing government policies continue to encourage these trends, and there may be potential to accelerate modest additional reductions in jurisdictions where producers are less familiar with these techniques, such as Quebec and Ontario.
Economic ImpactWhile primary agriculture accounted for 1.1% of Canada’s GDP in 2014, it is at the heart of a larger agri-food industry that created one in eight jobs and contributed 6.6% to national GDP. Economic impacts to primary agriculture are transferred throughout the value chain, including: farm input production; food processing; food retail/wholesale; and food services. Agriculture’s contribution to provincial GDP varies significantly, and is highest in PEI and SK, where primary agriculture and food processing accounted for 10.1% and 7.4% of their respective GDPs in 2014.
Canadian ContextCanadian agriculture is highly regionalized: 75% of beef and over 90% of wheat, barley and canola is produced in the prairies; while 75% of dairy cattle, 60% of swine and poultry, and over 90% of corn and soybean is produced in central and eastern Canada. Only 7% of Canada’s land mass is suitable for agricultural production, and productive farmland is being lost to urbanization and rural settlements. In 2011, approximately 205,000 farms were managing a total area of 65 million hectares. Cropland has been increasing over time and now represents 55% of total farmland, followed by pastures at 31%.

Working Group on Specific Mitigation Opportunities Final Report
68
Canada is a major exporter of agriculture and agri-food products, with approximately 58% of the value of primary agricultural production in Canada exported in 2014. While the level of export dependence varies by agricultural commodity, Canada has to compete in international markets and accept prevailing prices for its products. The U.S. is the most important trade partner, although growing Asian and European markets are also very important.
The sector’s emissions profile is highly asymmetric across Canada, reflecting regional production systems. AB, SK and MB were the only provinces achieving a net soil carbon removal rate in 2014. This reflects the suitability of no-till to prairie conditions, and the financial and environmental benefits of low impact one-pass seeding in the prairies, where large farms are coupled with soils prone to erosion.
Figure 10: Provincial GHG Emissions and Removals by Gases (2014)
Key Policies in PlaceSustainability is a key component of the principal federal-provincial-territorial agriculture policy framework, which is renegotiated every 5 years. The current framework, Growing Forward 2 (2013-18), includes programs that provide environmental education and cost-shared funding for producers to implement on-farm beneficial management practices (BMPs). BMPs have multiple outcomes, such as improved soil and water health, and GHG reductions. Some provinces also include a focus on programs specific to on-farm energy use, such as improved efficiency, increased use of renewables, and capture of methane from on-farm waste.
Outside of the agriculture policy framework, many provincial or federal-provincial policies and programs contribute to on-farm GHG reductions, including: feed-in-tariffs; nutrient management regulations; intensive livestock operations regulations; manure management regulations; and land management policies. AB, QC and ON have agricultural offsets as part of their emissions trading programs.
Investments in GHG-specific research, innovation and technology transfer are a key policy focus (e.g. the federal Agriculture Greenhouse Gas Program). Additional research, extension, and technology transfer efforts geared towards improvement of production efficiencies are contributing to reducing GHG emissions per unit of production.

Working Group on Specific Mitigation Opportunities Final Report
68Working Group on Specific Mitigation Opportunities Final Report
69
6.6.2 Summary of Key Options to Reduce Emissions in 2030
Opportunities for further absolute emissions reductions are regionally variable and generally small under current technologies. Remaining opportunities focus primarily on managing methane emissions from livestock and manure, using fertilizers more efficiently, and increasing planting of cover crops or nitrogen-fixing crops and forages. Given that farmers are price takers and manage their operations to remain competitive on world markets, policy options focus on voluntary incentive programs.
There may be potential for additional reductions of emissions resulting from on-farm fuel use, for instance by improving the energy efficiency of farm equipment and buildings, or increasing on-site energy generation (e.g., T5, B6).
Table 7: Policy Options for Agriculture
Policy Tool Estimated Range of Emissions Reductions in 2030 Estimated Cost per Tonne*
A1 Reduced methane from cattle (dietary changes/ reduced age at harvest)
<1-2 Mt $0-$50 or $50-$100, depending on policy option
A2 Conversion of marginal land from annual crops to permanent cover
<1 Mt $0-$50
A3 Increase planting of nitrogen-fixing crops, pulses and forages
<1 Mt $0-$100
A4 Increase adoption of zero-till <1 – 1 Mt $0-$50
A5 Manure management technologies <1 Mt >$250
A6 Precision fertilizer application Up to 1 Mt $0-$50 or $50-$100, depending on policy design
and level of ambition
*With the exception of A5, the estimated cost per tonne only reflects government costs.
Options to reduce summerfallow were also considered, and show some promise as mitigation measures. However, summerfallow requires no government intervention to achieve reductions of up to 1 MT of CO2e. in 2030.
Offset credits for emissions reductions generated by sustainable agricultural practices could be considered as a compliance option under a carbon pricing system. Some of the options considered in this report are similar to offset protocols in place under current carbon pricing regimes and/or offset systems. Any use of offsets to incent emissions reduction would require rigorous, long-term monitoring methods to ensure the permanence of reductions.
Areas for Further Consideration Some key areas that are important to the agricultural sector but not fully reflected in the above options include:
• Research, Development and Demonstration (RD&D): Innovation and information will be a key component of further major reductions from the sector. Research developments suggest significant potential to reduce emissions in the medium term, but substantial additional work remains to be done, in particular in feed and nutrition improvements for livestock, innovation in genetics and breeding, and enhanced efficiency fertilizers and measurement of carbon reduction potential in grasslands.

Working Group on Specific Mitigation Opportunities Final Report
70
• Bioenergy/Bioproducts: The sector can play an important role in the development of bioenergy sources. There is potential to expand the conversion of agricultural wastes into energy, and increase the use of dedicated crops as feedstock for plastics, composites, fibre and fuel. Enabling conditions include policies to drive market demand, increase feedstock supply, and encourage investment into processing facilities.
• Policy research: Additional analysis could determine which policy tools would be best suited to support the acquisition of equipment and technology for precision agriculture management, bio-digesters and other on-farm changes requiring significant capital investments.
• Data collection: Most recommended actions are not captured in the National Inventory Report. Improved data collection and measurement techniques are required to fully capture the effects of action taken by farmers to reduce emissions. For instance, investments are needed in the accuracy and detail of the data used to inform Canada’s GHG inventories and reporting. There is significant diversity in Canada’s agricultural sector that may be missed by methodologies that adopt a normalized national baseline or a broad business as usual approach.
6.7 Forestry
6.7.1 Sector Portrait
Forestry is one of Canada’s foundational industries and still drives the economy of many communities. Canada’s forests are of global significance as a stock of carbon. Forests offer significant potential for long-term mitigation through both reductions in emissions and increasing the carbon removed from the atmosphere. Considering how Canada’s forests will adapt to climate change is also important – for instance, adjusting forest management to account for increased frequency and intensity of forest fires.
Sector EmissionsGHG emissions and carbon removals in this sector are included in the Land Use, Land-Use Change and Forestry Sector in Canada’s GHG inventory. This inventory only includes so-called “managed” forests – i.e., those under active human intervention – which make up about two-thirds of Canada’s total forests. The GHG balance of Canada’s managed forest fluctuates from year to year, largely due to the impacts of natural disturbances such as wildfires and insects. These disturbances vary in severity, extent, and frequency, making future disturbances difficult to predict. Including natural disturbances in GHG inventory estimates obscures the impacts of human activity on emissions and removals trends; new approaches are being explored to remove the impact of natural disturbances from the inventory estimates34. Natural disturbances can have significant emissions impacts.
Commercial harvesting results in a substantial amount of stored carbon being taken out of Canada’s forests each year, averaging 158 Mt CO2 annually between 1990 and 201435. Once harvested, the carbon in the wood may not immediately be released into the atmosphere, as the timing of release depends on the end use of the wood. Reducing harvesting may not reduce overall emissions if the wood products get replaced by more emissions-intensive products such as concrete and steel. Bioenergy produced using residues from harvesting or manufacturing can reduce carbon emissions in other sectors by replacing fossil fuel use. In this report, options for the use of bioenergy are considered in the Large Industrial Emitters, Built Environment and Electricity sectors.
34 National Inventory Report 1990-2014, Part 1, page 151 and Part 2, page 112
35 Based on estimates for the National Inventory Report 1990-2014.

Working Group on Specific Mitigation Opportunities Final Report
70Working Group on Specific Mitigation Opportunities Final Report
71
Table 8: Forest-related GHG emissions and removals, Mt CO2e. Negative numbers are removals or a “sink”; positive numbers are emissions or a “source”.
1990 2000 2005 2010 2013 2014 20301
Managed forest2 -250 -250 -150 -82 -170 -63 NA
Harvested wood products 140 160 150 140 140 140 NA
Deforestation3 19 14 14 13 12 12 NA
Afforestation4 -1 -1 -0.9 -0.7 -0.6 -0.6 NA
1. No projections are provided in keeping with Canada’s approach in its 2016 second Biennial Report to the UNFCCC, pending development of estimates that exclude the impacts of natural disturbances. 2. GHG inventory category of forest land remaining forest land (includes emissions from natural disturbances). 3. GHG inventory categories of forest land converted to other land categories. 4. GHG inventory category of land converted to forest land. Source: National Inventory Report 1990-2014: GHG Sources and Sinks in Canada, Part 1, page 142.
There is very little land-use change in Canada’s forests36. Less than 0.02% of the country’s forest land is affected by deforestation each year and this rate is declining. Deforestation emissions have averaged 14 Mt CO2e per year since 1990. They are not primarily driven by the forestry sector, but rather by a complex mix of economic factors and impacts from sectors such as agriculture, resource development, and municipal development. Afforestation rates (e.g. planting trees on unused land) are relatively low and not closely monitored. Afforestation has removed about 1 Mt CO2e per year since 1990.
Economic ImpactAbout 904 thousand hectares of Canada’s forests are harvested every year37. Canada is the world’s leading exporter of softwood lumber, newsprint and chemical wood pulp based on the value of those products38. This focus on international exports makes the forest industry particularly sensitive to economic and policy differences between jurisdictions. Overall, the industry contributed $21 billion or 1.1%39 of Canada’s nominal GDP in 2014, and directly employed over 195,000 Canadians across the country40, many in rural communities. The forest sector is also important for Indigenous people, with 70% of Indigenous communities located in forested regions and 9,000 Indigenous Canadians employed in the sector.
Canadian ContextCanada has the third largest forest in the world, covering some 348 million hectares. Approximately two-thirds of this (232 million hectares) is managed forest.41 Close to 90% of the forest is under provincial or territorial jurisdiction, about 2% is under federal jurisdiction, 2% is under Indigenous jurisdiction, and the remaining 6% is privately owned42. This breakdown differs by region; for example, in the Maritime Provinces, most forested land is privately owned. Engagement and consultation with Indigenous peoples will be critical when considering mitigation activities in many areas.
36 Statistics on land-use change are based on estimates used in the National Inventory Report 1990-2014.
37 National Forestry Database (http://nfdp.ccfm.org/). 2014 data.
38 The State of Canada’s Forests 2015, page 45.
39 Ibid, page 51.
40 Ibid, page 12.
41 National Inventory Report 1990-2014, Part 1, page 147.
42 The State of Canada’s Forests 2015, page 50.

Working Group on Specific Mitigation Opportunities Final Report
72
Harvesting and the industries it supports — such as producing lumber or paper products — occurs in all provinces and territories except NU. Some provinces have larger forest industries than others, and the economic differences between them reflect regional differences in harvest rates and the types of products produced. For example, BC accounts for the largest share of Canada’s harvest and generates the most revenue from wood product manufacturing, while QC, with the second largest harvest, generates the most revenue from pulp and paper manufacturing43.
Key Policies in PlaceFew policies with the direct goal of forest-related mitigation have been implemented, but other policies often have a mitigation benefit. For example, the federal government indirectly addresses mitigation through collaborative wood market development programs that promote the use of wood as a renewable building material. Some provinces have “wood first” policies which similarly encourage the use of wood in construction, such as “Atlantic WoodWORKS!” and British Columbia’s “Wood First” Act.
Provincial standards and regulations require that all forests harvested on public land be regenerated. Sustainable forest management is supported by a framework of extensive laws, regulations and policies, and forest certification. At the end of 2015, Canada had 166 million hectares of independently certified forest land, the largest area of third-party-certified forests in the world44.
Provincial and territorial governments have a number of initiatives that directly seek to achieve mitigation related to forests, such as the Ontario 50 Million Tree Program and the BC Forest Carbon Partnership Program. A number of provinces support or are considering forest carbon quantification protocols for use in offset programs that allow emitters to balance their environmental impact by investing in efforts to protect, restore or plant forests. BC was the first jurisdiction in Canada to establish a government standardized and accredited forest carbon offset protocol (FCOP) in 2011. BC also developed a policy that enables sharing of carbon benefits between the province and First Nations groups.
6.7.2 Summary of Key Options to Reduce Emissions in 2030
Canada’s forests have considerable potential to increase their role in helping mitigate climate change, in particular over the long term. Realizing this potential will require a focus on actions that help reduce emissions and increase the carbon stored in trees, soils, and forest products. The Intergovernmental Panel on Climate Change has emphasized the importance of lifecycle analysis and considering the total GHG impacts across the forest and forest products system, taking into account emissions and removals in the forest, storage of carbon in harvested wood products, and avoided emissions in other sectors.45 It is important to note that due to this report’s focus on mitigation by 2030, the contribution of the forest sector appears lower than it would over a long time period. For most policies, GHG reductions will be quite a bit greater by 2050.
For example, harvested wood products can contribute to mitigation when they are used in ways that avoid immediate emissions through decomposition and replace more emissions-intensive products in other sectors. One of the options in this report proposes increasing the use of harvested wood in the construction of tall and mid- rise buildings, timber bridges, industrial buildings and commercial box-type construction projects, thereby increasing the long-term storage of carbon in our building stock and helping reduce the use of carbon-intensive building products such as concrete and steel.
43 Ibid, pages 52 and 54.
44 www.sfmcanada.org/en/sustainable-forest-management/embracing-third-party-certification.
45 See Nabuurs et al. 2007. Forestry. In Climate Change 2007: Mitigation. Contribution of Working Group III to the Fourth Assessment Report of the Intergovernmental Panel on Climate Change. Edited by B. Metz, O.R. Davidson, P.R. Bosch, R. Dave, and L.A. Meyer. Cambridge University Press, Cambridge, UK.

Working Group on Specific Mitigation Opportunities Final Report
72Working Group on Specific Mitigation Opportunities Final Report
73
Another opportunity is to increase the amount of carbon sequestered in living forests. This can be achieved through planting more trees to expand forest cover and changing forest management practices, both of which are included as options in this report. There are a range of practices that can help increase carbon storage and reduce or avoid emissions, such as reduced burning of harvest residues, changes in harvesting practices and rehabilitating forest lands affected by natural disturbances. These practices tend to be regionally-specific; certain approaches make more sense in certain parts of Canada and in particular forests than others. One of the options presented in this report is to increase regional forest rehabilitation activities, and another is to develop regional forest action plans that reflect how GHG mitigation can be achieved through adjustments in forest management practices.
Using forest biomass (e.g. wastewood, organic residues from industry, etc.) for renewable bioenergy can also contribute to mitigation. This opportunity is included in fuel switching options in other sectors: Large Industrial Emitters (I1, I5), Built Environment (B6), Transportation (T2, T10) and Electricity Generation and Transmission (E1, E2).
Table 9 below provides a high-level overview of policy options to target these opportunities, with further detail in Annexes 1 and 2. It should be noted that the cost per tonne ranges below are based on national averages, and therefore do not fully capture important regional differences. As well, mitigation will be higher when considered over a longer period such as to 2050. Costs have been estimated based on longer-term GHG mitigation (i.e. beyond 2030) and so already reflect the long term benefits of near-term investments.
Table 9: Policy Options for Forestry
Policy Tool Estimated Reductions in 2030* Estimated Cost per Tonne
F1 Increase domestic wood use for building construction
<1-2 Mt $0-$50
F2 A new forest program to increase the area of newly forested land
1-7 Mt $0-$50
F3 Increased forest rehabilitation after natural disturbances like fire and insect infestation where such efforts are not currently required
<1-1 Mt $50-$100
F4 Change in forest management practices 8-10 Mt $0-$50
*Mitigation benefits continue to grow after 2030 as a result of initial investments (for example, because trees continue to grow).
As discussed in Chapter 3, the programs above are complementary to carbon pricing. Since they mostly focus on increasing carbon sequestration rather than reducing emissions, pricing carbon would not provide a strong incentive to pursue these forestry actions.
Areas for further consideration There are a number of important areas in which the forestry sector could contribute to mitigation outcomes which are not fully addressed in the detailed options presented in this report. Some of these areas for further consideration include:
• Avoiding deforestation – policy options to explore could include incorporating reducing deforestation as a goal in land use planning or environmental impact assessments. Deforestation policies would focus on many sectors, not just the forest sector, since most deforestation is due to actions in other sectors.
• Improving forest inventories, in particular using new technologies to help take stock of Canada’s forests on a national scale, as well as the capacity for monitoring and modeling carbon changes at the regional scale.

Working Group on Specific Mitigation Opportunities Final Report
74
• Establishing integrated policies and guidance on criteria to conserve non-commercial forest elements such as wetlands and forest soils.
• Research – priority areas include improving our understanding of fire and pest dynamics and suppression, carbon-rich ecosystem components like deep soils, wetlands/peatlands, how albedo is affected by mitigation actions, and non-tree forest plants such as mosses and lichens. Research could also explore improvements to carbon modeling and enhanced management practices.
• Developing policies or strategies for unmanaged forest lands.
6.8 Waste
6.8.1 Sector Portrait
The waste sector handles the by-products of human life, from the food waste of communities, to the wastewater of industry. However, innovative strategies and clean technologies are helping us close the loop as we work to become a zero-waste society.
Sector EmissionsWaste accounts for about 3% of Canada’s total GHG emissions and includes emissions from landfills, wastewater treatment and incineration. Emissions in this sector are anticipated to decrease by almost 29% below the 2005 level by 2030. Around 82% of these emissions are associated with municipal solid waste landfill gas. This trend of emissions reductions is largely due to increases in landfill gas capture.
Figure 11: Waste Management – Historical and Projected GHG Emissions (Mt CO2e)

Working Group on Specific Mitigation Opportunities Final Report
74Working Group on Specific Mitigation Opportunities Final Report
75
While landfills are an important source of emissions, there is a growing body of evidence that identifies waste prevention, reuse and recycling as the largest source of untapped potential for GHG reductions in this sector.46,47 These activities produce indirect GHG reductions that, on a life cycle basis, appear in other sectors of the economy or even outside of Canada and are not directly attributed to the waste sector in national emissions inventory reporting.
Economic ImpactIn 2015, the waste management industry employed about 43,000 people48 and contributed about $9 billion (or 0.6%) to the national GDP49.
Canadian ContextCanada’s municipal solid waste generation per capita continues to be closely linked to growth in GDP, and is among the highest in the Organisation for Economic Co-operation and Development (OECD) countries.50 The vast majority of municipal solid waste is landfilled in 88 large landfills across the country, as well as in numerous smaller facilities in rural and northern areas. Canadians generate about 33 million tonnes of waste per year, of which about 73% is disposed in landfills and less than 2% is incinerated. 51 Only about 25% is diverted, whereas leading OECD countries divert 50% to 60%.
Jurisdictions that are leading in waste diversion provide insight on what realistic diversion and recycling targets could be for Canada as a whole. For example, in 2013, NS led with the highest diversion at 42% of total waste generated and the highest organics diversion at 23.5% of total waste generated, compared to only a 6.7% national diversion rate for organics. For recyclables, QC and BC had the best performance, diverting 23% and 21.4% of total waste generated respectively,52 compared to a 15.7% national diversion rate
Key Policies in PlacePolicies to address the emissions produced by municipal solid waste landfills have been implemented at the provincial and municipal government levels. Several PTs have existing regulations or other instruments to mandate or encourage landfill gas capture and flaring or utilization However, regulations are not equivalent in all jurisdictions and further opportunities are available.
For organics diversion, NS and PEI have regulations banning organic waste from disposal and requiring collection of organics from the non-residential sector. QC also has announced its intention to ban organics by 2020. In the provinces and territories without regulations, many municipalities have implemented green bin programs to collect organics from residences and/or bans on landfilling organics53. The non-residential sub-sectors — which include institutional, commercial and industrial waste — represent a significant opportunity to improve organics diversion rates across Canada.54
46 Waste Management, In Climate Change 2007: Mitigation. Contribution of Working Group III to the Fourth Assessment Report of the Intergovernmental Panel on Climate Change. www.ipcc.ch/pdf/assessment-report/ar4/wg3/ar4-wg3-chapter10.pdf
47 Greenhouse Gas Emissions and Potential for Mitigation from Materials Management within OECD Countries. OECD, 2012. www.oecd.org/env/waste/50035102.pdf.
48 Statistics Canada, 2016. CANSIM Table 281-0023. www5.statcan.gc.ca/cansim/a47
49 Statistics Canada, 2016. CANSIM Table 379-0031. www5.statcan.gc.ca/cansim/a26
50 Conference Board of Canada, 2013. www.conferenceboard.ca/hcp/details/environment/municipal-waste-generation.aspx
51 Statistics Canada, 2013. www.statcan.gc.ca/tables-tableaux/sum-som/l01/cst01/envir32a-eng.htm
52 Statistics Canada, 2013.
53 Giroux Environmental Consulting, 2014. State of Waste Management in Canada.
54 Ibid.

Working Group on Specific Mitigation Opportunities Final Report
76
For recyclable materials, all provinces and territories have programs in place, particularly for materials that are the most pressing from a GHG reduction perspective, such as paper products and metals. The territories have limited programs in place due to unique challenges in northern/remote areas, but efforts are under way to expand the range of materials covered. BC has achieved its diversion rate using mandatory and voluntary Extended Producer Responsibility (EPR) programs, while QC employs a mix of shared responsibility programs, Product Stewardship programs and EPR. For institutional, commercial and industrial waste, there are gaps in recycling program coverage in most jurisdictions, which represent a significant opportunity for further reductions.55
Federal, provincial and territorial jurisdictions collaborate on waste policy priorities through the Canadian Council of Ministers of the Environment.
6.8.2 Summary of Key Options to Reduce Emissions in 2030
There are three basic ways to reduce emissions from waste: 1) waste prevention; 2) diversion of organics or recyclable material; and 3) capture and reuse emissions from waste such as landfill gas. The policy tools with greatest potential to reduce GHG emissions in the waste sector in Canada are: increasing landfill gas capture and flaring or utilization; reducing avoidable food waste; increasing organics diversion; and increasing recyclable materials diversion.
The IPCC fourth assessment report identifies waste prevention, re-use and recycling as key GHG mitigation actions and indicates that life cycle analysis is required to quantify GHG-reductions from these actions. For example, waste prevention and recycling conserve raw materials and reduce energy consumption, while diversion of organics and paper products reduces landfill methane generation, and organics can be processed to produce renewable natural gas. As such, a life-cycle approach has been taken to estimate potential emission reductions for waste reduction and diversion policy options presented in this report. These are the only policy options in this report using this approach and as such have relatively large reductions attributed to them. Note that some estimated lifecycle reductions would occur outside of Canada.
Table 10 below presents a brief summary of the proposed policies, estimated emission reductions and estimated costs for the waste sector.
Table 10: Policy Options for Waste
Policy Tools Estimated Range of Emissions Reductions in 2030
Estimated Cost per Tonne
Direct Emissions Reductions
W1 Landfill gas capture and use (increase to 60%, with regulations/incentives) 2-3 Mt $0-50
Indirect Emissions Reductions (based on life-cycle approach)
W2 Reduce avoidable food waste (by 50%) 10 to 15 Mt* $<0
W3 Diversion of organics (increase to 20-25% by 2030) 1 to 4 Mt* $0-50
W4 Diversion of recyclable materials (increase to 13-35%) 2-16 Mt* $0-50
* These indirect emissions reductions estimates were calculated using a life-cycle approach and as such also include reductions in other sectors of the economy.
55 Ibid.

Working Group on Specific Mitigation Opportunities Final Report
76Working Group on Specific Mitigation Opportunities Final Report
77
Some of the options presented above are overlapping. For example, reducing the quantity of organics that is landfilled will also reduce landfill gas to be captured in the future, and waste prevention activities will reduce the quantity of material and organics available for diversion. However, if combined into a coordinated approach, these options could enable Canada to move toward a low-waste, ‘circular’ economy over the longer term. Ideally, waste would be reduced to the maximum extent possible, inevitable waste would be reintegrated into the production chain, and emissions from legacy landfill waste would be captured and used to generate energy.
Areas for further consideration Some of the options would require significant investments in infrastructure and enforcement such as municipal organic processing and recycling facilities. Also, a carbon pricing scheme could support emission reductions in the waste sector, for example by making the price of landfill gas more competitive with fossil fuels and/or by using the proceeds from carbon pricing to fund improvements in recycling and organics diversion. Further work is required to identify specific infrastructure costs or potential impacts of a carbon price on the policies proposed above. Additional analysis is also needed to refine methodologies for estimating reductions (e.g. emissions factors) from lifecycle measures.
In addition, two other policy options that were not fully explored while developing options for this report could merit further consideration:
• Options to reduce packaging and use of disposable products (e.g. plastic bags and foam cups), clothing/textile reuse and other waste prevention activities could be examined to determine which policy tools could be adopted and estimate potential emission reductions and costs.
• Energy-from-waste (EFW) - recovering energy from waste via combustion in the form of electricity, heat or steam (this is distinct from any methane capture and combustion). Currently, less than two percent of Canada’s total waste is processed in less than five EFW facilities. EFW could be considered in Canada as a complementary policy tool when high levels of waste reduction, recycling and diversion will have been achieved, with consideration for negative impacts (e.g. air quality) and place-specific costs.
6.9 Government Operations and Leadership
The government operations sector is large and diverse, providing a wide variety of services to Canadians. This sector includes federal, provincial, and territorial government operations, and can be scoped more broadly to include the operations of municipalities, universities, schools, and hospitals.
As an influential sector, government can show leadership by reducing its own emissions. Governments are responsible for a significant stock of public assets, providing an opportunity to lead by example by implementing ambitious policies to reduce emissions from fleet, buildings, and other assets. They are also major purchasers and providers of goods and services, which can help to build demand for low-carbon goods and services and provide a testing ground for new and emerging technologies.
Sector EmissionsThe core operations of the federal and provincial government accounted for about 0.6% of Canada’s total emissions in 2013 (about 5 Mt)56. The biggest emitter by far is the federal government, which has diverse operations in every jurisdiction. The biggest single source of emissions in the federal government is the Department of National Defence.
56 Statistics Canada. Table 153-0114 - Physical flow account for greenhouse gas emissions, annual (kilotonnes), CANSIM (database). (accessed: 2016/09/08) www5.statcan.gc.ca/cansim/a26?lang=eng&retrLang=eng&id=1530114 The 0.6% includes the following two sectors of the Statistics Canada table: “Other provincial and territorial government services”, and “Other federal government services and defence services”.

Working Group on Specific Mitigation Opportunities Final Report
78
When hospitals, universities, government residential care facilities, education services and other municipal services are included, they accounted for a total share of about 2.4% of Canada’s emissions in 2013 (about 18 Mt).
Canadian Context The public sector has significant purchasing power and is an important source of employment. For instance, the Government of Canada purchases approximately $16.05 billion worth of goods and services every year on behalf of federal departments and agencies.57 Provincial, territorial, and local governments are also major purchasers of goods and services. In 2011, federal, provincial, and territorial governments employed about 780,000 people.58 Approximate estimates of federal, provincial, and territorial government assets indicate that these governments control fleets of at least 64,000 vehicles and 39,000 buildings across the country, with a total of at least 45 million square metres of floor space.
While this section focuses primarily on the operations of federal, provincial, and territorial governments, many of the options proposed could also be applied to the public sector operations more broadly (e.g., local governments, universities, schools, and hospitals) to achieve significant emissions reductions.
Key Policies in PlaceThe federal government and most provinces and territories have put key policies in place to reduce GHG emissions from their operations. The federal government’s Federal Sustainable Development Strategy includes a government-wide target to reduce emissions by 17% below 2005 levels by 2020. Some provincial and territorial governments have also set targets to reduce emissions from their operations. For example, BC’s Carbon Neutral Government Regulation requires public sector organizations to achieve net-zero emissions. It includes requirements to measure and reduce emissions, and to purchase offsets to achieve carbon neutrality. Similarly, ON, MB and YK have also committed to introducing carbon neutral programs.
To support their GHG reduction targets, the federal government and most provinces also have specific policies in place to reduce emissions from their buildings, such as meeting green building standards and targets for improving energy efficiency and using renewable fuel sources for new government-funded buildings or major renovations. Governments have also established funding programs to support investments in these areas. For example, QC has provided $20 million for public building retrofits to convert existing heating systems to use cleaner sources of energy.
A number of governments also have initiatives to reduce emissions from their fleets, such as targets for switching to low- or zero-emission vehicles. Additionally, some governments have implemented policies to encourage the use of public transit and telework to reduce emissions from employee commuting.
Local governments across Canada are also taking action to reduce their emissions, and share jurisdiction over many of the sectors that are important potential sources of emissions reductions.
6.9.1 Summary of Key Options to Reduce Emissions in 2030
Many of the policies included in other sectors of this report could be applied to the government operations sectors (built environment, transportation, electricity generation and transmission). In general, governments can lead by example by adopting ambitious policies, potentially on accelerated timelines, in order to demonstrate that these policies are feasible and beneficial.
57 https://buyandsell.gc.ca/for-businesses/selling-to-the-government-of-canada/the-procurement-process
58 Total employment in the public sector, including schools, hospitals, universities and municipalities was approximately 3.6 million people in 2011. Statistics Canada, “Public sector employment, wages and salaries (employees)” www.statcan.gc.ca/tables-tableaux/sum-som/l01/cst01/govt54a-eng.htm, 2011 data.

Working Group on Specific Mitigation Opportunities Final Report
78Working Group on Specific Mitigation Opportunities Final Report
79
Options to enhance Canada’s procurement of clean technologies are discussed in greater detail in the report by the Working Group on Clean Technology, Innovation and Jobs.
ActionsThe list below provides some examples of actions that can be taken to reduce emissions in the government operations sector.
Facilities:• Transition to renewable power• Improve building energy efficiency through retrofits• Ensure new construction is highly efficient (e.g., net zero)• Develop internal energy efficiency performance standards for buildings• Benchmark building energy performance• Include performance clauses in real property management contracts• Change IT services delivery models, including use of cloud computing,
and rationalize IT infrastructure to reduce power demands• Improve efficiency of central heating plants
Fleet:• Transition to electric vehicles and install charging station infrastructure• Improve fleet fuel economy• Switch to less carbon intensive fuels• Optimize fleet size• Establish coordinated vehicle retro-fit/maintenance programs• Implement vehicle telemetrics• Reduce the number of kilometers travelled
Commodity Products and Services:• Procure goods and services with known (defined) environmental certifications• Include energy efficiency and GHG emissions criteria in procurement decisions• Publish “scorecards” for largest Government suppliers , highlighting their environmental practices• Use only certified, recycled, or renewable paper• Mandate green procurement training for all procurement staff• Enable demonstration projects for new and emerging clean technologies
Employment Policies:• Enable flexible work arrangements, such as teleworking, hoteling/ hot desking,
desk sharing and optimize space allocation• Subsidize the use of shared or public transportation and reduce business related travel• Mobilize the public service, through ‘green teams’ and linkages between emissions
reductions and performance pay
Tools A variety of tools can be used to drive the types of emissions reductions actions listed above. In many cases, these tools could be used in combination with each other and be mutually reinforcing. All of these tools would require careful tracking and measurement of emissions reductions, and investments in data collection. Some of these tools include:

Working Group on Specific Mitigation Opportunities Final Report
80
Targets High-level targets for emissions reductions across government operations can provide an overarching objective and framework for the development of more specific policies to achieve these reductions. Targets for specific types of actions (e.g., use of 100% renewable power, 50% improvement in light-duty vehicle fleet fuel economy, etc.) can also guide action by setting a clear level of ambition. Targets should be complemented by mechanisms to collect data and report regularly on progress.
Carbon Neutral Government Policy Under a carbon neutral government policy, governments would commit to having no net impact on emissions. Governments would reduce their emissions as much as possible, and then invest in emissions reductions projects to offset any remaining remissions. This would require access to an offset system, with eligible projects to produce verified emissions reductions, as well as registries and tracking systems. An illustrative example of a carbon-neutral government policy is included in Annex 2.
Shadow Price/ Internal Carbon Price Shadow pricing is a method of investment or decision analysis that adds a hypothetical surcharge to market prices for goods or services that involve significant carbon emissions in their supply chain. Many companies in Canada in a variety of sectors are using a shadow carbon price. Shadow carbon pricing is typically used at the project level – as part of evaluating options for large projects and for specific greenhouse gas reduction projects, but can apply in all sorts of analyses of investments, procurements, and other strategic decisions to give an edge to options that are less emissions-intensive.
Another possibility could be for the government to adopt an internal carbon price that is higher than any other economy-wide pricing regime in place, in order to drive deeper reductions.
Financial Tools Investments in emissions reductions may require the use of innovative financing tools in order to facilitate access to capital. For example, one option could be to establish an energy revolving fund to provide funding in the form of loans for investments in energy conservation or efficiency. The financial savings from the investments are used to repay the loan, so that over time the principal of the revolving fund is replenished.
Options to scale up the use of energy performance contracting in government operations could be explored. An energy performance contract is an agreement between an organization and energy services company, which guarantees energy savings and can provide financing for departments that have little or no access to capital funding.
6.10 Individual actions
Over the past few months, thousands of Canadians have submitted ideas on ways that they can help Canada to combat climate change. While each individual action may have a small impact, multiplied millions of times, the aggregate impact on emissions is large. There is a range of actions that Canadians can take at home, at work, and on the go to reduce their environmental footprint. Some of these actions are small shifts in behaviour; others involve more substantive investments and behavioural changes. Particularly to enable these bigger shifts, government has an important role in putting in place policies that make it easy, attractive, and convenient for Canadians to act on climate change.

Working Group on Specific Mitigation Opportunities Final Report
80Working Group on Specific Mitigation Opportunities Final Report
81
For instance, some examples of actions that Canadians can take include: • Using active transportation (e.g. walking or cycling to work)• Taking public transit• Participating in carpooling and car-sharing services• Reducing and avoiding idling (e.g. turn the car off when it is parked, reduce “warm-up” time
in winter before driving, walk in to restaurants rather than using drive-thrus)• Avoiding food waste (e.g. grocery shopping based on meals planned for the week)• Reducing meat consumption• Using multi-use containers, like reusable water bottles, bags, and containers • Adjusting thermostats by a few degrees to reduce heating and air conditioning needs
Some of the policy options in this report that could help to enable these actions include: • A national strategy and campaign to reduce avoidable food waste (W2);• Investments in active transportation networks, such as increased cycling and walking infrastructure (B8, T7);• Investments in public transit expansion and frequency (T7)• Education and outreach programs to promote ecoDriving (T6);• Home energy use information programs (B7);
Purchasing decisions by individual Canadians also play a very significant role in shifting economic activity towards lower carbon goods and services. Some examples of small spending decisions by Canadians that can have an impact over time include: • Buying locally-sourced food in season • Choosing items with minimal, compostable and/or recycled packaging • Purchasing environmentally certified products • Purchasing carbon offsets for air travel.
Less frequent, major purchases like appliances and vehicles and investments in home improvements are also key opportunities for Canadians to make choices that have larger and longer term impacts. Some examples of actions include: • Purchasing appliances and electronic accessories that are more energy efficient (e.g. appliances
with high energy efficiency rated by the EnerGuide system);• Undertaking home energy audits, and considering appropriate retrofits to improve energy efficiency;• Installing small-scale sources of renewable energy (e.g. solar panels on roofs);• Purchasing low or zero emission vehicles (e.g. hybrids and electric cars);
Options in this report that can help Canadians to make these types of purchases and investments include: • Financial incentives (grants, tax preferences, low interest loans) and regulations to increase home energy
efficiency of existing residential housing stock (B2)• Incentives for residential fuel switching and small-scale renewable energy sources (B6);• Zero Emission Vehicle (ZEV) consumer incentives, incentives to accelerate the turn-over of pre-2006
passenger vehicles, and consumer awareness programs for ZEVs (T1);
6.11 Internationally Transferred Mitigation Outcomes
Article 6 of the Paris Agreement recognizes that Parties may choose to cooperate in implementing their Nationally Determined Contributions (NDCs) through the voluntary use of internationally transferred mitigation outcomes (ITMOs). ITMOs are mitigation outcomes (or emissions reductions) that occur outside of a country’s borders.
The use of ITMOs for compliance with NDCs is based on the fact that a reduction in GHG emissions has the same impact on the atmosphere regardless of where it takes place. Access to ITMOs could ultimately provide the foundation for allowing climate ambition to be raised over time, as per the Vancouver Declaration and
Working Group on Specific Mitigation Opportunities Final Report
82
the Paris Agreement, while driving down costs.
ITMOs are not specifically defined. They could encompass any mitigation outcomes in other jurisdictions and could take various forms, including: GHG reductions resulting from centralized UNFCCC mechanisms, investments in emission reduction projects or technology transfers; allowances from capped emissions trading systems; and credits from reducing emissions from deforestation and forest degradation in developing countries. The Paris Agreement also created a new centralized mechanism to contribute to GHG mitigation and support sustainable development.
Rules, modalities and procedures for using ITMOs have not yet been developed. With the exception of the use of the new centralized UNFCCC mechanism, which will have specific rules, it is likely to be left largely to Parties to decide which ITMOs they will ‘count’ as reductions toward meeting their NDCs and to demonstrate how they promote sustainable development, ensure environmental integrity, and are consistent with the accounting guidance to be developed to ensure they avoid double counting (i.e., the situation where two countries claim the same emissions reduction toward an NDC).
ITMOs can be acquired through various avenues, including: • Investment in multilateral initiatives through the World Bank, Multilateral Development Banks, or other
multilateral funds;• Trading systems either at the national or sub-national level;• Bilateral investment in reductions outside of Canada; and• Use of the centralized UNFCCC mechanism.
If ITMOs are being transferred between Parties, the Parties will need to make mutual adjustments to their NDCs, which will require agreement between them, including if necessary, on how/whether they will account for the ITMOs.
Toward a Canadian strategy for acquiring and using ITMOs Meeting Canada’s NDC will require significant reductions by 2030 and reaching it through domestic action alone is likely to include some options that are relatively expensive. While it is important for Canada to put in place strategies that will result in significant domestic emissions reductions and contribute to clean economic growth that supports the transition to a low-carbon economy, some of these higher-cost opportunities may not contribute to this transition, or may be prohibitive in cost.
Given that the price of reductions tends to increase over time as lower-cost reduction opportunities are exhausted, and that the mitigation opportunities considered feasible and readily implementable may not be enough to close the 2030 emissions reduction gap, acquiring ITMOs to meet a portion of Canada’s 2030 gap bears consideration.
Careful consideration will need to be given to the balance between investing in domestic mitigation actions in Canada that may have multiple benefits, and in lower-cost reductions abroad to close the gap.
Acquiring ITMOs could also contribute to Canada’s sustainable development goals, and Canada’s support for the achievement of the United Nations Sustainable Development Goals. Exports of Canadian technology or cleaner energy whose end-use results in emissions being lower than they otherwise would have been in another country could also be considered ITMOs. Without agreement from the importing country that Canada could use the ITMOs created, this would not help Canada to meet its NDC, but it could have other benefits to Canadian jurisdictions. ITMOs could also be directly transferred in or out of the country under the Quebec-California cap-and-trade system or through other bilateral mechanisms. In addition, Canadian and international airlines with obligations under ICAO’s market based measure may want to acquire Canadian-based ITMOs if they exist and are available to them.

Working Group on Specific Mitigation Opportunities Final Report
82Working Group on Specific Mitigation Opportunities Final Report
83
A strategy for acquiring ITMOs (i.e., outside of those that already exist under the Western Climate Initiative cap-and-trade system) would need to consider the quantity of ITMOs to be acquired, the timing of acquisition, funding source and vehicle, potential infrastructure requirements, and the criteria that Canada would use both to determine ITMOs it deems acceptable to use towards our NDC and to demonstrate environmental integrity. It will also need to consider whether to allow ITMOs to flow out of Canada for use by others.
Decisions on the quantity of ITMOs to be acquired could be informed by a variety of approaches:
• A cost/tonne threshold: Mitigation that surpasses a pre-determined level would be undertaken through ITMOs;
• Gap filling: ITMOs could be used to completely cover any gap left by selected domestic mitigation policies; • A fixed percentage of the gap is covered by ITMOs (based on some criteria); • A fixed amount of money dedicated to the purchase of/investment in ITMOs.
In terms of timing, some avenues for acquiring ITMOs may require lead time for negotiation, capacity building or project implementation. Early investment and planning could help enable the production of ITMOs, and work to mitigate the risk that there will not be an adequate supply if and when Canada decides to acquire them. Canada could consider acquiring ITMOs early enough to ensure a constant and sufficient supply until 2030 and possibly beyond, and should consider early investments that enable the production of ITMOs, given future uncertainties related to supply and price.
Canada as well as some provinces and territories have already committed significant funding to climate financing to help support the low-carbon transition in developing countries. Opportunities to convert part of such climate financing to investment in ITMOs that would benefit both Canada and provinces and territories could be identified. In addition, a fund dedicated to the purchase of ITMOs could be developed. Consideration could be given to the possibility of sharing the cost of ITMOs between the federal, provincial and territorial governments considering that certain provinces and territories may also be interested in ITMOs to meet their commitments.
Infrastructure such as a registry, to track and report on transfers to and from the federal government may need to be developed.
Canada will need to demonstrate the environmental integrity of any ITMOs it uses. This is generally done using an established set of criteria to show that the reductions are real, additional, permanent, properly owned, quantified, monitored and reported, and verified.
Canada will also need to work within the UNFCCC to ensure its interests related to ITMOs, including the outcome of a strategy developed to acquire ITMOs, are advanced and that any rules developed under the UNFCCC do not hinder its implementation.
Further considerations related to ITMOs can be found in Annex 2.

Working Group on Specific Mitigation Opportunities Final Report
84
7 CONCLUSIONThis report has identified a broad range of possible options for ambitious emissions reductions across all economic sectors. These options build on efforts that are already underway by all orders of government across Canada. The task before Ministers is now to weigh these options against each jurisdictions’ priorities and identify which measures could potentially work together to form part of a national plan on climate change and clean growth. As highlighted in this report, some of the key considerations that could inform these deliberations include:
• Potential emissions reductions• Economic costs• Impacts on economic growth, jobs and competitiveness • Contribution towards longer-term, transformative change• Other benefits, like improved health • Alignment with the priorities and perspectives of Indigenous peoples• Regional differences and impacts• Applicability to the needs of Northern and remote communities• Enabling infrastructure and technology needs• Capacity to reinforce or contribute to adaptation objectives• The choice of policy tools
The options in this report are illustrative examples of possible actions that could be taken to help Canada to reach its 2030 emissions reductions target. Not all options may be feasible or appropriate to every jurisdiction, and a more fulsome assessment of the advantages and disadvantages of each policy option will need to be undertaken before making concrete decisions on policy implementation. Additional modelling and analysis will also be needed to account for interactions between measures, as many of the options in this report overlap with each other. Additional, complementary measures, such as investments in emissions inventories to better account for the impacts of mitigation actions, may also be needed.
Close coordination between a range of partners will be required to determine a path forward on mitigation action. For instance, appropriate mitigation actions depend in part on decisions about carbon pricing options; both Ministers of Environment and Ministers of Finance will consider options presented in the report by the Working Group on Carbon Pricing Mechanisms. Ministers of Innovation will consider options in the report from the Working Group on Clean Technology, Innovation and Jobs. A national approach to climate change and clean growth will need to bring together a coherent vision and set of measures for mitigation (including carbon pricing), adaptation, and clean growth.
In addition, many provinces and territories are currently in the process of updating their climate change plans and strategies, or have recently announced new measures. It will be important to ensure that a national approach to climate change and clean growth reinforces and complements these actions.
Furthermore, Indigenous leaders, municipalities, international partners, and other stakeholders will also have an important role going forward in shaping and implementing ambitious new climate change policies. Collective and coordinated efforts will be critical to implementing climate policies as efficiently as possible, in order to maximize benefits and mitigate potential negative impacts.

Working Group on Specific Mitigation Opportunities Final Report
84Working Group on Specific Mitigation Opportunities Final Report
85
As a next step, Ministers of the Environment, in cooperation with their colleagues, will provide an analysis of these options to First Ministers, who will meet again in the fall of 2016. While the magnitude of the climate change challenge is large, so is Canada’s capacity for innovative solutions and its commitment to progress. Collectively, the reports from the Working Groups on Carbon Pricing Mechanisms, Adaptation and Resilience, and Clean Technology, Innovation and Jobs, and this report from the Working Group on Specific Mitigation Opportunities offer a large spectrum of potential options on multiple pathways for action on climate change that would benefit both Canadians and the global community.

Working Group on Specific Mitigation Opportunities Final Report
86

Working Group on Specific Mitigation Opportunities Final Report
86Working Group on Specific Mitigation Opportunities Final Report
87
ANNEX 1: SUMMARY TABLE OF POLICY OPTIONS
Large Industrial Emitters
Policy Description Estimated Reductions in 2030 (Mt CO2e)
Estimated Cost per Tonne (tCO2e) (approximate range)
I1 Use Incentives to Promote Cogeneration
a. Enhance cogeneration by 10% nationally (where lower carbon fuels than existing grids available)
1-2 Mt $0-$50
b. Use biomass instead of natural gas as fuel (in up to 10 facilities)
<1 Mt <$0-$50
I2 Transitioning to Electrification
a. Require all new mechanical drive systems to be electric + 20% rate based incentives
3-7 Mt $100->$250
b. I2a + replace 10% of existing fuel use by electricity by 2030
11-15 Mt $100->$250
I3 Mandate or Use Incentives to Promote Energy Efficiency
a. Financial incentives (grants, tax preferences, low interest loans) to accelerate the use of energy management systems
6-9 Mt $0
b. Regulations to set emissions standards for new and/or existing facilities (5-15% improvement)
14-41 Mt $0-$50
I4 Zero Routine Flaring
a. Zero routine flaring for oil production <1 Mt N/A
b. Expand zero routine flaring to other sectors <1 Mt
c. Increase stringency of economic tests or thresholds
1-2 Mt
I5 Fuel Switching to Lower Carbon Alternatives
a. Eliminate heavy oils in combustion equipment where there is access to natural gas or alternatives
1-6 Mt $0-$50
b. Replace 5-10% of natural gas used in combustion with renewable alternatives by 2030
5-11 Mt $100-$250
c. Replace 5-10% of natural gas used as feedstock and in combustion with renewable alternatives
6-12 Mt $100-$250
d. Requirement for natural gas producers to include 5-10% renewable content in natural gas supplied to all sectors
13-26 Mt $100-$250
I6 Methane Reductions
a. 40-45% reduction from 2012 levels by 2030 (announced federal policy for 2025)
18-20 Mt $0-50

Working Group on Specific Mitigation Opportunities Final Report
88
Policy Description Estimated Reductions in 2030 (Mt CO2e)
Estimated Cost per Tonne (tCO2e) (approximate range)
I7 Additional carbon emissions reductions through abatement and sequestration (CCS and other) technology
a. Increase sequestration of carbon by 20% in industrial sectors where applicable
3-5 Mt $50-$100
I8 Limit carbon emissions through transformative changes in technology throughout the industrial sectors
a. Regulations or incentives to limit emissions to a benchmark and bring forward ambitious technologies earlier than BAU
11-29 Mt $100-$250*
* Costs are presented in standardized ranges. Costs for this policy are based on estimates in the range of $100-$150 per tonne.

Working Group on Specific Mitigation Opportunities Final Report
88Working Group on Specific Mitigation Opportunities Final Report
89
Transportation
Policy Description Estimated Reductions in 2030 (Mt CO2e)
Estimated Cost per Tonne (tCO2e) (approximate range)
T1 Passenger vehicle emission regulations and incentives
a. Zero Emission Vehicle consumer incentives 1-3 Mt
$100-$250*b. Scrappage program
c. Consumer awareness program -
d. Light duty vehicle GHG regulations for model years 2026-2030
i. Modest emissions standard of 172 g/mile in 2026 and increasing in stringency to 158 g/mile by 2030
1-2 Mt
$0-$100ii. Moderately ambitious emissions standard
of 163 g/mile in 2026 and increasing in stringency to 131 g/mile by 2030
4-5 Mt
iii. Ambitious emissions standard of 158 gCO2/mile in 2026 and increasing in stringency to 105 g/mile by 2030
6-7 Mt
e. Zero Emission Vehicle Standard
i. Beginning with 2% of the fleet in 2022 to 30% of the fleet by 2030
2-4 Mt
$0-$100ii. Beginning with 10.5% of the fleet in 2022
to 50% of the fleet by 20306-9 Mt
T2 Increased availability and use of low-carbon fuel for on-road and off-road vehicles
a. Increase renewable fuel requirements10-20 Mt
$0-$50
b. Low Carbon Fuel Standard $0-$50
c. Truck engine compatibility with low carbon fuels
N/A N/A
d. Truck engine rebate
e. Transit vehicle compatibility with low carbon fuels
f. Transit electrification
g. Fuelling infrastructure
h. Domestic production of low carbon fuels
T3 Energy efficiency in the aviation, rail, marine and off-road industrial sectors
a. Aviation offsets:
i. 30% of domestic aviation emissions 2-3 Mt $0-$50
ii. 70% of domestic aviation emissions 6 Mt $0-$50
iii. 100% of domestic aviation emissions 8 Mt $0-$50
b. Regulations, programs and incentives for the following sectors:
i. Off road 1-7 Mt $0-$100

Working Group on Specific Mitigation Opportunities Final Report
90
Policy Description Estimated Reductions in 2030 (Mt CO2e)
Estimated Cost per Tonne (tCO2e) (approximate range)
ii. Marine and rail 0-2 Mt $0-$250
T4 Heavy duty vehicle and engine emission regulations and incentives
a. Post-2018 HDV GHG regulations 3-6 Mt < $0
b. Incentives for retrofits on in-use HDVs
1-3 Mt
$100->$250*
c. Regulations requiring GHG-reducing technologies for in-use HDVs
$50-$100
d. Scrappage of older HDVs > $250
e. Revise weight and dimension regulations 2-3 Mt <$0
f. Require truck stop electrification $0-$100
g. Funding for electrified truck highway pilot projects
<1 Mt >$250
T5 Vehicle and engine fuel efficiency in the aviation, marine, rail and off-road sectors
a. Regulations for new vehicles/equipment1-3 Mt
$0-$250
b. Voluntary aviation commitment N/A
c. Funding/incentives for retrofits 1-2 Mt $0-$250
d. Regulations for in-use vehicles/equipment 2-3 Mt $0->$250
T6 Fuel Efficiency of on-road vehicles
a. Increased speed enforcement 2-4 Mt $0-$50
b. Regulation requiring truck speed limiters 0-1 Mt $0-$50
c. Outreach and education programs <1 Mt $0-$50
d. Funding program for ITS deployment <1 Mt >$250
e. Funding program to increase paved roadways 0-1 Mt $100-$250
T7 Freight efficiency
a. Incentives for freight logistics and supply chain efficiencies
0-2 Mt<$0
b. Funding to support modal shift 1-2 Mt >$250
c. Pricing - heavy goods vehicle per kilometre charge
0-1 Mt$0-$100
T8 Changing transportation usage patterns
a. Shift vehicle passengers to public transit and active transportation:
i. Funding for public transit 0-1 Mt
$100-$250ii. Funding for active transportation <1 Mt
iii. Urban planning strategies N/A
b. Reduce vehicle-kilometres travelled:

Working Group on Specific Mitigation Opportunities Final Report
90Working Group on Specific Mitigation Opportunities Final Report
91
Policy Description Estimated Reductions in 2030 (Mt CO2e)
Estimated Cost per Tonne (tCO2e) (approximate range)
i. HOV and HOT lanes
1-2 Mt
>$250
ii. Incentives for car sharing <$0
iii. Employer TDM <$0
c. Funding for high frequency/performance rail <1 Mt >$250
T9 Reducing congestion and vehicle-kilometres travelled
a. Road use pricing based on vehicle kilometres travelled 1-2 Mt
<$0
b. Pay-as-you-drive (PAYD) insurance policies <$0
c. Congestion pricing in 3-6 of Canada’s largest cities
<1 Mt <$0
d. Variable vehicle registration pricing
<1 Mt
$0-$100
e. Variable vehicle excise taxation based on vehicles emissions rating
$0-$100
f. Financial incentives to accelerate fleet turnover $50-$100**
T10 Increased availability and use of low-carbon fuel in the domestic marine, rail and aviation sectors
a. Low Carbon Fuel Standard for marine and rail 1-2 Mt $100-$250
b. Low Carbon Fuel Framework for aviation <1 Mt $100-$250
* Costs are presented in standardized ranges. Costs for this policy are based on estimates in the range of $150-$250 per tonne.
** Costs are presented in standardized ranges. Costs for this policy are based on estimates in the range of $50-$150 per tonne.

Working Group on Specific Mitigation Opportunities Final Report
92
Built Environment
Policy Description Estimated Reductions in 2030 (Mt CO2e)
Estimated Cost per Tonne (tCO2e) (approximate range)*
B1 Net- Zero Ready Codes For New Housing
a. Net-zero ready implemented by 2030 (~40% lower than 2012 model code on average; varies by climate zone)
4 MtElect: <$0
Natural Gas: >$250 Oil: $0-50
b. Net-zero ready implemented by 20255 Mt (includes B1a)
Elect: <$0 Natural Gas: >$250
Oil: $50-$100
B2 Existing Housing
a. Financial incentive to reduce low rise housing energy use 1.5% via voluntary shallow retrofits to 1 million homes
1 MtElec/Oil: < $0
Nat Gas: $50-100
b. Regulation/financial incentive to reduce energy use by 4% via voluntary deep retrofit of 1 million homes
2 MtElec: $0
Oil: $0-$50 Nat. Gas: > $250
c. Regulation/loan program to reduce energy use by 10% by requiring moderate retrofits at time of home sale or permit application
6 MtElec/Oil: < $0
Nat. Gas: $100-250
B3 Net-Zero Ready Codes For New Commercial-Institutional Buildings
a. Building codes reach net-zero ready by 2035 (65% average improvement from 2015 energy code, exact percentage varies by climate zone)
4 Mt Gas/Elec.: $100-250
Oil/Elec.: $0-50 Elec.: <$0/tb. Building codes reach net-zero ready by 2030 5 Mt (includes B3a)
c. Building codes reach net-zero ready by 2025 5 Mt (includes B3b)
B4 Existing Commercial-Institutional Buildings
a. Financial Incentives/Information Programs to reduce energy use by 2%
<1 Mt < $0
b. Reduce energy use by 3% through measures in Ambition A and energy disclosure regulations
<1 Mt (includes B4a) < $0
c. Reduce energy use by 17% through measures in Ambition B, $750M in financial incentives and regulations requiring retrofits
6 Mt (includes B4b) < $0
B5 Equipment Efficiency
a. Increase minimum standards and labelling (EnerGuide and ENERGY STAR®) for up to 10 categories of space and water heating equipment beyond U.S. levels,, supported by 8 years of market transformation initiatives (e.g. incentives)
6 Mt (includes 4 Mt from announced
federal action)
Varies by category In 2016: < $0 to $100-250 By implementation: <$0***

Working Group on Specific Mitigation Opportunities Final Report
92Working Group on Specific Mitigation Opportunities Final Report
93
Policy Description Estimated Reductions in 2030 (Mt CO2e)
Estimated Cost per Tonne (tCO2e) (approximate range)*
b. Increase minimum standards for additional product categories, such as home appliances, consumer electronics and lighting beyond U.S. levels; and set standards for product categories that are not yet regulated in Canada or the U.S. at the national level, supported by 8 years of market transformation initiatives (e.g. incentives).
1 Mt Varies by category
In 2016: < $0 to $100-250 By implementation: <$0***
c. Regulations to phase-out residential space and water heating equipment (such as high efficiency furnaces) that is less efficient than heat pump technology, supported by 8 years of market transformation initiatives (e.g. incentives).
<1 Mt**In 2016: Oil to HP: < $0, Nat Gas to HP: >$250
By implementation: <$0***
B6 Renewable Power and Fuel Switching
a. Incentive or loan programs for 1 million 5 kW solar photovoltaic systems
<1 Mt > $250
b. Incentive or loan programs to reduce 5 Mt of GHG emissions by fuel switching space and water heating from oil/natural gas to less GHG intensive alternatives.
5 MtOil to Elec: < $0
Nat Gas to Elec: >$250
B7 Demand Response Opportunities and Behaviour Change
a. Regulations requiring utilities to offer enhanced billing, to reduce energy use in the residential sector by 2%
1 Mt <$0
b. Regulations and incentives to reduce peak electricity demand by 1-2% through time of use rates or by providing utilities control over household thermostat settings
1 Mt <$0
c. Financial incentive/rebate to reduce overall energy use of the residential sector by 0.75% - 1% by installing adaptive thermostats in 1 million existing households
<1 Mt <$0
B8 Urban Form and Spatial Planning
a. Reduce transportation-related and heating-related GHG emissions in municipalities through smart growth oriented development patterns
N/A N/A
b. Reduce overall urban emissions through tree planting, green roofs and permeable surfaces
N/A N/A
* Costs per tonne for retrofit programs may overstate actual costs as costs are lower for older and inefficient buildings. In some cases costs are negative (<$0/t) even for natural gas-fuelled buildings.
** Note that reductions for B5/Option C are relatively low in 2030 because implementation begins in 2028, but will become much more significant in the longer term, e.g., 2050
*** Cost by implementation date for all measures anticipated to be <$0/t due to long ramp-up period, market transformation initiatives and technological improvements

Working Group on Specific Mitigation Opportunities Final Report
94
Electricity Generation and Transmission
Policy Description Estimated Reductions in 2030 (Mt CO2e)
Estimated Cost per Tonne (tCO2e) (approximate range)*
E1 Emissions intensity performance standard
a. For all large fossil fuel-fired electricity generating units, set at level of highly efficient combined cycle natural gas (365 tCO2e/GWh, with compliance flexibilities)
Compliance credits: $25/ tonne: 9 Mt
$0-$50
$50/ tonne: 14 Mt $0-$50
$75/ tonne: 20 Mt $50-$100
b. For all large fossil fuel-fired electricity generating units, set at a level of 300 tCO2e/GWh in 2020, increasing in stringency to 250 tCO2e/GWh in 2025 with compliance flexibilities
Compliance credits: $25/ tonne: 11 Mt
$0-$50
$50/ tonne: 15 Mt $0-$50
$75/ tonne: 21 Mt $50-$100
c. For all large coal- and for natural gas (NG)-fired units that operate as baseload starting in 2030, set at a level of 250 tCO2e /GWh for coal-fired units and 375 tCO2e /GWh for natural gas-fired units. No flexibilities.
15-20 Mt $50-$100**
E2 Accelerated phase-out of unabated coal-fired electricity
Phase-out of unabated coal-fired units by 2030 15 Mt $50-$100**
E3 Non-Emitting Portfolio Standard
a. The lesser of 90% non-emitting supply in 2030 or a 20 percentage point increase from the 2014 portion of non-emitting supply by 2030.
8 Mt $50-$100
b. The lesser of 97% non-emitting supply in 2030 or a 30 percentage point increase from the 2014 portion of non-emitting supply by 2030.
15 Mt $50-$100
E4 Financial Support for New NonEmitting Electricity Generating Facilities
a. Construction of 30 TWh of new, non-emitting generation
13 Mt $50-$100
b. Construction of 45TWh of new, non-emitting generation
19 Mt $50-$100
E5 Targeted Financial Incentives for Non-Emitting Generation in Northern and Remote Communities
a. Support the construction of new non-emitting electricity generating capacity in remote communities in order to generate about 0.3 TWh to displace diesel-fueled electricity (20% reduction in total remote community electricity related emissions)
<1 Mt $100-$>250
b. Support the construction of new non-emitting electricity generating capacity in remote communities in order to achieve a 50% reduction in diesel used for heating and electricity in about 140 remote and northern, First Nations and other Indigenous communities
<1 Mt $100-$>250

Working Group on Specific Mitigation Opportunities Final Report
94Working Group on Specific Mitigation Opportunities Final Report
95
Policy Description Estimated Reductions in 2030 (Mt CO2e)
Estimated Cost per Tonne (tCO2e) (approximate range)*
E6 Increase interjurisdictional transfers of non-emitting electricity
a. Increase use of existing capacity Up to 6 Mt $0-50 (site-specific example)
b. Increase existing relevant intertie capacities by the greater of 500 MW or 25%
Up to 10 Mt (incremental to A)
$50-$100 (site-specific example)
c. Add new transmission capacities (up to 500 MW, as appropriate) where none currently exist
<1 Mt $50-$100 (site-specific example)
* Note that cost estimates in the electricity sector are based on conservative assumptions, and may decline as renewable energy technologies continue to improve and the challenges to ensure electric reliability in a changing resource mix are identified and addressed.
** Nova Scotia has estimated the costs of options E1c and E2 at $>250/t for their jurisdiction.

Working Group on Specific Mitigation Opportunities Final Report
96
Agriculture
Policy Description Estimated Reductions in 2030 (Mt CO2e)
Estimated Cost per Tonne (tCO2e) (approximate range)
A1 Reduction of Methane Emissions from Cattle
a. 10% adoption of feeding oils/ oilseeds (6-7% of dry matter intake)
<1 Mt $50-$100
b. 30% adoption of feeding oils/ oilseeds (6-7% of dry matter intake)
<1 Mt $50-$100
c. 10% adoption of reduced age at harvest by 60 days
<1 Mt $0-$50
d. 30% adoption of reduced age at harvest by 60 days
1-2 Mt $0-$50
A2 Convert Marginal Land From Annual Crop Land to Permanent Cover
a.
Increase percentage of annually cropped marginal land (class 5 and 6) converted to permanent cover crops by 5% between 2017-2021
<1 Mt $0-$50
b. Increase percentage of annually cropped marginal land (class 4, 5 and 6) converted to permanent cover crops by 5% between 2017-2021
<1 Mt $0-$50
A3 Increase Acres of Nitrogen Fixing Crops, Pulses/Forages in Rotation
a. Increase soybean acres in Canada from 5.3 M acres (est.)in 2016 to 8 M acres in 2030
<1 Mt $0-$50
b. Increase pulse acres in Canada from 9.7 M acres (est.) in 2016 to 11.3 M acres in 2030
<1 Mt $0-$50
c. Increase perennial legume forage acres in Canada by 3% from 2016 to 2030
<1 Mt $0-$100
d. Increase legume cover crops from low levels in 2016 to 10% of land growing crops by 2030
<1 Mt $50-$100
e. Increase legume intercrops from non-significant in 2016 to 5% of canola acres in 2030
<1 Mt $50-$100
A4 Increase Adoption of Zero Till
a By 20-26% (jurisdiction-specific) <1 – 1 Mt $0-$50
b By 10-16 % (jurisdiction-specific) <1 Mt $0-$50
A5 Capture and Destroy/ Treat Methane from Manure Storage Systems
a. Biofilter/catalytic oxidation, covering up to 2 % of manure storage systems in Canada by 2030
<1 Mt >$250
b. Anaerobic digestion, covering up to 2 % of manure storage systems in Canada by 2030
<1 Mt >$250
c. Biofilter/catalytic oxidation, covering up to 5 % of manure storage systems in Canada by 2030
<1 Mt >$250

Working Group on Specific Mitigation Opportunities Final Report
96Working Group on Specific Mitigation Opportunities Final Report
97
Policy Description Estimated Reductions in 2030 (Mt CO2e)
Estimated Cost per Tonne (tCO2e) (approximate range)
d. Anaerobic digestion, covering up to 5 % of manure storage systems in Canada by 2030
<1 Mt >$250
A6 Increase Total Crop Area using Precision Application Methods for Nitrogen Fertilizers
a. Financial incentive of $20/tonne of CO2e <1 Mt $0-$50
b. Financial incentive of $40/tonne of CO2e <1 Mt $0-$50
c. Financial incentive of $100/tonne of CO2e 1 Mt $50-$100

Working Group on Specific Mitigation Opportunities Final Report
98
Forestry
Policy Description Estimated Reductions in 2030 (Mt CO2e)
Estimated Cost per Tonne (tCO2e) (approximate range)
F1 Increase Domestic Wood Use in Building Products
a. High-uptake of wood-intensive building designs and proposed building code changes
2 Mt $0-$50
b. Low-uptake of wood-intensive building designs and proposed building code changes
<1 Mt $0-$50
F2 New Forest Program*
a. One billion tree planting program focused on mitigation in 2030 with a mix of tree species including a large proportion of fast-growing species
4-7 Mt $0-$50
b. One billion tree planting program that serves a range of goals including long-term mitigation and ecological co-benefits by using traditional slower-growing species
1-2 Mt $0-$50
c. 250 million tree planting focused on mitigation in 2030 with a mix of tree species including a large proportion of fast-growing species
1-2 Mt $0-$50
F3 Increased Forest Rehabilitation*
a. Support rehabilitation of about 4 million hectares of Crown lands affected by natural disturbances where such efforts are not currently required
<1 Mt $50-100
b. Support rehabilitation of about 1.1 million hectares of Crown lands affected by natural disturbance where such efforts are not currently required
<1 Mt $50-100
F4 Change in Forest Management Practices*
a. Regionally-appropriate changes to forest management
8-10 Mt $0-50
* Mitigation benefits continue to grow after 2030 as a result of initial investments (for example, because trees continue to grow).

Working Group on Specific Mitigation Opportunities Final Report
98Working Group on Specific Mitigation Opportunities Final Report
99
Waste
Policy Description Estimated Reductions in 2030 (Mt CO2e)
Estimated Cost per Tonne (tCO2e) (approximate range)
W1 Landfill Gas Capture and Utilization
a. Mandate capture: 57% of all LFG is captured and flared or utilized by 2030
2-3 Mt $0-$50
b. Incentives for utilization: 57% of all LFG is captured and 33% is utilized by 2030
2-3 Mt $0-$50
W2 Reduce Avoidable Food Waste
a. 50% by 2030 10 to 15 Mt (life cycle) <$0
W3 Diversion of Organics
a. To >20% by 2030 1 to 3 Mt (life cycle) $0-$50
b. To >25% by 2030 1 to 4 Mt (life cycle) $0-$50
W4 Diversion of Recyclable Materials
a. To 13% by 2030 2 to 4 Mt (life cycle) $0-$50
b. To 20% by 2030 2 to 4 Mt (life cycle) $0-$50
c. To 35% by 2030 14 to 16 Mt (life cycle) $0-$50
Government Operations
Policy Description Estimated Reductions in 2030 (Mt CO2e)
Estimated Cost per Tonne (tCO2e) (approximate range)
G1 Carbon neutral government
a. “Low carbon” government with targeted GHG reductions
1-2 Mt $0-$50
b. Carbon neutral with targeted GHG reductions 4-5 Mt $0-$50
c. Carbon neutral with best efforts reductions 4-5 Mt $0-$50

Working Group on Specific Mitigation Opportunities Final Report
100
ANNEX 2: POLICY OPTION PROFILES
Large Industrial Emitters
I1. Use Incentives to Promote Cogeneration
POLICY GOAL: Use cogeneration (combined production of heating/cooling and electrical power) to reduce GHG emissions in the industrial and electricity sectors using the lowest carbon fuel sources available in an economically achievable manner.
POLICY TOOL: Direct incentives and/or enhanced tax incentives for industrial facilities.
Policy Details• A direct incentive and/or enhanced tax support would be available to industrial facilities to partially offset
start-up and capital costs related to the installation of cogeneration units and transmission infrastructure. To be eligible, a proposed project would need to meet criteria demonstrating GHG reductions as compared to the use of grid electricity and facility process steam. These demonstrated reductions could include reductions in the industrial and electricity sectors as compared to a base case.
• Incentives to offset operating costs would be available to promote the use of biomass and lower carbon fuels (as compared to natural gas). Project proponents would be required to demonstrate GHG reductions as compared to the use of natural gas (NG).
• These incentives would be available immediately for a specified 10 year period (2018-2028) to allow for investment planning.
Options Est. reductions in 2030 Est. cost/tonne
A. Enhance the use of cogeneration in industrial sectors by 10% nationally (where lower carbon fuels than existing grids are available)
1-2 Mt*$0-$50
B. Use biomass instead of NG in up to 10 facilities < 1 Mt <$0-$50
* Note that these estimates depend heavily on assumptions regarding the future composition and structure of the electric grid. The upper end of this estimate includes reductions from the electric grid, assuming a “business as usual” grid composition, i.e., only considering policies currently in place. This means that some of the existing grid would be displaced. Note that reductions are due not only to efficiency gains, but also lower carbon-intensive fuels (i.e., moving from coal to natural gas and biomass).
Note: options A and B are separate policies; GHG reductions from one would be incremental to the other.
ECONOMIC AND CONSUMER IMPACTS• Saving on operating costs related to electricity purchase could be achieved if the cogeneration project
replaces a less efficient system and fuel savings are also achieved.
CONSIDERATIONSStakeholder perspectives: The development of government incentives to promote cogeneration using biomass and biomass-driven fuels, from waste streams, would provide a predictable environment for investments and deliver GHG reductions.
Co-benefits/negative impacts:• Supports the electricity sector by providing local generation source that enhances the grid reliability. This is
because cogeneration assists the electrical grid by providing distributed power and more stability in system voltage and frequency. These factors provide more resilience to electrical outages for electrical consumers.

Working Group on Specific Mitigation Opportunities Final Report
100Working Group on Specific Mitigation Opportunities Final Report
101
• With modern technology, combining the production of heat and power in one process is 40%59 more fuel-efficient than providing that heat and power separately.
• Depending on the technology and fuel used, reduction of air pollutants, such as NOx and SOx through the reduction in combustion overall and of higher hydrocarbon fuels.
• Control of air pollutant on larger heat and power unit is more efficient and cost effective than control of air pollutant of many small separate heat and power units.
Linkages with other working group areas and other proposed policies: • This policy would benefit from the fuel switching policy (I5) in that NG fueled facilities would see
reductions as a result of use of renewable natural gas content required. • Cogeneration also exists in the electricity sector. This policy should ensure that it does not favor
cogeneration in any particular sector. Alignment with policies developed for the utility sector should be considered as utility rates may incent/de-incent cogeneration.
• Carbon pricing could also incent the use of cogeneration if fossil fuel prices increase and facilities are able to achieve cost savings through use of cogeneration.
Regional impacts including northern and remote communities:• This initiative could be regionally focused to reflect the relative benefit or dis-benefit of cogenerated
electricity relative to grid alternatives.• This policy would apply best to jurisdictions with a carbon-intensive grid. It may be less useful to jurisdictions
that wish to further electrify using clean hydro-electricity instead of cogeneration, such as BC or QC.
Implementation, feasibility, technological and enabling infrastructure issues:• Cogeneration facilities, given the right financial incentives, can be attractive as investments to both the
manufacturing and utility companies. This policy does not cover incentives for utility companies, but could be expanded to address this.
• Waste wood biomass, RNG, biogas are examples of renewable fuels that can be used to power cogeneration units furthering the carbon reductions.
• Some sectors like the Forest Products or O&G sectors already operate with significant cogeneration thermal capacity, so the opportunities for growth are limited.
• Barriers to implementation of cogeneration, which is already commercially available include:
» grid access and transmission tariffs » price differential between low-cost electricity and incentive to produce power with cogeneration » lack of integrated heating/cooling infrastructure » lack of information, skilled personnel and financial incentives » purchase agreements » administrative burden to get permits » competition for capital » lack of feed-in tariff arrangements
• The decision to implement cogeneration is also defined by the facility needs. Even without the listed barriers, cogeneration may not always be the right choice for every facility. Additional incentives such as feed-in tariffs or financial incentives (grants, tax preferences, low interest loans) may tip the investment decision towards cogeneration.
• R&D is needed to support the development of codes, standards and guidelines for the biomass fuel supply, to optimize technologies and procedures for the storage, handling and pre-treatment of biomass, and to optimize biomass conversion technologies.
59 www.cogeneurope.eu/what-is-cogeneration_19.html

Working Group on Specific Mitigation Opportunities Final Report
102
• There is a need for demonstrations of an integrated feedstock supply with advanced biofuel production for cogeneration by large industry.
• Siting is important for cogeneration as heat is useful only over short distance. Siting is further constrained if solid biomass is desired as fuel as transport of this fuel is expensive.
• Advanced forms of cogeneration such as fuel cells which allow for water recovery or technologies more aligned with carbon capture could be considered. There are a few projects under the Climate Change and Emissions Management Corporation in development.
• This policy should be coordinated with electricity sector policies to ensure overall emission reductions. For example, the requirement that cogeneration demonstrate emission reductions compared to grid-delivered power should incorporate electricity sector policies that will reduce emissions from the grid.
I2. Transitioning to Electrification
POLICY GOAL: Within large industrial facilities, replace fuel with electricity use where technologically practical
POLICY TOOLS: i. Regulations requiring the use of electrical drive systems for new equipment only or for new and existing
equipment. ii. Rate based incentives for industrial facilities to access grid electricity.
Policy Detailsi. Regulations on large industrial facilities requiring that new or new and existing drives be powered by
electricity rather than fossil fuels. Equipment such as steam engines, steam turbines, reciprocating engines, and gas turbines that use fossil fuels would be subject to the regulations. » Heating and steam making equipment would be excluded » Other exemptions would require careful design to avoid developing requirements for regions or facilities
where technology is unproven or electricity supply is unavailable or not cost effective to access or has greater emission intensity than direct fossil fuel use.
ii. Electrical rate rebates for industrial users would be available nationally to partially offset costs to industry.
Options Est. reductions in 2030 Est. cost/tonne
A. i. Require all new drives be electrical instead of fossil fuel powered. Heating and steam making equipment would be excluded. ii. Achieved through implementation of a rate-based incentive program to offset electrical costs for large industry.
3-7 Mt1 $100->$2502
B. i. Replace a portion of existing mechanical drives with electric drives. Modelling assumes that 10% of existing fuel use would be displaced. Reductions are scalable with % of fuel displacement. ii. Costs would be partially offset through reduced electricity rates.
11-15 Mt $100->$2503
1. The reduction calculations are based on the assumption made by CIEEDAC (Canadian Industrial End-use Energy Data and Analysis Centre) regarding use of natural gas within the Canadian industrial sector (ref: www2.cieedac.sfu.ca/mwg-internal/de5fs23hu73ds/progress?id=NynAvN7JW8UbUzEpOg7F32bJ30UP71fGfW3rw7vTN7g)
2. Costs vary considerably across jurisdictions due to differences in emissions from electricity production. In jurisdictions with higher percentages of non-emitting generation, costs are estimated to be in the range of $100-$150/tonne; in jurisdictions with higher intensity electricity generation emissions, costs could be greater than $250/tonne. Costs per tonne are higher in jurisdictions with higher intensity electricity generation emissions due to lower greenhouse gas reductions. This is because fuel use reductions within the industrial facility are offset by fuel used in the generation of grid electricity.
3. Ibid.

Working Group on Specific Mitigation Opportunities Final Report
102Working Group on Specific Mitigation Opportunities Final Report
103
CONSIDERATIONS• For level of Ambition A - Modelling does not include capital stock turnover, only new facilities, therefore
reductions modelled are conservative.• It is assumed that for new builds 15% of fossil fuel use would be displaced by electrical drive use. The
15% displacement is based on CIEDAAC documentation and expertise that consider consumption of direct drives, using turbines or internal combustion engines, to move, compress or liquefy natural gas and other process liquids and gases.
• Also, 75% of emissions from projected LNG export production in BC, which is approximately one large facility, would be displaced. Without the addition of the LNG facility the reductions would be the lower bound of the estimates – 3MT. Should additional LNG facilities come online reductions could exceed the upper bound of 7MT.
• For level of Ambition B, it is assumed that 10% of fossil fuel used for existing growth would be displaced by electricity.
• Emissions from the grid consistent with the Canada’s 2nd Biennial Report were included in the emissions reduction modelling.
ECONOMIC AND CONSUMER IMPACTS• Stimulate demand for electricity as well as construction of electrical transmission and delivery systems
to supply the additional electricity demand • Additional generation capacity in the utility systems, in the form of hydro and renewables or nuclear, over
and above the regular plans, may be required, resulting in higher electricity costs for all ratepayers.
REGIONAL CONSIDERATIONS/IMPACTS • BC’s experience has shown that in the upstream oil and gas industry a rate based incentive of at least 25%
is required to enable electrification as a viable approach.• Except for cases where facilities may generate their own low carbon electricity for use in their facilities, the
GHG reductions are dependent on the GHG intensity of the grid, including imports from other jurisdictions (other provinces, US). Sufficient generation of low carbon electricity across all provincial/territorial grids combined with increased grid access to some locations would be required.
For some provinces, this policy option will only realize benefits over the long term as regional electricity generation is decarbonized.
Implementation, feasibility, technological and enabling infrastructure issues:• 15% of fuel used within large industry supports the operation of mechanical drives and could potentially
be replaced with electricity. In some instances electrical drives have a higher efficiency than steam driven drives.
• Utility level transmission and delivery system extensions in the form of upgraded power lines and newer electrical substations to feed the electrified loads in the industry will likely be required. These technologies are readily available. The scope and cost of the build out will be far greater in remote oil and gas fields where the electrical system may not be present
• New electricity projects and transmission lines often have long lead times and high costs.• Enhanced electrification promotes standard and unified automation and optimization of facilities.
This provides an improved platform for energy efficiency programs further improving competitiveness of large industry.
• Some facilities may require additional infrastructure (capital investment) to support new electrical equipment.
• This policy option could be implemented incrementally to the fuel switching policy option (I5). This is because this policy is limited to drive systems and 15% of fuel used within large industry.
• To provide flexibility to the industry allowance may be made for the industry to electrify load equipment at the time of capital turnover (end of life) rather than a specified time.

Working Group on Specific Mitigation Opportunities Final Report
104
• Further investigation will be required to determine the degree of electrification possible for each industrial sector and availability of clean or lower carbon electricity from the grid.
• This policy option presently includes electrification of new natural gas-fueled compressors used in natural gas pipelines. While this presents a significant potential greenhouse gas emission reduction, the remoteness and isolated nature of these compressors may constrain their electrification. Where sources of electricity are reasonably close to the compressors, electrification may be an attractive option.
• Existing electrical distribution equipment in the industry may require upgrades to higher power handling capacity in order to meet the feed to large electrical drives
I3. Mandate or Use Incentives to Promote Energy Efficiency
POLICY GOAL: Enhance energy efficiency of large industry beyond a BAU 1% per year improvement
POLICY TOOLS: A. Accelerate use of recognized energy management systems, such as ISO 50001, Superior Energy
Performance and ENERGY STAR for Industry through targeted direct incentives or tax measuresB. Regulations to set emission and energy standards for new only or new and existing facilities through facility
specific greenhouse gas emission and energy baselining approaches tied to energy management
Policy details• Energy management systems would include the setting of facility-specific emission and energy standards
either through voluntary or regulatory means. Implementation may require that each facility: » Conduct a review (analyze energy data, identify areas of significant energy use and identify areas
for energy performance improvement) » Establish emissions and energy baseline, to set objectives and targets that are measurable and have
timelines for achievement » Establish and implement an action plan to achieve the objectives and targets » Monitor and assess energy and GHG performance » Third party verification of assessment
Options Estimated reductions in 2030 Estimated cost/tonne
A. Voluntary measures (financial incentives such as grants, tax preferences, low interest loans)
6-9 Mt* $0
B. Regulations to set emissions standards for new and/or existing facilities (5-15% improvement)
14-41 Mt $0-$50
Note: emission reductions are additional to a business-as-usual improvement of 1% per year.
* NRCan estimates and report “Process Integration Incentive Program: Results and Impacts 2004-2013”
ECONOMIC AND CONSUMER IMPACTS• Energy management systems can generate financial savings. Case studies demonstrate that facilities
can save up to 20% in energy costs in the first four years after implementing ISO 50001.• Energy and fuel savings will reduce operational costs and pay for capital investments over time, leading
to increased profits for businesses and/or savings for consumers.• Implementation costs are expected to rise for individual businesses once the low or no-cost actions are
taken. Early actors may face higher costs. There is evidence that overall implementation costs drop as the number of implementations rises.
• Energy efficiency measures could contribute to increased GDP and increased employment due to the need for private sector services to implement energy efficiency projects.
• If facilities need to increase their costs in order to meet the energy efficiency standards, there might be additional costs carried forward to the consumer.

Working Group on Specific Mitigation Opportunities Final Report
104Working Group on Specific Mitigation Opportunities Final Report
105
• Flexibility mechanisms may be needed to manage impacts of equipment replacement. This should include consideration for early actors to limit the risk of having requirements to replace new equipment/capital stock. Preferential tax treatment currently exists (Accelerated Capital Cost Allowance) to help offset this, but consideration could be given to providing further relief.
CONSIDERATIONS
Co-Benefits: • With less energy consumed, it is expected that air pollutant emissions would be reduced.• Potential for increased energy security• Potential for competitive advantage locally / internationally
Regional Impacts, including in Northern and remote communities: • Some jurisdictions already have carbon price policies. The new policy tools would need to be integrated
with current regulations to avoid duplication or increased administrative burden.• The cost to deliver the program would be higher in remote/small communities. • Additional considerations in northern jurisdictions include the higher energy demands due to climate.
Interaction with other working group areas and other proposed policies: • A carbon price could incent some efficiency at industrial facilities (e.g. a low carbon price could incent
project with low overall cost). This could also be an opportunity to integrate with district heat/power and encourage heat and steam exchange between facilities for an overall energy reduction. Cogeneration and industry parks could facilitate this. Regulation and Energy management results are not cumulative; these are two methods that can lead to reduced energy consumption.
• This policy GHG reduction could overlap with other policies such as fuel switching, electrification, transformative technologies.
• Jurisdictions with a carbon price are already incenting energy efficiency, incrementally, with expected improvements of 5 – 15% over the next 10 years. Improvement may vary by jurisdictions, because of infrastructure needs, no easy access to NG, higher capital cost (remote location), early actors, etc.
Implementation, feasibility, technological and enabling infrastructure issues:• Recognized energy management systems, such as ISO 50001, Superior Energy Performance and ENERGY
STAR for Industry are available: » ENERGY STAR provides a fundamental approach for developing a systematic energy management
program based upon industry best practices and benchmarking tools. » ISO 50001 is an internationally-recognized energy management systems standard that provides a
rigorous framework for an organization to develop its energy management system and commitment to continuous improvement.
» Superior Energy Performance (SEP) builds on the requirements of the ISO 50001 standard by setting energy performance improvement targets and requiring third-party verification of results
• It is expected that energy management systems can drive incremental GHG reduction: » EnMS (1% - 2% energy savings/yr) » ISO 50001 (2% - 4% energy savings/yr) » Superior Energy Performance (4% - 8% energy savings/yr)
• Consider exclusion and/or adjustment in the intensity of reduction accordingly to the potential of reducing emission years after years
• Best Available Technology (BAT) equipment may be more expensive than current equipment• R&D support should be considered to provide more opportunities of improvement. R&D can help inform
codes, standards and regulations. • Complementary programs could support capacity and knowledge building, international standards
development and improved collaboration between federal, provincial, territorial and municipal governments, industry associations, and utilities.

Working Group on Specific Mitigation Opportunities Final Report
106
I4. Zero Routine Flaring
POLICY GOAL: Limit on routine flaring from oil and gas facilities, petroleum refineries and chemical plants
POLICY TOOL: Regulation
Policy DetailsImplement and build on the federal government’s recent endorsement of the World Bank’s Zero Routine Flaring by 2030 Initiative for oil production facilities, for reductions relative to BAU in 2030 in routine flaring at new and existing oil and gas facilities, petroleum refineries and chemical and fertilizer plants.
• The policy would be enacted through regulations that ban routine flaring, except in prescribed circumstances (e.g., safety or emergency reasons or where the quality or quantity of gas is inconsistent and extraordinary efforts are required to make it marketable and could include an economic test). An exempted facility would be allowed to continue to routinely flare waste gases, subject to other regulations and requirements.
• For new facilities, the regulation would start two years after the policy is approved (to allow for changes in design and the project application process), while for existing facilities it would start five years later (to allow for the design and installation of new equipment).
• A key design consideration would be the definition of an isolated or remote facility; this definition would be tightened in stages.
• At least three provinces include an economic test (based on net present value) when determining whether gas must be conserved at oil production facilities (i.e., costs less than $50,000 in B.C. and Saskatchewan, or $55,000 in Alberta to conserve gas).
• Incentives could also be considered for the development of new technology, the purchase of capital equipment, and the development of infrastructure (e.g., gas-gathering pipelines to collect and transport the gas).
• Regulations limiting flaring would have to be carefully coordinated with policies on venting, such as the methane option in this report (I6) since regulating venting can result in increased flaring and vice versa.
A. Option A would implement zero routine flaring at new and existing oil production facilities.B. Option B would expand the ban on routine flaring to new and existing natural gas facilities, petroleum
refineries and chemical and fertilizer plants.C. Option C would increase the stringency of these economic tests or reduce the volume threshold above which
facilities would be required to conserve their produced gas. This could be done in stages from 2020 to 2030.
Options Est. reductions in 2030 Est. cost/tonne
A. Implement Zero Routine Flaring for oil production
<1 Mt
N/A*B. Expand Zero Routine Flaring to other sectors <1 Mt
C. Further reduce flaring through more stringent measures
1-2 Mt
Note: Reductions estimated for levels of ambition A-C are cumulative (i.e., B includes A, and C includes B).
* A study on costs is needed. Cost will depend on which facilities are excluded from the requirements due to their isolation, gas consistency or other factors. Definitions of what is an “isolated facility” and what is “non-routine” flaring will also be important, and could significantly affect final costs. Alberta estimates that costs could range from $100-250 per tonne for policy option (a); $250-500 per tonne for policy option (b), and $500-1000 per tonne for policy option (c). BC estimates that lowering the economic threshold or expanding the definition of routine flaring would likely result in significant cost increases. Newfoundland noted that in a 2010 report, the preliminary costs for its offshore facilities were estimated to be in excess of $300 per tonne.

Working Group on Specific Mitigation Opportunities Final Report
106Working Group on Specific Mitigation Opportunities Final Report
107
ECONOMIC AND CONSUMER IMPACTS• More captured natural gas available for sale in situations where the natural gas can be sold, and for use
on-site (displacing other energy use or for use in enhanced oil recovery).• More royalties for provinces in situations where the captured natural gas can be sold.• It is likely very costly to totally eliminate routine flaring at isolated facilities, and as a consequence there
could be stranded resources if the regulation applies to such facilities and the operator decides not to develop further reserves at the isolated site.
CONSIDERATIONS
Co-benefits/negative impacts:• Limiting or banning routine flaring would reduce air pollution and hence improve the health of people
in nearby communities • Reducing flaring will reduce emissions of black carbon and other air pollutants.• Additional network of gathering and transport pipelines could fragment wildlife habitat.
Linkages with other working group areas and other proposed policies: • There are international efforts to achieve zero routine flaring from oil production operations under the World
Bank’s Zero Routine Flaring by 2030 Initiative. The federal government formally endorsed this initiative in April 2016.
• A price on carbon could help to reduce flaring emissions if applied to these emissions, but if there is a desire to ensure zero routine flaring and to reduce black carbon from flaring, targeted regulations would ensure the desired outcome. Increases in the stringency of the economic tests that are currently being applied would reduce routine flaring.
Regional impacts including northern and remote communities:• Alberta will apply a carbon price to emissions from flaring starting in 2023, as announced in its climate plan.
Implementation, feasibility, technological and enabling infrastructure issues:• The policy to further reduce flaring from oil production facilities by 2030 could be enacted by increasing
the stringency of the provincial economic tests in stages from 2020 to 2030.• The GHG reduction benefits from a total elimination of routine flaring would be reversed and possibly result
in a GHG increase if operators choose to vent even a small portion of the otherwise flared gas, so policy and regulatory development that integrates flaring and venting is necessary. In order for the policy to have a net GHG reduction, capture and then use, sale or sequestration of the waste gas must be required and neither flaring nor venting can be permitted. Currently, in most cases, where flaring is practiced in Canada, it is the only cost-effective way to mitigate venting and thereby reduce methane emissions. Technology and gas gathering infrastructure can provide alternatives in most cases.
• The application of a flaring regulation in an offshore setting could only be enacted after industry safety regulations are amended, and its application to existing facilities after such amendments could result in stranded assets.
• Landfill sites and biogas facilities also flare gases, and limitations on flaring could be considered. • Options to reduce flaring without venting include: capturing the gas and using it on-site or transporting it in
a gas gathering system (either via pipelines or trucks); cogeneration using the waste gas; using incineration technologies; re-injecting to enhance oil recovery; and geological sequestration. One facility in southwest Saskatchewan has recently used captured gas to create electricity, and more such projects are anticipated.
• R&D and policy and regulatory development that integrate flaring and venting may be needed. • At refineries and chemical facilities, there is an economic incentive to utilize the heating value of waste
gas, and not to engage in routing flaring or non-routine flaring. In addition, there may be opportunities to capture and store waste gas instead of flaring; however, such storage might not be consistent with safety considerations.

Working Group on Specific Mitigation Opportunities Final Report
108
• New gas-gathering infrastructure (e.g., pipelines) will be needed to connect the isolated facilities where feasible. Financial support could be considered for regions that have no gas-gathering infrastructure.
I5. Fuel Switching to Lower Carbon Alternatives
POLICY GOAL: Switch fuels at large industrial facilities to lower carbon alternatives
POLICY TOOL: Regulation, including trading of credits, and/or financial incentives
Policy Details
Policy option A:• A regulation on large industrial facilities requiring the use of lower carbon alternatives with emissions
equivalent to, or lower than, natural gas. Combustion of heavy fuels (e.g., heavy fuel oil, bunker oil, petroleum coke, bitumen) would not be permitted.
• The requirement would be phased in starting c. 2020 and reach full implementation by 2025.• Various lower carbon alternative fuels could be used, including biogas, biomass, pyrolysis oil, biodiesel,
and renewable diesel.• Certain industrial uses of heavy oils that cannot readily be replaced (e.g., iron-ore pellet sector) would be
exempt for a prolonged but not indefinite period.• Facilities in regions where lower carbon electricity, natural gas, LNG, biomass-derived or other lower carbon
alternatives are not currently available (Newfoundland, northern Quebec, PEI, and the Territories) could be exempt until lower carbon alternatives become available. Exemptions would require careful design to avoid penalizing facilities requiring infrastructure to comply.
• Facilities could be incentivized to use even lower carbon alternatives if switching to such alternatives earns them performance credits or avoids a carbon cost.
Policy options B and C:• A regulation to require suppliers of natural gas to large industrial facilities to replace 10% of their natural
gas with lower carbon alternatives equivalent to, or better than, renewable natural gas (e.g., from landfills, etc.). If fuel quality is less of an issue (e.g., in certain industrial application), biogas could be used instead of renewable natural gas.
• Other renewable fuels (biogas, biomass, pyrolysis oil, biodiesel, renewable diesel), could be permitted as alternatives to renewable natural gas.
• The requirement would be phased in, starting at 5% in 2025 and increasing in stages to reach 10% by 2030.
• The focus of the requirement would be on the suppliers of natural gas to large industrial facilities, not the large industrial facilities themselves (since they would not likely know if the natural gas they obtain has renewable natural gas in it).
• These policies could be expanded to include the replacement of other lower carbon petroleum fuels (such as light fuel oil and diesel fuel) used by industrial facilities with renewable alternatives.
Policy option D• This option would extend the regulation described above for options B and C beyond the industrial
sectors to include all uses of natural gas as part of a broader policy of natural gas replacement.
An additional option would be to provide incentives only; GHG reductions and costs for such an option have not been estimated.

Working Group on Specific Mitigation Opportunities Final Report
108Working Group on Specific Mitigation Opportunities Final Report
109
Options Est. reductions in 2030 Est. cost/tonne
A. Eliminate heavy oils in combustion equipment where there is access to lower carbon alternatives.
1-6 Mt 0-$50
B. Replace 5-10%1 of natural gas used in combustion equipment at large industrial facilities2 with renewable natural gas, biogas, renewable fuel or renewable energy by 2030.
5-11 Mt $100-250
C. Same as option B with the addition of replacement of 5-10% 1 of natural gas used as feedstock (in addition to combustion) at large industrial facilities by biogas or renewable natural gas.
6-12 Mt (includes B)
$100-250
D. Place a requirement on natural gas producers or suppliers to supply all natural gas to all sectors3 with 5-10% 1 renewable content.
13-26 Mt (includes C)
$100-250
1. Final percentage would be set after a review of supply of renewable gas, biogas and renewable fuels.
2. Does not include light manufacturing or cogeneration.
3. Includes combustion, feedstock and cogeneration in industry, electricity generation and buildings but excludes transportation.
Note: policy option A is a separate policy approach from options B through D, which describe different levels of ambition of a similar policy approach. The GHG reductions associated with A are independent of reductions associated with B – D.
Also note: options B – D are scalable.
Also note: the above estimates do not include emissions from upstream production of renewable fuels and do not account for any impacts on production of fossil natural gas.
ECONOMIC AND CONSUMER IMPACTS
Policy option A: Low economic impact. • Analysis would be required to determine the feasibility of eliminating heavy fuels combustion in the back-up
systems of facilities. The possibility of adding an exception for these systems could be considered. • Heavy fuels, particularly petroleum coke, are used in a number of refineries and upgraders. These facilities
use the heavy fuels as complements to natural gas within a complex mix of fuels. Heavy oils are also used in the mining, pulp and paper, chemicals and base metals sectors.
• This switch has already taken place extensively in the large industrial sector due to the low cost of natural gas. There are only a few large industrial facilities that continue to use heavy (high-carbon) oils, due to a variety of economic and equipment related reasons (e.g., reluctance to change out older equipment). This policy may encourage further development of lower carbon alternatives and could drive associated employment growth.
• The fuel efficiency of new natural gas combustion equipment is better than older heavy fuels combustion equipment, thus leading to fuel savings for the facility.
Policy options B through D: Moderate to high economic impact, due to the higher cost of fuel.• Infrastructure to transport the renewable natural gas, biogas or other renewable fuels would be required.• Employment would be increased in companies making renewable natural gas, and could decrease in
companies extracting petroleum-based natural gas if there were no additional export market opportunities.

Working Group on Specific Mitigation Opportunities Final Report
110
CONSIDERATIONS
Co-benefits/negative impacts:• Policy option A: The switch from heavy fuels to lower-carbon alternatives would also significantly reduce
secondary pollutants. In the case of a switch to natural gas, reductions of emissions of SO2, NOx, PM, VOCs and heavy metals would be significant. However, in cement kilns, a significant increase in NOx could be expected due to increased temperature.
• Policy options B – D: It is not expected that the replacement of petroleum natural gas with renewable natural gas would result in reduction of air pollutants during combustion, but it would likely reduce emissions of air pollutants from the production of petroleum-based natural gas.
• High percentages of renewable natural gas would increase fuel costs for the industrial customers, impacting competitiveness.
Linkages with other working group areas and other proposed policies: • Any of these options could be implemented as part of a broader approach to low-carbon fuels, such
as the low-carbon fuel standard option proposed for the transportation sector (T2).• A price on carbon would help drive fuel switching, but may not provide the necessary price signal
for all companies to switch fuels or for investment in facilities to make renewable fuels.
Regional impacts including northern and remote communities:• Some possible increase in rural employment for increasing production of biofuels, although such
production is unlikely in the Arctic.
Implementation, feasibility, technological and enabling infrastructure issues:• An incentives only option could be considered but has not been modelled. Some fuel switching
has been realized through an incentive only approach.
Policy option A:• The availability of lower carbon alternatives is critical to this policy option. For instance, availability of
natural gas is limited or non-existent in Newfoundland, northern Quebec, and the Territories. Liquefied natural gas is an alternative, but is more expensive. However, biomass-derived fuels may be available in these regions in the future. Criteria will have to be developed to assess whether a region has access to natural gas, including considerations around transporting liquefied natural gas.
• Incentives could be considered to encourage growth in the natural gas network and the liquefied natural gas distribution system. Financial support could be considered for regions that have at present no access to natural gas. The availability of lower-carbon electricity in the future resulting from technological advances could broaden the range of lower-carbon fuel switching options.
• The switch from heavy fuels to natural-gas-equivalent alternatives would also significantly reduce emissions of SO2, NOx, PM, VOCs and heavy metals in most applications. However, in cement kilns, a significant increase in NOx could be expected due to increased temperature.
• The affected facilities would have to install new combustion equipment, which would take 2 to 4 years.• In some industries, heavy fuels (coke breeze, petroleum coke etc.) are used for process purposes not for
typical fuel combustion purposes; e.g., as a reductant in aluminium smelters, additives for the iron ore pellet sector and for ore separation in mining.
• A verification or detailed survey of which facilities are still using heavy fuels, and in what quantities and for what purposes, should be undertaken before policy A is adopted.

Working Group on Specific Mitigation Opportunities Final Report
110Working Group on Specific Mitigation Opportunities Final Report
111
Policy options B – D:• Renewable natural gas is effectively chemically indistinguishable from petroleum-based natural gas
(both are almost entirely methane), so existing combustion equipment can be used. The consumers of the 5%-10% renewable natural gas would not notice any difference.
• A study of the regional supply and infrastructure needed for capturing and producing RNG or equivalent alternatives from biogas, tie-ins to the natural gas network and delivery to industrial facilities should be undertaken before policies B – D are adopted. The study should include the recovery of biogas from point sources that would have to be further equipped to produce RNG, or might be too costly to connect to the natural gas network. These sources could produce renewable electricity and heat.
• A study of the availability of renewable natural gas, biogas and other renewable fuels suitable for industrial combustion should be undertaken before policies B – D are adopted. If the policy is broadened, the availability of renewable electricity and heat should be included. A common evaluation methodology for each type of fuel or energy source should be used (e.g., the GHGenius model).
I6. Methane Reductions
POLICY GOAL: Reduce venting and fugitive emissions of methane from upstream oil and gas facilities
POLICY TOOL: Regulation
Policy Details• This option is a recently announced federal policy and is already under development, with regulations
expected to be published in 201760
Options Est. reductions in 2030 Est. cost/tonne
40-45% reduction from 2012 by 2025 (announced federal policy)
18-20 Mt below BAU by 2025 $0-$50
Further reductions may be possible post-2025, building on the experience of implementing the announced regulations.
ECONOMIC AND CONSUMER IMPACTS• There are low-cost options (<$20/t) to reduce methane emissions. • Provincial royalties could be increased through the sale of captured natural gas.
CONSIDERATIONS
Co-benefits/negative impacts:• Reductions in emissions of VOCs, H2S and odours. • Health benefits from improved air quality.
Linkages with other working group areas and other proposed policies:• In March 2016, the federal government announced a policy of reducing methane emissions from oil and gas
facilities by 40-45% from 2012 levels by 2025. It also announced that it would regulate various equipment and operating practices at both new and existing facilities starting in 2018 with full implementation by 2020. The federal government plans to phase-in requirements: starting with leak detection and repair and well completions in 2018 for new and existing facilities; and then adding other requirements through 2020.
60 This policy is included here since it was not modeled in the reference case used in Canada’s 2016 Biennial Report – see Annex 3, “Key Methodological Choices” for more details

Working Group on Specific Mitigation Opportunities Final Report
112
• The federal government has led a number of international research, development and demonstration projects under the Climate and Clean Air Coalition and the Global Methane Initiative. Canada has provided financial support ($3 million) to facilitate strategic, inclusive and country-specific capacity building dialogue that will enable accurate, credible and verifiable quantification of emissions reduction opportunities across the upstream, midstream and downstream oil and gas sector.
• Carbon pricing on non-combustion emissions could help to incent reductions of venting and fugitive methane; however, careful consideration would be needed to determine how to accurately account for emissions from sources that are difficult to quantify, including fugitive equipment leaks. Alberta has announced a $30/t carbon price on produced fuels used on site starting 2023.
Regional impacts including northern and remote communities:• Positive impact on people in rural communities as there would be significantly less exposure
to methane, VOCs, H2S and odours for people living in the producing regions.• Costs are likely to be higher in B.C. which is dominated by gas production, not oil production,
so opportunities for capturing additional gas would be limited.• The NWT could be affected in regards to a facility in Norman Wells.
Implementation, feasibility, technological and enabling infrastructure issues:• Federal regulations are expected to be published in 2017• Gas-gathering infrastructure would be required in some locations in order to capture and use gas off-site.
This would likely be subject to the usual federal and provincial permitting processes.• Depending on the methane reduction technology required, access to grid electricity may be required.• In the future, there may be some potential to address methane emissions from landfills, wastewater, coal
mining, agricultural sources, and transportation (natural gas-powered vehicles).• There may also be potential to consider deeper emissions reductions post-2025, e.g., by increasing
the stringency of leak detection and repair; additional requirements for compressors, venting, flaring, well completions; coverage of other sources. Further action could require strategies to contain costs, targeted exemptions, investments in technological development, and/or major expansions to the gas-gathering infrastructure.
I7. Additional carbon emissions reductions through abatement and sequestration (CCS and other) technology
POLICY GOAL: Limiting carbon emissions through abatement and sequestration (CCS and other) technology
POLICY TOOLS: • Require or incent large industrial facilities to use sequestration to a sector-specific benchmark
or by a mandated work practice.• Facilities in regions where sequestration is not practical and/or pipelines are not accessible could
be exempt for a period of time. • Implement a credit trading system as part of the policy to allow some facilities to trade their
over-compliance with other facilities.• Offset protocol as part of a larger carbon pricing/trading approach.

Working Group on Specific Mitigation Opportunities Final Report
112Working Group on Specific Mitigation Opportunities Final Report
113
Options Est. reductions in 2030 Est. cost/tonne
Increase sequestration of carbon by 20% in industrial sectors where it is applicable. This could include capture of:
a) Formation CO2 at oil and gas wells
b) Combustion emissions
c) A portion of process emissions
d) Capture in long-lived products
e) CO2 conversion into fuel and chemicals
3 – 5 Mt* $50 - $100**
* This would consider formation gas sequestration, CO2 emissions produced during production of hydrogen at upgraders and refineries (including H2 production in oil sands) and chemicals and fertilizer sectors using CCS to mitigate 20% of the emissions in 2013. For Large Industrial Emitters, capturing these process emissions present the lowest cost opportunity.
** CCS costs are deemed to be quite high in general, and their estimates fluctuate widely. One study from Global CCS Institute, which “covers more than 80 percent of the world’s CO2 emissions from energy and industrial sources”, offered a cost range of $38 to $107 per tonne of captured CO2. A more recent cost data from the US congressional budget office indicates that the average capital cost of a CCS-equipped coal plant would average 76% higher than a conventional plant and the levelized cost of energy (LCOE) of a new plant would also be 76% more than for a conventional plant. While some institutes estimate that coal-fired CCS power plants would become commercially viable at $46 per tonne of CO2, other non-industry views estimate that it would be above $110/tonne.
Example of a technology: Capture CO2 from hydrogen production processes and send the CO2 to oil fields for aiding in oil recovery or for long-term sequestration.
ECONOMIC AND CONSUMER IMPACTS• CCS project equipment needs will stimulate domestic manufacturing and result in global market
opportunities for technology companies and engineering firms; CCS construction project needs will stimulate construction industry
• Significant research needed for capture technology to improve efficiency and bring down costs, since at current costs it would represent a significant burden to industry.
CONSIDERATIONS
Linkages with other working group areas and other proposed policies:• Could be included as an offset protocol as part of a larger carbon pricing/trading approach• Carbon pricing could drive CO2 sequestration. However, carbon pricing would need to carefully consider how
to account for CO2 emissions stored, in particular off-site, in order to ensure that the reduction is accurately accounted for and reflected in the cost of carbon paid. Consideration should be given to linking long term monitoring with annual carbon price paid/reduction accounted for.
• Fertilizer industry in particular is amenable to CCS as CO2 separation is a part of its process. Other opportunities include acid gas capture at natural gas processing facilities, enhanced oil recovery and hydrogen production at petroleum refineries, upgraders, and chemicals facilities as these are more concentrated sources of CO2 and therefore lower cost for capture. Technologies other than CCS are potentially available for carbon sequestration: capture in long-lived products and CO2 conversion into chemicals. Reduction impact and cost would need to be assessed.

Working Group on Specific Mitigation Opportunities Final Report
114
Implementation, feasibility, technological and enabling infrastructure issues:• Accesses to geological storage and long term monitoring and reliability for storage are key considerations.
Pipeline infrastructure is needed to facilitate storage for facilities in locations without local storage opportunities.
• Substantial R&D is required to bring down cost and move CCS technologies towards commercialization.• Additional demonstration projects are also required to adapt CCS technologies to other subsectors. • Announced CO2 sources for the Alberta Carbon Trunk Line (fertilizer and refinery sectors) are to be
connected in early 2017. • CO2 capture from hydrogen manufacturing units, with amine, is relatively common and found at Scotford,
Agrium, Air Products and some chemical manufacturing facilities.• If the cost per tonne does not come down with the demonstration projects, then it will be more economic
to pay the compliance obligation than invest in new technology.• Leakage concerns must be addressed.
I8. Limiting carbon emissions through transformative changes in technology throughout the industrial sectors
POLICY GOAL: Bringing forward next known transformative technologies.
POLICY TOOL: • Regulations that set emission-intensity benchmarks for facilities, or possibly specific processes.• Direct Incentives and/or tax measures to promote adoption of transformative technologies
Policy Details• The regulations would include schedules for deferred application should facilities instead implement CCS
or technologies which are more ambitious than best available technologies (BAT; note: BAT is implicitly considered in a number of the other policy options for large industrial sector).
• The technological options would be included as schedules to the regulation and updated regularly.• Exemptions, or other cost containment strategies would require careful design to ensure that the regulation
would drive significant reductions in the industrial sectors where possible.
Sectors could include: Oil and Gas; Chemicals; Nitrogen and Potash Fertilizer; Lime and gypsum; Mining; Cement; Iron and Steel; Base Metal Smelting; Food sector; Aluminum
In addition to carbon capture and storage and electrification (which have their own policy options), there are several transformative technologies which could be included in regulatory schedules and/or incentivize uptake directly or through tax measures:
• Aluminum sector: » Non-emitting anodes
• Pulp and paper sector: » Methanization of effluent waste » Biomass steam reforming to replace natural gas to the lime kiln burner » Black liquor gasification
• Chemical sector: » Hydrogen production through electrolysis » Increased use of renewable feedstocks for the production of chemical and fertilizer products
• Cement: » Use of limestone and supplementary cementing materials to replace clinker in cement
• Steel: » Substitute coke and carbon with bio-carbon in integrated mills (all in Ontario):

Working Group on Specific Mitigation Opportunities Final Report
114Working Group on Specific Mitigation Opportunities Final Report
115
• Oil and gas: » For oil and gas facilities that could be possible in the next 5-15 years:
y Down-hole steam generation, warm-water extraction, increased heat integration, in-fill or wedge wells, improved electrical submersible pumps, and advanced reservoir modelling and optimization of reservoir management.
» Combined, the above oil and gas technologies have the potential to reduce GHG emissions per barrel of oil extracted by 15-40% (on a well-to-tank basis).
» In addition, hybrid solvent-steam technologies could reduce GHG emissions per barrel by up to 25% for specific sites.
• Electrification of heaters or boilers
Options Est. reductions in 2030 Est. cost/tonne
A. Limiting carbon emissions by setting regulations or providing direct or tax incentives to limit emissions from industrial sectors to a benchmark and bring forward ambitious technologies earlier than BAU
11-29 Mt1 $100-$2502,3
1. based upon sector benchmarks and adoption of solvent use (6-22 Mt) and improvement of bitumen extraction technologies (1-3 Mt), plus actions in other sectors (~4 Mt).
2. Pathways to a Low Carbon Economy Version 2 of the Global Greenhouse Gas Abatement Cost Curve, McKinsey and Company 2009.
3. Costs are presented in standardized ranges. Costs for this policy are based on estimates in the range of $100-$150 per tonne.
ECONOMIC AND CONSUMER IMPACTS• Competitive advantage locally / internationally, with a reduction of energy need/production cost• Energy / fuel savings for the facilities• Stimulate growth in electricity grid and manufacturing of equipment related to the grid.• Stimulate the development of the bio-carbon supply chain, which can provide jobs in remote areas.• Selling Canadian expertise /technologies
CONSIDERATIONS
Co-benefits/negative impacts:• Reduced air pollutants such as SOx, PM, PAH, NOx, HFCs• Stimulate research by Canadian companies. • Develop Canadian expertise with these high tech processes.
Linkages with other working group areas and other proposed policies: • Carbon price could help support the deployment of transformative technologies (for example by reducing
the difference in cost between NG and biomass)• This policy could overlap with energy efficiency and with policies aimed at deploying specific technologies,
such as CCS and electrification.
Regional impacts including northern and remote communities:• Development, manufacturing and implementation of these technologies may not be possible
in all jurisdictions.
Implementation, feasibility, technological and enabling infrastructure issues:• Research, development and demonstrations will be required to accelerate innovation of next generation
technologies and reduce costs. Specifics depend on target sectors and their challenges. • Complementary measures to enhance and support RD&D can support a more rapid development
and deployment of transformative technologies and reduce risk to first movers.

Working Group on Specific Mitigation Opportunities Final Report
116
• Transportation
T1: Passenger Vehicle Emission Regulations and Incentives
POLICY GOAL: Reduce GHG emissions from passenger vehicles
POLICY TOOLS: Regulations and incentive programs to increase market penetration of advanced GHG-reducing passenger vehicle technologies, including Zero Emission Vehicles (ZEVs)61, and overall improvements to the fleet, including encouraging accelerated fleet turn-over of older passenger vehicles.
Policy DetailsA. Zero Emission Vehicle (ZEV) Consumer Incentives
» Provide rebate of $7,000 to $12,00062 on the purchase of a new ZEV, varying based on battery size. Hydrogen fuel cell vehicles would receive the maximum amount.
» Beginning in 2017 and reducing over time until cost parity with conventional vehicles (projected by 2022) » Implement free access to tolls and HOV lanes for ZEVs through the use of green plates » $1000 rebate could also be offered for installation of charging infrastructure
B. Scrappage Incentive Program » A consumer incentive program intended to accelerate the fleet turn-over of pre-2006 passenger vehicles,
targeted at 8%-9% annual turnover. » Modest incentives for scrapping older vehicles and replacing with a new gasoline vehicle (e.g. up
to $1500 per vehicle based on a carbon calculation of the GHG reduction) » More substantial incentives for replacing the scrapped vehicle with a ZEV (e.g. up to $3000; could
be tied in with above ZEV Consumer Incentive program). » Could be implemented as soon as a program is developed.
C. Funding for Consumer Awareness Programs for ZEVs » Program would partner with vehicle manufacturers, ENGOs, and other levels of government to educate
and promote ZEVs to Canadians » Could begin immediately and leverage existing provincial and not-for-profit ZEV information programs.
D. Light-Duty Vehicle GHG Regulations for 2026-2030 model years » Various scenarios for future amendments to the Passenger Automobile and Light Truck Greenhouse
Gas Emission Regulations (which apply increasingly stringent standards to model years 2017-2025) to establish increasingly stringent fleet-average GHG emission standards for model years 2026 to 2030.
» The standards could be numerically “fixed” performance-based standards that would apply to all technologies (including ZEV) and a company’s entire fleet of passenger automobiles and light trucks
E. Zero Emission Vehicle (ZEV) standard » Regulatory or voluntary standard requiring or encouraging manufacturers to supply a certain percentage
of ZEVs in their fleet every year, starting in 2022 (see levels of ambition in the table below). » Preceded from 2017-2022 by Option A and B, and possibly C » A regulatory approach could include compliance flexibility through credit banking and trading – credits
could be earned for over-compliance in a given year » Voluntary sales targets could be implemented in combination with consumer education
and incentive programs
61 ZEVs include full electric vehicles, plug-in hybrids, and hydrogen fuel cell vehicles.
62 This is the current price premium of most ZEVs compared to conventional vehicles.

Working Group on Specific Mitigation Opportunities Final Report
116Working Group on Specific Mitigation Opportunities Final Report
117
Options Est. reductions in 2030 Est. cost/tonne
A. ZEV consumer incentives 1-3 Mt $100-$250*
B. Scrappage program
C. Consumer awareness program -
D. Light duty vehicle GHG regulations for model years 2026-2030
i. Modest emissions standard of 172 g/mile in 2026 and increasing in stringency to 158 g/mile by 2030
1-2 Mt $0-$100
ii. Moderately ambitious emissions standard of 163 g/mile in 2026 and increasing in stringency to 131 g/mile by 2030
4-5 Mt
iii. Ambitious emissions standard of 158 gCO2/mile in 2026 and increasing in stringency to 105 g/mile by 2030
6-7 Mt
E. ZEV Standard
i. Beginning with 2% of the fleet in 2022 to 30% of the fleet by 2030
2-4 Mt $0-$100
ii. Beginning with 10.5% of the fleet in 2022 to 50% of the fleet by 2030**
6-9 Mt
Note: emission reduction estimates are not cumulative. Also, options D and E are alternatives, i.e. they would not both be implemented since they target the same emissions. Consequently, the GHG reductions cannot be added together; this is reflected in the summary table on page 56. Options A, B and C are additional to D and E.
* Costs are presented in standardized ranges. Costs for this policy are based on estimates in the range of $150-$250 per tonne.
** Percentages are examples based on existing legislation in California and analysis in Quebec.
ECONOMIC AND CONSUMER IMPACTS:• ZEV owners would benefit from significant fuel savings. According to Electric Mobility Canada, plug-in EVs
are 4-6 times cheaper to operate than conventional vehicles• While current ZEVs carry a purchase cost-premium of $7k to $12k compared to conventional vehicles, this
is expected to lower over time. By 2022, it is projected that production costs will be cost-competitive with conventional vehicles. The above policy options are outlined to help bridge the gap for consumers until ZEVs become cost competitive.
• A regulatory ZEV standard or voluntary sales targets could spur automaker investment in ZEV technology and industrial development in Canada.
• Mandatory ZEV sales requirements could result in competitiveness impacts, particularly in Ontario, and could result in carbon leakage (i.e., shifts in production to jurisdictions with less stringent requirements). A voluntary standard may provide less certainty with respect to emissions reductions, but could help to manage competitiveness impacts.
CONSIDERATIONS
Stakeholder perspectives:• Vehicle manufacturers are against a ZEV standard, citing unachievable and costly targets; adoption of this
type of approach may lead to manufacturers choosing to invest outside Canada.
Linkages to other policy options• Modifications to building codes can also support vehicle charging infrastructure (see B1, B3)

Working Group on Specific Mitigation Opportunities Final Report
118
Co-benefits/negative impacts:• Increased reliance on clean electricity to realize full GHG reduction potential of increased deployment
of electric vehicles. • Air pollutant co-benefits including improved health outcomes
Regional impacts including northern and remote communities:• Some provinces currently have a ZEV consumer incentive program (QC, Ontario and BC).• The automotive sector is an important manufacturing industry in Ontario; the economic and competitiveness
impacts of policies affecting vehicle manufacturers would need to be carefully considered
Implementation, feasibility, technological and enabling infrastructure issues: • Moving ahead of the U.S on vehicle emission regulations could be challenging as it would bring Canada and
the U.S. out of regulatory alignment for a sector that is fully integrated – the passenger car and light truck manufacturing sector. Experience in other jurisdictions with ZEV standards suggests that models would be brought to Canada first so manufacturers can fulfill their obligations.
• In the absence of demand side measures (e.g., consumer incentives), supply side measures (e.g., ZEV standard) alone would be insufficient to make significant progress.
• Incentives, building codes and standards, and government investments around charging infrastructure must complement this policy option (specifically level 3 fast charging). Some provinces are already heavily investing in public fast-charging infrastructure and offering incentives for home and work charging infrastructure.
• As more electric vehicles take up market share and charging demands increase at home, issues could arise with local electrical transformers.
• Demonstrations of novel charging technologies to lower costs, improve performance and ease grid integration, as well as R&D on specific components, can help address the difficulties of integrating charging technologies into distribution grids or new end-use applications. Likewise, demonstrations of hydrogen fuel cell vehicle applications and funding for fuelling infrastructure can help increase automaker fuel cell vehicle supply to Canada and create opportunities for Canadian companies active in this sector.
• R&D related to lightweighting vehicles can reduce energy consumption and increase vehicle range.• More stringent GHG emission standards for 2026-2030 model years could have an impact on the ability
of consumers to purchase vehicles with larger power requirements, such as pick-up trucks.• If a high gas guzzler tax was added to the cost of less efficient vehicles (e.g, pickup trucks), then
the added revenue generated could be used to offset the costs of the ZEV rebate.
T2: Increased availability and use of low-carbon fuel for on-road and off-road vehicles
POLICY GOAL: To reduce the carbon intensity of transportation fuels used in Canada and support fuel switching to lower carbon fuels for cars, trucks, mining and construction equipment, commuter rail and public transit,63 while stimulating the domestic production of low carbon fuels.
POLICY TOOLS: Regulations, including a Low-Carbon Fuel Standard and increased renewable fuel requirements; and financial measures, including direct funding and incentives for enabling infrastructure for fuel switching
63 Annex T10 addresses low carbon fuels for the marine, rail and aviation sectors.

Working Group on Specific Mitigation Opportunities Final Report
118Working Group on Specific Mitigation Opportunities Final Report
119
Regulatory measures:A. Renewable fuels• Increase renewable content requirement up to 10% for gasoline and up to 5% for diesel, beginning
in 2020, including requiring renewable fuels to have lower carbon intensity than gasoline and diesel.
B. Low Carbon Fuel Standard (LCFS)• Would apply to all producers or importers of transportation fuels (gasoline, diesel, natural gas, propane,
electricity, hydrogen, etc.), requiring a 1% reduction in fuel lifecycle carbon intensity each year, beginning in 2020.
• Modeled off B.C.’s existing LCFS, including compliance flexibility through credit trading• For example, transit authorities could earn compliance credits through the use of low carbon fuels,
and engage in credit trading to offset low carbon fuel costs.• Fuelling infrastructure investments could be eligible for credits• Could be expanded beyond the transportation sector – see industrial fuel switching option I5
C. Truck engine compatibility with low-carbon fuels• Regulations requiring all new medium- and heavy-duty truck engines sold or imported into a jurisdiction
to be compatible with a fuel other than gasoline containing less than 10% ethanol or diesel containing less than 5% biodiesel by 203064.
Complementary measures: D. Truck engine rebate• New medium- and heavy-duty truck engine rebate offered to purchasers of new truck engines
between 2020 and 2025• Three rebate levels would be offered based on the lifecycle carbon intensity of the typical fuel mix
of the new engine relative to 100% fossil-based gasoline or diesel: » 10% rebate for 10% reduction » 30% rebate for 30% reduction » 50% rebate for 50% reduction
E. Transit vehicle compatibility with low-carbon fuels• Funding for transit authorities purchasing public transit vehicles (including commuter rail)
with engines compatible with a fuel other than fossil-based gasoline or diesel• Based on same lifecycle carbon intensity scheme as truck engine rebate above:
» 10% rebate for 10% reduction » 30% rebate for 30% reduction » 50% rebate for 50% reduction
F. Transit electrification• Funding for infrastructure, including trolleys, street cars and commuter rail.
» Funding for feasibility studies. » Infrastructure costs vary. » Feasibility studies could be initiated immediately
64 This could be achieved through a number of existing technologies: alternative fuel engines (electric, propane, natural gas, or hydrogen); hybrid gasoline-electric or diesel-electric engines; flex-fuel gasoline engines (ethanol blends up to E85); use of renewable diesel - HDRD or biodiesel (FAME) in diesel engines; and bi-fuel or dual-fuel engines (gasoline or diesel and an alternative fuel such as propane, natural gas or hydrogen). Measures ensuring proper alternative fuel use would also need to be developed.
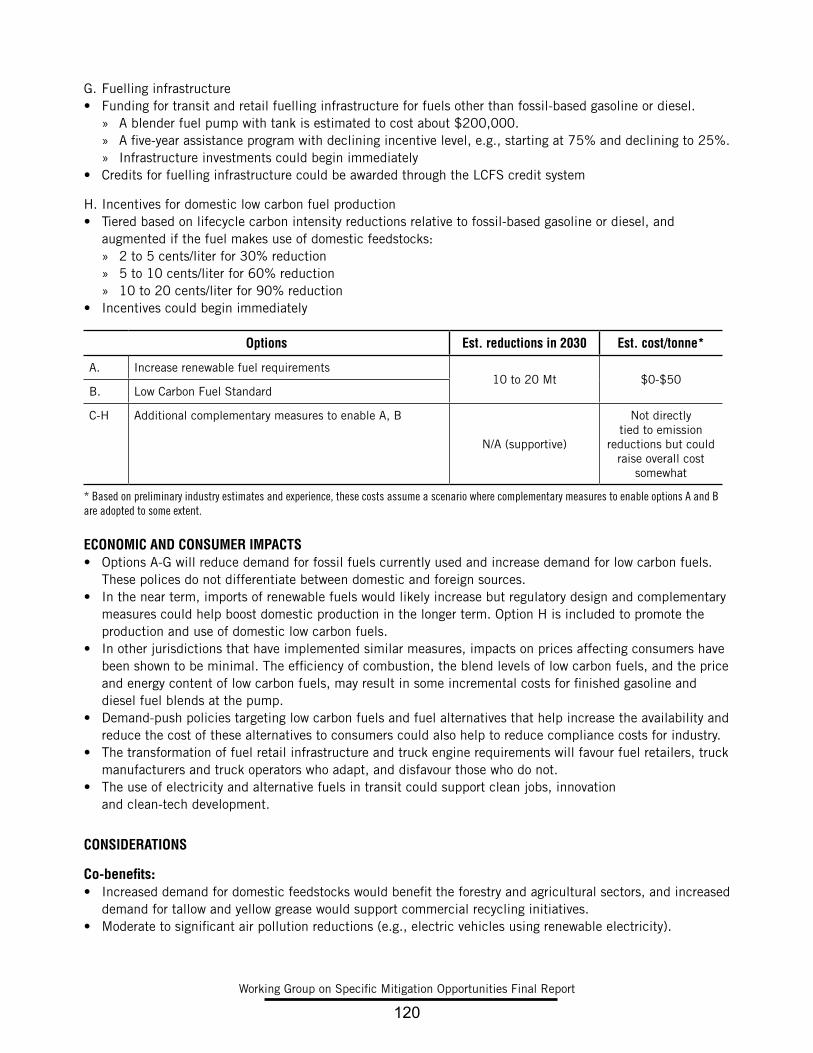
Working Group on Specific Mitigation Opportunities Final Report
120
G. Fuelling infrastructure• Funding for transit and retail fuelling infrastructure for fuels other than fossil-based gasoline or diesel.
» A blender fuel pump with tank is estimated to cost about $200,000. » A five-year assistance program with declining incentive level, e.g., starting at 75% and declining to 25%. » Infrastructure investments could begin immediately
• Credits for fuelling infrastructure could be awarded through the LCFS credit system
H. Incentives for domestic low carbon fuel production• Tiered based on lifecycle carbon intensity reductions relative to fossil-based gasoline or diesel, and
augmented if the fuel makes use of domestic feedstocks: » 2 to 5 cents/liter for 30% reduction » 5 to 10 cents/liter for 60% reduction » 10 to 20 cents/liter for 90% reduction
• Incentives could begin immediately
Options Est. reductions in 2030 Est. cost/tonne*
A. Increase renewable fuel requirements10 to 20 Mt $0-$50
B. Low Carbon Fuel Standard
C-H Additional complementary measures to enable A, B
N/A (supportive)
Not directly tied to emission
reductions but could raise overall cost
somewhat
* Based on preliminary industry estimates and experience, these costs assume a scenario where complementary measures to enable options A and B are adopted to some extent.
ECONOMIC AND CONSUMER IMPACTS• Options A-G will reduce demand for fossil fuels currently used and increase demand for low carbon fuels.
These polices do not differentiate between domestic and foreign sources. • In the near term, imports of renewable fuels would likely increase but regulatory design and complementary
measures could help boost domestic production in the longer term. Option H is included to promote the production and use of domestic low carbon fuels.
• In other jurisdictions that have implemented similar measures, impacts on prices affecting consumers have been shown to be minimal. The efficiency of combustion, the blend levels of low carbon fuels, and the price and energy content of low carbon fuels, may result in some incremental costs for finished gasoline and diesel fuel blends at the pump.
• Demand-push policies targeting low carbon fuels and fuel alternatives that help increase the availability and reduce the cost of these alternatives to consumers could also help to reduce compliance costs for industry.
• The transformation of fuel retail infrastructure and truck engine requirements will favour fuel retailers, truck manufacturers and truck operators who adapt, and disfavour those who do not.
• The use of electricity and alternative fuels in transit could support clean jobs, innovation and clean-tech development.
CONSIDERATIONS
Co-benefits:• Increased demand for domestic feedstocks would benefit the forestry and agricultural sectors, and increased
demand for tallow and yellow grease would support commercial recycling initiatives.• Moderate to significant air pollution reductions (e.g., electric vehicles using renewable electricity).

Working Group on Specific Mitigation Opportunities Final Report
120Working Group on Specific Mitigation Opportunities Final Report
121
Linkages with other working group areas and other proposed policies: • A separate annex (T10) addresses the use of low carbon fuels in the marine, rail (except commuter rail) and
aviation sectors. The electricity subgroup is considering options for reducing reliance on diesel generators in remote communities. Also note that provinces have different renewable content requirements for gasoline and diesel, in addition to the federal requirement.
• Low carbon transit investments will not be effective without Transportation Demand Management (TDM) measures (see policy option T8) to incent the use of public transit, and reduce incentives for driving (e.g. parking supply and cost, road cost, congestion charging).
Regional impacts including northern and remote communities:• Domestic fossil crude oil production is currently focused primarily in Alberta, Saskatchewan, and
Newfoundland, with refineries located in most provinces. Domestic renewable fuel production is currently occurring in each province west of the Maritimes.
• The proposed incentives will result in new opportunities for low carbon fuel production across Canada. For example, medium- and large-scale renewable diesel (such as HDRD) production can be located in regions with access to a sufficient supply of biomass feedstocks, including oil seeds, animal fats, waste cooking oil, organic content of municipal solid waste, forestry and agricultural residues.
Implementation, feasibility, technological and enabling infrastructure issues:• Customer protection measures similar to the U.S. Magnuson-Moss Warranty Act may be required to ensure
that vehicle manufacturers honour their warranty obligations with respect to fuel use. • The fuel industry will need to update its fuel tracking systems to include carbon intensity information,
and train staff to respond to new regulatory requirements.• Truck engine requirements will need to be co-ordinated with U.S. partners.• Fuel “shuffling” can occur between provinces when fuel suppliers redirect lower carbon intensity fuels to
jurisdictions with LCFS policies, and redirect higher carbon intensity fuels to other jurisdictions, with no change in overall GHG emissions associated with these fuels. A federal or national LCFS would minimize this effect.
• Transit electrification requires specific investments in overhead electrical connectivity (pantographs and catenary wire).
• It is assumed that the price and capability/performance of natural gas, hydrogen fuel cell and electric vehicles will continue to improve so that by 2022 there could be no price differential with conventional internal combustion engine vehicles.
• Important infrastructure requirements are needed for some alternative fuel pathways (e.g. hydrogen infrastructure for fuel cell vehicles).
• Research and development may be required to support codes and standards, improve process reliability, reduce costs, promote consumer confidence and increase the availability of fuels.
• These options will require complementary science-based communication and education on fuel options and their impact on GHG emissions.
• Continued investment and support from the Government of Canada for science-based fuel lifecycle assessment tools, including GHGenius, is another important complementary measure.
T3: Energy Efficiency in the aviation, rail, marine and off-road industrial sectors
POLICY GOAL: Reducing emissions in the aviation, rail, marine, and off-road (agriculture, construction, mining) sectors through efficiency improvements to the overall system (e.g. reduced network congestion) and specific operations (e.g. reduced weight and idling)

Working Group on Specific Mitigation Opportunities Final Report
122
POLICY TOOLS: Regulations; voluntary agreements; financial incentives, education and awareness, market-based measures
Policy Details
AviationA. Require operators to offset their domestic aviation emissions starting as early as 2021:
» Obligation could be met by reducing emissions through operational or technological improvements or compensating for emissions by purchasing certified offsets
» Different levels of stringency (see table below) » Approach would be designed to align with the international market-based measure approach under
development through the International Civil Aviation Organization (ICAO) » Would drive efficiency measures such as shutdown of auxiliary power units, (10 minutes less APU
usage)single engine taxi(10 minutes single engine tax – 80kg saved on A330 flight of 2500nm)ing, and improved air traffic management
» Timing would depend on the progress of the ICAO market-based measure development, likely in 2021
Off roadB. Regulations to require anti-idling technologies:
» Requirement for owners/operators of specified vehicles to install technologies that automatically shut down the engines of off-road agriculture, construction and mining equipment during the idle portions of their duty cycle. These devices may restart the engines when required
» Shorter-term complementary measures could include incentives to install anti-idling technology and promoting awareness and training operators to reduce idling
» Incentive, awareness and training programs could be initiated immediately to achieve emission reductions and inform the development of regulations
Cross-sectoral measuresC. Introduce benchmarking and reporting requirements for operational energy efficiency:
» Introduce requirement for all operators in each sector to report annually on their operational efficiency (where requirement does not currently exist)
» Establish benchmarking and reporting mechanisms for transportation hubs to improve year-over-year operational efficiency in-line or above benchmarks for each sector
» Voluntary benchmarking and reporting could be implemented immediately. Timing for a regulatory option would depend on the development process and design of the regulation
D. Regulations requiring annual operational efficiency improvements in all sectors: » Sector-specific targets for annual operational efficiency improvements » Complementary measures could include requiring energy management plans for specific sectors/
operators, e.g. rail (would include locomotive and network operations) » This measure would complement fleet average energy efficiency improvements achieved through retrofits
of existing in-use aviation, marine, rail and off-road vehicles described in policy option T5. » Timing would depend on the regulatory development process and design of the regulation
E. Introduce funding/incentive programs for the deployment of lower GHG emitting vehicles and engines at transportation hubs (e.g. airport ground support equipment, cargo-handling equipment, shore power technology, Genset switchers, etc.). » Could improve operational energy efficiency by 5% year-over-year for those hubs » Could be implemented immediately following development of a funding/incentive program.

Working Group on Specific Mitigation Opportunities Final Report
122Working Group on Specific Mitigation Opportunities Final Report
123
Options Est. reductions in 2030 Est. cost / tonne
A. Aviation offsets:
i. 30% of domestic aviation emissions 2-3 Mt $0-50*
ii. 70% of domestic aviation emissions 6 Mt $0-50*
iii. 100% of domestic aviation emissions 8 Mt $0-50*
B-E Regulations, programs and incentives above (B-E) for the following sectors:
Off road 1-7 Mt $0-$100
Marine and rail 0-2 Mt $0-$250
Note: emission reduction estimates for Ai., ii. And iii. are cumulative. Remaining estimates are not cumulative
*Estimated market cost of carbon offsets (may rise if demand increases).
ECONOMIC AND CONSUMER IMPACTS• High upfront costs associated with certain solutions (e.g. technological changes, training, certification)
could result in longer payback periods• Over time, operational efficiency could lead to reduced costs and/or time savings for passengers and
shippers, as well as improved competitiveness• If there is a national carbon price, the rail and marine sectors would not have independent offset programs.
Emissions from these modes would be priced in accordance with a national carbon price in order to ensure emission cost competitiveness with light and heavy duty vehicles.
• Requirements to offset aviation emissions would have an impact on the cost of domestic air travel and would likely need to be limited to medium and larger companies to avoid burden on very small operators.
• If there were an offset requirement for aviation, consideration would need to be given to reducing or eliminating other economic instruments applied to aviation emissions (e.g. carbon or fuel taxes).
• If the eligible offsets were restricted to Canada it could help drive reductions in other sectors of the economy, however as domestic offsets are likely to be comparatively expensive such a restriction could further increase the cost of aviation and reduce demand.
CONSIDERATIONS
Indigenous perspectives:• Companies owned and operated by Indigenous groups (logging companies that have off road equipment,
shortline and regional railways) may be impacted by this policy.
Co-benefits / negative impacts:• Air pollutant and black carbon reductions could be anticipated, which is particularly important around
hubs, ports and urban populations, thereby improving public health.• Some operational efficiency measures could have negative impacts, such as increased noise.
Linkages with other working group areas and other proposed policies:• The policies presented here should not duplicate carbon or fuel taxation policies. For example, including
the aviation sector in pricing systems as well as an offset requirement could cause the economic burden on aviation to be unbalanced relative to other modes and sectors.
• There is also a link to measures that aim to improve fleet efficiency, utilize ground infrastructure to reduce emissions (e.g. shore power), improve logistics, and exploit the increased efficiency potential of intelligent transportation systems.
• Rail, marine and off-road emissions would be priced in accordance with a national carbon price.

Working Group on Specific Mitigation Opportunities Final Report
124
Regional impacts, including northern and remote communities:• Increased costs associated with new/existing off-road equipment, locomotives, airplanes and marine vessels,
could be passed on by transportation operators and may be disproportionately felt in northern and remote communities, although this could be limited/off-set by lower operating costs and competitive interests.
Implementation, feasibility, technological and enabling infrastructure issues:• Proposed measures should be compatible with international (air, marine) and/or North American approaches
(marine, rail)• If offsets are implemented for aviation, there may be a need to develop a strategy to accommodate smaller
carriers and operators that may be sensitive to additional economic strain. • Some improvements may be slower to implement (e.g. airspace and rail infrastructure changes require
extensive consultations)• High capital costs associated with technological improvements could hinder pace of implementation
(e.g. rail network planning systems are known to be expensive)• Behavioural changes within industry can take time to become mainstream • Safety considerations, existing regulations, and infrastructure capacity could act as a barrier to
implementation • Achieving efficiencies often entails close collaboration among operators (e.g. airlines), infrastructure
authorities (e.g. airport operators), and network managers (e.g. air navigation services providers)
T4: Heavy Duty Vehicle and Engine Emission Regulations and Incentives
POLICY GOAL: Reduce greenhouse gas emissions from new and in-use heavy-duty vehicles and engines (HDVs) through greater market penetration of advanced GHG-reducing technologies, and overall improvements to the fleet, including encouraging accelerated fleet turn-over of older HDVs.
POLICY TOOLS: Regulations and Incentives
Policy DetailsA. Continue with on-going work to introduce more stringent HDV GHG regulations for new vehicles post-2018
» Develop a second phase of the Heavy-Duty Vehicle and Engine Greenhouse Gas Emission Regulations to further reduce GHG emissions from new on-road heavy-duty vehicles and engines for 2021 and later model years.
» Would introduce emissions standards for trailers pulled by on-road tractors, setting new GHG emission standards for 2018 and later model years.
B. Provide incentives for the retrofit of GHG reducing technologies on in-use HDVs » Direct rebates to owners/operators covering a percentage of the cost of retrofits (varying by technology) » Incentives could begin to be delivered as soon as a program is developed
C. Regulate GHG technologies for in-use heavy-duty vehicles. » Require operators to install a combination of technologies, including low-rolling resistant tires,
aerodynamic add-ons, auxiliary power units to reduce idling » Timing would depend on the regulatory development process and design of the regulation
D. Scrappage program for older in-use HDVs » Would provide $25k-$35k rebate toward the purchase of a newer, cleaner HDV, based on a calculation
of the GHG emissions reduced by the replacement » Target 5%-15% increase in annual fleet turnover » Could be initiated as soon as a program is developed

Working Group on Specific Mitigation Opportunities Final Report
124Working Group on Specific Mitigation Opportunities Final Report
125
» Revise provincial weight and dimension regulations to eliminate barriers to the deployment of GHG-reducing advanced technology vehicles.
» Expand the use of turnpike double long combination vehicles in order to double the volume of goods moved
» Allow for heavier weight limits where appropriate » Timing would depend on the regulatory development process
E. Regulate or provide incentives for truck stop electrification » Requirement that major truck stops across Canada install infrastructure to provide electrical
connections for trucks in order to reduce idling during rest periods » Regulation could be supported/replaced by incentives » Incentives could be implemented immediately following the development of a program. » A regulatory strategy would need to allow sufficient lead time for truck stops to install
the required infrastructure.
F. Funding for electrified truck highways » Demonstration or pilot projects would be eligible for funding » Pilot projects could be initiated immediately following the development of a program
Options Est. reductions in 2030 Est. cost/tonne
A. Post-2018 HDV GHG regulations 3-6 Mt < $0-$50
B. Incentives for retrofits on in-use HDVs
1-3 Mt
$100->$250*
C. Regulations requiring GHG-reducing technologies for in-use HDVs
$50-$100
D. Scrappage of older HDVs >$250
E. Revise weight and dimension regulations2-3 Mt
<$0
F. Require truck stop electrification $0-100
G. Funding for electrified truck highway pilot projects
<1 Mt >$250
Note: emission reduction estimates are not cumulative
* Costs are presented in standardized ranges. However, costs for this option are likely in the range of $150-$250+.
ECONOMIC AND CONSUMER IMPACTS:• Many of the options outlined above are currently available in the U.S. If implemented this would help to
support overall competiveness of the Canadian market, as well as being supported by industry.• There are some differences between Canadian and U.S vehicles, in regards to weight and dimensions
(some jurisdictions have different restrictions on length and weight of trucks), which may impact the implementation of some technologies. Significant fuels savings are possible by encouraging the uptake of ‘off-the-shelf’ aerodynamic technologies -- up to 8,600 litres annually per truck (resulting in GHG savings of up to 22,700 kg CO2 annually per truck). Additionally, improved fuel efficiency associated with the adoption of these technologies can yield cost savings of up to $7,200 annually per truck.
• Cost savings to industry could, in some cases, be passed on to consumers of freight products.• Past examples have shown that companies often expand their investment once they have gained experience
and clear economic benefits from them, thus creating a multiplier effect on technology uptake and promoting technology and innovation within the transportation industry.
• Potential manufacturing possibilities within Canada for some of the technologies.

Working Group on Specific Mitigation Opportunities Final Report
126
CONSIDERATIONS:
Stakeholder perspectives: • Industry associations such as the Canadian Trucking Alliance have been advocating for HDV aerodynamic
incentive programs to assist Canada’s trucking industry for many years.
Co-benefits/negative impacts:• Criteria air pollutant emission reductions, with associated health benefits. • With carefully controlled operating conditions and routes specified by special permits, long combination
vehicles have been shown to be safer than individual tractor semi-trailers. However, in some cases such as mountainous areas and severe weather conditions, these vehicles can pose safety concerns.
Reduction of congestion on highways. Linkages with other working group areas and other proposed policies:
• Carbon pricing would increase the cost of fuel, thus improving the business case for truck retrofits with fuel saving technologies (e.g., aerodynamic devices).
• Work on national harmonization on some of the above measures is currently being looked at under the Council of Deputy Ministers Responsible for Transportation and Highway Safety’s Task Force on Weights and Dimensions.
Regional impacts including northern and remote communities:• Regional harmonization of technologies such as long-combination vehicles and weights and dimensions
can help facilitate inter-provincial and cross-border trade. However there are limitations to implementing such standards nationally due to varying geography and highway infrastructure capacities in provinces and territories. Such technologies can have adverse impacts on road infrastructure.
Implementation, feasibility, technological and enabling infrastructure issues: • The Government of Canada is currently consulting on a second phase of the Heavy-Duty Vehicle and Engine
Greenhouse Gas Emission Regulations, to further reduce GHG emissions from new on-road heavy-duty vehicles and engines of the 2021 and later model years, and trailers of 2018 and later model years. (option A)
• Aerodynamic technologies are readily available and proven. Any technology that would be incented or regulated would need to be vetted by a certification authority (e.g. U.S EPA’s Verified Technologies for SmartWay and Clean Diesel Campaign).
• There have been previous national and provincial programs offering HDV retrofit incentives, as well as scrappage incentives.
• Road infrastructure is critical in harmonizing trucking standards for LCVs/weights and dimensions (e.g. lane width, capacity of highway infrastructure, pavement strength, bridge capacity, etc.), such technologies can have adverse impacts on road infrastructure.
• Some of the measures outlined above are complimentary (e.g. if trucks are equipped with APUs to address vehicle idling, there may not be significant further reduction in emissions through the use of truck stop electrification).
• The proposed options could complement Natural Resources Canada’s SmartWay Transport Partnership Program, which encourages owners and operators to improve fuel efficiency through the adoption of low carbon technologies and practices, and by measuring the performance improvements.
Working Group on Specific Mitigation Opportunities Final Report
126Working Group on Specific Mitigation Opportunities Final Report
127
• R&D related to lightweighting vehicles can reduce energy consumption and allow for increased cargo weights.• Due to the high cost of installation and maintenance of infrastructure for electrified truck highways
this currently presents a significant implementation issue, and may only be feasible in small focused deployments (e.g. regular movements between port and distribution centre on dedicated truck lanes). Fuel cell technologies (allowing for wireless electric propulsion) may be a better alternative for wide-scale deployment over the long term. Such a policy option may be considered for emissions reductions from the transportation sector over the longer-term (to 2050).
• Any type of scrappage program should need to ensure proof that the vehicle is taken out of service and that emissions don’t get displaced elsewhere.
T5: Vehicle and Engine Fuel Efficiency in the Aviation, Marine, Rail and Off-road Sectors
POLICY GOAL: Reduce greenhouse gas emissions from new and in-use airplanes, marine vessels, locomotives and off-road equipment through greater adoption of fuel saving devices and overall improvements to the fleet, including promoting accelerated fleet turn-over of older equipment.
POLICY TOOLS: Regulations, operating requirements, voluntary agreements, financial incentives (grants, tax preferences, low interest loans)
Policy DetailsA. Regulations to establish GHG performance and fuel efficiency standards (up to 15% overall reduction
in emissions performance of new engines and equipment in 2030 relative to established baselines) for new locomotives, off-road (i.e., construction, agriculture, mining, and forestry) engines and equipment, and domestic marine vessels » For domestic marine, 15% energy efficiency improvements for new vessels in 2030 compared to vessels
in the 2005-2015 baseline. » For off-road, 10% GHG emissions improvements for new engines by 2030 compared to 2017 model
year engines. » For domestic rail, 10-15% GHG emission reductions for new locomotives in 2030 compared to 2016
model year locomotives.
B. Continue to work with domestic aviation industry commitments under the Aviation Action Plan with potential to update commitments and accelerate where feasible the adoption in Canada of highly efficient airplanes. » International aviation CO2 standards for new commercial and business airplanes are expected to be
adopted internationally in 2016, and could inform new commitments. » The Action Plan could be updated upon agreement to do so with the membership.
C. Introduce funding/incentive programs for fuel saving retrofits or technologies for in-use equipment across all modes with benefits expected as follows: » For aviation, given the relatively modern fleet in operation, the overall fleet wide fuel reduction from
retrofits in 2030 is estimated to be minimal, in the range of up to 0.04% annually between 2016 and 2030 (~0.5% by 2030).
» For domestic rail, a fleet average improvement of up to 0.75-1.75% annually for locomotives between 2016-2030.
» For domestic marine, fleet average improvement of up to 1% annually between 2020 and 2030. » A variety of technological retrofits that can reduce GHG emission reductions could be eligible for
financial incentives (grants, tax preferences, low interest loans) to support owners and operators with improving in-use fleet performance.
» Funding/incentive programs could be initiated immediately

Working Group on Specific Mitigation Opportunities Final Report
128
» Introduce mandatory energy efficiency standards or retrofit requirements targeting equipment of a certain age/efficiency with the objective of driving upgrades and accelerating the phase-out of the oldest, highest emitting equipment. Equipment with retrofits already installed could be exempt.
» 30% energy efficiency improvements for new domestic marine vessels in 2030 compared to vessels in the 2005-2015 baseline.
» For domestic marine, mandatory energy efficiency standards for existing domestic vessels are implemented, in which the existing fleet is required to achieve 10-30% efficiency improvement by 2030.
» For domestic rail, fleet average annual energy efficiency improvements of 1.75-2.25% for locomotives between 2016-2030.
» For off-road, up to 20% GHG emissions improvements for new engines by 2030 compared to 2017 model year engines.
Options Est. reductions in 2030 Est. cost/tonne
A. Regulations for new vehicles/equipment 1-3 MT $0-$250
B. Voluntary aviation commitment N/A
C. Funding/incentives for retrofits 1-2 MT $0-$250
D. Regulations for in-use vehicles/equipment 2-3 MT $0-$>250
Note: emission reduction estimates are not cumulative. Options C and D are alternatives, i.e. they target the same emissions and so GHG reduction estimates cannot be added; this is reflected in the table on page 57.
ECONOMIC AND CONSUMER IMPACTS• Fuel accounts for a large share of operators’ operating costs (e.g., 18% for rail65) and fuel savings will
increase competiveness of companies. • Significant capital investments will be required, with payback periods varying and affecting adoption rates.
Consumers may face increased costs from companies passing through their capital investment costs. • The domestic industry that supplies vehicles or engines and technologies to these transportation sectors
may benefit from increased uptake of their products to meet energy efficiency standards.
CONSIDERATIONS
Indigenous perspectives:• Companies owned and operated by Indigenous groups (logging companies that have off road
equipment, shortline and regional railways) may be affected by this policy.• Indigenous people living in the North may also be affected by any increased costs associated
with new/existing off-road equipment, locomotives, airplanes and marine vessels, passed on by transportation operators.
Stakeholder perspectives:• Stakeholders have an interest in improving fuel economy, as fuel is one their largest operating costs.
Reductions in aviation, marine and rail modes are challenging as equipment is more capital intensive and fleet turnover is much slower.
• Stakeholders will want assurances that any proposed measures are compatible with international (air, marine) and/or North American approaches (marine, rail).
• Canada has worked collaboratively with aviation and rail industry stakeholders to reduce GHG emissions through voluntary agreements, establishing a solid base for further collaborative action.
65 RAC (2015), Railway Association of Canada, Rail Trends 2015.

Working Group on Specific Mitigation Opportunities Final Report
128Working Group on Specific Mitigation Opportunities Final Report
129
Co-benefits/negative impacts:• Would lead to reductions in air pollutant and black carbon emissions, in particular around hubs, ports
and urban populations, thereby improving public health. • GHG performance requirements in these areas may also generate technological spillovers to other industries
and private investment in research and development.• Fuel efficiency improvements can be associated with a rebound effect (greater use) although this is likely
to be small for these sectors.
Linkages with other working group areas and other proposed policies: • Improved operational efficiencies (T3), along with carbon pricing and reducing the carbon intensity
of fuels (e.g., deployment of biojet for aviation – see T10), are important complementary policies. • Equipment efficiency improvements will depend on technology development. Policy measures that support
research, development and deployment of emissions reduction solutions would be complementary. For instance, near term opportunities may exist to support pilot demonstrations of low-carbon advanced technology solutions where systems are being built (e.g., hydrogen powered “wireless electric” commuter rail).
• Development of a global market based measure (i.e. offsetting) for international aviation emissions could be expanded to domestic operations, with alternative ambitions, and drive GHG performance improvements in the domestic fleet across vehicles and engines and operational measures. Policy options to this effect are identified in policy option T3 – Energy efficiency in the aviation, rail, marine and off-road industrial sectors.
Regional impacts including northern and remote communities:• For the marine sector, Ontario, Quebec and British Columbia, account for the greatest share of domestic
marine emissions, and would be most impacted.• For the aviation sector, new airplanes would have the greatest potential impacts with smaller operators
servicing the North and remote communities where the average airplane in operation is over 30 years. • For the freight rail sector, Ontario, BC and the three prairies provinces would be primarily affected. Canada’s
passenger rail is dominated by the provinces of Ontario and Quebec thus impacts would be greater in those two regions.
• Northern and remote communities may also be impacted by any increased costs associated with new/existing off-road equipment (mining, forestry equipment).
Implementation, feasibility, technological and enabling infrastructure issues:• Companies are already actively retrofitting and renewing their fleet with efficient new equipment, limiting
the impact of new equipment requirements/commitments. Larger companies are generally earlier adopters than their small/medium counterparts.
• Most proven technologies are currently available to retrofit existing aircrafts, vessels, or locomotives. Financial support programs (e.g., grants, low interest loans) could support smaller transportation operators who may have less capital/experience/knowledge to undertake retrofits or adopt technologies as high capital costs associated with technological improvements hindered pace of implementation.
• For off-road sector, regulating new equipment based solely on the availability of engine optimization technologies is possible, but would take Canada out of regulatory alignment with the United States (and as a result, the cost efficiencies of a joint approach would not be realized).

Working Group on Specific Mitigation Opportunities Final Report
130
T6: Fuel Efficiency of On-road Vehicles
POLICY GOAL: Improve on-road fuel efficiency of the current vehicle fleet.
POLICY TOOLS: Regulations and enforcement to reduce driving speeds; funding for vehicle connectivity and automation; funding and incentives to improve driver behaviour; funding for road paving and maintenance.
Policy DetailsA. Increased enforcement of speed limits
» Could apply to heavy duty vehicles and/or passenger vehicles » For passenger vehicles, could be preceded by pilot projects in certain regions/corridors and/or at certain
times of day/year » Could leverage/incorporate ITS/GPS technologies and data from electronic toll collection » Could be implemented quickly to achieve reductions in the short term as soon as resources are
made available
B. Regulation requiring all trucks to install and activate speed limiting devices » Would apply to trucks travelling into or within Canada » Devices would be set at no more than 105 km/h. » Accompanied by increased enforcement on major highways » Timing would depend on the regulatory development process and design of the regulation » ON and QC already require speed limiters; could be expanded to other provinces to achieve reductions
in the short term.
C. Outreach and education programs to improve the efficiency of driver behaviour » Requiring eco-driving as a core curriculum for drivers’ education and licensing programs through
policy tools such as amendments to licensing requirement regulations » Incentives/rewards for increased usage of on-board monitoring technologies, e.g., rebate programs,
tax exemptions, reduced insurance rates » ecoDriving outreach campaigns targeted at experienced drivers » Could be implemented as soon as programs are developed;66 some existing programs should be leveraged
for faster implementation
D. Demand-based funding program to accelerate connectivity and automation in the Canadian transportation system. » To be eligible, a proponent would require government partnership » Eligible projects would include Intelligent Transportation Systems (ITS) such as smart roadway
infrastructure, and connected/-automated vehicle pilot deployments; capacity and skills building; and ITS/big data approaches to improve system efficiency
» Could start with pilot projects, followed by actual deployments in 3-5 urban centres » Pilot projects could be initiated as soon as a funding program is developed. Pilot projects have been
run in the US for a number of years in anticipation of expected requirement for new vehicles to include connectivity technology starting in 2018.
E. Demand-based funding program to expand the paved road network and increase maintenance of existing paved roads » To be eligible, a project would have to meet criteria linked to expected GHG reductions » Eligible projects would also include those that test the effects of pavement characteristics such
as roughness and macrotexture on vehicle fuel consumption » Projects could be initiated as soon as a funding program is developed
66 Typical program development is between 6 and 12 months depending on the complexity of the program. This would apply to all policy options where the timing is depending on program development.

Working Group on Specific Mitigation Opportunities Final Report
130Working Group on Specific Mitigation Opportunities Final Report
131
Options Est. Reduction in 2030 Est. cost/tonne
A. Increased speed enforcement 2-4 Mt1 $0-$50
B. Regulation requiring truck speed limiters 0-1 Mt2 $0-$50
C. Outreach and education programs <1 Mt3 $0-$504
D. Funding program for ITS deployment <1 Mt5,6 >$250
E. Funding program to increase paved roadways7 0-1 Mt $100-$250
Note: emission reduction estimates are not cumulative. There is some overlap between the above options, e.g., option C driver education may help reduce speeds and so could target some of the same emissions as option A. The potential for overlap has been taken into account in the GHG range in the summary table on page 57
1. U.S. Federal Highway Administration, GHG Handbook www.fhwa.dot.gov/environment/climate_change/mitigation/publications/ghg_handbook/ghghandbook.pdf
2. Transport Canada “Assessment of a Heavy Truck Speed Limiter Requirement in Canada” www.tc.gc.ca/media/documents/roadsafety/tp14808e.pdf
3. http://innovativemobility.org/wp-content/uploads/2015/07/Public-Education-on-Ecodriving.pdf
4. http://innovativemobility.org/wp-content/uploads/2015/07/Public-Education-on-Ecodriving.pdf
5. Barth, Matthew J., G. Wu and K. Borbiboonsomsin,“Intelligent Transportation Systems and Greenhouse Gas Reductions”, Current Sustainable/Renewable Energy Reports 2.3 (2015), 90-97, http://link.springer.com/article/10.1007%2Fs40518-015-0032-y
6. Pandazis, Jean-Charles and Andrew Winder. Study of Intelligent Transport Systems for reducing CO2 emissions for passenger cars. 10 September 2015. ERTICO-ITS Europe. http://erticonetwork.com/wp-content/uploads/2015/09/ITS4rCO2-Report-Final-2015-09-10-submitted.pdf
7. U.S. Federal Highway Administration, “Towards Sustainable Pavement Systems” Chapter 6 Use-Phase Considerations www.fhwa.dot.gov/pavement/sustainability/hif15002/chapters/hif15002_06.pdf
ECONOMIC AND CONSUMER IMPACTS:Economic impacts would mainly be related to reduced costs as well as potential clean sector opportunities:• On road efficiency measures are associated with reduced fuel costs as well as reduced operating
and maintenance costs for vehicles.• All of these measures are linked to improvements in congestion, productivity, and efficiency which
can have significant positive economic impacts.• For ITS and connected/automated vehicles there is potential for Canada to build on its expertise
in the automotive and ITS sectors and take a leadership role given a supportive environment. • Small fleet operators and owner-operators may avoid truck speed limit jurisdictions
CONSIDERATIONS:Stakeholder perspectives:
• The Canadian Trucking Alliance supports mandating activation of truck speed limiters
Co-benefits/negative impacts:• Improved road safety by increasing scope of defensive/anticipatory driving techniques, reduced speeds,
reduced collisions due to automated and connected vehicles, • All of the measures can be linked to improved air quality and associated population health impacts. • ITS and connected-automated vehicles can improve security by integrating wireless connectivity in freight
transportation (e.g. data-enhanced inspections, tracking of dangerous goods)

Working Group on Specific Mitigation Opportunities Final Report
132
Implementation, feasibility, technological and enabling infrastructure issues:• For outreach and education programs, provinces/territories would lead integration of eco-driving into driver
certifications and licensing. Support for installation of monitoring/feedback technology in vehicles will also be required
• For enforcement and regulations to limit speeds: » Speed limit enforcement challenges include limitations on uniformly reading and obtaining an accurate
assessment of the speed limiter settings » A pan-Canadian speed limit mandate would require a harmonized regulatory approach across
jurisdictions » Cost and practicability are both key considerations (e.g., photo radar would likely be the most cost
effective method but may not be supported in some jurisdictions) » Using ITS/GPS technologies or electronic toll collection data for enforcement may require complex
administrative and legislative changes, and may raise privacy concerns. » Need to examine implication that fuel savings costs could be offset by time costs. » There is potential to introduce a greater variance in vehicle speeds which could reduce safety. » There would likely be significant driver resistance.
• For ITS and connected-automated vehicles: » Would enable other complementary approaches, including road-tolling and enhanced intermodal
freight logistics » Would require development of codes, standards, and regulations for safety, communications,
and information security and privacy » Would require strong federal-provincial-territorial coordination and capacity-building, as well
as coordination with U.S. introduction timelines
• For increasing paved roadways: » Local impacts of increased congestion/traffic as traffic volume increases. » Should balance with modal shift to transit, active transportation, etc. » Differences between pavement types are not significant; more important for the fuel efficiency
are pavements in good condition with good surface characteristics67
T7. Freight Efficiency
POLICY GOAL: Reduce greenhouse gas emissions (GHG) from all modes of freight transportation (air, marine, rail and on-road and associated off-road vehicles and engines) by improving efficiency at hubs (ports, airports, rail yards, and transfer points) and across supply chains.
POLICY TOOL: Information sharing, financial incentives, investment in infrastructure, and pricing schemes
Policy DetailsA. Incentives to adopt best practices related to freight logistics and supply chain efficiencies
» Grants, tax incentives, municipal measures (e.g. parking/bylaws) that support private sector adoption of best practices
» Best practices would include off-peak delivery, load matching, loading procedures, packaging re-design, distribution centre relocation, improved network connections
» Complementary measures: establish an information exchange portal and network » Incentives could be provided immediately
67 Beuving et al., “Fuel Efficiency of Road Pavements”, Proceedings of the 3rd Eurasphalt and Eurobitume Congress Held Vienna, May 2004, p. 983-992, available online at: https://trid.trb.org/view.aspx?id=743829.

Working Group on Specific Mitigation Opportunities Final Report
132Working Group on Specific Mitigation Opportunities Final Report
133
» $100M+ in funding for infrastructure, equipment and logistics that facilitate intermodal transfers » Eligible projects could include improvements and modifications to infrastructure at intermodal rail
terminals and ports to facilitate faster, more efficient transfers of freight to less-carbon intensive modes (e.g. improved road access to intermodal terminals, barge facilities).
» Target 1%-2.5% shift of total freight truck tonne kilometers68 » Projects could be initiated as soon as funding programs are developed
B. Introduce a per-kilometre charge for on-road vehicles carrying heavy goods » Funds could be used towards repairing road damage and/or clean vehicle technologies69 » Would help encourage a shift to lower-emitting modes » Investments to install tracking technology (e.g., telematics) required to implement pricing » Pilot projects could be implemented quickly; wider deployment would not be feasible before 2020
These measures help reduce emissions by: » Improving logistics/supply chain efficiency (including improved network connections, load matching,
off-peak delivery, packaging and packing efficiencies), and » Facilitating the shift of freight transportation to more GHG efficient modes (i.e., marine and rail)
through investments in infrastructure, equipment and logistics. » Facilitating the shift of freight transportation to more GHG efficient modes through pricing mechanisms
that achieve more competitive equality across modes.
Options Est. reductions in 2030 Est. cost/tonne
A. Incentives for freight logistics and supply chain efficiencies
0-2 MT <$0
B. Funding to support modal shift 1-2 MT >$250*
C. Pricing - heavy goods vehicle per kilometre charge
0-1 MT $0-$100
Note: emission reduction estimates are not cumulative
* Extrapolated from the European Commission’s Marco Polo II program which ran from 2007 to 2013 with a budget of €450M (addition of private funding would bring investment to an estimated €900M) , achieving a reduction of 2.86Mt. The total freight tonne truck kilometers shifted through this program is estimated to be less than 0.7%. However, care should be taken in adapting assumptions based on European experience due to differences in infrastructure networks, policies, geography, and consumer/shipper preferences.
ECONOMIC AND CONSUMER IMPACTS• The freight industry is likely to achieve cost savings through logistics improvements; these savings
may be used to expand operations and/or could contribute to reducing the rate of growth of prices for consumer goods.
• The freight sector would also reduce fuel costs through shifts to lower emitting modes; however, these savings would likely be offset by increased cargo handling costs as the first and last kilometer of freight hauls will need to continue to be delivered by truck.
• Reduced traffic on roads avoids congestion and accidents and reduces travel time and pavement maintenance costs.
68 Opportunities for shifts would occur over medium- and long-distances. Other modes can begin to offer competitive alternatives at distances of over 500km.
69 For example, Germany introduced a toll on heavy goods vehicles to help achieve more competitive equality. Another 10 European countries (including Switzerland, Austria, and Poland) have also implemented heavy goods vehicle per-km charging to account for the damage that these vehicles cause to roads, reduce emissions, and raise revenues.

Working Group on Specific Mitigation Opportunities Final Report
134
• Encouraging a shift from truck to rail or marine will have an impact on labour needs in affected modes; the trucking industry is currently struggling to attract/retain drivers.
• Infrastructure projects create jobs and encourage growth in the local economy.
CONSIDERATIONS
Stakeholder perspectives:• The introduction of a heavy goods vehicle per kilometre charge would increase costs for on-road freight
transportation and is unlikely to be supported by the trucking industry, particularly if it is in addition to the existing International Registration Plan and a price on carbon. This fee would need to be established in consideration of the existing International Registration Plan.
Co-benefits: • Reduced air pollution and black carbon in major urban areas could contribute to important air quality
and human health benefits.
Linkages with other working group areas and other proposed policies: • Greater deployment and use of freight innovations including intelligent transportation systems and smart
corridors will provide better information to further improve the efficiency of freight logistics.• Carbon pricing, depending on the level and scope, could increase the incentive for companies to improve
their freight logistics and further reduce fuel consumption.
Regional impacts including northern and remote communities: • The majority of investments and improvements are expected to occur in urban centres; impacts on
Northern, rural and remote communities are expected to be minimal. • Depending on the location of the investments, the impact on regions would be different:
» Support for short-sea shipping could see investment in ON, QC, BC, and in the Atlantic provinces; » Choice of location for investments in small centre intermodal terminals could benefit the regions where
they are located.
Implementation, feasibility, technological and enabling infrastructure issues: • Infrastructure investments to induce mode shift would involve improvements at intermodal connection
points that would allow for freight to be transferred from one mode to another, as well as improvements to address choke points in existing infrastructure networks.
• A high level of coordination between the many players involved in a supply chain will be necessary to achieve reductions.
• Price is one of many factors that influence a shipper’s mode choice. A government policy package that successfully induces modal shift would need to address shipper considerations such as:
» Modal characteristics (e.g., capacity, trip time, reliability, equipment availability, seasonal availability) » Commodity characteristics (e.g., shipment size, package characteristics, shipment value, shelf life) » Shipper and receiver characteristics (e.g., access to modes) » Logistics costs (e.g., order and handling costs, inventory costs, service reliability costs, fuel costs) » Other (e.g., length of haul, shipment frequency, environmental/sustainability)
• Because of the considerations listed above, the fraction of total freight truck tonne kilometers that can be shifted to more efficient modes is limited.

Working Group on Specific Mitigation Opportunities Final Report
134Working Group on Specific Mitigation Opportunities Final Report
135
• The potential for mode shift initiatives to reduce emissions depends heavily on the capacity utilization of the lower-emitting modes. Trains and ships would need to be significantly filled in order to realize reductions; consolidating such a shipment would be logistically complex and could increase the transport times, making multi-modal shipping options less attractive.
• Supply chains are highly fluid. The use of investments and market signals to support modal shift could instead result in a realignment of supply chains, making estimating emission reductions challenging.
• A heavy goods vehicle kilometre charge would require investment in electronic technology/sensors to identify and bill vehicles and companies. Information privacy concerns would need to be identified and addressed.
T8: Changing transportation usage patterns
POLICY GOAL: Reduce on-road GHG emissions through Transportation Demand Management (TDM) programs that reduce single passenger vehicle travel demand and provide more sustainable public transportation options.
POLICY TOOL: Require that municipalities or provinces develop and implement urban TDM plans which include policies and programs to encourage low-carbon transportation options or reduce transportation demand.
Policy Details• TDM is most effective when implemented through an integrated policy package that includes both pull
strategies (“carrots”) and push strategies (“sticks”) coupled with effective social marketing70. These policies have synergistic effects. For example, two individual policies –improving public transit and increasing parking prices – may each reduce vehicle trips by 5% if implemented separately, but combined they may reduce trips by 25%71.
• The following policies would be central components of any urban TDM plan. Most of these policy options could begin implementation as soon as resources are made available
A. Shift vehicle passengers to public transit and active transportation through:i. Investments in public transit
y Eligible projects would include expansion and frequency (e.g. bus rapid transit), access and system improvements (e.g. transit priority lanes, transit signal priority systems, optimizing bus routes, control systems, queue jumps, etc.), and enhanced services (e.g., electronic payment systems, amenities at stations, real-time schedules)
y Target increase in public transit modal share by 15%-50% by 2030 ii. Investments in active transportation networks
y Eligible projects would include cycling and walking infrastructure y Target increase in active transit modal share by 15%-50% by 2030
iii. Complementary measure: urban planning strategies y Help reduce average trip distance and promote mode shift for residents
B. Reduce overall urban on-road vehicle kilometres travelled (by 2-5% in 203072) by encouraging increased vehicle occupancy and trip avoidance through, for example:i. Conversion of highway lanes to high occupancy vehicle (HOV) and high occupancy toll (HOT) lanes
(e.g., Ontario plans for HOV and HOT lanes on provincial highways in urban centres)
70 Habibian, et al. Exploring the role of transportation demand management policies’ interactions, 2011
71 Engel-Yan and Hollingworth, Putting Transportation Emission Reduction Strategies in Perspective: Why Incremental Improvements Will Not Do, 2008
72 Range consistent with similar bundle of measures analyzed in Urban Land Institute’s 2009 Moving Cooler report, and Hickman and Banister’s 2006 report for UK Department of Transport.

Working Group on Specific Mitigation Opportunities Final Report
136
ii. Incentives for carsharing, carpooling and ride sharing, including: y Preferential parking spaces and rates for carpool (high occupancy) vehicles y Free, dedicated on-street parking for carshare vehicles y Promoting/requiring employer TDM programs/initiatives (teleworking, compressed work week).
For example, increase employer-based TDM programs by 25 – 50%73 or requiring large urban service-sector employers to have TDM strategies74.
C. Funding for the infrastructure and/or equipment to develop high frequency/performance rail in key strategic corridors to reduce emissions from inter-city personal vehicle trips and short domestic flights through, for example, Toronto-Ottawa-Montreal, and Calgary-Edmonton75. Infrastructure investments could begin immediately; emissions reductions would be realized upon completion of the rail corridors.
Options Est. reductions in 2030 Est. cost/tonne*
A. Shift vehicle passengers to public transit and active transportation
i. Funding for public transit 0-1 MT $100-$250
ii. Funding for active transportation <1 MT
iii. Urban planning strategies N/A
B. Reduce vehicle-kilometres travelled:
i. HOV and HOT lanes 1-2 MT >$250
ii. Incentives for car sharing <$0
iii. Employer TDM <$0
C. Funding for high frequency/performance rail <1 MT >$250
Note: emission reduction estimates are not cumulative
* Based on studies or literature : “Moving Cooler: An Analysis of Transportation Strategies for Reducing Greenhouse Gas Emissions” report”, Urban Land Institute (2009)
ECONOMIC AND CONSUMER IMPACTS• Inefficient urban transport systems lead to many costs, including excessive traffic congestion, road
and parking facility costs, traffic accidents, consumer costs, and inadequate mobility for non-drivers. TDM can help solve these problems by increasing overall transport system efficiency.
• TDM strategies can reduce the need for new or widened roads, diminish the social costs of car use, and increase the return on investments in transit (bus and rail), walking, cycling and carpooling.
• Increased active transportation would have a spin-off benefit of increasing physical activity levels, and reducing chronic disease costs. Direct health care costs from physical inactivity were estimated to be $2.4 billion in 200976
73 http://scholarcommons.usf.edu/cgi/viewcontent.cgi?article=1580&context=etd
74 Urban Land Institute, Moving Cooler, 2009
75 www.apta.com/resources/reportsandpublications/Documents/HPPR-Cost-of-Inaction.pdf
76 Janssen, I. Health care costs of physical inactivity in Canadian adults (2012) Applied Physiology, Nutrition and Metabolism, 37 (4), pp. 803-806.

Working Group on Specific Mitigation Opportunities Final Report
136Working Group on Specific Mitigation Opportunities Final Report
137
CONSIDERATIONS
Co-benefits/negative impacts:• Implementing TDM takes time and resources but can contribute to the creation of healthy built
environments by incorporating the principles of appropriate land use density, diversity and network connectedness.
• Communities will experience a number of benefits, including greater return on investments in transit, walking, cycling and carpooling facilities; cleaner air and associated health benefits; less noise and traffic congestion; improved road safety, improved quality of life with more walkable and age friendly communities
• Employers will experience benefits such as easier employee recruitment, better employee retention, less need for parking spots, improved productivity
• Individuals will experience greater transportation choice and convenience, time and cost savings, better health and fitness,
Linkages with other working group areas and other proposed policies: • The Government of Canada announced in Budget 2016 $3.4 billion in public transit investments over
three years, starting in 2016–17, to be provided through a new Public Transit Infrastructure Fund.• The Government of Canada offers a non-refundable tax credit at the lowest personal income tax rate
for the cost of monthly public transit passes or passes of longer duration.• This policy package is linked to a number of other policies, including B8 - Urban form and spatial
planning and carbon pricing, which would increase the cost of carbon-intensive travel. It is also linked to T9 Reducing congestion and vehicle-kilometres travelled since reducing road vehicle travel is integral to achieving optimal emission reductions through a TDM policy.
• Other measures such as the imposition of market-based parking fees (e.g., San Francisco), differential rates or discounts for carpool or vanpool parking (green lanes), or transit pricing management can function to reduce the number of single occupant trips by increasing the travel cost of driving alone or decreasing the travel cost of alternative modes.
Regional impacts including northern and remote communities:• These policies are significantly less effective in small and remote communities. However,
individual components of a comprehensive urban TDM strategy could still have a place in such communities – particularly car/ride sharing and teleworking.
Implementation, feasibility, technological and enabling infrastructure issues:• Transport Canada, Canadian Institute of Planners (CIP), Federation of Canadian Municipalities, public
health agencies, and many cities and communities have developed guidance documents and materials to support development of community-specific TDM strategies.
• Requiring the preparation/implementation of TDM plans as a condition of various federal and provincial infrastructure and capital funding (gas tax etc.) is a feasible and reasonable expectation. Measuring the effectiveness of such plans is important to ensure additional and sustained GHG reductions.
• Federal funding for public transit could incorporate climate criteria such as: achieve the greatest GHG reductions and at the lowest cost, encourage high-density development, ensure adequate operation and maintenance funding to maintain quality of public transit and support the electrification of transit.
• Funding required to develop a high-frequency passenger rail corridor is not determined but could be significant, given a total estimated cost of $4B including infrastructure (dedicated track), and rolling stock, and electrification elements.

Working Group on Specific Mitigation Opportunities Final Report
138
T9: Reducing congestion and vehicle-kilometres travelled
POLICY GOAL: Reduce the total on-road kilometers traveled and/or avoid the use of higher GHG emitting travel
POLICY TOOLS: Economic instruments: pricing mechanisms, fees, taxes and other financial tools
Policy DetailsA. Road use pricing based on vehicle-kilometres travelled (VKT)
» Would apply to passenger and commercial vehicles, with exemptions (e.g. emergency vehicles, waste services, zero-emission vehicles)
» Rates could start at $0.01/km in 2020, and increase over time » Would require funding and/or incentives for installation of tracking technologies
B. Strategy to increase pay-as-you-drive (PAYD) insurance policies to 30% of all policies by 2030 » Require all insurance companies to offer and promote PAYD policies » Timing would depend on the regulatory development process; pilot projects could start immediately
on voluntary agreement with insurance companies
C. Urban congestion pricing » Fees charged for entering certain areas, with higher rates during peak traffic periods (e.g. 6-9am, 3-6pm)
and lower off-peak rates » Different fees depending on approach, e.g. fee for entering Toronto city centre could range depending
on time of day (e.g., flat rate of $20.92 in London, UK, during peak rush hours) » Would apply to passenger and commercial vehicles, with exemptions similar to road use pricing » Pilot projects could be initiated immediately.
D. Variable vehicle registration pricing based on vehicle emissions rating » Levied annually or at time of sale, based on standard vehicle class ratings » For example, variable charges could be applied to annual vehicle licence plate sticker renewals (current
price for all passenger vehicles in Southern Ontario is $108), with lower rates for ZEVs and higher rates for high emitting vehicles.
» Timing would depend on the regulatory development process.
E. Variable vehicle excise taxation based on vehicle emissions rating » Modifications (scope or rate) to existing vehicle excise taxes (e.g., the Federal Tax on Fuel Inefficient
Vehicles, also known as the Green Levy) according to vehicle emissions rating » One-time tax rates could range from $0 for ZEVs to $4,000 or more for the highest emitting vehicles. » Timing would depend on the regulatory development process and design of the regulation; existing excise
taxation could be leveraged for faster implementation.
F. Financial incentives (e.g., grants, tax preferences, low interest loans) to accelerate fleet turnover » Focus on increasing ZEVs and other fuel efficient vehicles and engines. » Applicable to business/commercial vehicles only, likely small costs.
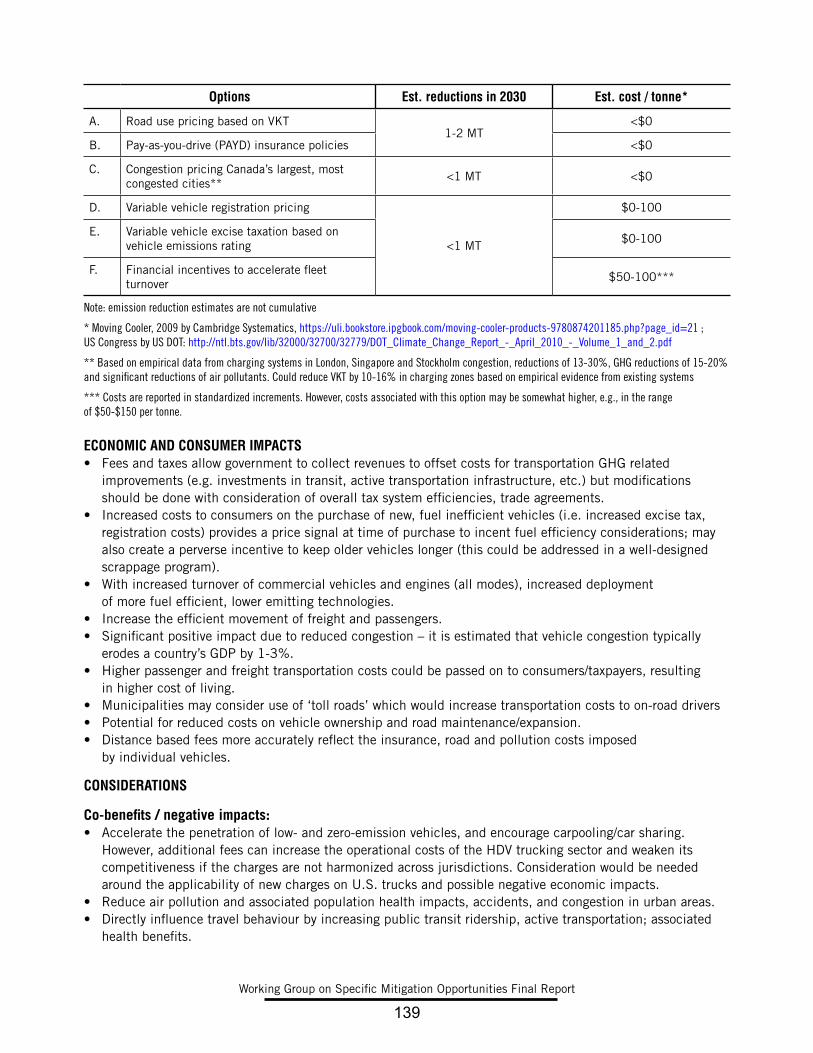
Working Group on Specific Mitigation Opportunities Final Report
138Working Group on Specific Mitigation Opportunities Final Report
139
Options Est. reductions in 2030 Est. cost / tonne*
A. Road use pricing based on VKT1-2 MT
<$0
B. Pay-as-you-drive (PAYD) insurance policies <$0
C. Congestion pricing Canada’s largest, most congested cities**
<1 MT <$0
D. Variable vehicle registration pricing
<1 MT
$0-100
E. Variable vehicle excise taxation based on vehicle emissions rating
$0-100
F. Financial incentives to accelerate fleet turnover
$50-100***
Note: emission reduction estimates are not cumulative
* Moving Cooler, 2009 by Cambridge Systematics, https://uli.bookstore.ipgbook.com/moving-cooler-products-9780874201185.php?page_id=21 ; US Congress by US DOT: http://ntl.bts.gov/lib/32000/32700/32779/DOT_Climate_Change_Report_-_April_2010_-_Volume_1_and_2.pdf
** Based on empirical data from charging systems in London, Singapore and Stockholm congestion, reductions of 13-30%, GHG reductions of 15-20% and significant reductions of air pollutants. Could reduce VKT by 10-16% in charging zones based on empirical evidence from existing systems
*** Costs are reported in standardized increments. However, costs associated with this option may be somewhat higher, e.g., in the range of $50-$150 per tonne.
ECONOMIC AND CONSUMER IMPACTS• Fees and taxes allow government to collect revenues to offset costs for transportation GHG related
improvements (e.g. investments in transit, active transportation infrastructure, etc.) but modifications should be done with consideration of overall tax system efficiencies, trade agreements.
• Increased costs to consumers on the purchase of new, fuel inefficient vehicles (i.e. increased excise tax, registration costs) provides a price signal at time of purchase to incent fuel efficiency considerations; may also create a perverse incentive to keep older vehicles longer (this could be addressed in a well-designed scrappage program).
• With increased turnover of commercial vehicles and engines (all modes), increased deployment of more fuel efficient, lower emitting technologies.
• Increase the efficient movement of freight and passengers.• Significant positive impact due to reduced congestion – it is estimated that vehicle congestion typically
erodes a country’s GDP by 1-3%.• Higher passenger and freight transportation costs could be passed on to consumers/taxpayers, resulting
in higher cost of living.• Municipalities may consider use of ‘toll roads’ which would increase transportation costs to on-road drivers• Potential for reduced costs on vehicle ownership and road maintenance/expansion.• Distance based fees more accurately reflect the insurance, road and pollution costs imposed
by individual vehicles.
CONSIDERATIONS
Co-benefits / negative impacts:• Accelerate the penetration of low- and zero-emission vehicles, and encourage carpooling/car sharing.
However, additional fees can increase the operational costs of the HDV trucking sector and weaken its competitiveness if the charges are not harmonized across jurisdictions. Consideration would be needed around the applicability of new charges on U.S. trucks and possible negative economic impacts.
• Reduce air pollution and associated population health impacts, accidents, and congestion in urban areas.• Directly influence travel behaviour by increasing public transit ridership, active transportation; associated
health benefits.
Working Group on Specific Mitigation Opportunities Final Report
140
• Road pricing options can have higher financial burdens for low-income households and those without alternatives; possible need for mitigating these impacts through policy design.
• Lower total fuel consumption resulting from higher transportation cost could negatively affect employment in petroleum refining, distribution and retailing sector but support Canadian businesses in fields focused on advanced transportation technologies and telematics, alternative modes and public transit, cleaner vehicles and transportation demand management.
Linkages with other working group areas and other proposed policies:• Carbon Pricing: Congestion pricing affects the choice of time and location of driving, while carbon pricing
affects the choice of the amount and type of fuel used.• With a high enough carbon price, road use pricing may not be required• Adjustments to vehicle taxes based on emissions performance can complement other vehicle incentives
(e.g., manufacturer regulations, electric vehicle rebates, low carbon/renewable fuel standards, and vehicle replacement/scrappage programs).
• PAYD insurance policies are complementary with connected vehicles (CV being an enabling technology for road-toll/usage-based insurance schemes).
Regional impacts including northern and remote communities:• Congestion pricing is designed for large cities, while VKT taxes can be implemented in virtually all areas.
These tools can contribute to urban densification and modal shifts. In order to encourage such modal shift it is imperative alternative options are in place such as public transit.
• For VKT taxes consideration would be needed to ensure rural/remote community drivers (larger distances where alternatives to driving are limited) are not adversely impacted.
• Reduced private vehicle traffic can help improve urban land use and dedicate more road space to sustainable transportation infrastructure (e.g. cycling lanes).
• Emission performance based vehicle taxes tend to have relatively higher impacts on remote or northern communities as light-trucks account for a higher share due in part to climate and road conditions.
Implementation, feasibility, technological and enabling infrastructure issues:• Care should be taken to design these measures, and where possible, build upon existing policies,
regulations and fees, to reduce the administrative complexity. • Congestion pricing would require investment in electronic technology/sensors to identify and bill vehicles
and drivers. VKT charging and PAYD insurance can require installation of telematics devices to record driving time, distance, and location. On-board technologies used for distance-based charging systems have potential cyber-security implications that may need to be addressed. Privacy and public acceptability concerns will need to be addressed. Public acceptability and political leadership to pilot such systems may be more significant barrier than technology readiness.
• The existing “green levy” imposes an excise tax on vehicles that consume more than 13L/100 KM but does not apply to pickup trucks or vans with ten or more seats. Modifying the existing system for vehicle excise taxes based on emissions performance would involve some administrative cost (and potentially mandating vehicle labelling for all new and existing on road vehicles).
• Such policies have the potential to encourage people to use alternatives to driving (e.g., public transit and active transportation), and/or generate significant revenues that could be used for highway maintenance, reconstruction and upgrading the technologies (e.g. electronic charging systems). Their impact would be optimized through parallel improvements to public transit and active transportation systems.
• While fees and taxes can be phased-in gradually to avoid unnecessary shocks to the economy, new charges to road users (who currently have free access to the roads) would be expected to face public acceptance challenges.

Working Group on Specific Mitigation Opportunities Final Report
140Working Group on Specific Mitigation Opportunities Final Report
141
• Congestion pricing has seen notable success in European cities (e.g. London and Stockholm77), while VKT charging pilots are underway in Oregon78 and California. Experience in the U.S. shows that establishing a national VKT requires further study and analysis.
• Enabling legislation may be required to implement congestion/road pricing. • Multiple technologies have been proven for such mechanism, creating flexibility in implementation.
T10. Increased Availability and Use of Low Carbon Fuels in the Domestic Marine, Rail and Aviation Sectors
POLICY GOAL: Accelerate low carbon fuels uptake in the domestic marine, rail and aviation sectors. For marine and rail, the most promising fuels are drop-in renewable diesel, liquefied natural gas and potentially biodiesel. For aviation, biojet fuel is the only opportunity, although it can be produced in different ways.79
POLICY TOOL: Regulations and Incentives
Marine and RailA. Adopt a low carbon fuel standard for the domestic marine and rail sectors
» Require 10% life cycle carbon intensity reduction of the fuel used in vessels and locomotives in 2030 relative to 2020 (starting year).
» This would be done through regulatory fuel demand measures (e.g., B.C. Low Carbon Fuel Requirement Regulation) coupled with specific fiscal incentives (e.g., producer incentives, infrastructure programs, LCFS credit banking and trading, etc.) to address the cost of low carbon fuel production and distribution infrastructure deployment.
AviationB. Develop a low carbon fuel framework specifically for the domestic aviation sector
» Implement measures to increase the blend of biojet to 1% of the domestic jet fuel demand in 2020 and to 5% of the domestic jet fuel demand in 2030.
» This would be done through regulatory fuel demand measures coupled with specific fiscal incentives to address the capacity to develop and produce low carbon fuel, cost of production, and distribution infrastructure deployment.
Options Est. reductions in 2030 Est. cost/tonne**
A. Low Carbon Fuel Standard for marine and rail 1-2 Mt $100-$250
B. Low Carbon Fuel Framework for aviation <1 Mt $100-$250
* Based on preliminary industry estimates and experience. Though higher longer term benefits – with domestic fuel/energy production – may reduce cost to below zero.
ECONOMIC AND CONSUMER IMPACTS:• The impacts will depend on future fuel prices, and the price differential between fossil fuels and
the low carbon fuels under consideration.• The impacts on the broader economy (including manufacturing and agriculture sectors) will depend on
whether the feedstocks used to produce the low carbon fuels will be Canadian and where the low carbon fuels will be produced (domestically or imported).
77 International Council on Clean Transportation, April 2010 “Congestion Charging: Challenge and Opportunities”
78 www.myorego.org/
79 Biojet from hydro-processed esters and fatty acids (HEFA) and HDRD processes are the most likely candidates on a short/medium term basis with drop-in biojet fuel (Hydrotreated Depolymerized Cellulosic Jet – HDCJ) being actively pursued as a medium/long term objective. Other technology pathways are also in the process of receiving ASTM approval and could also become competitive with adequate RD&D funding.

Working Group on Specific Mitigation Opportunities Final Report
142
• The type of feedstock-technology platform selected will greatly influence this decision and the size of the economic impact and employment benefits.
• Important economic benefits could be expected with domestic fiscal support for low-carbon fuel production. Fiscal incentives would need to be used judiciously in order to promote Canadian production rather than subsidizing the importation of biofuels, especially with a 2020 start.
• When considering GHG reductions, a life-cycle analysis of fuel production should be considered to ensure all emissions are taken into account.
CONSIDERATIONS:
Regional impacts including northern and remote communities:• In the absence of an adequate fiscal environment to level the playing field between low carbon fuels and
their fossil counterparts, increased costs of fuels could be expected overall that could have an impact on Indigenous people and remote communities; however, this can be overcome via targeted fiscal measures for these communities.
• Domestic low carbon fuel production could provide a much needed economic growth for these communities if plants are built in those regions.
• Feedstock supply, access to hydrogen and other inputs, and market access for co-products are important variables that can greatly influence the location of new biofuel production plants. In addition, potential land use impacts associated with an increased use of crop-based or forest feedstock would need to be performed for different biofuel volume scenarios.
Implementation, feasibility, technological and enabling infrastructure issues:• Policy options could be integrated into a much larger LCFS framework covering all modes of transportation,
including on and off-road.• Because locomotives, ships and airplanes operate across national boundaries, international cooperation
and harmonization on LCFS should be pursued.• For rail and marine, the structure of shared trade and operating areas with the U.S. means that at minimum
a bilateral framework is needed to avoid leakage in face of regulation.• For the international maritime and in particular for the international aviation sector separate treatment
may be needed as international initiatives led by the International Maritime Organization (IMO) and the International Civil Aviation Organization (ICAO) may have a significant impact on the ultimate policy option chosen for these sectors.
• In order to enable domestic low carbon fuel production and distribution infrastructure deployment, a strong enabling fiscal environment is needed (e.g. adequate carbon pricing, financial incentives such as grants, tax preferences, low interest loans, etc.) as well as continued support for research, development and demonstrations (e.g. to support codes and standards, optimization of production pathways and cost reductions). Without domestic support, significant volumes of low carbon fuels would likely be imported.
• A progressive fuel tax based on carbon content could be put in place (e.g. a higher tax rate on diesel) to address the price differential.
Issues specific to marine and rail:• HDRD use in the rail and marine sectors can be implemented now and do not necessitate any
infrastructure changes as it is a drop-in fuel; biodiesel may have some operability/engine warranty issues at higher blends (more than T5) and in extreme cold weather conditions.
• For liquefied natural gas (LNG, including renewable LNG), R&D funding or financial incentive programs could support local rail and marine industries to convert existing vessels and locomotives to accept low-carbon fuels or to purchase new low-carbon fuel vessels or locomotives. Infrastructure funding/programs that can improve low-carbon fuel (LNG and RLNG) infrastructure and supply chain (such as delivery system and bunkering facilities, shore power) are also needed.

Working Group on Specific Mitigation Opportunities Final Report
142Working Group on Specific Mitigation Opportunities Final Report
143
• There would be air quality co-benefits associated with the use of all low carbon fuels (e.g. use of LNG in engines will produce much lower levels of NOx and particulate matter compared to diesel locomotives-even considering Tier 4 locomotives).
Marine stakeholder perspectives:• The International Maritime Organization (IMO) is currently considering measures to improve energy
efficiency and reduce greenhouse gas emissions from international maritime shipping. Stakeholders are concerned that regional GHG measures could generate market distortions. Therefore, industry may be concerned if Canada unilaterally pursued GHG measures if those efforts were perceived as creating market distortions.
• Canadian-flagged vessels operating on international routes would need to comply with international agreements implemented by IMO. Canada has, in the past, applied IMO requirements to certain Canadian vessels that do not operate internationally, including Great Lakes ships that visit U.S. and/or Canadian East Coast ports. Regulatory exceptions are made where appropriate.
Issues specific to aviation:• There is no existing biojet production in Canada, and a number of different biojet pathways
are under development.• Canada has existing sources of feedstock (e.g. forest and agricultural residues, canola, camelina, B.
carinata, etc.) and potential to produce HDRD, HEFA and, in the medium/longer term HDCJ biojet. Note that for camelina and B. carinata, supply chains need further development and the supply of these crops would have to be significantly increased. Recycled oils and animal fats could be another source of feedstock if quality specifications could be met.
• With the appropriate policies, market signals, and investments, domestic production could be established to produce the volumes of biojet (~350 ML) targeted for 2030. A financial assessment of biojet fuel import versus domestic biofuel fuel production as well as implications for the agriculture and forestry sectors need to be completed for the different feedstock-technology pathways.
• Work is currently underway in the international aviation community to develop a harmonized approach to feedstock sustainability. To ensure public acceptance and eligibility of Canadian produced biojet in greenhouse gas reduction schemes internationally, Canada’s forestry and agricultural practices must be reflected in these sustainability definitions and criteria.
Aviation stakeholder perspectives:• The International Civil Aviation Organization (ICAO) is currently developing a market-based measure for
international civil aviation. Under the system Canada’s airlines operating internationally would need to comply starting in 2021. As each litre of biojet fuel would only be able to comply with one of the systems, if the international costs for compliance are higher, available fuel would be used by airlines to meet their international obligations.
• The National Airlines Council of Canada submitted detailed recommendations to the Minster of Environment and Climate Change. Their recommendations focus on continuing to pursue the actions laid out in Canada’s Action Plan to Reduce Greenhouse Gases from Aviation, the introduction of “smart” carbon pricing mechanisms, and support for the development of renewable aviation fuel industry in Canada.
Working Group on Specific Mitigation Opportunities Final Report
144
Built Environment
B1 Net- Zero Ready Codes for New Housing
POLICY GOAL: Reduce emissions from the new home sector
POLICY TOOL: Regulations
Policy Details• Reduce emissions from new homes through more energy efficient buildings.• ‘Net-zero ready’ homes only use as much energy as they could produce from renewable energy.• The policy would require authorities having jurisdictions (e.g. provinces/ territories/ municipalities) to adopt
“net zero ready codes” supported by a model National Building Code. Roof top orientation, tree cover, and regional sun exposure may not allow all ‘net-zero ready’ homes to produce sufficient energy to reach ‘net-zero’ performance level.
Ambition A: Increase the energy requirements in building codes and the National Building code to reach ‘net zero ready’ by 2030• Coverage: All new low-rise residential housing starts.• Roll-out: Adoption of new building codes by authorities having jurisdiction that increase the energy
performance of new home construction to net-zero ready by 2030, representing an average energy use reduction of approximately 40% relative to the 2012 model national code (exact percentage varies by climate zone). Model National Building Codes would provide a three-stepped roadmap to net-zero ready.
• Enabling Measures:
» Mandatory labelling of new homes to communicate benefits of high performance code, using a robust national energy rating system such as EnerGuide.
» Training and capacity building of industry professionals and compliance officials. » RD&D (research, development, demonstration) to lower incremental costs and improve cost per tonne. » Accelerated national adoption by authorities having jurisdiction through a common roadmap that
includes Model National Building codes.
Ambition B: Increase the energy requirements in building codes and the National Building code to reach ‘net zero ready’ by 2025• Coverage: All new low-rise residential housing starts• Roll-out: As per Ambition A, but with adoption accelerated to 2025. Model National Building Codes
would provide a two-stepped roadmap.• Additional Enabling Measures beyond Ambition A:
» De-coupling energy performance from other building code elements to facilitate accelerated adoption. » Exploration of incentive programs to accelerate market acceptance in advance of code adoption
(not costed in this option).

Working Group on Specific Mitigation Opportunities Final Report
144Working Group on Specific Mitigation Opportunities Final Report
145
Options Est. reductions in 2030 Est. cost/tonne*
A. Increase energy efficiency requirements in building codes and the National Building code to reach ‘net zero ready’ by 2030
4 MtElect: <$0
Natural Gas: >$250 Oil: $0-50
B. Increase the energy efficiency requirements in building codes and the National Building code to reach ‘net zero ready’ by 2025
5 MtElect: <$0
Natural Gas: >$250 Oil: $50-100
*Note: cost/tonne will vary widely by region; estimates do not consider the potentially significant value of avoided generation/transmission investments to electricity utilities and natural gas distributors.
ECONOMIC AND CONSUMER IMPACTS• This option would drive transformational change – gradually moving the building stock to the high levels
of efficiency needed for greater emissions reductions in the longer term (e.g., 2050)• Incremental cost for net-zero ready homes is up to $20,000, increasing a 25 year mortgage by $90/month.
Improved performance will decrease operating costs by $20 to $60 per month depending on the heating fuel and regional energy rates.
• Compliance and enforcement will lead to new code-related jobs across the country.• Unique needs of northern regions will need to be reflected in northern-specific building code considerations.
These include both higher construction costs but also additional energy savings from practices such as super-insulation.
• Ambition B (2025) would require substantial support and training for PTs, municipalities and the construction industry to achieve. Code development can be time consuming and it can sometimes take jurisdictions several years to adopt model codes. Limiting time for training will risk raising construction costs and create quality assurance issues without substantial support.
CONSIDERATIONS
Indigenous Perspectives• Input from the AFN recommends building codes should allow for housing solutions for Indigenous
communities that reflect Indigenous culture in design (e.g., circular, modular, portable, even if uninsurable) and allow for tiny homes that are energy efficient, as well as for constellations of tiny homes for extended families.
Linkages with other working group areas and other proposed policies: • Aligns with Canadian Energy Strategy (CES) 1.3.1 (codes)• New building codes could include provisions to facilitate future installation of an electric vehicle charging
system. • In regions that use clean electricity for space and water heating, policy will help moderate demand
on the grid, but won’t achieve GHG savings.• CMHC Equilibrium Housing research showed that net-zero ready homes still use considerable energy
based on occupant behaviour (e.g. number of televisions and hot water usage). Demand management and behavioural change are necessary complementary measures.(B7)
Implementation, feasibility, technological and enabling infrastructure issues:• Proposed performance levels are feasible using existing technology and are the current building code
requirements in jurisdictions such as Brussels, Belgium.• Developing all model building code steps at the same time would provide better regulatory certainty
and allow early adopters to use them as stretch codes.• Home labelling programs such as ENERGY STAR® or a Canadian version of Passive House would
help builders prepare for future increases to building code requirements.

Working Group on Specific Mitigation Opportunities Final Report
146
• New codes would need to be accompanied by significant training programs for builders as well as strong performance-based compliance verification. It is more effective for code compliance to be verified through a performance path (such as an EnerGuide energy evaluation) to confirm performance rather than a prescriptive checklist.
• Lessons learned in new home construction will spill-over into the existing renovation market.• Carbon intensity targets could be included to promote low carbon materials and construction alternatives,
giving greater consideration to embodied energy in construction.• Funding demonstration communities would showcase technology, tools, and solutions.• Adoption of new construction practices can be accelerated through capacity building mechanisms such
as Local Energy Efficiency Partnerships (LEEP).• Scalability: emission reduction potential limited to the number of national housing starts.
B2 Existing Housing
POLICY GOAL: Increase energy efficiency of existing residential housing stock
POLICY TOOL: Financial incentives (e.g., grants, tax preferences, low interest loans) and regulations
Policy Details
Ambition A: Financial incentive (e.g., grant, tax preference, low interest loan) to reduce energy use of existing low-rise housing sector by 1.5% (22 PJ) though voluntary shallow retrofits to 1 million homes• $750 - $1,000 incentive to leverage $5,000 investment (e.g., total incentive cost $750M to $1B)
Incentives would need to be substantially adjusted for low-income homes and social housing (80%-100% of costs in most existing programs). The financial incentive is scaled down from the $1,400 average grant of the 2007-2012 ecoENERGY Retrofit-Homes program, given that the policy option targets lower average energy savings and a smaller homeowner investment.
• Measures would focus on most affordable envelope retrofits. Heating systems would be excluded as many will reach the end of their service life and be replaced before 2030. Replacement equipment performance could be regulated separately (B5).
• Roll-out: Program would target 50,000 homes in year 1, ramping up to 200,000 per year.• Enabling Measures:
» A robust national rating system such as EnerGuide. » Training and quality assurance for building professionals. » Exploration of a turnkey renovation program that provides retrofit advice, helps with product selection,
and pre-qualifies contractors, to overcome obstacles to homeowner participation such as lack of knowledge and time needed for project coordination.
Ambition B: Financial incentive (e.g., grant, tax preference, low interest loan) to reduce energy use of existing low-rise housing sector by 4% (58 PJ) through the voluntary deep retrofit of 1 million homes.• Financial incentives: $4,000 - $5,000 incentive to leverage $30,000 homeowner investment. Total cost
of incentives $4-5 Billion. Incentives would need to be substantially adjusted for low-income homes and social housing (80%-100% of costs in most existing programs). The financial incentive is scaled up from the $1,400 average grant of the 2007-2012 ecoENERGY Retrofit-Homes program. The policy option targets higher average energy savings and greater homeowner investment.
• Roll-out: Incentive program(s) could run for 10 years at average of 100,000 total participants per year.

Working Group on Specific Mitigation Opportunities Final Report
146Working Group on Specific Mitigation Opportunities Final Report
147
• Enabling Measures: » A robust national rating system such as EnerGuide. » Authorities with jurisdiction would require mandatory energy labelling at time of sale and inclusion
in real estate listings to inform home buyers of energy performance. Mandatory labelling of all houses highlights weak and strong performers and encourages retrofits.
» Regional legislation that allow authorities with jurisdiction to require mandatory home labelling.
Ambition C: Regulation/Loan Program to reduce energy use of existing low-rise housing sector by 10% by requiring moderate retrofits at time of home sale or building permit application• Regulation:
» Authorities with jurisdiction would require moderate energy retrofit at time of home purchase or building permit issuance (total 400k homes per year) if the home did not meet minimum performance standards. On average this would require the homeowner to invest $10,000+. Requirements would focus on envelope retrofits.
» Relating to home sales, regulation could require completion of retrofits by the buyer within a specified period of time after taking possession of a home (e.g. 1-2 years). This could allow buyers to account for retrofit costs when seeking financing, and would avoid creating delays in housing sales or quality issues due to rushed renovations.
» Relating to building permits, regulation could require owners to conduct retrofits to meet a minimum energy performance requirement as a condition of building permit issuance. Requirements could be tied to the type of renovation. Estimated reductions below assume only ~50% of permit applications would trigger retrofits.
• Residential loan program: Options include on-bill financing, local improvement charges, or government guarantees. Loans should be low-interest and tied to property to maximize uptake. Expanded financial support – possibly in the form of grants – might be needed to support low-income homes and social housing (80%-100% of costs in most existing programs).
• Coverage: All purchasers of existing homes and owners applying for building permit. Homes meeting specified performance level may be excluded. » Enabling Measures:
» Regional legislation that allow authorities with jurisdiction to adopt retrofit codes. » Development of effective code compliance mechanisms.
Options Est. reductions in 2030 Est. cost/tonne*
A Financial incentive to reduce low rise housing energy use 1.5% via voluntary shallow retrofits to 1 million homes
1 MtElec/Oil: < $0
Nat Gas: $50-100
B Financial incentive to reduce energy use by 4% via voluntary deep retrofit of 1 million homes
2 MtElec: $0
Oil: $0-$50 Nat. Gas: > $250
C Regulation/loan program to reduce energy use by 10% by requiring moderate retrofits at time of home sale or permit application
6 MtElec/Oil: < $0
Nat. Gas: $100-250
* Note: costs are national averages. Costs per tonne will vary widely by region; estimates do not consider the potentially significant value of avoided generation/transmission investments to electricity utilities and natural gas distributors. Costs may also overstate actual costs as costs are lower for older and inefficient buildings; for instance, over half of retrofits of natural gas-heated homes built prior to 1983 could be achieved for less than $50/tonne. In some cases costs are negative (<$0/t) even for natural gas-fuelled buildings.

Working Group on Specific Mitigation Opportunities Final Report
148
ECONOMIC AND CONSUMER IMPACTS
Ambition A and B: Financial Incentives (e.g., grants, tax preferences, low interest loans)• Retrofit incentives generate economic activity and strong demand for Canadian products such as insulation,
windows, and doors.• Receipt-based financial incentives (e.g., audited grant and tax preferences) diminish the underground
retrofit economy.• Strong consumer support for incentives, but care is needed to avoid free ridership, e.g., by focusing
incentives on retrofits with low market share. Products such as gas furnaces and windows can have very high free ridership rates as consumers already tend to choose high efficiency options.
• Research indicates energy efficiency program spending leads to net GDP increases -, e.g., Energy North East found $1 spent on energy efficiency programs let to $4 to $8 dollars of GDP80.
Ambition C: Regulation/Loan Program• Mandatory retrofit regulations would need to be carefully designed to minimize negative impacts on
consumers, e.g. increasing home purchase or non-efficiency renovation costs, driving delays in home purchasing, etc.
• A retrofit regulation could also cause expansion of underground economy as consumers seek to avoid mandatory retrofits and service taxes by not getting a building permit.
• Could affect the financial security of some homeowners who require renovations but are on fixed incomes, although access to funds could be facilitated by well-designed loan programs.
• Significant job creation in retrofitting, compliance, and energy evaluations.• Real estate activity could slow considerably while the market adjusts to requirements.
CONSIDERATIONS
Indigenous Perspectives• Input from the AFN recommends that consideration should be given to the impacts of climate change
and more extreme weather conditions on buildings in Indigenous communities when designing incentives and regulations for retrofits.
• Input from the MNC notes that each of the Governing Members has a housing authority, which would have an interest in areas such as energy-efficiency investments, infrastructure, and other opportunities to transition to a low-carbon economy. Energy efficiency initiatives could help Métis homes and businesses to lower emission and energy costs.
Co-benefits/negative impacts: • Incentives are an effective way to pull demand for energy efficiency, and prepare renovators and
manufacturers for longer term regulations (push).• Deep retrofits will be unaffordable for many low-income households and will require targeted programs. • Rapidly increasing the demand for retrofits risks introducing poorly qualified contractors, and creating
potential health, safety, and building durability issues for homeowners. Should be preceded/accompanied by contractor training and/or accreditation programs.
Linkages with other working group areas and other proposed policies: • Aligns with Canadian Energy Strategy (CES) 1.2.1 (financing EE)
80 Malone, Howland et al. 2014. Energy Efficiency: Engine of Economic Growth in Canada. Environment Northeast. Ottawa, ON.

Working Group on Specific Mitigation Opportunities Final Report
148Working Group on Specific Mitigation Opportunities Final Report
149
Regional impacts including northern and remote communities:• Targeting incentives based on housing vintage, climate zone and fuel mix would maximize GHG savings,
but result in regional bias of the distribution of program funds. • Access to energy advisors to label homes may be difficult in rural and northern regions.• Rural and remote areas have limited access to qualified renovators, a greater prevalence of lower household
incomes, and higher percentage of old homes – may warrant targeted programs with more contractor support, higher incentive levels.
Implementation, feasibility, technological and enabling infrastructure issues:• Incentives are a well-established, widespread approach to retrofits. Main challenges are minimizing free
ridership and overcoming transaction costs – can be addressed via ‘turnkey’ programs with accredited contractors
• Incentives could be expanded to include equipment to accelerate equipment upgrades. • Older homes more likely to be able to reach target and receive grant for deep retrofits.• Scalability: measures can be scaled up/down.• Additional considerations required for heritage buildings due to increased complexity/costs• Time-of-sale labelling allows purchasers to assess and value energy efficiency, encouraging retrofits.
European Union experience suggests stringent compliance and coverage of all building types leads to more success with consumer acceptance.
• Renovator certification programs could be developed through industry organizations such as the Canadian Home Builders Association.
• Deep retrofit systems need to be defined, costed and de-risked by the renovation industry working together through capacity-building mechanisms such as Local Energy Efficiency Partnerships (LEEP).
• Continuing RD&D efforts can enable more affordable deep energy retrofits of existing homes and buildings (e.g. developing novel affordable construction practices)
• Proposed policy measures could be applicable to social housing. However, targeted programs, including no-cost retrofits may be required to reach low income and social housing segments. Uptake in low income and social housing is expected to require an incentive model that pays for 80-100% of retrofit costs leading to much higher program delivery costs. For example, the shallow retrofit of 50,000 homes at a cost of $5,000 each would cost $250 million.
B3 Net-Zero Ready Codes for New Commercial-Institutional Buildings
POLICY GOAL: Reduce emissions from new commercial/ institutional/ high rise multi-unit residential buildings
POLICY TOOL: Regulations
Policy Details• Reduce emissions from new commercial/institutional/multi-unit residential buildings through more energy
efficient buildings• ‘Net-zero ready’ buildings leverage high efficiency equipment and building envelopes so that they only
use as much energy as they could potentially produce from renewable energy.• The policy would require authorities having jurisdictions (e.g. provinces/ territories/ municipalities)
to adopt “net zero ready codes” supported by a model National Energy Code of Canada for Buildings.

Working Group on Specific Mitigation Opportunities Final Report
150
Ambition A: Increase the energy requirements in building codes and in the National Energy Code of Canada for Buildings to reach net-zero ready by 2035
• Coverage: New commercial, institutional and high rise multi-unit residential buildings. • Roll-out: Adoption of new energy codes by authorities having jurisdiction that increase the energy performance
of new building construction to net-zero ready by 2035, representing an average improvement in building energy efficiency of 65% relative to 2015 model energy code (exact percentage varies by climate zone and building type). Model National Energy Codes for Buildings would provide a stepped roadmap to net zero ready.
• Enabling Measures:
» Substantial capacity building of industry professionals and compliance officials (training and tools). » Accelerated national adoption by authorities having jurisdiction through a common roadmap that
includes model national energy codes.
Ambition B: As per Ambition A but accelerated by 5 years to 2030.
Ambition C: As per Ambition A but accelerated by 10 years to 2025.
Options Est. reductions in 2030 Est. cost/tonne*
A Building codes reach net-zero ready by 2035 4 MtGas/Elec.: $100-250
Oil/Elec.: $0-50 Elec.: <$0
B Building codes reach net-zero ready by 2030 5 Mt
C Building codes reach net-zero ready by 2025 5 Mt
*Note: cost/tonne will vary widely by region and building type; estimates do not consider the potentially significant value of avoided generation/transmission investments to electricity utilities and natural gas distributors.
ECONOMIC AND CONSUMER IMPACTS• Significant incremental cost to achieve net-zero ready could slow new construction and be cost prohibitive.
An initial 20% increase over average commercial construction costs is assumed, although modeling in other jurisdictions with different climate zones or other characteristics (e.g., California, Europe) suggests an increase of 1-12% with design improvements
• High performance buildings have lower operating costs that help overcome construction costs. • Compliance and enforcement will create thousands of new jobs across the country.• Studies show employee performance improves with building performance.• 2025 and 2030 scenarios are very ambitious and would require substantial support and training for PTs,
municipalities and the construction industry to achieve. Code development can be time consuming and jurisdictions often require several years before adopting and implementing model codes. Limiting time for code development, stated intention to adopt by jurisdictions, the necessary administrative infrastructure, and training will impact the buy-in from jurisdictions and industry stakeholders including developers, owners, facility managers, building officials and service providers.
CONSIDERATIONS
Indigenous Perspectives• Input from the AFN recommends building codes should allow for housing solutions for Indigenous
communities that reflect Indigenous culture in design (e.g., circular, modular, portable, even if uninsurable) and allow for tiny homes that are energy efficient, as well as for constellations of tiny homes for extended families.

Working Group on Specific Mitigation Opportunities Final Report
150Working Group on Specific Mitigation Opportunities Final Report
151
Linkages with other working group areas and other proposed policies: • Carbon intensity targets could be included to promote low carbon materials and construction alternatives,
giving greater consideration to embodied energy in construction, such as through increased wood use in tall buildings. (See F1).
• R&D demonstration projects could showcase tools and solutions that demonstrate building code compliance pathways.
• Aligns with Canadian Energy Strategy (CES ) 1.3.1 (codes).
Regional impacts including northern and remote communities:• In regions that use clean electricity for space and water heating, policy will help moderate demand
on the grid, but won’t achieve GHG savings.
Implementation, feasibility, technological and enabling infrastructure issues:• California and European jurisdictions have implemented similar targets for 2016-2030• Developing all proposed model building code tiers at the same time would provide better regulatory
certainty and allow early adopters to use them as stretch codes. • Successful roll-out by 2030 would require immediate work on technical development and training programs • It is not always possible to install sufficient renewable energy to make commercial buildings fully ‘net-zero’
- access to solar, wind, and geothermal energy sources can be diminished by the proximity of other buildings (e.g. shade, block wind, depleting energy from the ground etc.).
• Opportunity exists to introduce a requirement for green roofs on select building types. A National Research Council study found that the soil and plants on roofs can reduce energy demand. However, there are conflicting reports regarding the impact of green roofs on energy reduction and further study may be needed.
B4 Existing Commercial-Institutional Buildings
POLICY GOAL: Increase building energy efficiency from existing commercial/ institutional/ high rise multi-unit residential buildings
POLICY TOOL: Incentives, Information Programs, and Regulations
Policy DetailsAmbition A: Financial Incentives/Information Programs to reduce energy use in the Commercial, Institutional and high rise Multi-Unit Residential Buildings sector by 2%
• Incentives and voluntary information programs.• Financial incentives: Performance based financial incentives of $15 /GJ saved. Total cost of subsidy
estimated at $125 million. All Commercial, Institutional and high rise Multi-Unit Residential Buildings, excluding government owned (see Government Operations options).
• Information programs:
» Expand the ENERGY STAR Portfolio Manager energy performance benchmarking tool to include ENERGY STAR Score rating system for 21 building types. (U.S. experience with voluntary consistent benchmarking suggests 5% average reduction in energy use after three years of regular benchmarking).
» Thermographic/solar maps of 30 cities to inform owners on the energy performance of their roofs and potential for roof-top PV.
• Roll-out: Incentive programs supported by an expanded benchmarking tool and solar thermographic maps (available for 12 years), would issue more than 200 incentive payments per year for five years.
• Enabling Measures: Significant training and quality assurance for building professionals.

Working Group on Specific Mitigation Opportunities Final Report
152
Ambition B: Reduce energy use in the Commercial, Institutional and high rise Multi-Unit Residential Buildings sector by 3% through measures in Ambition A and energy disclosure regulations
• Regulation to require mandatory energy disclosure of all commercial, institutional and high rise multi-unit residential buildings, excluding government owned.
• Roll-out: National framework for energy disclosure implemented in 2020.
Ambition C: Reduce energy use by 17% in the Commercial, Institutional and high rise Multi-Unit Residential Buildings sector through measures in Ambition B, regulations and $750M in financial incentives
• Regulation:
» Authorities with jurisdiction would adopt a retrofit building code coupled with regulations that require energy retrofits at time of renovation.81 This would improve the energy efficiency of 10% of buildings annually. Under a retrofit code, whole-building renovations are expected to achieve 25% energy savings on average (significantly less for smaller renovations). Excludes government owned buildings.
» Authorities with jurisdiction would regulate mandatory recommissioning every 5 years, supported by a national framework. Recommissioning focuses on low or no-cost operational improvements from ensuring equipment and systems operate optimally.
• Financial incentives: Performance based financial incentives/tax credits of $15 /GJ saved. Total cost of subsidy estimated at $750 million.
• Roll-out: Retrofit Code developed by 2020, adopted 2022. Framework for mandatory recommissioning developed by 2018, implemented 2020. Incentive program launched 2018.
• Enabling Measures:
» Regional legislation that allows provinces and territories to enact an energy retrofit code that would be actioned at the time of renovations, and to mandate regular recommissioning.
» Development of effective code compliance mechanisms through capacity building and training measures.
Options Est. reductions in 2030 Est. cost/tonne
A. Financial Incentives/Information Programs to reduce energy use by 2%
<1 Mt < $0
B. Reduce energy use by 3% through measures in Ambition A and energy disclosure regulations
<1 Mt < $0
C. Reduce energy use by 17% through measures in Ambition B and $750M in financial incentives
6 Mt < $0
Note: cost/tonne will vary by region and building type; estimates do not consider the potentially significant value of avoided generation/transmission investments to electricity utilities and natural gas distributors.
ECONOMIC AND CONSUMER IMPACTS• This option is particularly cost-effective compared to residential retrofit policies because of low-cost
opportunities from recommissioning , and greater energy savings resulting from more comprehensive retrofits and higher energy loads (e.g., more occupants, greater plug loads, energy use in peak times, higher lighting loads, etc.) as compared to housing.
• Financial incentives generate strong retrofit activity and related professional activity. • Total cost of a tax preference can be difficult to estimate and is outside of the government’s direct control.
81 Note that regulations and code would not compel standalone retrofits. Retrofits would only be required when owner is undertaking certain renovations.

Working Group on Specific Mitigation Opportunities Final Report
152Working Group on Specific Mitigation Opportunities Final Report
153
• Studies show employee productivity directly correlated to building performance.• Significant job creation in building retrofitting, compliance, and energy professionals.
Implementation, feasibility, technological and enabling infrastructure issues:• Opportunities could be sought to apply retrofit and recommissioning initiatives to existing primary covered
agricultural buildings which collectively emit approximately 4.8Mt of GHGs. • To avoid free riders, incentives should target deep retrofits with longer term simple paybacks with positive
economic value. • Capacity building of professionals on ENERGY STAR Portfolio Manager could be done by third party
representatives such as community colleges.• Voluntary information programs such as thermographic and solar mapping have demonstrated a significant
increase in the adoption of solar technology and retrofits by building owners. • Mandatory energy disclosure would increase awareness of energy efficiency, encourage retrofits, and
increase value of energy efficient buildings. In the European Union mandatory labelling has had mixed results, but countries that were more stringent on compliance, and targeted all building types, had more success.
• Retrofit code would be applied at time of building renovation; jurisdictions currently considering retrofit codes could serve as models. In England and Wales, all rental properties are required to have a minimum energy rating in order to be lawful to rent as of April 2018. City of Vancouver requires energy upgrading of existing buildings.
• Regulation: Mandatory Recommissioning » Short payback (2-24 months) on small investment in recommissioning. » Supports mandatory energy disclosure. » Would sharply increase demand for recommissioning experts; may warrant training programs
B5 Equipment Efficiency
POLICY GOAL: Increase energy efficiency of equipment used in homes and buildings
POLICY TOOL: Regulations and labelling
Policy Details
Option A: Increase minimum standards and labelling (EnerGuide and ENERGY STAR®) for up to 10 categories of space and water heating equipment beyond U.S. minimum energy performance levels• Regulations: Increase regulated energy performance for up to 10 categories of space and water heating
equipment beyond U.S. levels. • Labelling: Use EnerGuide and ENERGY STAR® labelling programs to promote higher efficiency equipment
and encourage innovation, thereby preparing the market for higher energy performance regulations. ENERGY STAR® levels for up to 10 categories of space and water heating equipment would exceed U.S. ENERGY STAR® levels.
• Roll-out: Implement more stringent regulations for space and water heating equipment by 2025, preceded by 8 years of market transformation initiatives (e.g., incentives) at an estimated cost of $40 million per year targeted at those products with a positive cost per tonne in 2016 to encourage market acceptance and make them less than zero by 2025. Incentives to encourage retrofits, such as those presented in B2, could be used to support the market transformation of space and water heating equipment.

Working Group on Specific Mitigation Opportunities Final Report
154
Option B: Increase minimum standards for additional product categories, such as home appliances, consumer electronics and lighting beyond U.S. levels; and set standards for product categories that are not yet regulated in Canada or the U.S. at the national level• Regulations: Increase regulated energy performance for up to 5 categories of lighting, home appliances,
and consumer electronics beyond U.S. levels, and explore opportunities to regulate additional equipment and products not regulated at the national level.
• Labelling: Use EnerGuide and ENERGY STAR® labelling programs to promote higher efficiency equipment and encourage innovation, thereby preparing the market for higher energy performance regulations. ENERGY STAR® levels for selected categories would exceed U.S. ENERGY STAR® levels.
• Roll-out: Higher energy efficiency standards for selected categories, such as lighting, home appliances, and consumer electronics implemented in 2025, preceded by 8 years of market transformation initiatives at an estimated cost of $20 million per year to overcome barriers to consumer acceptance associated with changes to product form and function (e.g. heat pump clothes dryers). Incentives to encourage home retrofits, such as those presented in B2, could be used to support the market transformation of these equipment categories.
Option C: Regulations to phase-out residential space and water heating equipment (such as high efficiency furnaces) that is less efficient than heat pump technology • Regulations: New regulations requiring all space and water heating equipment to be at least as efficient
as heat pump technology. (Heat pump technologies can operate at greater than 100% efficiency.)• Labelling: Use EnerGuide and ENERGY STAR® labelling programs to promote higher efficiency equipment
and encourage innovation, thereby preparing the market for higher energy performance regulations. ENERGY STAR® levels for selected categories would exceed U.S. ENERGY STAR® levels.
• Roll-out: Regulations would begin phase-out of technologies in 2028 (to allow time for RD&D to reduce costs of newer technologies), with full market turnover by 2048 preceded by 11 years of market transformation initiatives at an estimated cost of $90 million per year targeted at those products with a positive cost per tonne in 2016 to encourage market acceptance and make them less than zero by 2028. Fuel switching policies, such as those presented in B6, could also be used to support the market transformation of space and water heating equipment.
Options Est. reductions in 2030 Est. cost/tonne
A. Increase minimum standards and labelling (EnerGuide and ENERGY STAR®) for up to 10 categories of space and water heating equipment beyond U.S. levels. (Emission reduction estimates include 4Mt from announced federal actions baseline)
6 MtVaries by category
In 2016: < $0 to $100-250 By implementation: <$0*
B. Increase minimum standards for additional product categories, such as home appliances, consumer electronics and lighting beyond U.S. levels; and set standards for product categories that are not yet regulated in Canada or the U.S. at the national level. (incremental to Ambition A)
1 MtVaries by category
In 2016: < $0 to $100-250 By implementation: <$0**
C. Regulations to phase-out residential space and water heating equipment (such as high efficiency furnaces) that is less efficient than heat pump technology. (incremental to Option A)
<1 Mt*In 2016: Oil to HP: < $0, Nat Gas to HP: >$250
By implementation: <$0**
*Note that reductions for Option C are relatively low in 2030 because implementation begins in 2028, but will become much more significant in the longer term, e.g., 2050.
**Cost by implementation date for all measures anticipated to be <$0/t due to long ramp-up period, market transformation initiatives and technological improvements

Working Group on Specific Mitigation Opportunities Final Report
154Working Group on Specific Mitigation Opportunities Final Report
155
ECONOMIC AND CONSUMER IMPACTS• Regulations will increase price of equipment, but improved performance will lower operating costs.• Manufacturers could incur additional regulatory burden (e.g. reporting) with Canada-specific regulations.• In 2030, consumers and businesses would save the following amounts on their energy bills:
» Announced federal measures (Budget 2016): $4.0 billion » Option A + Budget 2016: $5.2 billion » Option A + B + Budget 2016: $6.2 billion
CONSIDERATIONS• Proposed policies build off of Federal Budget 2016 under which Canada plans to align energy efficiency
regulations and labelling program with those of the U.S. for over 50 product categories by 2020. Alignment reduces regulatory burden on industry. The province of Ontario has already aligned some of their energy efficiency regulations with those of the U.S.
Linkages with other working group areas and other proposed policies: • Use of natural gas heat pumps, rather than electric could help mitigate increased electricity load.
Regional impacts including northern and remote communities:• In regions that use clean electricity, more stringent electricity consumption regulations will help moderate
demand on the grid, but won’t achieve GHG savings.
Implementation, feasibility, technological and enabling infrastructure issues:• Energy efficiency standards and labelling programs are among the most cost effective approaches
to improving energy efficiency and reducing greenhouse gas emissions.• Canada’s Energy Efficiency Regulations currently establish standards for over 40 product categories;
the ENERGY STAR® labelling program currently sets voluntary specifications for 70 product categories.• Federal government can set standards for products that are imported or shipped inter-provincially
for the purposes of lease or sale.• Provinces can set standards for products manufactured or sold within their borders.• Coordinated research, development and deployment will be needed in advance of regulatory
implementation. • Collaboration and engagement with domestic and international partners will help leverage expertise
in emerging technology development and deployment. • Prior to regulations, consumer incentives could be used to accelerate market adoption of products.• Increased levels of investment in market transformation can accelerate implementation of regulations
and improve cost per tonne.• There is considerable historical evidence that production costs and consumer prices of equipment
decrease with time as a result of increased production efficiency and cumulative experience on the part of manufacturers. Market transformation would accelerate the rate of decrease.
• Emerging heat pump technologies that operate on electricity or natural gas work effectively at lower outdoor temperatures, expanding their application to colder climates.
• At current energy prices, moving from natural gas to electricity for space and water heating would not prove cost effective, despite the improvement in equipment efficiency.
• Time frame for implementation reflects need for additional research and development to develop cost effective technological solutions.

Working Group on Specific Mitigation Opportunities Final Report
156
B6 Renewable Power and Fuel Switching
POLICY GOAL: Incentivize distributed renewable power generation and low carbon fuel source changes in buildings.
POLICY TOOL: Financial incentives (grants, tax preferences, low interest loans)
Policy DetailsOption A: Financial incentives (e.g., grants, tax preferences, low interest loans) to achieve installation of 1 million 5 kW solar photo voltaic systems to help reduce demand for fossil fuel based electricity generation (2 models)
Incentive model: • 30% subsidy to encourage $20,000 investment in 5kW system. Follows US DOE model. Total value
of subsidies estimated at $6 Billion. Subsidy levels would drop with reduced system costs. • Eligibility: Certified residential or commercial/institutional (CI) roof top or building mounted systems, or
agricultural buildings. Owners can have more than one 5kW system, but utility scale generation is excluded.• Roll-out: Would run for 10 years or until 1 million 5kW installations completed.OR
Loan programs model: • Financing to give homeowners access to $20,000 to purchase eligible system. Financing could be via
utility bills, local improvement charges, bank loans, or government guarantees. Low-interest financing that is transferable with building ownership will increase attractiveness (e.g., tied to the property)
• Electricity rate guarantees above market value may be needed to reduce payback period and enhance uptake although significant reductions in PV panel costs make this less necessary. Impacts on electricity rates also need to be considered.
• Eligibility: Certified residential or CI systems. • Roll-out: Would run for 10 years or until 1 million 5kW installations completed.
Option B: Financial incentive (grant, tax preference, low interest loan) to reduce GHG emissions by 5Mt by fuel switching space and water heating from oil/natural gas to less GHG intensive alternatives (2 models). Equivalent to conversion of ~10% of existing residential floor space in 2013 (~1.4 million homes) and 14% of commercial floor space, in both cases largely from natural gas as it is the dominant heating fuel.
Financial incentives model: • Grant of $300/tonne of annual net GHG reduction to convert diesel/oil/ natural gas to less GHG intensive
alternatives for heating, e.g., low emitting electricity, bioenergy or other alternatives. Level of subsidy is aligned with existing provincial programs including conversions from oil heating to heat pump and other conversion types. For some types of conversions, energy cost reductions can offset the initial cost, over and above the subsidy.
• Size of incentive will vary based on the existing fuel type (diesel, oil or natural gas), size of building (residential vs commercial) and the GHG intensity of new energy source (e.g., local electric grid). Total cost of subsidy estimated at $1.5B. Residential homeowners would receive an average of $1,500 for a $10,000 investment.

Working Group on Specific Mitigation Opportunities Final Report
156Working Group on Specific Mitigation Opportunities Final Report
157
• Eligibility: » Homes and buildings (including agricultural buildings) that can reduce GHGs by converting from oil/
natural gas to less GHG intensive alternatives such as carbon-beneficial biomass and cleaner electricity. » Including carbon beneficial biomass such as wood pellets may help move Northern and remote
communities off heating oil and/or diesel.• Roll-out: Would run for 10 years or until targeted GHGs saved, whichever occurs first.OR
Residential loan program model: • Facilitate consumer access to financing through measures such as on-bill financing, local improvement
charges, bank loans, or government guarantees. • Eligibility and roll-out: As per incentive option
Options Est. reductions in 2030* Est. cost/tonne
A. Incentive or loan programs for 1 million 5 kW solar photovoltaic systems
<1 Mt > $250
B. Incentive or loan programs to reduce 5 Mt of GHG emissions by fuel switching space and water heating from oil/diesel/natural gas to less GHG intensive alternatives.
5 MtOil to Elec: < $0
Nat Gas to Elec: >$250
* Reductions for Option B assume electricity grid emissions intensity follows business as usual projections. Reductions will change to the extent electricity emissions intensity decreases or increases.
ECONOMIC AND CONSUMER IMPACTS
Option A: Solar photovoltaic power generation • Job creation – e.g., ON program created 12,000 jobs in 2015 for solar installation.• Can be more expensive in smaller isolated communities.• Use of above-market value rates for PV electricity can create rate pressure for all electric customers.
However, the size of such incentives has decreased as PV becomes more cost competitive with conventional generation sources.
• Total cost of a tax preference can be difficult to estimate and is outside of the government’s direct control.
Option B: Fuel Switching• Electrification could substantially increase electricity heating demand – modeling suggests by ~150 PJ
in 2030 relative to baseline, increasing need for grid investments and/or energy efficiency policies.• Price-differential between natural gas and electricity will make it difficult to achieve uptake by gas-heating
consumers as natural gas costs are ~3.5 times lower. Varies by jurisdiction and heating technology.• Oil conversion to electricity offers energy efficiency improvements and lower operating costs and therefore
has the most attractive payback.• Reduced revenues for gas utilities and fuel oil distributors and potential for stranded assets. Modeling
suggests a ~20-30% reduction in sector demand for these heating fuels in 2030 relative to business as usual, although demand for natural gas increases to supply increased electricity demand.
• Use of waste wood could provide direct and indirect benefits for rural forest-based communities, e.g., energy autonomy, regional investment, employment, forest sector growth.

Working Group on Specific Mitigation Opportunities Final Report
158
CONSIDERATIONS
Indigenous perspectives:• Input from the AFN recommends that Indigenous communities may need additional and targeted support
to adopt and switch to less carbon intensive energy (heating and power) systems and solar solutions.• Input from the MNC notes that each of the Governing Members has a housing authority, which would
have an interest in areas such as energy-efficiency investments, infrastructure, and other opportunities to transition to a low-carbon economy.
Option A: Solar photovoltaic power generation• PV can help reduce dependence on diesel in Indigenous and remote communities, but requires
targeted solutions due to increased costs from the need for storage to make the hybrid renewable/diesel systems effective.
Linkages with other working group areas and other proposed policies:
Option A: Solar photovoltaic power generation• Grid upgrades may be needed to handle intermittent generation. • Surplus solar PV generation can potentially be exported to the US due to support recent North American
clean power goals (50% continent-wide by 2025) and US Clean Power Plan compliance options for states.• Aligns with Canadian Energy Strategy 4.1.2 (renewables deployment), 6.1.1 and 6.1.2 (clean electricity).
Option B: Fuel Switching• Given Canada’s cold climate and significant heating load, grid upgrades are first needed in some
jurisdictions to build capacity for electrification of heating. (Electricity sub-group)• Fuel switching incentives support longer term strategies to phase-out less efficient space and water heating
alternatives. (See B5). If the performance of space and water heating equipment was regulated per B5, incentives would have to end before implementation of the regulation
• Aligns with Canadian Energy Strategy (CES) 4.1.2 (energy system innovation), 6.1.1 (clean electricity/heat).
Regional impacts including northern and remote communities:
Option A: Solar photovoltaic power generation• Greater GHG impact in regions with high emitting grid supply. Less GHG intensive grids (e.g. BC, MB, QC,
ON) may not need more supply from solar PV which may lead to excess low-carbon supply in the absence of export capacity and/or increased demand.
Option B: Fuel Switching• Remote communities often have higher electricity prices and many of their grids are already at maximum
load. Electrification risks exceeding local capacity and further increasing costs for heating and other electrical uses. Higher financial incentives may be needed.
• Most remote communities are forest-based; biomass may be a readily available and opportunistic renewable fuel for baseload heat and power in these communities.
• In some jurisdictions, when heating is shifted from natural gas to electric, increased heating load on the grid will likely be met with natural gas generation unless other policies constrain this choice. Incentive programs should be designed to minimize this outcome since it effectively results in little to no net GHG reduction.

Working Group on Specific Mitigation Opportunities Final Report
158Working Group on Specific Mitigation Opportunities Final Report
159
Implementation, feasibility, technological and enabling infrastructure issues:
Option A: Solar photovoltaic power generation• Scalability: measures can be scaled up/down.• Carbon pricing on emitting fuels will shorten payback on renewables.• Would create approximately 5600 GWh of additional generation/year once fully implemented
Option B: Fuel Switching• To fuel switch to electricity, the grid must be able to accommodate additional heating load.• Greatest GHG impacts and incentives will occur where switching to low/zero emissions electricity,
particularly from oil. • In jurisdictions with a large spread between electricity and natural gas prices consumers are less likely to
convert from natural gas to electricity. Will likely need much higher incentives or a significant carbon tax to reduce the price differential between gas and cleaner electricity.
• Use of biomass such as wood pellets as a fuel source may help move Northern and remote communities off heating oil. Sustainable biomass from harvest residues or other sources has lower emissions on a life-cycle basis when compared to use of fossil fuels. The most cost- and mitigation-effective projects may use local waste wood.
B7 Demand Response Opportunities and Behaviour Change
POLICY GOAL: Reduce emissions through the adoption of behavioural programs to lower consumers’ energy bills
POLICY TOOL: Regulations, incentives/rebates and targeted information campaigns
Policy Details
Option A: Regulations requiring utilities to offer enhanced billing, to reduce energy use in the residential sector by 2%• Regulation: Require utilities to offer enhanced billing (providing more user friendly information on utility
bills that includes comparing energy use with other households). • Coverage: All utilities that service residential households. • Roll-out: Implement requirement for enhanced billing by 2025. Roll-out preceded by a voluntary phase
from 2017-2025. Timeline could be accelerated if required but would vary by jurisdiction.
Option B: Regulations and incentives to reduce peak electricity demand by 1-2% through time of use rates or by providing utilities control over household thermostat settings• Time of use rates Regulation: Mandate utilities to adopt rate structures that are price-based to limit
energy use during specific peak times. • Coverage: All electrical utilities• Roll-out: Adoption of rate structures by most jurisdictions by 2025. Could potentially be accelerated
but timelines would vary by jurisdiction.• Financial Incentives / Suasion for utility controlled thermostats: Electrical utilities to install programmable
communicating thermostats (either free or with a small incentive) giving them the ability to mitigate peak summer energy use.
• Roll-out: Program would begin in 2020.
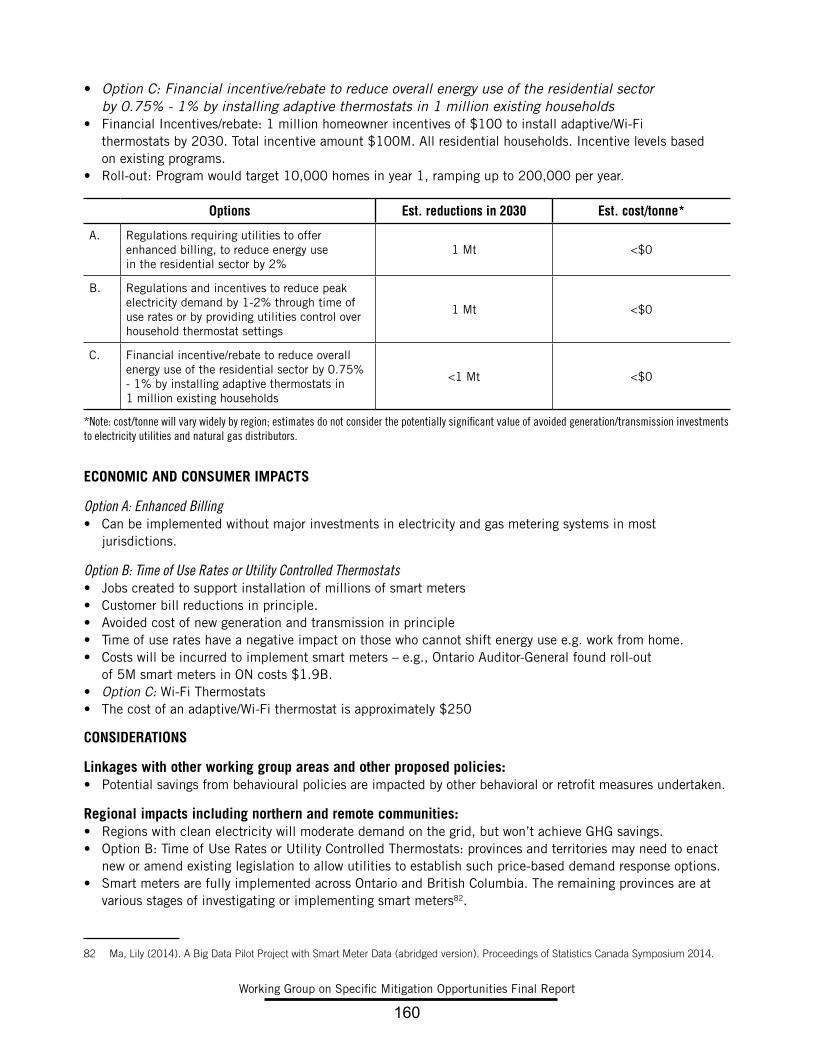
Working Group on Specific Mitigation Opportunities Final Report
160
• Option C: Financial incentive/rebate to reduce overall energy use of the residential sector by 0.75% - 1% by installing adaptive thermostats in 1 million existing households
• Financial Incentives/rebate: 1 million homeowner incentives of $100 to install adaptive/Wi-Fi thermostats by 2030. Total incentive amount $100M. All residential households. Incentive levels based on existing programs.
• Roll-out: Program would target 10,000 homes in year 1, ramping up to 200,000 per year.
Options Est. reductions in 2030 Est. cost/tonne*
A. Regulations requiring utilities to offer enhanced billing, to reduce energy use in the residential sector by 2%
1 Mt <$0
B. Regulations and incentives to reduce peak electricity demand by 1-2% through time of use rates or by providing utilities control over household thermostat settings
1 Mt <$0
C. Financial incentive/rebate to reduce overall energy use of the residential sector by 0.75% - 1% by installing adaptive thermostats in 1 million existing households
<1 Mt <$0
*Note: cost/tonne will vary widely by region; estimates do not consider the potentially significant value of avoided generation/transmission investments to electricity utilities and natural gas distributors.
ECONOMIC AND CONSUMER IMPACTS
Option A: Enhanced Billing• Can be implemented without major investments in electricity and gas metering systems in most
jurisdictions.
Option B: Time of Use Rates or Utility Controlled Thermostats• Jobs created to support installation of millions of smart meters• Customer bill reductions in principle.• Avoided cost of new generation and transmission in principle• Time of use rates have a negative impact on those who cannot shift energy use e.g. work from home.• Costs will be incurred to implement smart meters – e.g., Ontario Auditor-General found roll-out
of 5M smart meters in ON costs $1.9B.• Option C: Wi-Fi Thermostats• The cost of an adaptive/Wi-Fi thermostat is approximately $250
CONSIDERATIONS
Linkages with other working group areas and other proposed policies: • Potential savings from behavioural policies are impacted by other behavioral or retrofit measures undertaken.
Regional impacts including northern and remote communities:• Regions with clean electricity will moderate demand on the grid, but won’t achieve GHG savings.• Option B: Time of Use Rates or Utility Controlled Thermostats: provinces and territories may need to enact
new or amend existing legislation to allow utilities to establish such price-based demand response options.• Smart meters are fully implemented across Ontario and British Columbia. The remaining provinces are at
various stages of investigating or implementing smart meters82.
82 Ma, Lily (2014). A Big Data Pilot Project with Smart Meter Data (abridged version). Proceedings of Statistics Canada Symposium 2014.

Working Group on Specific Mitigation Opportunities Final Report
160Working Group on Specific Mitigation Opportunities Final Report
161
Implementation, feasibility, technological and enabling infrastructure issues:
Option A: Enhanced Billing• Some provinces have in place – e.g. Nova Scotia.• US research has found that indirect billing programs can result in a 2% reduction in energy consumption
and that energy savings persist83.• Regulatory reform is required to establish separate utilities dedicated to energy efficiency, which would
avoid the conflict of interest between revenue generation and demand management, and would motivate utilities to reduce demand.
• Challenges exist in measuring and verifying energy savings/GHG reductions due to potential double-counting with other programs (e.g., retrofits, equipment standards.
• Behavioural options should be accompanied by targeted educational programs and/or marketing campaigns.
Option B: Time of Use Rates or Utility Controlled Thermostats• Time of Use rates: In place in some PTs, e.g., ON and BC. For example, Ontario’s time of use pricing
has resulted in 1-2% reduction in electricity consumption during summer peak periods.• Savings are contingent on the aggressiveness of the price difference between peak and off-peak times.
Option C: Wi-Fi Thermostats• Research by the American Council for an Energy-Efficient Economy found that the average savings
from Wi-Fi thermostats were 10-12% based on U.S. pilot programs.
B8 Urban Form & Spatial Planning
POLICY GOAL: Support the transition to a low-carbon economy by reducing GHG emissions in municipalities through smart growth oriented development patterns, and through tree plantings, green roofs and permeable spaces.
POLICY TOOL: Provincial, territorial or municipal planning directives and financial incentives.
Policy Details
Option A: Reduce transportation-related and heating-related GHG emissions in municipalities through smart growth oriented development patterns.• Includes a suite of policies for integrated land use, transportation, and community energy planning that
promote compact, higher density, mixed-use community development patterns supporting accelerated shifts to transit and active transportation modes, as well as sustainable energy use. Specific smart growth oriented policies include:
» Establish minimum density and minimum intensification targets in all cities (defined as population of 100,000 or greater), and increase existing targets by 25-50% in municipalities that have already established them.
» Require large municipalities to delineate major transit station areas in their official plans and to establish minimum gross density targets to provide transit supportive densities in those hubs or corridors.
» A requirement for municipalities to develop Transportation Demand Management (TDM) policies and integrate them into their official planning processes to encourage modal shifts and prioritize active/ public transit in urban planning decisions. (See Transportation sector annex T7 for detailed examples of TDM policy options, some of which could be delivered at the municipal level, with appropriate support from senior governments).
83 Frey, E. and Rogers, R. (2014). Persistence: How Treatment Effects Persists After Interventions Stop. Policy Insights from Behavioural and Brain Sciences. Vol 1(1)172-179

Working Group on Specific Mitigation Opportunities Final Report
162
» Increased community energy planning (energy efficiency, renewable energy systems and district energy) via requirements, technical support and/or incentives for municipalities and developers.
» Support for electric vehicles including EV parking and charging equipment in new buildings.• Financial Incentives: Direct funding to capacity building projects that pilot and mainstream actions that
result in more compact, mixed-use, higher density, transit- and pedestrian- oriented communities.• Coverage: Emissions from buildings, transportation and private vehicles
Option B: Reduce overall urban emissions through tree planting, green roofs and permeable surfaces.• Regulations: Include tree plantings, green roofs and permeable spaces in provincial-level environmental
reviews of development projects. Require municipalities to recover full operating and/or capital costs of sewage works as development occurs to incent increased use of permeable surfaces
• Financial incentives: Direct capital funds for green roofs, urban forests and permeable surfaces• Information programs: Develop design guidelines/ standards to promote green roofs, urban forests
and permeable surfaces• Enabling Measures: Provincial legislation is required in some cases to provide authority to municipalities
toenact some of these policies.• Coverage: Commercial, institutional and residential development with a minimum Gross Floor Area
of 5,000ft2
EMISSIONS REDUCTIONS AND COST/TONNE• Emissions reduction estimates for 2030 were not developed for these policy options. However, previous
Canadian research84 estimates that an ambitious integrated land use, transportation and community energy policy package could reduce Canada’s urban GHG emissions by 8-15 Mt per year in 2030 and 13-35 Mt per year by 2050, assuming a 2010 start date. These reductions came largely from changes in building energy use, followed by energy supply and transportation-related changes (reduced auto ownership and trip length, increased use of transit and active transport, and reduced travel demand). Similarly, research by CMHC found that compact, mixed-use, walkable and cyclist-oriented urban design can decrease transportation emissions per household by 24 to 50% compared to conventional suburban neighbourhoods.
• Urban tree planting can also provide emissions reductions – for example, planting 200 million urban trees could reduce 0.5 Mt in 203085. Field trials have found green roofs can reduce daily average demand by 75 percent for cooling requirements in the spring and summer months86.
ECONOMIC AND CONSUMER IMPACTS
Option A: Smart Growth Oriented Development• Studies focused on 2050 have suggested that smart growth policies can increase GDP by 0.3 to 0.9%
due to reduced capital, labour and energy requirements within the transportation, building and domestic energy supply sectors and that life-cycle costs of hard infrastructure are reduced by up to 25% in denser communities.87
• Similarly, per-lot capital costs are 33% lower with compact design vs. conventional design.• Above-average neighbourhood walkability can add $4,000 to $34,000 to home value.• Increases to active transportation can help address rising health sector costs due to inactivity.
84 Bataille, C. 2010. The Capacity for Integrated Community Energy Solutions Policies to Reduce Urban Greenhouse Gas Emissions – Final Technical Report. MK Jaccard and Associates Inc. Prepared for Quality Urban Energy Systems of Tomorrow (QUEST). Vancouver, B.C.
85 Roulet, N.T and Freedman, B. What trees can do to reduce atmospheric CO2. Tree Canada, Ottawa, ON. 2008.
86 Liu, K.K.Y. (2002). Energy efficiency and environmental benefits of rooftop gardens. National Research Council Canada.
87 Bataille, C. 2010. The Capacity for Integrated Community Energy Solutions Policies to Reduce Urban Greenhouse Gas Emissions – Final Technical Report. MK Jaccard and Associates Inc. Prepared for Quality Urban Energy Systems of Tomorrow (QUEST). Vancouver, B.C
Working Group on Specific Mitigation Opportunities Final Report
162Working Group on Specific Mitigation Opportunities Final Report
163
Option B: Plantings/Green Roofs/Permeable surfaces• Green roof programs can provide net savings – for example, an assessment of a Toronto-wide green roof
installation program found it would provide $313 million in initial net cost savings, with an additional operating cost savings of $37 million annually. Similarly, the 10 million trees in Toronto’s urban forest provide $80M in annual benefits from stormwater retention.
• Research by the National Research Council found that green roofs can assist with stormwater management strategies by reducing peak flow and retaining run-off for later use by plants88
• Urban trees provide a cooling effect on urban climate mainly through shade provision, reduction of air temperature and the mitigation heat island effects89.
CONSIDERATIONS
Indigenous Perspectives• Input from the AFN recommends policies be designed to support the development/piloting of sustainable
net-zero infrastructure Indigenous communities.
Co-benefits/negative impacts:• Policies that encourage active transportation (e.g. bike paths, well-designed sidewalks, benches, and mixed
use development) also have important mental and physical health benefits and lead to additional savings in the health sectors, which offset some of the costs from policy and infrastructure changes.
• Co-benefits from green roofs, urban forests and permeable surfaces include reduced storm water runoff and improvement of the health of surrounding waterways, preservation of and protection of fish and wildlife habitat, improved air quality, social and health benefits (increased urban green spaces and recreation opportunities), reduced electricity or natural gas used to operate municipal water and wastewater systems, and greater adaptation to climate change.
Linkages with other working group areas and other proposed policies: • Smart growth oriented development patterns are complementary to transportation emission reduction
initiatives, such as TDM, that focus on reducing personal vehicle use and shifting demand to transit and active transportation modes, since a more compact mixed use urban form reduces average trip distances and makes transit and active transportation more convenient and attractive.
• Urban forests, green roofs and permeable surfaces approaches are closely aligned with integrated land use, transportation, and community energy approaches and also supports climate change adaptation goals.
Regional impacts including northern and remote communities:Ambition A: Smart Growth Oriented Development
• Several Northern communities have prepared community energy plans, but require capacity and funds to assist with implementation.
• Implementing smart growth oriented development in smaller communities facing population declines can be challenging due to lack of resources and decreasing housing needs.
Implementation, feasibility, technological and enabling infrastructure issues:• Planting/green roofs/permeable surfaces policies could be difficult for some municipalities to implement.
Capacity (staffing, resources) must be considered for smaller municipalities. Requirements must be clearly defined if specific to urban development only. The technology is however currently available.
88 Liu, K.K.Y. (2002). Energy efficiency and environmental benefits of rooftop gardens. National Research Council Canada.
89 Zupancic, Tara, Westmacott, Claire, and Bulthuis, Mike. (2015). The Impact Of Green Space On Heat And Air Pollution In Urban Communities: A Meta-Narrative Systematic Review. David Suzuki Foundation.

Working Group on Specific Mitigation Opportunities Final Report
164
Electricity Transmission and Generation
E1. Emissions Intensity Performance Standard for Fossil Fuel-fired Electricity Generation
POLICY GOAL: Shift from emitting to low- or non-emitting sources of electricity generation
POLICY TOOL: Regulated approach, under which new and existing large fossil fuel-fired electricity generating units would be individually required to meet emissions-intensity performance standards
Policy Details • Performance standards would apply to units over 25 MW• Flexible compliance mechanisms (credits) are included under options A and B
Options Est. reductions in 2030 Est. cost/tonne*
A. An emission intensity (EI) performance standard (PS) of 365 tCO2e /GWh for all large fossil fuel-fired units, beginning in 2020.
Compliance credits at $25/ tonne 9 Mt $0-$50
Compliance credits at $50/ tonne 14 Mt $50-$100
Compliance credits at $75/ tonne 20 Mt $50-$100
B. An EI PS for all large fossil fuel-fired units starting at 300 tCO2e /GWh in 2020 and increasing in stringency to 250 tCO2e /GWh in 2025.
Compliance credits at $25/ tonne 11 Mt $0-$50
Compliance credits at $50/ tonne 15 Mt $50-$100
Compliance credits at $75/ tonne 21 Mt $50-$100
C. EI PS for all large coal- and for natural gas (NG)-fired units that operate as baseload starting in 2030. EI PS for coal-fired units is 250 tCO2e /GWh and for NG-fired units is 375 tCO2e /GWh. No flexibilities. 15-20 Mt $50-$100**
*Note that cost estimates in the electricity sector are based on conservative assumptions, and may decline as renewable energy technologies continue to improve and the challenges to ensure electric reliability in a changing resource mix are identified and addressed.
**Nova Scotia has estimated the cost of this option at $>250/t for their jurisdiction
ECONOMIC AND CONSUMER IMPACTS • Cost per tonne estimates above represent the difference in overall costs of supplying electricity in the
policy scenario relative to the reference case. Cost of supplying electricity include: changes in capital costs, O&M costs, import costs, and fuel costs or savings. Compliance payments were not included in the cost calculation since they do not represent money spent to actually reduce emissions.90
90 Compliance payments made by facility owners do not represent money spent to actually reduce emissions. Although from the utility’s standpoint the compliance payments would represent costs incurred, from a global standpoint these payments represent a transfer of funds from the facility owner to another entity (a government, for example) and should not (and are not) included in the cost per tonne estimated range provided.

Working Group on Specific Mitigation Opportunities Final Report
164Working Group on Specific Mitigation Opportunities Final Report
165
• Beyond the costs included in calculating cost per tonne, this policy option will result in costs in some jurisdictions due to stranded assets and new infrastructure. Therefore, the cost per tonne estimates above do not represent the full cost of these measures, as they do not account for these costs, and they also underestimate the price of natural gas in Nova Scotia.91
• In all cases, electricity prices are expected to increase in provinces reliant on fossil fuels for electricity generation.
• The closure of coal-fired units would result in job losses at those units and depending on the economic life of the plant, may also result in investment losses in the facility itself if it cannot be used or sold for other purposes. Job losses could also occur in coal mining operations.
• The construction of new replacement generation and infrastructure could have positive economic impacts in terms of job creation.
• Electricity price increases could impact the competitiveness of affected provinces in terms of both the electricity export market and in manufacturing and industrial sectors on the global market.
• For levels A and B, compliance costs could be reinvested in clean electricity technologies or used to mitigate electricity price increases to customers and stimulate the economy.
CONSIDERATIONS
Co-benefits/negative impacts: • In addition to health benefits from improved air quality, environmental co-benefits include improved air
quality, reductions in air pollutants, water intake and discharge as well as reductions in solid waste disposal.
Linkages with other working group areas and other proposed policies:• Supports the Canadian Energy Strategy goal to “Foster an understanding by governments on the use
of market-oriented policies to reduce greenhouse gas emissions across Canada” and to “Actively pursue greenhouse gas emissions reductions with targets based on sound science”.
Regional impacts including northern and remote communities: • Impacts in Nova Scotia are expected to be considerably higher due to limited access to natural gas;
existing natural gas supplies are far more expensive in Nova Scotia; and the high cost of building new gas pipeline extensions needed for reliability from the rest of Canada into Nova Scotia. Based on its record of GHG reductions, in 2014 Nova Scotia established an equivalency agreement with the Federal Government which committed to GHG reductions equivalent to those defined in new Federal regulations. The agreement defines firm GHG reductions commitments while allowing the policy flexibility required to operate coal-fired electricity plants to their end-of-life dates. Through this approach, investments are being made in new, clean electricity resources versus investments in carbon-emitting assets. Similar flexibility would be required for any further acceleration of the phase-out of coal-fired electricity generation in Nova Scotia or increased stringency of performance standards on these plants.
• Estimated emissions reductions do not include Alberta’s Climate Leadership plan. Alberta’s coal phase out policy, along with their other policies including the renewable energy target and the carbon levy, could achieve similar results to this policy (i.e., reductions under this policy would not be incremental to policies recently announced in Alberta)
• New Brunswick is also reliant on coal and would be highly impacted.• Further analysis would be needed to provide recognition for Ontario’s recently announced cap and trade,
and avoid the duplication of incremental costs to ratepayers. • The size threshold of 25 MW would exclude coverage of diesel-fired units operating in remote communities.
91 The model used to estimate emissions reductions and costs (E3MC) considers all federal, provincial and territorial measures in place as of September 2015. Alberta’s Climate Leadership Plan and Saskatchewan’s renewable energy target are not considered in the modeling and therefore not reflected in the results.

Working Group on Specific Mitigation Opportunities Final Report
166
Implementation, feasibility, technological and enabling infrastructure issues: • For levels A and B, further work would be required to define flexibility mechanisms • Costs of this policy would be reflected in electricity prices, which could impact the competitiveness of
jurisdictions that are more reliant on fossil fuels, have carbon pricing in place, and/or adopted already considerable renewable energy and associated ongoing costs.
• New NG generation that has come online recently or will to come online imminently would still need to adhere to their contract or procurement agreements, which may make it difficult to meet the level of stringency if flexibilities are not available.
• Woody biomass can be used to help comply with requirements when co-fired with fossil fuels like coal. Carbon capture and storage can also be used to comply with emission intensity requirements for units, including those burning coal.
E2. Accelerated Phase-out of Unabated Coal-Fired Electricity Generation
POLICY GOAL: Shift from emitting to low- or non-emitting sources of electricity generation
POLICY TOOL: A regulatory requirement to close all unabated coal-fired units by December 31, 2029.
Policy Details• Policy would provide regulatory flexibility for units that incorporate technology for carbon capture and
storage (CCS)
Options Est. reductions in 2030 Est. cost/tonne*
A. Phase-out of unabated coal-fired units by 2030
15 Mt $50-100**
*Note that cost estimates in the electricity sector are based on conservative assumptions, and may decline as renewable energy technologies continue to improve and the challenges to ensure electric reliability in a changing resource mix are identified and addressed.
**Nova Scotia has estimated the cost of this option at $>250/t for their jurisdiction
ECONOMIC AND CONSUMER IMPACTS • This policy option will result in costs due to the construction of new clean electricity capacity, stranded
assets, and new infrastructure. • The cost per tonne estimates above do not represent the full cost of these measures, as they do not account
for stranded assets or associated new infrastructure, and also underestimate the price of natural gas in Nova Scotia.92
• Electricity prices are expected to increase in provinces reliant on coal for electricity generation.• The closure of coal-fired units would result in job losses at those units and depending on the economic life
of the plant, may also result in investment losses in the facility itself if it cannot be used or sold for other purposes. Job losses could also occur in coal mining operations.
• The construction of new replacement generation and infrastructure could have positive economic impacts in terms of job creation.
CONSIDERATIONS
Co-benefits/negative impacts: • In addition to health benefits from improved air quality, environmental co-benefits include improved
air quality, reductions in air pollutants, water intake and discharge as well as reductions in solid waste disposal.
92 The model used to estimate emissions reductions and costs (E3MC) considers all federal, provincial and territorial measures in place as of September 2015. Alberta’s Climate Leadership Plan and Saskatchewan’s renewable energy target are not considered in the modeling and therefore not reflected in the results.

Working Group on Specific Mitigation Opportunities Final Report
166Working Group on Specific Mitigation Opportunities Final Report
167
Linkages with other working group areas and other proposed policies:• The emissions intensity performance standard options under E1 would also affect coal-fired electricity
generation. This option would apply only to coal-fired power plants, with no requirements applied to other forms of fossil fuel-burning electricity generation, such as natural gas or fuel oil-fired generation.
Regional impacts including northern and remote communities: • Across Canada, up to 16 coal-fired units would be required to close sooner than under current Federal
regulations (7 in Nova Scotia, 6 in Alberta, 1 in New Brunswick and 1 in Saskatchewan), • The 2030 coal phase out policy recently announced by Alberta represents an example of this policy option.
Alberta’s coal phase out policy, along with other policies including their renewable energy target and carbon levy, could achieve similar results in AB to this policy.
• Saskatchewan is reliant on coal and recently invested over $1.4 billion to implement carbon capture and storage (CCS) on one of its coal units and in the past has indicated CCS could be an option to continue running at least two other units.
• Impacts in Nova Scotia are expected to be considerably higher due to limited access to natural gas; existing natural gas supplies are far more expensive in Nova Scotia; and the high cost of building new gas pipeline extensions needed for reliability from the rest of Canada into Nova Scotia. Based on its record of GHG reductions, in 2014 Nova Scotia established an equivalency agreement with the Federal Government which committed to GHG reductions equivalent to those defined in new Federal regulations. The agreement defines firm GHG reductions commitments while allowing the policy flexibility required to operate coal-fired electricity plants to their end-of-life dates. Through this approach, investments are being made in new, clean electricity resources versus investments in carbon-emitting assets. Similar flexibility would be required for any further acceleration of the phase-out of coal-fired electricity generation in Nova Scotia.
• New Brunswick is also reliant on coal power generation from a relatively new unit with a useful life that extends past 2030 and would be impacted.
Implementation, feasibility, technological and enabling infrastructure issues:• Careful planning and significant investment would be required to ensure that firm capacity and
infrastructure is available to make-up for retiring coal-fired capacity in 2030. • Nova Scotia in particular faces a number of technical challenges with accelerating the phase out of
coal-fired electricity, specifically the lack of infrastructure from the rest of Canada required to provide the additional natural gas needed for replacement power generation. In terms of electricity transmission, there is also limited ability to bring in additional firm electricity capacity without substantial network expansion.
• Replacement of coal with biomass can also satisfy the requirements of this policy while permitting rapid conversion of existing generating assets to use renewable energy.
• At this time, it is not expected that there would be a strong business case for additional use of CCS. Emissions reductions results could vary if the cost of CCS declines and this technology is used more broadly.
• Variable renewables such as wind and solar have an opportunity to replace a significant portion of the coal generation displaced if they can be reliably integrated. Demonstrating and deploying smart grid technologies to support increased wind and solar generation could increase the impact of this policy by ensuring that renewables replace a significant portion of coal-fired electricity generation.
E3. Non-Emitting Portfolio Standard for Electricity Generation
POLICY GOAL: Apply a non-emitting portfolio standard for electricity supply
POLICY TOOL: Regulated approach, under which each province and territory would be individually required to meet target levels.

Working Group on Specific Mitigation Opportunities Final Report
168
Policy Details • The target levels can be met using electricity supplied from non-emitting generation sources either
generated within a given province or territory or through interprovincial imports of non-emitting electricity. Exports cannot be counted towards the generating province’s targets.
• Includes renewable (e.g., hydro, wind, solar, geothermal, tidal, biomass) and nuclear generation. • Does not include low-emitting technologies, such as cogeneration or fossil fuel-fired generation with carbon
capture and storage (CCS).
Options Est. reductions in 2030 Est. cost/tonne*
A. The lesser of 90% non-emitting supply in 2030 or a 20 percentage point increase from the 2014 portion of non-emitting supply by 2030.
8 Mt $50-$100
B. The lesser of 97% non-emitting supply in 2030 or a 30 percentage point increase from the 2014 portion of non-emitting supply by 2030.
15 Mt $50-$100
* Note that cost estimates in the electricity sector are based on conservative assumptions, and may decline as renewable energy technologies continue to improve and the challenges to ensure electric reliability in a changing resource mix are identified and addressed.
ECONOMIC AND CONSUMER IMPACTS • Electricity prices are generally expected to rise as a result of the need to build new generating capacity
and infrastructure.• The construction of new replacement generation and infrastructure could have positive economic impacts
in terms of job creation.• This policy could impact the competitiveness of some provinces in terms of both the electricity export
market and manufacturing and industrial sectors on the global market
CONSIDERATIONS
Co-benefits/negative impacts: • In addition to health benefits from improved air quality, environmental co-benefits include improved
air quality, reductions in air pollutants, water intake and discharge as well as reductions in solid waste disposal.
Linkages with other working group areas and other proposed policies • This option supports a number of Canadian Energy Strategy (CES) goals, specifically the goal to “Foster
an understanding by governments on the use of market-oriented policies to reduce greenhouse gas emissions across Canada” and to “Actively pursue greenhouse gas emissions reductions with targets based on sound science”.
Indigenous Perspectives: • Input from the AFN recommends that targeted funding be provided for Indigenous clean energy
technologies and infrastructure and for clean energy community capacity and entrepreneurs, and emphasizes that energy systems should be First Nation community-owned or that home systems should be subsidized or otherwise accessible.
• The submission from the MNC also suggested that options should be developed to enable Métis delivery of new energy options, including biomass, solar, and geothermal.
Regional impacts including northern and remote communities: • Provinces with high levels of non-emitting electricity supply (Newfoundland and Labrador, Quebec,
Manitoba and British Columbia) would not need to take action, but could increase exports to help other provinces and territories meet their targets.

Working Group on Specific Mitigation Opportunities Final Report
168Working Group on Specific Mitigation Opportunities Final Report
169
• Nova Scotia, New Brunswick, Alberta and Saskatchewan have renewable targets that are in place or that have been announced. In these jurisdictions, the impacts of this policy cannot necessarily be considered incremental.
• These estimates do not account for recently announced policies including Saskatchewan’s renewable targets and Alberta’s coal phase out policy. Modeled results indicate that the target is met for Alberta and Saskatchewan through construction of wind generation and purchases of clean power from neighbouring provinces, generally displacing natural gas generation.
• The high capital cost associated with replacing diesel generation in northern and remote communities is a significant challenge given the small rate-payer base. There may also be issues accessing trained personnel to install and maintain more complicated systems. This policy would, therefore, heavily impact Nunavut and the Northwest Territories, which would have to displace at least some diesel power generation in remote communities in order to meet their targets. Modeling results indicate the Northwest Territories and Nunavut see an uptake in wind generation to meet the target.
• Ontario already has a high projected level of non-emitting generation but would likely still need to take some action to get to the 90/97% non-emitting supply in 2030 target. Modeling results indicate Ontario could meet the target through increased imports from neighbouring jurisdictions (Manitoba and Quebec) to replace natural gas for peaking.
• Prince Edward Island, which relies heavily on imported generation from emitting sources, would also be impacted.
• Depending on the stringency, Yukon may also need to take action.
Implementation, feasibility, technological and enabling infrastructure issues: • Compliance with this policy would require capital investment in new non-emitting generation and/or new
or upgraded transmission and distribution systems which will increase electricity prices.• Natural gas generation that has come online in recent years or is expected to come online imminently
would still need to satisfy contract or procurement agreements. In addition, return on capital investment is important for long-term planned projects.
• Renewable electricity generation, such as wind and solar, is variable, which means that it is non-dispatchable due to its fluctuating nature. To manage variability and the balance between supply and demand, generation forecasting, demand management, interconnectivity, storage and backup capacity should be considered. There will be system costs to address variability in the case of high penetration levels of wind and solar. RD&D support to bring innovative smart grid and storage technologies to commercial readiness would lower those costs. The percentage of feasible penetration level is location specific and depends on a number of factors.
• There are potentially high upfront capital costs to build new non-emitting supply to displace diesel generation in northern and remote communities; however, these costs might be partially offset by lower operating/fuel costs of non-emitting sources relative to diesel.
• A tracking system would be needed to ensure proper accounting of inter-jurisdictional trading for credits. Tracking systems have been implemented elsewhere but can be complex and require resources to manage.
E4. Financial Support for New NonEmitting Electricity Generating Facilities
POLICY GOAL: Displace emitting forms of generation with non-emitting93 forms of generation
POLICY TOOL: Standalone financial support for new non-emitting electricity generating facilities can take many forms including price-based incentive programs; capital incentives; open, competitive utility procurement programs; loan guarantees; and tax measures.
93 For the purposes of this document, non-emitting electricity refers to electricity generation that does not emit greenhouse gases. It does not refer to other pollutants.

Working Group on Specific Mitigation Opportunities Final Report
170
Policy Details• All non-emitting sources of electricity generation (e.g., wind, solar, biomass, geothermal, hydro, tidal, wave,
nuclear) would be eligible. Some consideration could be given to providing a lower incentive level to fossil fuel-based electricity generation that captures and permanently stores the great majority of its greenhouse gas emissions.
• The incentive level assumed for this analysis is based on a production incentive to make the lowest cost non-emitting electricity generation option (assumed to be wind) competitive with the overall lowest cost option (assumed to be natural gas combined cycle), using conservative assumptions about costs. Alternative approaches could also be considered.
• Further assessment of the most effective policy mechanism(s) to provide financial support would be required.
Options Est. reductions*in 2030 Est. cost/tonne**
A. Support the construction of new non-emitting electricity generating capacity, in order to generate 30 terawatt-hours (TWh) to displace emitting electricity generation
13 Mt $50-100
B. Support the construction of new non-emitting electricity generating capacity, in order to generate 45 TWh to displace emitting electricity generation
19 Mt $50-100
* These reductions may not necessarily be incremental to the emission reductions projected in ECCC’s biennial report. In some cases, the policy would support non-emitting generation projected to come online under the business as usual scenario modelled by ECCC.
** Note that cost estimates in the electricity sector are based on conservative assumptions, and may decline as renewable energy technologies continue to improve and the challenges to ensure electric reliability in a changing resource mix are identified and addressed.
ECONOMIC AND CONSUMER IMPACTS• Financial support for new electricity generating projects would result in new economic activity, including
investment and jobs during construction and operation. There would also be some negative impacts due to the reduction in use of existing emitting facilities and decisions to not build new emitting facilities that would have otherwise been built.
• The financial support provided to new non-emitting facilities would ultimately be borne by either taxpayers or electricity consumers, depending on the policy mechanism. Increases in electricity prices can have a number of impacts, including affecting competitiveness in other industries.
CONSIDERATIONS
Co-benefits/negative impacts:• Potential co-benefits from the displacement of fossil fuel-fired electricity generation include reductions
in various air pollutant emissions.
Linkages with other working group areas and other proposed policies • This policy is in alignment with the Council of the Federation’s Canadian Energy Strategy, in particular with
Goals 6.1 (Support the efficient deployment of clean and renewable energy sources across Canada) and 6.2 (Support greater access to affordable, clean, and reliable supplies of energy for all Canadians).
• This policy may interact with other policies designed to increase non-emitting electricity generation and/or decrease emitting electricity generation, such as carbon pricing, the non-emitting portfolio standard policy, the performance standard policy, and the policy to increase interprovincial electricity trade.

Working Group on Specific Mitigation Opportunities Final Report
170Working Group on Specific Mitigation Opportunities Final Report
171
Indigenous Perspectives: • Could include set asides for First Nation family or community owned and operated systems,
as recommended by the AFN.• Input from the AFN recommends that targeted funding be provided for Indigenous clean energy
technologies and infrastructure and for clean energy community capacity and entrepreneurs• The submission from the MNC also suggested that options should be developed to enable Métis delivery
of new energy options, including biomass, solar, and geothermal.
Regional impacts including northern and remote communities:• This policy would be more effective in reducing greenhouse gas emissions in jurisdictions that are more
reliant on emitting sources of electricity generation. Financial support may not be needed in regions where the lowest cost option for electricity generation is a non-emitting source, though support could be considered to add capacity to meet increased demand (e.g., from electric vehicles) or to increase electricity exports to neighboring provinces and/or territories.
Implementation, feasibility, technological and enabling infrastructure issues:• As greater penetration of variable renewable energy occurs, actions to integrate variability may be required,
such as dispatchable backup electricity generating sources (hydro, natural gas, electricity storage). Some consideration could be given to paying a premium for non-emitting sources that can be used as baseload or that are dispatchable.
• The required incentive level may decrease over time with technological advancements in the manufacturing and efficiency of non- and low-emitting electricity generation technologies. Furthermore, research, development and demonstration of grid integration technologies such as energy storage could result in lower costs of integration of variable renewable energy.
• Further analysis is needed to determine the appropriate incentive level, with some consideration given to regional and intertemporal variation.
E5. Targeted Financial Support to Reduce Reliance on Diesel Energy in Northern and Remote Communities
POLICY GOAL: Reduce reliance on diesel energy in off-grid Northern and remote communities
POLICY TOOL: A targeted program to support the development of non-emitting sources of electricity in remote communities (including Indigenous communities), which could include financial tools such as direct contributions, low interest loans or loan guarantees.
Policy Details• Enabling measures could include capacity building, development of knowledge base
and demonstration projects.• Some consideration could also be given to expanding this policy to include grid connection projects if they
have the net effect of displacing emitting forms of local generation with cleaner electricity from the grid.• Note that these options are scalable, and could be applied to a larger number of communities.

Working Group on Specific Mitigation Opportunities Final Report
172
Options Est. reductions in 2030 Est. cost/tonne*
A. Support the construction of new non-emitting electricity generating capacity in remote communities in order to generate about 0.3 TWh to displace diesel-fueled electricity (20% reduction in total remote community electricity related emissions)
<1 Mt $100-$>250
B. Support the construction of new non-emitting electricity generating capacity in remote communities in order to achieve a 50% reduction in diesel used for heating and electricity in about 140 remote and northern, First Nations and other Indigenous communities
<1 Mt $100-$>250
* Cost/tonne estimates encompass the use of wind or solar, with or without storage and at diesel costs ranging from $0.75 to 1.0/L. Calculations are based on data from very few operating projects and expertise in renewable energy and systems in remote communities. Further, the results are sensitive to diesel pricing.
ECONOMIC AND CONSUMER IMPACTS• Upfront capital costs to build new non-emitting supply to displace diesel generation in northern and
remote communities are high; however, these costs might be partially offset by lower operating/fuel costs of non-emitting sources relative to diesel.
• About 0.3 TWh of new annual electricity supply by 2030 in remote communities would require about 100 megawatts (MW) new non-emitting capacity installed by 2030. Total funds for new generation coming online in the first 8 years could be in the range of about $280 million, including funds for supporting/enabling activities such as capacity building, development of knowledge base and demonstration projects.
• Input from the AFN suggests that a 50% reduction of diesel used for heating and electricity approximately 140 remote and northern First Nations and other Indigenous communities by 2022 through energy efficiency/conservation, renewable energy, local smart grids, transport electrification, transmission connection, housing/facility design, and community energy planning would require funding in the range of $900 million to $1.7 billion over 10 years.
CONSIDERATION
Co-benefits/negative impacts:• Could support economic development goals, as well as improved air quality and overall reduced reliance
of remote communities on fossil fuels.• Would reduce risks associated with winter road delivery of diesel, fuel spills and volatile diesel fuel costs.• With appropriate support, could provide employment opportunities in northern and remote communities
Indigenous Perspectives• The AFN recommends that a targeted fund be developed to support reduced diesel use in northern
and remote off-grid communities, with the objective of achieving a 50% reduction in diesel use by 2022 in 140 remote and northern First Nations and other Indigenous communities.
• Input from the AFN emphasizes that clean electricity energy systems should be owned by families and communities.
• The submission from the MNC includes a recommendation to identify projects and communities through negotiation with Governing Members on a regional basis, where pilot projects can be implemented to move the community away from diesel and towards alternative means of electricity and heat generation.

Working Group on Specific Mitigation Opportunities Final Report
172Working Group on Specific Mitigation Opportunities Final Report
173
Regional impacts including northern and remote communities:• According to the Natural Resources Canada Remote Communities Database, there are roughly 284 remote
communities in Canada. These include communities, settlements, villages or cities, as well as long-term commercial outposts and camps for mining, fishing and forestry activities. Approximately 60 per cent are considered to be Indigenous communities (First Nations, Innu, Inuit, Métis).
• All northern and remote communities in Nunavut (25), Quebec (22), and Newfoundland and Labrador (33) rely exclusively on diesel generation
• Several communities in other provinces/territories also rely primarily on diesel for electricity generation: British Columbia (59), Ontario (25), the Northwest Territories (24), Manitoba (4), Yukon (5), Alberta (1), and Saskatchewan (1).
Linkages with other working group areas and other proposed policies • Diesel energy is widely used for heating as well as electricity generation. Options to reduce reliance on
diesel will need to address use in multiple sectors, including electricity, the built environment, and industry. • This option is in alignment with Action 6.2.1 under the Canadian Energy Strategy, “Work with aboriginal
and rural and remote communities and other partners to increase the use of cleaner renewable energy projects to reduce off-grid dependency on diesel”
Implementation, feasibility, technological and enabling infrastructure issues:• Circumstances of specific Northern and remote communities vary in terms of their climate, size, distance
from other communities, access to transportation networks, access to energy and electricity, local industries and economic activity, the availability of skilled labour, and a variety of other factors. This will impact costs and the viability of specific options to increase the share of non-emitting electricity generation.
• Where small populations and long distances from existing grid infrastructure do not make grid connection economically feasible for remote communities, it is technically possible that hybrid wind/solar-diesel generation systems can be deployed to lower the amount of diesel fuel needed for off-grid electricity generation. Diesel generators usually continue to be required to supplement non-emitting electricity in northern and remote communities.
• However, for many communities electricity consumption is too small to integrate wind energy cost effectively and the technical maximum solar penetration may only displace 2-10 per cent of the annual diesel use.
• Technology development can help remote communities deploy micro-grids integrating new non-emitting technologies.
• Some Northern and remote communities may not have ready access to the materials or skills required for servicing some technologies. Geographic distance and limited transportation options affect the feasibility and costs of maintenance and repair.
• Input from the AFN notes that additional action could build on current programing such as REACH, economic development and other INAC programs
• The AFN recommends that action to reduce reliance on diesel could include streams of investment focused on greatest need and readiness. Mapping the intensity and cost of diesel-dependence (including both the fuel consumed and the distance it must travel) could help to identify priority communities/projects. Capacity building and readiness activities would likely be required.
E6. Increase Interjurisdictional Transfers of Non-Emitting Electricity
POLICY GOAL: Improve interconnectedness, efficiency and flexibility of the electricity grid, and, where possible, connect remote communities to the grid
POLICY TOOL: Standalone legislative approach, whereby governments, through their applicable legislative authority, encourage the planning of grid interconnections and electricity generation on a regional basis, and establish incentives for infrastructure upgrades.

Working Group on Specific Mitigation Opportunities Final Report
174
Policy Details• This policy would aim to increase use of existing transmission capacities from jurisdictions with non-emitting
electricity sources to jurisdictions where higher-emitting electricity sources can be displaced.• This policy would facilitate the potential for some remote communities to become connected to the North
American electricity grid, thereby displacing diesel-fired electricity generation.• Applicability, potential GHG reductions and costs must be assessed at a regional and site specific level.
The estimated cost/tonne ranges are provided based on site specific examples. These examples considered levelized costs of generation and transmission and may not be representative of applications elsewhere.
• Relevant legislation, regulations and standards for electric reliability would continue to apply. • This policy may be supported through: facilitated discussions; MOUs, applicable rules, practices,
and dispute mechanisms; and streamlined approval processes. Other policies/standards with defined GHG-emission reduction targets may also provide impetus to improve interconnectedness among certain provinces and territories.
Options Est. reductions in 20301 Est. cost/tonne2
A. Increase use of existing relevant intertie capacity between jurisdictions to transfer/access non-emitting sources of electricity and displace high-emitting sources.
Up to 6.0 Mt annually by mid 2020s and continuing
to 20303
Site specific example provides range of $0-50
B. Increase existing relevant intertie capacities by the greater of 500 MW or 25%, where appropriate.
Up to 10.0 Mt4 annually (incremental to those
described in “A”)
Site specific example provides range of $50-100
C. Add new transmission capacities (up to 500 MW, as appropriate) where none currently exist, between and within jurisdictions.
>1 Mt annually Site specific example provides range of $50-100
1. Reductions were estimated based on a displacement analysis. The analysis focused on neighbouring jurisdictions where one jurisdiction has significant hydroelectric resources and the other jurisdiction relies significantly on emitting sources of generation. For the purposes of the analysis, hydroelectric jurisdictions are BC, MB, QC, NL, YT, NT. Jurisdictions relying significantly on emitting sources are AB, SK, ON, NB, NS, and NU. This resulted in the following pairs: BC-AB, MB-SK, MB-ON, QC-ON, QC-NB, and NL-NS for Levels A and B, and NT-AB, NT-SK, and MB-NU for Level C. The emissions reductions are calculated by assuming that, on average, 1 MW of capacity will provide 4.8 GWh of electricity (based on a capacity factor of 60% and line losses of 9%) and based on the emission intensity of the energy source (diesel, coal or natural gas) to be displaced by large hydro.
2. A January 2016 study conducted by the Canadian Energy Research Institute looked at options to satisfy oil sands electricity demands, relative to a base case of natural gas-fired cogeneration plants, the Alberta grid average, or coal-fired generation. It found the cost per tonne for a range of options, covering the 3 levels of ambition, to be in the $0 100/t CO2e range for coal displacement as per Table 3.2 of the report. Costs of both generation and transmission were considered. Taking only transmission costs into account, the range would be $0-50/t CO2e.
3. Potential emissions reductions may decrease over the period should the displaced fuel mix change.
4. Given that the analysis is based on the projections in the Biennial Report, and the Biennial Report did not take into account the recently announced coal phase out in Alberta, the analysis assumes that coal is displaced in Alberta. If the displaced fuel in Alberta is assumed to be natural gas, the total potential emissions reductions would be 8.7 Mt CO2e.
Further considerations:• For Level A, existing transfer capability was compared with the transfers projected in Canada’s 2016
Biennial Report. If the latter was less than the former, the analysis assumed that additional hydroelectric generation was built in the exporting province to allow for the full use94 of the existing transfer capability, to displace the highest available emitting source in the importing province.
• For Level B, rated transfer capacity was increased by the greater of 500 MW or 25% at the six relevant borders95, and new hydroelectric supply was again assumed to be built in the exporting province to displace the highest available emitting source in the importing province.
94 For reasons relating to electric reliability, maintenance, market factors and transmission line losses, the maximum transfer capability was assumed to be 55% of the rated capacity of the line.
95 A total of 3,200 MW of new transfer capability is added under this scenario.

Working Group on Specific Mitigation Opportunities Final Report
174Working Group on Specific Mitigation Opportunities Final Report
175
• Level C looked at establishing 200 MW transfer capability between NT and AB and between NT and SK, and 100 MW transfer capability between MB and NU.
• Estimated capital costs in the CERI report for possible 1,100 MW transmission links to the Alberta oil sands from BC, MB and NT range from $2-$3 billion or $2.6 - $4.5 million/km.
• The 500 MW Maritime Link under construction between NL and NS has an estimated cost of $1.5 billion or $3.6 million/km. The purpose of the analysis is to provide a general sense of magnitude of the potential emissions reductions that could be achieved through increased interconnectedness. The analysis used a general set of rules and did not consider factors specific to each pair of neighbouring jurisdictions. It is possible that some of the increased line usage (in Level A) and increased transfer capability (in Level B and C) are not economically feasible. A more sophisticated and thorough analysis (that is informed by utility data and that considers the great complexities in designing and managing electrical grids and markets) would identify specific projects that have economic merit, taking into account environmental benefits.
ECONOMIC AND CONSUMER IMPACTS• In all three levels of ambition, relevant costs to be considered include the costs of transmission
infrastructure (line and substation) upgrades, and the difference in the cost of new non-emitting electricity generation in exporting provinces and the cost of displaced emitting generation in the importing provinces.
• The cost of required infrastructure upgrades would be borne by tax payers and/or electricity consumers. National/jurisdictional competitiveness could be affected by increased electricity prices.
• Developing non-emitting electricity facilities in-province may be more cost effective than increasing non-emitting imports from neighbouring jurisdictions where the costs are borne by electricity consumers. Importing non-emitting supply from a neighbouring jurisdiction to meet reducing emission targets may limit the development of renewables and the ability to meet provincial renewable energy development targets in the importing jurisdiction. The potential for expanded intertie capacity between provinces should also consider the impact on independent power producers, particularly within the provinces of Alberta and Ontario given their unique market designs.
• Impacts would depend on how and where the increased transfer capability is achieved, and the source of the non-emitting electricity to displace high-emitting electricity sources.
• Positive impacts would include: expanded export markets; increased access to non-emitting energy imports; increased opportunity to sell surplus supply; and economic activity and direct/ indirect jobs to construct/operate new generation and transmission projects.
• Additionally, increasing flows of non-emitting electricity within and between Canadian jurisdictions may impact export capacity/flexibility to the US.
CONSIDERATIONS
Co-benefits/negative impacts:• Co-benefits include improved air quality and reductions in air pollutants, particularly in remote
communities currently serviced by diesel.• An expanded electric grid would provide increased electric reliability for Canadians – interties provide
flexibility to meet changing supply-demand conditions, e.g. manage peak load.• Increased interconnectedness enables management of variability of solar/wind over larger geographic
area and time zones, which could facilitate an increased penetration of renewables onto the grid.• Increased interconnectedness may also enable or extend the reach of other applicable greenhouse
gas emission reduction policies.
Linkages to other working group areas and other proposed policies • This option supports the Canadian Energy Strategy goals to “Support greater access to affordable, clean,
and reliable supplies of energy for all Canadians” and to “Facilitate greater exchanges and transfers of energy between or across the provinces and territories”.

Working Group on Specific Mitigation Opportunities Final Report
176
Indigenous Perspectives: • Input from the AFN notes that increased grid efficiency and flexibility will be important to accept
large quantities of distributed renewable energy generation, including solutions for rural and remote electrification.
Regional impacts including northern and remote communities:• Could provide enhanced opportunity for some remote communities, including Indigenous communities, to
access non-emitting sources of electricity, thereby replacing diesel. Also provides future access to remote commercial opportunities – e.g. mining, oil and gas operations.
• To increase intertie benefits, may need to reassess transmission agreements and market rules, open access and tariffs related to import/export considerations on broader, regional basis.
• To maximize the benefits that could be realized by this policy, it would be essential for the policy approach to take into consideration existing planning processes and regional policies with the goal of harmonizing the policy with provincial and/or territorial plans.
Implementation, feasibility, technological and enabling infrastructure issues:• Level A would require 8 terawatt-hours of new non-emitting electricity supply to be built in the exporting
provinces. Level B would require a further 15 terawatt-hours of new non-emitting electricity supply. Level C would require 2 terawatt-hours of new non-emitting electricity supply.
• Upgrades to transmission and distribution systems would require up front capital outlay as well as regulatory and environmental approvals. Regulatory approvals typically require demonstration that the upgrades are needed and in the public/ratepayer interest of the particular province or territory, and that alternatives are thoroughly assessed as well.
• Establishing new interties will require consultation/access agreements with affected landowners and Indigenous communities.
• Transmission infrastructure could be overbuilt leading to a less efficient use of the system.
Agriculture
A1. Reduction of Methane Emissions from Cattle
POLICY GOAL: Reduce methane emissions from beef and dairy cattle in Canada.
POLICY TOOL: Incentive and educational tools
Policy Details• Adding oil/oilseed to diets can decrease the methane emissions by up to 20%. Incentives and extension
programs would be needed to overcome differential pricing between canola or other alternatives and traditional, lower cost feed grains.
• Shorter duration times of all phases for beef cattle (cow-calf, background, finishing) brings the animals to market weight more quickly, avoiding additional days of methane emissions.
• Incentives would need to be flexible to respond to seasonal/annual fluctuations in market drivers (pricing).• Options for feeding oils/ oilseeds apply to both beef (pasture, background and feedlot) and dairy cattle.
Reduced age of harvest applies to beef cattle.• All options start in 2018 and assume 2014 populations.

Working Group on Specific Mitigation Opportunities Final Report
176Working Group on Specific Mitigation Opportunities Final Report
177
Options Est. reductions in 2030* Est. cost/t**
A. 10% adoption of feeding oils/ oilseeds (6-7% of dry matter intake) for beef and dairy cattle
<1 Mt $50-$100
B. 30% adoption of feeding oils/ oilseeds (6-7% of dry matter intake) for beef and dairy cattle
<1 Mt $50-$100
C. 10% adoption of reduced age at harvest by 60 days for beef cattle
<1 Mt $0-$50
D. 30% adoption of reduced age at harvest by 60 days for beef cattle
1-2 Mt $0-$50
* +/- 20-50% uncertainties should be applied to individual estimates. Emission factors are based on IPCC 2006 estimates used in Canada’s National Inventory Report, which are 17% higher than compiled research from Canadian studies.
** Includes only government costs.
ECONOMIC AND CONSUMER IMPACTS• Since producers are responding to market signals, policies directed at changes to grading system standards
and educating consumers are needed to support market demand.• Incentives would be needed to address costs to producers of edible oils/ seeds relative to lower priced
feed grain alternatives (including increased management effort and time for logistics of storing, feeding, and mixing). However, there could also be some benefits of feed savings since canola seed provides a high energy diet relative to extra storage and handling of crushed canola seed.
• Reduced age of harvest will have co-benefits of lower feed costs, shorter feedlot residence times, less yardage costs per animal, although animal numbers may increase to utilize these resources (potential for leakage).
CONSIDERATIONS
Co-benefits/negative impacts:• Some potential for minimal co-benefits (e.g., dust control) associated with feeding oils• Knowledge gained concerning management of supplements in pasture feeding contexts may support
use of emerging technologies (e.g. 3NOP – methane inhibitor)
Linkages with other working group areas and other proposed policies: • Changing feeding strategies on pasture and encouraging calves to be put into feedlots earlier may have
impacts on needs and availability of forage stocks. Could influence adoption rates of perennial crop initiatives.
Regional impacts including northern and remote communities:• This is a cattle program area. Alberta has many of the beef cattle in Canada (46 %) and thus would
be the most impacted (both policy options).• Canadian dairy cattle are dominantly located in Quebec and Ontario (70 % of dairy cows - feeding oils
option).
Implementation, feasibility, technological and enabling infrastructure issues:• Additional record keeping would be needed to capture emission reductions in national inventory.• Co-benefits to producers would likely be minimal. Incentives and extension would therefore be required
to encourage adoption. • Canada could be seen as a global leader if these voluntary policies could be implemented. Methane
emissions from ruminants is a concern in many countries. Canada already has many advantages of utilizing natural grasslands to produce protein.

Working Group on Specific Mitigation Opportunities Final Report
178
A2. Convert Marginal Land from Annual Crop Land to Permanent Cover
POLICY GOAL: Increase conversion of marginal land from annual crop to permanent cover
POLICY TOOL: Financial incentives
Policy Details• Eligibility requirements should be included in the policy to include a minimum land conversion amount,
agreement to follow specific management practices and a commitment to develop a long term monitoring and management plan.
Options Est. reductions in 2030 Est. cost/tonne*
A. Increase percentage of annually cropped marginal land (class 5 and 6) converted to permanent cover crops by 5% between 2017-2021 (1%/ year).
<1 Mt $0-$50
B. Increase percentage of annually cropped marginal land (class 4, 5 and 6) converted to permanent cover crops by 5% between 2017-2021 (1%/ year).
<1 Mt $0-$50
* Includes only government costs.
ECONOMIC AND CONSUMER IMPACTS• Converting annual cropping to permanent cover crops might increase net farm income in the long term.
However, as this measure is costly in the shorter term, a financial incentive will be required. • More land in permanent cover could lead to an increase in the cattle herd which has an economic impact.• Eligibility requirements that restrict land use over a given time period may impact land prices. Producers
may be reluctant to enter into long term contracts.
CONSIDERATIONS
Co-benefits/negative impacts:• Less soil erosion • Increase in organic matter and soil microbial diversity• Improved water infiltration, which reduces run-off and helps adapt to extreme precipitation events• Improved soil structure and nutrient cycling• Enhanced wildlife habitat and increased biodiversity • Reduction in GHG emissions associated with a decrease use in fertilizer and on farm machinery may occur• An increase of land in forages as a result of this policy could increase livestock numbers, which could
increase GHG emissions from the livestock sector. Assessment at whole farm basis and by stage in production cycle would be needed to determine trade-offs
Linkages with other working group areas and other proposed policies:• Afforestation (F2) is an alternative option for use of marginal agricultural land. • Under a carbon pricing system, there is potential for carbon offsets to be generated from permanent cover
crop conversion
Regional impacts including northern and remote communities:• This option would apply differentially to regions that have a significant amount of annual crop production
on marginal land.

Working Group on Specific Mitigation Opportunities Final Report
178Working Group on Specific Mitigation Opportunities Final Report
179
Implementation, feasibility, technological and enabling infrastructure issues:• Implementation would require demonstration of additionality (that the practice is above and beyond
business as usual), and address issues related to permanence, carbon stock equilibrium and carbon leakage. For instance, permanence risk issues could be addressed by establishing a buffer pool based on a likelihood of the rate of reversal by region. Discounted amounts in the pool could be used as insurance against possible future reversals and may be increased or decreased according to rates of use
• There may be technological challenges in the ability to measure outcomes for reporting purposes• Under the 2005 baseline policy, if in 2030 the carbon sink in a province (including any measures that
increases the sink from 2015 to 2030) is below the 2005 sink level, this province will not be able claim this measure. This affects the estimated reductions in 2030 outlined in the table above.
• There is potential for biomass produced from permanent cover/perennial crops to supply biofuels/bioproducts markets.
• Growing annual crops generates higher returns than perennial crops; a sufficient incentive would be required to encourage adoption.
A3. Increase Acres of Nitrogen Fixing Crops, Pulses/Forages in Rotation
POLICY GOAL: Increase acres of nitrogen fixing crops, pulses/forages in rotation
POLICY TOOL: Extension, research and incentives
Policy Details• Increasing the percentage of acres under pulses and soybeans, where agronomically sustainable:
» No financial incentives to producers required. » Ongoing extension and research efforts (especially cultivar development).
• Increasing acres of perennial legumes, cover crops and intercrops: » Likely to require some form of producer incentives (at least in the short term). » Ongoing extension, technology transfer and research efforts » Perennial forages have generally not been competitive with annual crops on non-marginal lands and often
there is not a prominent livestock sector in crop-dominated areas to utilize the forage resource to any great extent requiring expensive transport of the forage. However, there are potential biofuel/bioproduct markets for perennials.
» Cover crops are not yet widely adopted in Canada and will likely require incentives for increased uptake in the short term, even though there are soil and yield benefits to growing cover crops.
• Intercropping with legumes will also likely require incentives to be adopted in significant numbers, at least in the short term, as this practice is not widely adopted and may require equipment and crop rotation modifications.

Working Group on Specific Mitigation Opportunities Final Report
180
Options Est. reductions in 2030 Est. cost/tonne*
A. Increase soybean acres in Canada from 5.3 M acres (est.)in 2016 to 8 M acres in 2030
<1 Mt $0-$50
B. Increase pulse acres in Canada from 9.7 M acres (est.) in 2016 to 11.3 M acres in 2030
<1 Mt $0-$50
C. Increase perennial legume forage acres in Canada by 3% from 2016 to 2030
<1 Mt $0-$100
D. Increase legume cover crops from low levels in 2016 to 10% of land growing crops by 2030
<1 Mt $50-$100
E. Increase legume intercrops from non-significant in 2016 to 5% of canola acres in 2030
<1 Mt $50-$100
* Includes only government costs.
ECONOMIC AND CONSUMER IMPACTS• There is opportunity to decrease farm fertilizer input costs with incorporation of N- fixing crops in crop
rotations; however there could be negative impacts on rotations if grown too frequently.• Research on inclusion of pulses and perennial legumes in crop rotations has identified non-N benefits
to be just as important as residual soil N to the increased yield of subsequent crops.• Consumer impacts are expected to be negligible to low.
CONSIDERATIONS
Stakeholder perspectives: • Pulse and soy industry associations are supportive of increasing acres of their commodities; however,
other commodity associations (e.g., grains and oilseeds groups) would not favour this initiative. Increased Canadian domestic consumption is being promoted by Pulse Canada and provincial pulse grower associations in 2016 as a way to increase the market for Canadian grown pulses. Forage commodity groups (e.g. Canadian Grasslands and Forage Association) support increasing forages in rotations, as do conservation groups such as Ducks Unlimited Canada.
Co-benefits/negative impacts:• Nitrogen-fixing crops: benefits to subsequent crops, including increased water availability and pest
suppression or interruption. Resilience against market fluctuations as diversity increases in crop rotations.• Cover crops and perennial legumes: increased soil organic matter; increased nutrient cycling; increased
water infiltration; reduced soil erosion; increased soil microbial diversity• Potential negative impacts: Increasing soybean’s share within a crop rotation under certain circumstances
can be undesirable from a soil health perspective and have a negative impact on soil carbon. Cover cropping may be challenging to implement in regions that are prone to water shortages and drought. Increasing legumes in rotations is also potentially at odds with nutrient management objectives or other mitigation activities in some regions, i.e., might reduce acres suitable for manure applications. Not all pulse crops are equally effective for GHG mitigation
Regional impacts including northern and remote communities:• Not all regions of Canada grow the same types of legume or forage crops. Pulse crops are strongly
concentrated in Saskatchewan compared to other provinces. Soybeans are mainly grown in eastern and central Canada, but their range is expanding westward and northward as a result of new cultivars and climate change.
• The opportunity to reduce GHG emissions from increased soybean acreage will vary by region and in some regions further expansion may not be desirable from a soil health perspective.

Working Group on Specific Mitigation Opportunities Final Report
180Working Group on Specific Mitigation Opportunities Final Report
181
• Cover cropping is more common in eastern Canada, but should increase in the west as growing seasons continue to lengthen. Cover cropping may also be challenging to implement in regions (e.g., BC interior) that are prone to water shortages and drought.
Implementation, feasibility, technological and enabling infrastructure issues:• Some potential for minor technical issues related to intercropping (e.g., harvesting, seed separating,
herbicides, etc.) and perhaps cover cropping (e.g., seed sourcing). • Continued applied research on the practical aspects of intercropping with legumes will help solve some
technical barriers for widespread adoption of this practice.• The technology needed is available for the most part, but could be improved/developed in the area
of intercropping, e.g., innovations in planting, fertilizer placement and harvesting. • Market signals will dictate which crops farmers will grow. Domestic consumption of pulses will have
little influence on global prices, since Canada is a relatively small market and will remain a ‘price taker’ for these commodities.
A4. Increase Adoption of Zero Till
POLICY GOAL: Increase percent of land in zero and minimum till
POLICY TOOL: In some circumstances there is no need for policy action from government. However, in other circumstances there may be a need for policy action such as incentives.
Policy Details• Where no policy action is required farmers will increase zero till acres for reasons other than
for soil sequestration.• There may be a need for incentives and extension in some jurisdictions to move producers away from tillage.• This proposal is aimed at land seeded to annual crops. Rather than working up perennial forage prior
to seeded annual crops, there may be opportunities for zero till in seeding annual crops into a perennial unbroken forage stands.
Options Est. reductions in 2030 Est. cost/tonne*
A. Increase percentage of land under no-till from 2011 baseline:
• In Alberta from 65 percent in 2011 percent to 85 percent in 2030;
• In Saskatchewan from 70 percent in 2011 to 90 percent in 2030.
• In Manitoba from 24 percent in 2011 to 50 percent in 2030.
• In Peace River region of BC from 30 percent in 2011 to 50 percent in 2030.
<1 – 1 Mt $0-$50
B. Increase percentage of land under no-till from 2011 baseline:
• In Alberta from 65 percent in 2011 percent to 75 percent in 2030;
• In Saskatchewan from 70 percent in 2011 to 80 percent in 2030.
• In Manitoba from 24 percent in 2011 to 40 percent in 2030.
• In Peace River region of BC from 30 percent in 2011 to 40 percent in 2030.
<1 Mt $0-$50
* Includes only government costs.

Working Group on Specific Mitigation Opportunities Final Report
182
ECONOMIC AND CONSUMER IMPACTS• No significant economic impact
CONSIDERATIONS
Co-benefits/negative impacts:• Less soil erosion • Increase in organic matter and soil microbial diversity• Improved water infiltration which reduces run-off and helps adapt to extreme precipitation events• Improved soil structure and nutrient cycling• More adaptability to drought conditions, better seed emergence• In wet and cold conditions, and where soils are heavier with more clay in them, soils take longer
to dry and warm up compared to conventional tilled soils. Not tilling can delay the growing season.
Regional impacts including northern and remote communities:• This affects the three Prairie Provinces and the Peace River Region of BC. • Producers in the Prairie provinces are very familiar with the technology and have been doing this for years.
It is assumed that producers who use intensive tillage, for example row crops in Manitoba would not be moving to zero till. It is assumed that a portion of producers practicing minimum till in 2011 would be moving their acres to zero till under this proposal.
• In areas outside these jurisdictions, producers are not as familiar with no-till and do not have the necessary equipment or may need to modify their equipment. This would hinder adoption of this practice.
Implementation, feasibility, technological and enabling infrastructure issues:• Under the 2005 baseline policy, if in 2030 the carbon sink in a province (including any measures that
increases the sink from 2015 to 2030) is below the 2005 sink level, this province will not be able claim this measure. This affects the estimated reductions in 2030 outlined in the table above.
• Carbon sequestration in agricultural soils can be non-permanent if the soil is disrupted or if the reduced tillage practices are abandoned.
• Permanence risk issues could be addressed by establishing a buffer pool based on a likelihood of the rate of reversal by region. Discounted amounts in the pool could be used as insurance against possible future reversals and may be increased or decreased according to rates of use
• There is some evidence that farmers in the prairies are moving away from zero till due to disease pressures and other agronomic reasons such as the need to warm and dry out the soil. This may due to the wetter conditions in recent years.
• Weed resistance to the glyphosate herbicide, a low cost herbicide critical to the economics of zero till, could have a significant impact on the practice. Without a low-cost chemical to control weeds in the spring, farmers would likely revert to a tillage operation for weed control. Glyphosate resistant weeds have become a major problem in Australia and the Southern United States. Governments will need to work with producers and industry to minimize the spread of Glyphosate resistant weeds and look at developing cost effective alternatives.
• The no-till technology is off the shelf and has been around for years, it is assumed that farmers will continue to use the same technology with on-going improvements as they become available.

Working Group on Specific Mitigation Opportunities Final Report
182Working Group on Specific Mitigation Opportunities Final Report
183
A5. Enhance Adoption of Available Technologies that Capture and Destroy/ Treat Methane from Manure Storage Systems
POLICY GOAL: Capturing and destroying/treating methane from manure storage systems
POLICY TOOL: Financial incentives
Policy Details• Government subsidies to support adoption of available technologies that capture and destroy/treat methane
from manure storage systems on large farms (e.g., public investment, for example covering 70% of establishment costs).
• Cost-share support towards design and construction of biogas systems and digestate storage equipment.• Producers must have a manure storage system in place to adopt methane management technologies.
This option assumes all manure storage systems are in place and ready to be covered• Would include biofilter/catalytic oxidation on dairy and non-dairy cattle, swine and poultry farms
and anaerobic digestion on dairy and swine farms
Options Est. reductions in 2030 Est. cost/tonne
A. Biofilter/catalytic oxidation on dairy and non-dairy cattle, swine and poultry farms, covering up to 2 % of manure storage systems in Canada by 2030
<1 Mt >$250
B. Anaerobic digestion on dairy and swine farms, covering up to 2 % of manure storage systems in Canada by 2030
<1 Mt >$250
C. Biofilter/catalytic oxidation on dairy and non-dairy cattle, swine and poultry farms, covering up to 5 % of manure storage systems in Canada by 2030
<1 Mt >$250
D. Aerobic digestion on dairy and swine farms, covering up to 5 % of manure storage systems in Canada by 2030
<1 Mt >$250
ECONOMIC AND CONSUMER IMPACTS• This option requires significant investments for limited estimated reductions, and is therefore not very
cost effective. Projects are unlikely to be completed without government support. • Biogas can generate cost savings if used to produce energy on farms. Using a centralized digester and
aggregated projects to share costs might be more economically attractive to farmers, though it depends on regional context.
• The distribution between public and private benefits should be reflected in the level of government support.• Reduced N loss from NH3 volatilization could be significant for producer as they will not need to
compensate by fertilizers. • The life span of poly covers is not very long (those installed in Quebec are guaranteed for 10 years) so
this represents a significant capital investment which would possibly only yield medium-term returns.• CONSIDERATIONS
Co-benefits/negative impacts:• Improved air quality, and odour reduction in rural areas, potentially improving neighborhood relations. • Potential GHG avoidance in landfills by facilitating food waste reutilization.• Potential reduction of mineral N requirements (replaced by organic N from reduced NH3 losses)
by approximately 75 kilotons for Canada represent significant savings to farmers

Working Group on Specific Mitigation Opportunities Final Report
184
Linkages with other working group areas and other proposed policies: • Landfill ban on organics (W3) is a lever for this option as it could increase the use of digesters.
(The reduction in emissions from this option does not include associated avoided landfill emissions). • This option could be included as an offset protocol under a carbon pricing system. (E.g., Quebec’s
cap-and-trade system includes an offset protocol for covered manure storage facilities). A sufficient price signal would be needed to support uptake. Participation in offset projects would require support for farmers to participate, including feasibility studies, monitoring, reporting, and verification.
Regional impacts including northern and remote communities:• Level of uptake is likely to be significantly different depending on the region due to differing renewable
energy and organic waste reduction/reutilization policies.
Implementation, feasibility, technological and enabling infrastructure issues:• Although this option could in theory be scaled up to target a larger percentage of manure storage systems,
there are multiple barriers to implementation in practice. These include lack of access and competition for inputs such as food wastes, variation in manure storage systems, and high operations and maintenance costs that act as a disincentive to farmers.
• Anaerobic digestion in dairy and swine farms can include up to 50% food wastes to make on-farm digesters economically viable. This implies the need to be located close to large urban centers or food processing facilities, which may not always be the case in some parts of Canada. Energy crops are alternative inputs.
• Very cold winters in parts of the country may reduce the efficiency of anaerobic digestion. • Anaerobic digestion is intended to be for energy production systems, whether thermal, combined heat and
power or cogeneration, renewable natural gas (RNG). It is not intended that anaerobic digestion be a passive manure treatment where little to no energy is produced. Anaerobic digestion in winter producing electricity has ample surplus heat. RNG will require partial utilization of the biogas for system heating.
• Use of biogas as an energy source would require policy and regulatory development for energy utilization either through energy purchase contracts, net metering program, or feed-in tariff program and/or program alignment with organic waste reduction and reutilization goals.
• Further research is needed to improve the efficiency of biofilters and optimize catalytic oxidation • Poly covers are much less expensive but are less practical for farmers to use, unless technological
improvements include reinforcements to cover when manure is mixed and emptied. There are also concerns with fugitive emissions from both purpose built and polycovers.
A6. Increase the Total Crop Area on which Precision Application Methods for Nitrogen Fertilizers are used
POLICY GOAL: Reduce Nitrous Oxide (N2O) Emissions through Improved Nitrogen (N) Fertilizer Use
POLICY TOOL: Financial incentives
Policy Details• Targeted or varied nutrient application rates are still an emerging practice. Revenue from hypothetical offset
credits was modelled where earnings are generated if there is a reduction in N fertilizer use from improved application methods. The scenario covers crop producers in all provinces. It is assumed, based on expert opinion, that adoption of improved management practices and application methods could reduce N fertilizer use by 12% at a cost of between $5 and $12 per hectare.
• The baseline is 2020. N fertilizer prices in 2020 were estimated at $1.46/kg in the west and $1.60/kg in the east. GHG coefficients from nitrogen fertilizer application come from the National Inventory Report. The revenue streams represent these GHG coefficients multiplied by different carbon prices ranging from $20 to $100 per tonne of CO2e.
• In some cases, support in the form of education may be sufficient to overcome barriers to adoption (e.g., risk aversion, lack of information), as reduced fertilizer use could generate cost savings.

Working Group on Specific Mitigation Opportunities Final Report
184Working Group on Specific Mitigation Opportunities Final Report
185
Options Est. reductions in 2030 Est. cost/tonne*
A. Financial incentive of $20/tonne of CO2e <1 Mt $0-$50
B. Financial incentive of $40/tonne of CO2e <1 Mt $0-$50
C. Financial incentive of $100/tonne of CO2e 1 Mt $50-$100
* Includes only government costs.
ECONOMIC AND CONSUMER IMPACTS• Cost of implementation to farmers could possibly higher depending on application method (e.g. split
application) or the need for equipment retrofitting, related services or software or additional fuel consumption. • The implementation cost would be offset to varying degrees by the reduced cost of using less fertilizer.
The cost-benefit ratio will vary regionally depending on agricultural production systems.• The goal of these practices is enhancement of fertilizer use efficiency, i.e. less fertilizer used per amount
of crop produced so no yield reduction or impact on food price is anticipated
CONSIDERATIONS
Co-benefits/negative impacts: • Improved nitrogen application methods help to reduce the risk of water and air pollution.
Linkages with other working group areas and other proposed policies: • This option could be included as an offset protocol under a carbon pricing system. (E.g., a protocol for
Agricultural Nitrous Oxide Emission Reductions is available under Alberta’s offset market). A sufficient price signal would be needed to support uptake.
Regional impacts including northern and remote communities: • Regions producing a large amount of annual crops and where N fertilizer use represents a significant
proportion of their total costs per hectare, such as Central and Eastern Canada, will benefit more from the adoption of improved fertilizer application methods.
• The adoption costs in these regions can be negative (i.e. a net benefit through cost savings) while adoption costs in Western provinces will be higher.
Implementation, feasibility, technological and enabling infrastructure issues: • Determining nutrient requirement is challenging due to the interactive effects of environmental conditions,
such as rainfall, temperature, and pests, with soil. Strategies such as split fertilizer application may be needed to manage potential risks of unforeseen crop responses to nutrient additions.
• Innovative fertilizers are being developed that could greatly improve the efficiency of fertilizer uptake by plants and reduce applied quantities; support for innovation and research are key to advancing these technologies to market and making them affordable.
• Limited data on fertilizer application rates and methods means that the baseline is not well known, making estimates of additionality challenging. Also, the assumption around the percentage reduction in N fertilizer use is based on expert opinion and should be validated scientifically.
• To date, the reduction in N application cost has not been high enough to offset revenue losses from yield reductions resulting from insufficient N application.

Working Group on Specific Mitigation Opportunities Final Report
186
Forestry
F1. Increase Domestic Wood Use as a Substitute Material for More Emissions-Intensive Building Products
POLICY GOAL: Achieve increased use of wood-intensive construction including tall wood buildings as a long-term mitigation contribution.
POLICY TOOLS: Investments in demonstration wood-intensive construction projects and in the education, training and changes to codes and standards necessary for wood-intensive construction to become commonplace.
Policy Details• Funding for activities to support adoption of tall wood buildings into the National Building Code
of Canada (NBCC).• Funding for the development and provision of training/education programs, design software, and life-cycle
assessment tools for architects, engineers, code officials and builders interested in building with wood, including engineered wood product (i.e., products manufactured by binding wood particles, fibres, or pieces together with adhesives or other methods to form composite materials with specific characteristics).
• Financial support for wood-intensive structures as demonstration projects to catalyze increased interest in and use of wood in tall and mid- rise buildings, timber bridges, industrial buildings and commercial box-type construction projects.
The mitigation benefits of this option result from making more use of long-lived wood products in domestic construction. Increased domestic use of wood products will provide long-term carbon storage and can contribute substantially less GHG emissions than concrete or steel on a life-cycle basis, when used in comparable construction projects. Success in catalyzing interest in wood-intensive construction could increase mitigation above that estimated for 2030, and continuing beyond 2030.
Options Est. reductions in 2030* Est. cost/tonne
A. High-uptake of wood-intensive building designs and proposed building code changes. Projects maximize wood-use and achieve an average of 4000 t CO2e avoided per building.
2 Mt $0-50
B. Low-uptake of wood-intensive building designs and proposed building code changes. Projects focus on hybrid rather than wood-intensive designs and achieve an average of 1000 t CO2e avoided per building. Assumes the same number of structures as alternative A.
<1 Mt $0-$50
* Note: Storage of carbon in wood and recycling of wood are not included in the estimate of emissions reductions. However, at the end-of-life of wood intensive structures, additional mitigation benefits can be realized by using the wood for bioenergy or re-using /re-fabricating it into new structures or other products
ECONOMIC AND CONSUMER IMPACTS• Building with engineered wood products could be cheaper than traditional non-wood intensive alternatives.• Increased production and use of engineered wood products would create more jobs, and add value
compared to commodity wood products such as lumber. There would be indirect economic benefits and job creation for rural forest-based communities.
• Companies currently manufacturing emissions-intensive building materials that are replaced by wood could experience lost revenue.

Working Group on Specific Mitigation Opportunities Final Report
186Working Group on Specific Mitigation Opportunities Final Report
187
CONSIDERATIONS
Co-benefits:• This option would drive further clean-tech building innovation, building on collaborative efforts of the
federal government and various stakeholders (i.e. FPInnovations, Sustainable Development Technology Canada, Canada Wood Council, etc.). It is explicitly aimed at fostering innovation in Canada’s construction industry through development of demonstration projects and wood design and construction tools.
Linkages with other working group areas and other proposed policies: • There are potential long-term linkages to afforestation and forest management policy options as they can
influence availability of wood for use in engineered wood products.• Carbon pricing mechanisms cannot directly encourage actions that take advantage of life-cycle mitigation
benefits, as is the case with this option.
Implementation, feasibility, technological and enabling infrastructure issues:• This option leverages past and current efforts to promote wood use in construction by focusing on domestic
uses in a broader range of construction projects. • A target of 450 wood-intensive structures is considered appropriate to achieve the mitigation amount and
the goal of catalyzing greater use of wood, but uptake would need to be monitored over time. Projects could be a mix of building designs ranging from current hybrid wood building designs to first-of-kind mass timber wood-intensive designs. The project mix would determine the overall mitigation benefits.
• Many of the technologies for more intensive construction uses of wood are already demonstrated, commercialized and used in other countries.
• The National Building Code of Canada currently limits tall wood building construction. Thus a key aspect of this option is contributing to future changes in the Code, and in provincial/territorial building codes – specifically changes towards a performance-based (material-neutral) code that will treat all construction materials in the same way.
• Fire risks are minimal when wood buildings are designed properly and appropriate fire protection strategies are implemented, especially during construction. Tests funded by NRCan, provinces and industry have demonstrated excellent fire performance that meets the intent of the building code.
• Currently there is a gap in education in Canada about wood’s potential as an advanced and sustainable building material. Academia, architects, engineers and builders focus largely on concrete and steel construction. This option would supplement existing training with education in advanced modern techniques in wood construction, and support creation of tools to assist professionals in incorporating wood into their building or infrastructure construction.
• The investments in wood intensive structures, training, tools and changing building codes are meant to foster broad acceptance and adoption of wood-intensive building practices – a change in mind-set – that will would result in even higher mitigation in the future.
• Growth in the supply chain of engineered wood products would be needed to help support the increased demand for wood-intensive structures.
F2. The New Forest Program
POLICY GOAL: Substantially increase the area of newly forested land (afforestation).
POLICY TOOLS: Cost sharing agreements with landowners, and technical support.
Policy Details• Cost sharing agreements with landowners to significantly reduce high up-front costs that pose a significant
barrier to creation of new forests (i.e., site preparation, seedling and planting costs, but not land purchase costs). A large portion (e.g., 50-95%) of establishment costs could be covered with incentives tailored to the type of land and landowner objectives. Eligibility requirements could include planting of at least

Working Group on Specific Mitigation Opportunities Final Report
188
one hectare in size, choice of tree species resilient to climate change, agreement to follow sustainable forest management practices including replanting if harvesting occurs in the future, and implementation of long term monitoring and forest management plans.
• Provision of information and technical support for landowners to raise awareness of afforestation, encourage participation and facilitate new forest establishment and management.
This option would support substantial additions to the forest landscape by encouraging a variety of landowners (e.g., private, municipal) to create new forests. Most planting likely would occur on privately-owned marginal agricultural land, of which there is a very substantial area in Canada. Native grasslands and prime agricultural land are not the focus although farmers could plant trees as part of agroforestry. Also, this option does not cover planting of individual trees or small groups of trees. The alternatives reflect different choices about species to use: while slower-growing species (option B) provide relatively little mitigation in 2030, as they continue to grow they provide much more in 2050 (6 to 8 Mt).
Options Est. reductions in 2030* Est. cost/tonne**
A. One billion tree planting program between 2017 and 2030 focused on mitigation in 2030 with a mix of tree species including almost 60% short rotation, fast growing species. Planting rates would ramp up to the full level of 50,000 ha per year by 2021 (about 600,000 ha planted in total).
4 - 7 Mt $0-50
B. One billion tree planting program between 2017 and 2030 that serves a range of goals including long-term mitigation and ecological co-benefits by using traditional slower-growing species. Planting rates would ramp up to the full level of 50,000 ha per year by 2021 (about 600,000 ha planted in total).
1 - 2 Mt* $0-50
C. 250 million tree planting program between 2017 and 2030 focused on mitigation in 2030 with a mix of tree species including almost 60% short rotation, fast growing species. Planting rates would ramp up to the full level of 12,500 ha per year by 2021 (about 150,000 ha planted in total). This is a scaled-down version of option A.
1 - 2 Mt $0-50
* Mitigation would be substantially higher in 2050, because trees will continue to grow and sequester more carbon.
** These costs are based on estimates of GHG reductions beyond 2030, and so reflect the fact that trees will continue to grow and provide climate benefits for longer time periods.
ECONOMIC AND CONSUMER IMPACTS• Landowners will be provided with an additional land use option that could increase diversification of rural
economies. Some landowners may be interested in harvesting trees in the future (this would occur after 2030) to generate revenue, although re-planting of trees would be required.
• The option could include a sub-component directed at tree planting on reserve land and could act as a source of economic development for Indigenous peoples.

Working Group on Specific Mitigation Opportunities Final Report
188Working Group on Specific Mitigation Opportunities Final Report
189
CONSIDERATIONS
Co-benefits:• Depending on tree species used, planting locations and landowner objectives for their forests, co-benefits
could include enhanced habitat for wildlife, increased biodiversity, improved soil quality due to reduced erosion, watershed protection, and promotion of greener communities. This option would provide a highly visible way to address climate change.
Linkages with other working group areas and other proposed policies: • Landholders may harvest trees in the future for wood products and/or bioenergy. In the long-term,
this option has potential linkages to options that encourage greater use of bioenergy and wood.• While offset systems can be designed to stimulate afforestation, this option would likely yield more
mitigation than would be possible through afforestation offset projects.
Implementation, feasibility, technological and enabling infrastructure issues:• Afforestation refers to creating forests on land that has never been forest or has not been forest for a long
time. This activity has historically been very limited (average of 2,750 hectares per year in 2000 to 2008, the latest year for which data are available from Canada’s greenhouse gas inventory).
• Program implementation could be coordinated with or undertaken by existing tree planting agencies (e.g. Tree Canada, Forests Ontario, conservation authorities, and other entities) to take advantage of their practical experience, organizational infrastructure and access to potentially interested landowners. It would make sense to harmonize eligibility criteria with existing efforts.
• The potential for increased afforestation to generate mitigation varies by region due to differences in land availability, tree growth rates, and costs as well as the lack of certainty about future markets for biomass from fast-growing trees. Variable incentives could be designed to reflect these differences so as to cost-effectively achieve mitigation. Most of the afforestation is expected to occur in the Prairie Provinces due to the relatively large area of marginal agricultural land there.
• It will be important to choose tree species that could survive and grow well under expected future climate conditions.
• Alternatives A and C include planting of almost 60% fast-growing short-lived trees that can produce substantial mitigation by 2030. It is assumed that these areas will be harvested, but the emissions that result will be offset trees that are still growing.
• The range shown for mitigation reflects uncertainties in growth rates as well as risks, including the possibility that tree growth or survival will be affected by drought, insects, disease or fire. While using only short-lived fast-growing species would produce even more mitigation than in Alternative A, the risks are also higher. Participating landowners would be required to take actions to reduce risks and commit to long-term maintenance of afforested areas as forest, including after harvesting.
• An assessment would be required of existing tree seed inventories and nursery infrastructure, and the cost of cone/seed collection. Sufficient, appropriate cone/seed and tree seedling stock would need to be developed.
F3. Increased Forest Rehabilitation
POLICY GOAL: Increased rehabilitation of naturally disturbed Crown forest lands for long-term mitigation benefits.
POLICY TOOL: Funding of increased forest rehabilitation activities.
Policy Details• Support for substantially increased rehabilitation of naturally disturbed Crown forests to 2030 (for example,
forests disturbed by insect outbreaks, wildfire, disease or windstorms). Actions would include fibre recovery to facilitate regeneration and reduce fire risk, stopping burning of dead biomass in the forest and instead

Working Group on Specific Mitigation Opportunities Final Report
190
remove it for bioenergy or products, planting of trees to accelerate and improve forest regeneration, and monitoring and follow-up to ensure regeneration success. Species used would be locally appropriate, consistent with government policies. Lands planted would be within the managed forest but not covered by existing obligations or plans for rehabilitation. Criteria for choosing sites to rehabilitate might include cost efficiency, sites with a lot of dead biomass as a result of the natural disturbance, sites where the forest has not regenerated well or is not expected to, perhaps because of a changing climate, and potential adaptation benefits.
Provinces and territories already have programs to rehabilitate forest lands affected by natural disturbances. This policy option would increase rehabilitation above these levels. The estimated mitigation benefits result from faster and better forest growth but these benefits occur over the long term because the species planted will typically be slow-growing. As a result, this option provides relatively little mitigation in 2030, but offers substantial mitigation in the longer term. In 2050, it would provide between 3 and 11 Mt CO2e depending on the alternative. When considered over an even longer period the cost would fall well below $50/t because mitigation benefits continue to accrue as result of the initial rehabilitation investments.
Options Est. reductions in 2030* Est. cost/tonne**
A. Support rehabilitation of about 4 million hectares of Crown lands affected by natural disturbances by 2030 to accelerate and improve forest regeneration, where such efforts are not currently required.
<1 Mt $50-100
B. Support rehabilitation of about 1.1 million hectares of Crown lands affected by natural disturbance by 2030 to accelerate and improve forest regeneration, where such efforts are not currently required.
<1 Mt $50-100
* Mitigation would be substantially higher in 2050, because trees will continue to grow and sequester more carbon.
** These costs are based on estimates of GHG reductions beyond 2030, and so reflect the fact that trees will continue to grow and provide climate benefits for longer time periods.
ECONOMIC AND CONSUMER IMPACTS• Forestry-dependent and Indigenous communities will be the first to feel the impacts of any timber supply
disruptions or losses of other forest values as a result of changing climate conditions and increases in natural disturbances. Jobs in the forest sector would be created in activities that are required for successful regeneration of forests (e.g., fibre recovery, tree planting).
• In the long term this option would contribute to increasing or sustaining the future timber supply, with corresponding long-term economic benefits.
CONSIDERATIONS
Indigenous Perspectives• The AFN has proposes that Indigenous knowledge and stewardship practices be incorporated into existing
rehabilitation programs.• Input from the MNC also notes that northern communities rely on existing old growth forests for
maintenance of traditional livelihoods, manage forest fires on a regular basis, and have a direct interest in forest land management, in some cases through land use agreements or licenses

Working Group on Specific Mitigation Opportunities Final Report
190Working Group on Specific Mitigation Opportunities Final Report
191
Co-benefits:• The rehabilitation activities supported by this option could be designed to help increase the long-term
resilience of forests to a changing climate through choice of the tree species planted, and by reducing fire risk. Improved regeneration of forests after natural disturbance could contribute to improved habitat for wildlife, better watershed protection, and increased biodiversity.
• Using dead biomass from natural disturbance for bioenergy instead of burning it in the forest provides air quality benefits through reduced emissions of particulate matter and black carbon.
Linkages with other working group areas and other proposed policies: • Adaptation to climate change by Canada’s forest and forest sector would be assisted by this option. • Fibre recovery would create an additional source of biomass that could support options which encourage
bioenergy or greater use of wood.• Offset systems can be used to stimulate mitigation involving forests at the project level, and examples exist
in Canada, but it is not expected that substantial areas of new forest rehabilitation will be stimulated under offset systems given that the benefits mainly occur in the longer term.
Regional impacts including northern and remote communities: • Provinces/territories have jurisdiction over 90% of Canada’s forests. The greatest mitigation activity would
occur in regions with significant natural disturbances, such as the mountain pine beetle infestation in central British Columbia and regions with high occurrence of forest fires.
Implementation, feasibility, technological and enabling infrastructure issues:• The ranges for mitigation shown reflect uncertainties about factors such as incremental growth due to
rehabilitation activities, as well as the diverse range of baseline activities across the country. In some parts of the country dead biomass left after natural disturbance is burned to reduce fire risk and help forest regeneration. The mitigation estimates have not captured reductions in non-CO2 GHG emissions that would result from stopping open burning.
• Implementation would ramp up over several years and would need to begin as soon as possible as there is a substantial lag between initiation of rehabilitation activities and when mitigation benefits occur, reflecting the long timescales of forest growth in Canada.
• An assessment would be required of existing tree seed inventories and nursery infrastructure, and the cost of cone/seed collection. Sufficient, appropriate cone/seed and tree seedling stock would need to be developed. As well, effort might be needed to develop the supply of private sector contractors qualified to implement rehabilitation activities (i.e. fibre recovery, replanting).
• Consideration would need to be given to how best to make use of existing road networks as some naturally disturbed areas of interest may not be easily accessible. There might be a need to amend forest management plans and shift harvest plans to cover areas closer to naturally disturbed areas to reduce road building requirements.
F4. Change in Forest Management Practices
POLICY GOAL: Achieve 8-10 Mt CO2e of mitigation in 2030 through changes in forest management.
POLICY TOOL: Commitments to forest Mitigation Action Plans involving changes in forest management.
Policy Details• Jurisdictions would develop forest Mitigation Action Plans or regional forest management plans that
consider mitigation and identify changes to forest management practices to achieve mitigation. Nationally, the aim would be to achieve 8-10 Mt CO2e of mitigation in 2030. Plans would vary by jurisdiction and be incremental to existing practices. Plans could include support for research and opportunity identification to increase mitigation outcomes. Changes in practices might be selected based on consistency with the jurisdiction’s sustainable forest management goals, mitigation potential in 2030 and beyond, ability

Working Group on Specific Mitigation Opportunities Final Report
192
to quantify mitigation outcomes, cost efficiency, impacts on employment and growth of the forest sector, contribution to climate change adaptation, and inclusion of Indigenous stewardship practices.
• Implementation mechanisms and timing would be determined by jurisdictions consistent with their own sustainable forest management systems, objectives, policy development processes and policy directions. Mechanisms might include strategic regulatory changes or broadly-applicable approaches (e.g., a “Forest Fund”) that provide incentives to forest managers and private land owners to change management practices. Provinces and territories have jurisdiction over 90% of Canada’s forests.
It is expected that choices about changes in practices will take into account net GHG impacts including impacts in the forest as well as impacts related to the use of harvested wood and substitution of wood for more emissions-intensive products and fossil fuels. They would also take into account other sustainability objectives. Examples of changes in practices that might be considered include increased silvicultural intensity to improve growth, changes in harvesting practices to extract more biomass per hectare, reduced burning of harvest residues in the forest, increased extraction of harvest residues for wood products or bioenergy, and forest conservation. Mitigation impacts would continue to grow after 2030, reaching 16 to 18 Mt CO2e in 2050.
Options Est. reductions in 2030* Est. cost/tonne**
A. Regionally-appropriate changes to forest management aimed at achieving 8-10 Mt of national mitigation in 2030. In any region, multiple actions might be undertaken as a package to provide a mix of short- and long-term mitigation.
8 - 10 Mt $0-50
* Mitigation would be substantially higher in 2050, because trees will continue to grow and sequester more carbon.
** These costs are based on estimates of GHG reductions beyond 2030, and so reflect the fact that trees will continue to grow and provide climate benefits for longer time periods.
ECONOMIC AND CONSUMER IMPACTS• Changes to forest management practices could affect employment or harvesting and other costs,
or mean that that the wood made available for forest products has different characteristics.
CONSIDERATIONS
Indigenous Perspectives• Input from the AFN recommends that Indigenous knowledge inform and guide forest management
practices in order to consider forest ecology and fire ecology as components of a holistic approach.• Input from the AFN recommends that changes in forest management practices should help facilitate
Indigenous stewardship practices across landscapes.• Input from the MNC also notes that northern communities rely on existing old growth forests for
maintenance of traditional livelihoods, manage forest fires on a regular basis, and have a direct interest in forest land management, in some cases through land use agreements or licenses
Co-benefits/negative impacts: • Co-benefits or negative impacts will depend on specific changes in management practices. • For example, reducing burning of harvest slash in the forest would reduce black carbon emissions
but could increase wildfire risk, unless a portion is removed and used for bioenergy or products.

Working Group on Specific Mitigation Opportunities Final Report
192Working Group on Specific Mitigation Opportunities Final Report
193
Linkages with other working group areas and other proposed policies: • A separate option addresses increased rehabilitation of forests following natural disturbances, as a specific
forest management action. The impacts of that option are not included in the analysis here.• While this option focuses on increased sequestration and emission reductions in forests, changes in forest
management practices could affect the supply of sustainably harvested wood needed to support options involving increased domestic use of wood in construction or for bioenergy.
• Offset systems can be used to stimulate mitigation involving forests at the project level, and examples exist in Canada. Very substantial demand for forest management offsets would be needed to achieve the levels of mitigation targeted with this option, and it is unlikely that offset systems alone would be enough to stimulate the targeted levels of mitigation.
Regional impacts including northern and remote communities: • 75% of the managed forest is located in British Columbia, Ontario, Quebec and Alberta. Generally
speaking, the greatest mitigation activity would occur in regions with the largest forest sectors.
Implementation, feasibility, technological and enabling infrastructure issues: • Developing and implementing Mitigation Action Plans could take several years but some changes could
happen relatively quickly. The targeted national level of mitigation would need to be re-visited once plans are developed.
• In general, to date, there have been few changes in forest management specifically for GHG mitigation purposes in Canada. This reflects the complexity of forest management and the need for governments to balance mitigation objectives within the broader context of the diverse values and objectives of their sustainable forest management regimes. Care would be needed to ensure changes in practices do not jeopardize meeting forest certification requirements.
• Variations across Canada in the characteristics of forests, forest management and the jurisdictional policy context make it difficult to specify changes in practices that make sense everywhere. Thus, this option would flexibly accommodate differences in order to optimize mitigation. Changes to forest management would be consistent with jurisdictional sustainable forest management objectives and would depend upon their choices about preferred approaches for mitigation.
• All changes in forest management practices in Mitigation Action Plans would be over and above current policy and requirements. The intent is not to relieve holders of forest tenure agreements of any obligations they currently have, and any incentives provided would not be intended to support fulfillment of existing tenure agreement obligations.
• To maximize mitigation, implementation would need to begin soon because there can be a substantial lag between forest management activities and when mitigation benefits occur, reflecting the long timescales of forest growth in Canada.
• Future natural disturbances such as increased forest fires due to climate change could reduce the long-term mitigation. At the same time, changes in forest management practices could combine mitigation and climate change adaptation goals in an effort to reduce the impacts of natural disturbances and increase forest resilience to climate change.
• Improvements in forest monitoring and reporting would help in tracking the effects of mitigation actions, as well as support other objectives such as on-going assessment of how forests are being impacted by a changing climate.

Working Group on Specific Mitigation Opportunities Final Report
194
Waste
W1. Landfill Gas Capture and Utilization
POLICY GOAL: Increase municipal solid waste (MSW) landfill gas (LFG) capture and utilization
POLICY TOOLS: A. Mandatory requirements for MSW LFG capture and flaring or utilization (e.g. regulation); and/orB. Incentives to encourage MSW LFG utilization (e.g. feed-in-tariff for LFG-to-electricity); could be coupled
with policy tool A.
Policy Details
Option A:• Increased LFG capture would come from about 26 MSW landfills in provinces with no or less stringent
regulations, by installing new or expanding existing capture systems.• Focus on MSW landfills with greater than 1M tonnes of waste in place, and/or accepting greater than
40K tonnes of waste per year, and either active or closed less than 15 to 30 years (depending on size).• 80% of the LFG capture would come from large landfills with greater than 5M tonnes of waste in place,
and more than 75% would be from active landfills.• Estimated average cost for LFG capture is about $4/t CO2e.
Option B:• Increased capture and utilization would come from about 41 MSW landfills across Canada,
by installing new or expanding existing capture and utilization systems.• Emission and cost estimates based on a $0.12 per kWh feed-in tariff for electricity generation
(comparable to rates paid in ON and QC), which is the most common use for LFG. • Would generate about 1 million MWh of electricity (using about 52,000 cfm of LFG). • LFG must be processed / cleaned prior to electricity generation. • Producing renewable natural gas from LFG requires more processing, so the financial
incentives would likely need to be higher and yields may be lower.
Options Est. reductions in 2030 Est. cost/tonne
A. Mandate capture: 57% of all LFG is captured and flared or utilized by 2030 (up from 36% captured in 2013, and 50% currently projected for 2030).
2-3 Mt $0-50
B. Incentives for utilization: 57% of all LFG is captured and 33% is utilized by 2030 (up from 18% utilized in 2013).
2-3 Mt $0-50
Note: The estimated reductions are based largely on conservative estimates completed in 2011-12. Further assessment with more recent information is required to determine if higher levels of landfill gas capture and utilization are technically and economically feasible.
ECONOMIC AND CONSUMER IMPACTS• Increased employment for design, construction and operation, particularly with LFG utilization. • Source of renewable electricity and/or renewable natural gas.• Utilization allows for cost recovery, helping to reduce regulatory compliance costs associated with LFG
capture systems.

Working Group on Specific Mitigation Opportunities Final Report
194Working Group on Specific Mitigation Opportunities Final Report
195
CONSIDERATIONS
Co-benefits/negative impacts:• Reduced emissions of volatile organic compounds, odors, and other local air pollutants.• Potential air pollutant co-benefits from displacement of fossil fuel-fired electricity generation.• Increased utilization could generate about 1 million MWh of electricity (using about 52,000 cfm of LFG).
Regional impacts including northern and remote communities:• Existing regulations in BC, AB, MB, ON, QC and PEI; stringency & performance standards vary.• Further LFG capture opportunities exist at a total of 26 MSW landfills in AB, SK, MB, NB, NS and NL. • Further LFG utilization opportunities exist at 41 MSW landfills in BC, AB, SK, MB, ON, QC, NB and NL.• Renewable natural gas option may only be possible in regions of Canada where it is possible to connect
a natural gas pipeline.• Most northern and remote landfills would not be implicated; typically small, do not generate sufficient
quantities of LFG to justify the capital investments.
Implementation, feasibility, technological and enabling infrastructure issues:• Infrastructure investments required to connect LFG utilization systems to electricity grid
or natural gas distribution pipelines.• Existing and commercially available technologies.
W2. Reduce Avoidable Food Waste
POLICY GOAL: Reduce avoidable food waste in Canada by 50%
POLICY TOOL: National Strategy and Campaign to reduce Avoidable Food Waste
Policy Details• Strategy should include a diverse range of tools and actions, such as: best practices for producers, retailers
and consumers; measurement and reporting; packaging standards; market-based incentives; improving donation channels; food grading and labelling; consumer education; and, industry outreach and training.
• A mix of regulatory and non-regulatory tools has been successful in leading countries. • Examples of specific actions that have been implemented in leading countries include:
» Regulations to standardize date labelling (expiry, best before, etc.) to reduce consumer confusion (which accounts for 20% of consumer food waste).
» Government and industry could adopt consistent performance indicators, and measurement and reporting approaches to evaluate performance and facilitate meaningful comparisons of food waste reduction, recovery and diversion achievements.
» Best practices and training programs could be developed for food sectors to bolster food loss and waste prevention and recovery throughout the supply chain.
» Changes in consumer habits could be stimulated through awareness-raising, education and improved food labeling.
» Improvements to food donation channels, such as standardized donation regulations, donation liability education, and best practices for donation storage, handling and transport.
• Aligns with Canada’s international commitments (e.g. United Nation’s High-level Political Forum on Sustainable Development).
• Would complement national food policy being developed by Agriculture and Agri-Food Canada (estimated 2018).

Working Group on Specific Mitigation Opportunities Final Report
196
Options Est. reductions in 2030 Est. cost/tonne
Reduce avoidable food waste in Canada by 50% by 2030, focusing on the retail and consumer levels and reducing food losses along production and supply chains, including post-harvest losses.
10 -15 Mt (life-cycle)
<$0
Note: The IPCC fourth assessment report identifies waste prevention, re-use and recycling as key GHG mitigation actions and indicates that life cycle analysis is required to quantify GHG reductions. Further work would be required to estimate the distribution of reductions between the sectors included in the food production and supply chains. Note that a substantial portion of potential emissions reductions would occur outside of Canada.
ECONOMIC AND CONSUMER IMPACTS• Economic savings throughout all stages of the food supply chain. • In Canada, $31 billion/year are lost due to avoidable food waste, which mostly goes to landfill
or composting.• Estimates for US indicate that the net economic value of avoiding food waste is about $3,800/tonne
throughout the food supply chain, or about $1,100 of net economic value/t CO2e.• Residential consumers represent up to 47% of the economic losses associated with food waste in Canada.
Similar food waste reduction initiatives in leading countries have generated up to $240 in savings for consumers for every dollar invested.
• Reduces productivity losses and (potentially) food prices.
CONSIDERATIONS
Co-benefits/negative impacts:• Reduces quantity of organic waste requiring disposal (generating methane in landfills) or diversion.• Combats hunger and food insecurity.• Minimizes resource loss and consumption (e.g., water, pesticide, fertilizer, labour, fuel, deforestation,
biodiversity, overfishing, etc.).
Regional impacts including northern and remote communities:• National issue that impacts all Canadians.• Likely that largest impact will be in urban centers (population density).• Impacts will vary depending on options pursued.
Implementation, feasibility, technological and enabling infrastructure issues:• Collaboration will be required between a broad range of stakeholder organizations including governments
(federal, provincial, municipal), food producers and food industries, food retailers and service providers, food transporters, consumers, charities and other NGOs.
• Could involve many technologies, including: » Food waste measurement/inventory management/donation matching: inventory/waste tracking software. » Food packaging: innovative food packaging approaches. » Cold chain management: improved refrigerated transport and storage. » Manufacturing line optimization: improved manufacturing/processing technologies. » Specialized food packaging to optimize food life.

Working Group on Specific Mitigation Opportunities Final Report
196Working Group on Specific Mitigation Opportunities Final Report
197
W3. Diversion of Organics
POLICY GOAL: Increase diversion of organics from disposal
POLICY TOOLS: • Ban organics (i.e. food waste, leaf and yard waste, etc.) from disposal, and mandate collection
of those materials from all sources (residential and non-residential) for processing. • Bans should be supported by education campaigns, guidance and enforcement.• Additional tools that can support organics diversion include:
» Incentives to produce biogas from organics using anaerobic digestion (e.g. feed-in-tariff). » Grants and loans for organics treatment facilities (composting, anaerobic digesters, etc.).
Policy Details• Requires modifications and increases to organics collection, hauling and processing infrastructure,
with largest opportunity likely in institutional, commercial and industrial sectors.• To ensure compliance, regular and random inspections would be needed to enforce the ban, as well
as fines and/or other sanctions for violations. • Education programs required to shift public attitudes and encourage organics diversion.• For level of ambition A, focus would likely be on large urban centers.• To achieve the more ambitious diversion target (level B), increased incentives, education and enforcement
would be required, and the focus could be expanded to include smaller population centers (including rural and remote).
Options Est. reductions in 2030 Est. cost/tonne
A. Increase organics diversion rate in Canada from 6.7% of total waste generated (or 65 kg/capita) in reference year 2010 to >20% (or >195 kg/capita) by 2030, in line with best performer in Canada (NS).
1 -3 Mt (life cycle)
$0-50
B. Increase organics diversion rate in Canada from 6.7% of total waste generated (or 65 kg/capita) in reference year 2010 to >25% (or >240 kg/capita) by 2030, in line with best performers in EU.
1- 4 Mt (life cycle)
$0-50
Notes: The IPCC fourth assessment report identifies waste prevention, re-use and recycling as key GHG mitigation actions and indicates that life cycle analysis is required to quantify GHG reductions. Further work would be required to estimate the distribution of reductions between sectors implicated in organics diversion.
For each level of ambition, the lower end of the range of emission estimates is based on emission factor published by OECD96 and the upper end of the range is based on estimates using emission factors from ECCC’s GHG Calculator for Waste Management97 and US EPA’s Waste Reduction Model (WARM)98.
ECONOMIC AND CONSUMER IMPACTS• Achieving ambition level B would result in an additional 6.1 Mt of recyclable materials diverted • ON study from 2009 indicates 7 jobs are created for every 1,000 tonnes of waste diverted with an
economic benefit to society four times greater than the net cost of taking action 99 – on this basis, achieving ambition level B could produce up to 43,000 new jobs.
96 OECD, 2012. Greenhouse Gas Emissions and Potential for Mitigation from Materials Management within OECD Countries. www.oecd.org/env/waste/50035102.pdf.
97 www.ec.gc.ca/gdd-mw/default.asp?lang=En&n=D6A8B05A-1
98 www.epa.gov/warm
99 AECOM, 2009. The Economic Benefits of Recycling in Ontario. https://archive.org/details/theeconomicbenef00snsn21841

Working Group on Specific Mitigation Opportunities Final Report
198
CONSIDERATIONS
Co-benefits/negative impacts:• Waste diversion contributes to resource efficiency and moves Canada toward a circular economy.• Organic material is highest proportion of waste landfilled and contributes most to landfill methane emissions.• Anaerobic digestion produces renewable natural gas.• Composting and anaerobic digestion produce a valuable soil amendment that: decreases soil erosion by
enhancing soil structure; returns a diverse number of nutrients to soil; reduces watering needs by improving water retention in the soil; suppresses plant disease.
• Reduced landfill usage improves quality of life in adjacent communities.• Fewer landfill sites needed, saving the cost of creating new landfills or transporting waste to more
distant landfills.
Regional impacts including northern and remote communities:• In regions where transporting waste to USA for disposal is cost effective, an organics disposal ban may
cause increased exports (i.e. if organics diversion is more costly). • For northern and remote communities, there is a case to be made for composting paper along with organics,
as the paper provides a needed source of carbon for the composting process and the costs for shipping paper out of the community are avoided.
Implementation, feasibility, technological and enabling infrastructure issues:• Existing and commercially available technologies.• Infrastructure investments for municipalities and non-residential sectors to collect and process organics.
W4. Diversion of Recyclable Materials
POLICY GOAL: Increase diversion of recyclable materials from disposal
POLICY TOOLS: • Ban recyclable materials from disposal and mandate collection from all sources (residential and non-
residential) for recycling. • Bans should be supported by education campaigns, guidance and enforcement.• Additional tools that can support diversion of recyclable materials include grants and loans for recycling
programs and facilities.
Policy Details• Requires modifications and increases to recyclable material collection, hauling and processing
infrastructure, including new facilities.• To ensure compliance, regular and random inspections would be needed to enforce the ban, as well
as fines and/or other sanctions for violations. • Education programs to shift public attitudes and encourage diversion of recyclable materials.• For level of ambition A, focus would likely be on larger urban centers.• To achieve the more ambitious diversion target (level B), increased incentives, education and enforcement
would be required, and the focus could be expanded to include smaller population centers (including rural and remote).

Working Group on Specific Mitigation Opportunities Final Report
198Working Group on Specific Mitigation Opportunities Final Report
199
Options Est. reductions in 2030 Est. cost/tonne
A. Increase diversion rate for all paper types from 9.8% of total waste generated (or 98 kg/capita) in reference year 2010 to 13% (or 130 kg/capita) by 2030, in line with best performers in Canada (QC and BC).
2-4 Mt (life cycle)
$0-50
B. Increase diversion rate for all recyclable materials from 15.7% of total waste generated (or 152 kg/capita) in reference year 2010 to 20% (or 195 kg/capita) by 2030, in line with best performers in Canada (QC and BC).
3-4 Mt (life cycle)
$0-50
C. Increase diversion rate for all recyclable materials from 15.7% of total waste generated (or 152 kg/capita) in reference year 2010 to 35% (or 335 kg/capita) by 2030, in line with best performers in EU.
14-16 Mt (life cycle)
$0-50
Notes: The IPCC fourth assessment report identifies waste prevention, re-use and recycling as key GHG mitigation actions and indicates that life cycle analysis is required to quantify GHG reductions. Further work would be required to estimate the distribution of reductions between sectors implicated in recycling.
For each level of ambition, the lower end of the range of emission estimates is based on emission factor published by OECD100 and the upper end of the range is based on estimates using emission factors from ECCC’s GHG Calculator for Waste Management101 and US EPA’s Waste Reduction Model (WARM)102.
ECONOMIC AND CONSUMER IMPACTS• Achieving ambition level C would result in an additional 6.3 Mt of recyclable materials diverted • ON study from 2009 indicates 7 jobs are created for every 1,000 tonnes of waste diverted with an
economic benefit to society four times greater than the net cost of taking action 103 – on this basis, achieving ambition level C could produce up to 44,000 new jobs.
CONSIDERATIONS
Indigenous Perspectives• Input from the AFN recommends developing off-grid recycling and product stewardship solutions,
which could help reduce burning or accumulation of trash.
Co-benefits/negative impacts:• Waste diversion contributes to resource efficiency and moves Canada toward a circular economy.• Reduces the amount of waste sent to landfills and incinerators.• Conserves natural resources such as timber, water, and minerals.• Saves energy and prevents pollution by reducing the need to collect and process new raw materials.• Fewer landfill sites needed; saves the cost of creating new landfills or transporting waste to more
distant landfills.
100 OECD, 2012. Greenhouse Gas Emissions and Potential for Mitigation from Materials Management within OECD Countries. www.oecd.org/env/waste/50035102.pdf.
101 ECCC. www.ec.gc.ca/gdd-mw/default.asp?lang=En&n=D6A8B05A-1
102 US EPA. www.epa.gov/warm
103 AECOM, 2009. The Economic Benefits of Recycling in Ontario. https://archive.org/details/theeconomicbenef00snsn21841

Working Group on Specific Mitigation Opportunities Final Report
200
Regional impacts including northern and remote communities:• In regions where transporting waste to USA for disposal is cost effective, a recyclable materials disposal
ban may cause increased exports (i.e. if recycling is more costly). • For northern and remote communities, costs will be higher due to distances covered and methods used
to transport recyclable materials to processors and end-markets. There is a case to be made for processing paper along with organic waste in the community (e.g. via composting), as the paper provides a needed source of carbon for the composting process and the costs for shipping paper out of the community are avoided.
Implementation, feasibility, technological and enabling infrastructure issues:• Existing and commercially available technologies.• Infrastructure investments for municipalities and non-residential sectors to collect and process recyclable
materials. • Disposal bans in some jurisdictions have led to increased illegal dumping and associated increases in cost
and environments risks. Therefore bans should only be enacted following the establishment of recycling programs (e.g. Extended Producer Responsibility, material / product stewardship programs, etc.) for the banned material.
• Cost implications vary by jurisdiction.
Government Operations and Leadership
G1. Carbon neutral government
POLICY GOAL: Canadian governments can lead by example through a commitment to a carbon neutral public sector. This can be achieved by taking full responsibility for the emissions their operations release to the atmosphere and realizing net-zero greenhouse gas (GHG) emissions from federal, provincial, territorial and even local government public sector operations, including ministries and broader public sector organizations.
POLICY TOOL: Establish Carbon Neutral Government policy through legislation/regulation enacted either federally or by each government, augmented by additional incentives such as funding for investments in emissions reduction projects within the public sector. Legislation could include targets for emission reduction.
Policy Details• The policy framework consists of five program pillars:
» Measure - quantify the greenhouse gas emissions from Canadian public sector operations. » Reduce - plan and take action to reduce emissions as much as possible annually. » Offset - invest in emission reduction projects to offset the remaining emissions. » Report - demonstrate leadership through public reporting on achievements. » Verify - assure the integrity of public sector reporting and offset investments.
• Standards and GHG quantification protocols should be aligned with internationally-recognized standards (e.g., General Reporting Protocol, GHG Protocol)
• Centralized governance, program administration and offsets procurement functions would support efficiency and lower administrative costs
• Carbon neutral government could be administered on a national level, or within each provincial, territorial and local government jurisdiction, or a combination thereof
• A public-facing offsets registry supports accountability, credibility and transparency

Working Group on Specific Mitigation Opportunities Final Report
200Working Group on Specific Mitigation Opportunities Final Report
201
• Implementation of CNG could follow a phased approach: » Phase 1: Governments begin to measure, reduce and report their emissions. Begin offset project
origination and building an offsets portfolio. (2-4 years) » Phase 2: Governments begin offsetting any emissions not reduced.
• Phase 2 would begin once there has been sufficient time to establish and refine measurement and reporting and to identify and develop a sufficient portfolio pool of offsets.
Level of Ambition A “Low Carbon” government: 25-40% reduction in emissions from government operations
Level of Ambition B Carbon neutral with targeted GHG reductions: 25-40% reduction in emissions from government operations, with offsets at a cost of $15-$25 per tonne
Level of Ambition C Carbon Neutral with best efforts reductions: 0-25% reduction in emissions from government operations, with offsets at a cost of $15-$25 per tonne
Options Est. reductions in 2030* Est. cost/tonne
A. “Low carbon” government with targeted GHG reductions: Government organizations reduce operational GHGs by a targeted amount by 2030 relative to a baseline year:
1-2 Mt $0-50
B. Carbon neutral with targeted GHG reductions: Government organizations achieve carbon neutrality by reducing operational GHGs by a targeted amount by 2030 relative to a baseline year. The remaining emissions are offset.
4-5 Mt $-0-50
C. Carbon neutral with best efforts reductions: Government organizations achieve carbon neutrality by taking reasonable action to reduce operational GHGs, but with a greater reliance on annually offsetting remaining emissions
4-5 Mt $0-50
* Note: estimated emissions reductions are based on core operations of federal, provincial, and territorial governments. Greater reductions could potentially be achieved if a carbon neutral government policy was scoped more broadly to include other public sector operations
ECONOMIC AND CONSUMER IMPACTS
From public sector emission reduction activities:• The Canadian public sector will increase capacity, support proof-of-concept projects, spur the development
and adaption of clean technology and turn energy savings into cost savings that can be reinvested in public services such as health care and education.
• Economic benefits include stimulation of the clean technology sector and more effective use of public funds. • Reduced operational costs through energy savings.

Working Group on Specific Mitigation Opportunities Final Report
202
From offsets:• Offsets investments span all regions and sectors including agriculture, industrial, forestry, oil & gas,
waste management and transportation.• Through offset purchases, governments can leverage these dollars to generate even greater private sector
investments in clean technologies and jobs. • Direct, indirect and induced economic benefits from investment in offset projects include contribution
to GDP; federal, provincial, territorial and municipal tax revenue generation; and job creation.
CONSIDERATIONS
Indigenous perspectives:• Offset purchases by public sector could facilitate low-carbon projects in remote or First Nations
communities and enhance regional economic development. • Input from the MNC suggests that set-asides for Métis communities be developed under the Low-Carbon
Economy Fund, which could include funding for greening of Metis government and institutional operations. • The MNC also recommends creating Métis-specific contract capacity set asides for Metis businesses in
government procurement strategies, including those businesses that have a clean technology focus
Co-benefits/negative impacts:• Reductions in energy consumption within government can have associated environmental benefits such
as improved air quality. • Carbon offset projects can have associated environmental benefits (e.g., habitat conservation).
Linkages with other working group areas and other proposed policies: • May supplement/complement other carbon price instruments; emission reductions can be augmented by
incremental funding or energy budget models, such as revolving energy funds, which allow public sector organizations to use operational energy savings to fund capital investments in emission reduction.
Regional impacts including northern and remote communities:• Offset purchases by public sector could facilitate low-carbon projects in remote or First Nations
communities and enhance regional economic development.
Implementation, feasibility, technological and enabling infrastructure issues:
Implementation considerations:• Full implementation unlikely before 2022: min. 3 years needed to establish and improve accuracy
of energy and emissions reporting.• Energy & emission measurement and reporting may be burden for some governments. • Significant emission reduction will require staff and financial resources.• Will likely be important to ensure that offset projects and their benefits occur in the provinces that
purchase them, but there may not be sufficient low cost offset opportunities in some provinces• The scope of CNG coverage across jurisdictions should be similar, and at least meet the minimum
requirements of international protocols.
Required infrastructure:• Protocols/methodology for energy and emission measurement• Mechanisms for energy and emissions reporting• Mechanism(s) to track and record offsets, such as a registry platform.• Third-party verification expertise • Staff who are able to assist participating agencies with program requirements and facilitate emission
reduction initiatives• Centralized agency for purchasing offsets on behalf of participating agencies.

Working Group on Specific Mitigation Opportunities Final Report
202Working Group on Specific Mitigation Opportunities Final Report
203
Internationally Transferred Mitigation Outcomes
POLICY GOAL: Ensure that Canada can meet its target and lower the overall cost of doing so through the use of Internationally Transferred Mitigation Outcomes (ITMOs).
POLICY TOOL: ITMOs could be produced through numerous avenues, including the use of the new centralized UNFCCC mechanism, investments in multilateral initiatives and funds, use of allowances from capped emissions trading systems, investments in emissions reductions from technology transfers, or credits from reducing emissions from deforestation and forest degradation in developing countries (REDD) or REDD+ (includes additional forest-related activities such as forest management).
Policy Details• ITMOs can be acquired by national governments, sub-national governments, and the private sector, but
their use towards participating Parties’ NDCs, including whether and how they are shared, will need to be negotiated and agreed.
Approach Description
Investment in multilateral initiatives through the World Bank, Multilateral Development Banks, or other multilateral funds
For example, the Transformative Carbon Asset Facility from the World Bank will help developing countries create and monetize the next generation of carbon credits, including those achieved through policy actions. The $500 million initiative will measure and pay for emission cuts in large scale programs in areas like renewable energy, transport, energy efficiency, solid waste management, and low carbon cities. Providing a contribution to the World Bank’s results-based forest funds would help ensure that REDD+ carbon credits are available to Canada post-2020, secured at an estimated value of $CAD 6/tonne.
Emissions trading systems either at the national or sub-national level
For example, Quebec and California are participating in a linked cap-and-trade system under the Western Climate Initiative (WCI), and Ontario will soon join the WCI carbon market. Under this linked system, allowances representing reductions in other jurisdictions are being used by participating sub-national jurisdictions for compliance. If agreed by Canada and the United States, the net flow of allowances could be applied against each country’s NDC. WCI partners are also looking for other potential partners in North America, and eventually, in other continents to broaden the market.
Bilateral investment in reductions outside of Canada
ITMOs can be produced by bilateral activities such as investment in projects in other countries or transfer of goods or technology. An example of the latter is Japan’s Joint Crediting Mechanism (JCM) which provides financial and technological support to help developing countries achieve low-carbon growth. Carbon credits issued from emissions reductions resulting from the implementation of projects are used to meet Japan’s national emission reduction targets. Other bilateral emissions-reduction projects could be undertaken in developed or developing countries, either directly or through established (centralized) mechanisms.
Use of centralized UNFCCC mechanism
Article 6 of the Paris Agreement establishes a new centralized mechanism to contribute to mitigation and promote sustainable development, which will be supervised by a body under the UNFCCC. Rules and modalities for the mechanism have not yet been developed. The mechanism will include project-based activities, but may also encompass sectoral approaches. It could also be used to “approve” ITMOs created outside of the UNFCCC, using UNFCCC rules that will be developed.

Working Group on Specific Mitigation Opportunities Final Report
204
ECONOMIC AND CONSUMER IMPACTS• Many ITMOs are expected to be lower-cost relative to available reductions in Canada, indicative of the
fact that many of the low-cost mitigation opportunities have not yet been exhausted in other countries (e.g., fuel switching). Acquiring ITMOs could lower the overall cost of meeting Canada’s 2030 target.
• The current cost of mitigation outcomes transferred internationally ranges from around CAD$ 6 to above CAD$ 16 per tonne104. However, the future supply of ITMOs is uncertain and there could be competition for the available supply.
Co-benefits/negative impacts • To the extent that ITMO purchases support development in less developed countries, ITMO purchases
could contribute to Canada’s international development goals and Canada’s support for the achievement of the United Nations Sustainable Development goals.105
• Could support exports of Canadian technology or cleaner energy whose end-use results in emissions being lower than they otherwise would have been in another country. However, this would require agreement with the other country that Canada could use any ITMOs created, which could be difficult to secure without additional investment or provision of assistance to that country. Otherwise, it would not help Canada meet its NDC.
• Agreeing to account for the flow of ITMOs that occur under the WCI or any other two-way trading system could result in making Canada’s NDC more difficult to achieve if the overall flow of ITMOs is out of Canada. In addition, allowing the international aviation sector to access Canadian sourced ITMOs, while providing income to project proponents and a source of units for Canadian airlines operating internationally, could also make Canada’s NDC harder to achieve.
Implementation, feasibility, technological and enabling infrastructure issues• In order to meet the transparency requirements of the Paris Agreement, it could be useful to create
infrastructure such as a registry, to track and report on transfers to and from the federal government. Such a system could also potentially support Canada’s implementation of the market-based measure under development under International ICAO.
• The transparency framework under the Paris Agreement calls for Parties to report on how they have assessed environmental integrity. One way to ensure Canada can demonstrate environmental integrity would be to ensure that measuring, reporting and verification standards are consistent with international best practices. Ensuring reductions are real, additional, permanent, properly owned, monitored quantified, and reported, and verified would also facilitate the demonstration of environmental integrity.
• Accounting guidance developed under the UNFCCC is expected to address three key areas: avoidance of double-counting; single-year targets; and carry-over of previous units (e.g. under the Kyoto such as Clean Development mechanism or Joint Implementation units).
• Discussion has already begun with Quebec and California as well as the U.S. to determine how the WCI’s net flows of ITMOs could be accounted for towards the NDC.
• The creation of a Canadian fund to purchase and invest in ITMOs (i.e., outside those that already exist under the WCI cap-and-trade system) may require new legislation.
• Investments in ITMOs (excluding those stemming from the WCI system) may need to begin well before 2030 in order to mitigate the risks of limited supply or rising costs.
• The federal government, in collaboration with provinces and territories, will continue to assess options for acquiring ITMOs under different mitigation and carbon pricing scenarios and as specific cost and emissions reduction potential estimates become available and/or more refined.
104 The lower end of the range is based on the value of REDD credit on the international market and the upper range on the current cost of allowances under Quebec’s cap-and-trade system.
105 https://sustainabledevelopment.un.org/?menu=1300

Working Group on Specific Mitigation Opportunities Final Report
204Working Group on Specific Mitigation Opportunities Final Report
205
ANNEX 3: KEY METHODOLOGICAL CHOICES The MWG and technical subgroups developed a very broad set of policy options in a short time period, and therefore relied on existing, available analysis and expertise. Although the combined expertise of federal, provincial, and territorial experts has facilitated the development of a comprehensive report, some methodological choices have been made and their analytical implications are worth keeping in mind. Many of these are challenges that apply to climate policy analysis more generally.
NATIONAL, JURISDICTIONALLY-NEUTRAL APPROACHPolicy options are presented from a national perspective, and are designed so that in many cases they could be implemented by various orders of government across Canadian jurisdictions. This means that not all policy options are relevant to every jurisdiction, and most options would need to be adjusted before being implemented by a specific jurisdiction. Costs are also presented at the national level, and could vary substantially by jurisdiction due to difference in areas like energy costs, infrastructure, and industrial base. Similarly, emissions reductions from a given policy would not be spread evenly across the country.
DIFFERENT LEVELS OF DETAILSome policies are very specific and include design details such as incentive levels and eligibility criteria for assistance programs. Other policy options are higher level and describe the overall goal and type of policy tools available without specifying design details. This is often a function of the type of policy. Policies that address more complex emissions reduction opportunities with a variety of tools are less detailed than policies aimed at specific opportunities. For example, urban planning policies (B8) are broadly described, while building code policies (B1 and B3) are more specific.
EMISSIONS REDUCTIONS MODELLING APPROACH 1. Baseline emissions projections: The baseline used for calculating emissions reductions for each policy is the most recent federal emissions projection, published in Canada’s Second Biennial Report on Climate Change (February 2016). It includes federal, provincial, and territorial measures in place as of September 2015. A number of recent announcements are not reflected in this baseline, including: proposed federal regulations for HFCs, heavy-duty vehicles, and to reduce methane emissions from the oil and gas sector; Ontario’s (ON) cap-and-trade system and Climate Change Action Plan; AB’s Climate Leadership Plan; SK’s renewable energy target; NL’s Management of Greenhouse Gases Act; BC’s Climate Leadership Plan, as well as the federal government’s endorsement of the World Bank’s Zero Routine Flaring by 2050 initiative. Since these new policies will represent emission reductions beyond the baseline, this report presents them as policy options in cases where they are discrete sectoral policies. Where such policies are already under development, this is noted to clarify they are being included primarily for accounting purposes.
2. Interactive effects: This report presents estimated reductions from each individual policy option, not accounting for potential interactive effects between them. As such, estimates of individual measures cannot be added together to obtain total reductions. Policies were not modelled together because this would require decisions about how policies should be packaged together, which was outside of the working group’s mandate to provide options rather than recommendations, and due to time constraints.
3. The E3MC Model. Greenhouse gas (GHG) reductions in 2030 were estimated wherever possible using modeling from Environment and Climate Change Canada (ECCC) using its Energy, Emissions and Economy Model for Canada (E3MC). Where it was not possible to model the impacts of a given policy (e.g., in the case of several industrial sector policies), subgroups estimated reductions using the best available information from existing studies and policies in other jurisdictions.

Working Group on Specific Mitigation Opportunities Final Report
206
E3MC has two components: Energy 2020, which incorporates Canada’s energy supply and demand structure, and the in-house macroeconomic model of the Canadian economy.
Energy 2020 is an integrated, multi-region, multi-sector North American model that simulates the supply of, price of, and demand for all fuels. The model can determine energy output and prices for each sector, both in regulated and unregulated markets. It simulates how such factors as energy prices and government measures affect the choices that consumers and businesses make when they buy and use energy. The model’s outputs include changes in energy use, energy prices, GHG emissions, investment costs and possible cost savings from measures, in order to identify the direct effects stemming from each GHG reduction measure considered.
The in-house macroeconomic model is used to examine consumption, investment, production and trade decisions in the whole economy. It captures the interaction among industries, as well as the implications for changes in producer prices, relative final prices and income. It also factors in government fiscal balances, monetary flows, and interest and exchange rates. More specifically, the macroeconomic model incorporates 133 industries at a provincial and territorial level. It also has an international component to account for exports and imports, covering about 100 commodities.
While the macroeconomic model can project the direct impacts on the economy’s final demand, output, employment, price formation and sectoral income that result from various policy choices to estimate the effect of climate change policy s on the national economy; this analysis was not conducted for this report due to time constraints.

Working Group on Specific Mitigation Opportunities Final Report
206Working Group on Specific Mitigation Opportunities Final Report
207