Specific behaviour problems in children with FASD in ...
20
Specific behaviour problems in children with FASD in remote Australian Aboriginal communities Results from the Lililwan Project Paediatrics & Child Health University of Sydney Medical School Elizabeth Elliott Dr. Tracey W Tsang and the Lililwan Project Team
Transcript of Specific behaviour problems in children with FASD in ...

Specific behaviour problems in children with FASD in remote Australian Aboriginal communitiesResults from the Lililwan Project
Paediatrics & Child HealthUniversity of Sydney Medical School
Elizabeth ElliottDr. Tracey W Tsang
and the Lililwan Project Team

Study authors:› Tracey Tsang, Heather Carmichael-Olson, Marmingee HandLililwan Chief Investigators:› Elizabeth Elliott, June Oscar, Maureen Carter, James
Fitzpatrick, Jane Latimer. Funders:› NHMRC; Australian Government Dept. Families, Housing,
Community Services & Indigenous Affairs; Dept. Health & Ageing; University Sydney
2
Email: [email protected]

Meta-analysis No FASD vs FASD (n=16)T-scores: Total, Internalizing, Externalizing problems
Total
Internalizing
Externalizing
12.10
6.32
12.46
Tsang, Carmichael-Olsen, Elliott et al. Pediatrics, 2016

Background & Purpose
› FASD associated with problematic behaviours- Behaviour challenges in Aboriginal children with FASD ?- Aboriginality and remote living associated with:
- Early life trauma; disadvantage› Secondary outcomes of FASD:
- Poor academic achievement; Unemployment; trouble with the law; poor QOL and health
› What do we need to know?:- Behaviour challenges at home and in school- Differences between FASD vs. No FASD
4
Behaviour in FASD

The Lililwan Project. Fitzroy Valley, WA, 2009-13Elliott E, Latimer J, Oscar J, Fitzpatrick J, Carter M
• First population-based study of FASD prevalence
• Fitzroy Valley• 4,500 mainly Aboriginal• 45 discrete communities• 5 language groups• Community consultation
5
Lililwan is a Kimberley Kriol word meaning ‘all the little ones’

Background
› Community-initiated, population-based study
› Objectives:1. FASD prevalence (2002-3)2. Relationships between
prenatal alcohol exposure & neurodevelopmental and behavioural outcomes
3. Assessment, diagnosis, health, education management plans
6
Lililwan Project

The Lililwan Project
7
Stage 1Identify all children born
2002 or 2003 living in Fitzroy Valley;
Interview parents/carers
April-Aug 2010127 of 134 eligible
(95% participation rate)
Stage 2Interdisciplinary
assessment; Achenbach: CBCL, TRF; Development of individual
management plans
Nov 2010Trial of clinical
assessments (N=6)
May-Nov 2011Interdisciplinary
assessment of cohort

Interdisciplinary assessment
Robyn Doney
Barb Lucas
James Fitzpatrick
Heather Carmichael-Olsen
Clare Salter
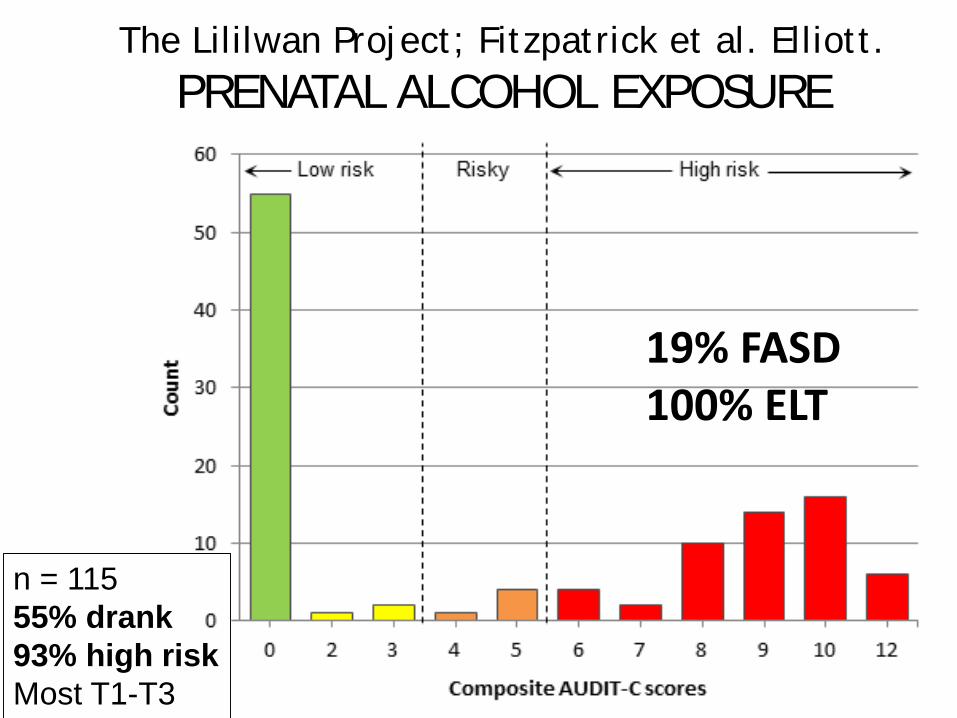
The Lililwan Project; Fitzpatrick et al. Elliott. PRENATAL ALCOHOL EXPOSURE
n = 11555% drank93% high riskMost T1-T3
19% FASD100% ELT

Achenbach: CBCL simplified structure
10
• - - - - -• - - - - -• - - - - -• - - - - -• - - - - -
• - - - - -• - - - - -• - - - - -• - - - - -
• - - - - -• - - - - -• - - - - -
• - - - - -• - - - - -
Individual Qs(“items”)
Scale score A
Scale score D
Scale score C
Scale score B
Scale scores
Broad summary score 1
Broad summary score 2
Broad summary scores
…(113 items: 12 Critical)
…(24 CBCL scales)
…(4 CBCL scores)
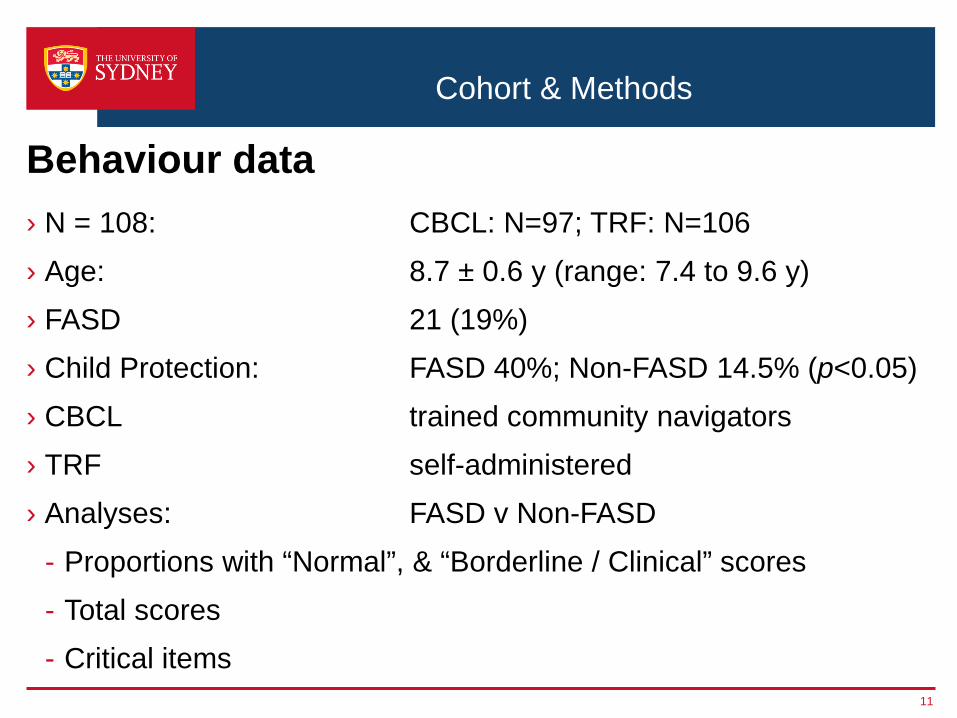
Cohort & Methods
› N = 108: CBCL: N=97; TRF: N=106› Age: 8.7 ± 0.6 y (range: 7.4 to 9.6 y)› FASD 21 (19%)› Child Protection: FASD 40%; Non-FASD 14.5% (p<0.05)› CBCL trained community navigators› TRF self-administered› Analyses: FASD v Non-FASD
- Proportions with “Normal”, & “Borderline / Clinical” scores- Total scores- Critical items
11
Behaviour data

Results: Total Cohort
12
“Borderline / Clinical” behaviours (%)
39.2% 38.2%
34%
29.9%
24% 23.7%21.6%
0
5
10
15
20
25
30
35
40
Conductproblems
Totalcompetence
Externalizingproblems
Internalizingproblems
Activitiescompetence
Totalproblems
Withdrawn/Depressed
CBCL (parent-rated)
Dark blue – compositeLight blue – sub-scales

Results: Total Cohort
13
“Borderline / Clinical” range behaviours (%)
73.3%
48.1%
36.8%
29.3%22.6% 21.7% 20.8%
0
10
20
30
40
50
60
70
80
Academicperformance
Adaptivefunction
Externalizingproblems
Totalproblems
Internalizingproblems
Aggressivebehavior
Rule-breakingbehavior
TRF (teacher-rated)
Dark green – compositeLight green - subscales

Results: Total Cohort
24%
34%
30%29%
37%
23%
0
5
10
15
20
25
30
35
40
Total problems Externalizing problems Internalizing problems
CBCLTRF
14
Composite Scores: “Borderline / Clinical” (%); Parent & Teacher)

› Prior to correction, FASD > no-FASD:- “Borderline / Clinical” range: Attention problems- Total scores:
• Social problems, Attention problems• DSM-oriented scale: ADHD
› After statistical adjustment for multiple comparisons:- No significant differences between FASD v Non-FASD:
• “Borderline / Clinical” scores• Total scores• Critical items
CBCL Results: FASD vs Non-FASD
15
Parent ratings

TRF Results: FASD vs Non-FASDTeacher ratings: “Borderline / Clinical” range scores
Behaviour scale FASD (%) (n=21)
Non-FASD (%) (n=85)
Academic performance 100 67Affective problems 38 11Attention problems subscale: Inattention 33 7Attention problems 33 5Attention deficit hyperactivity (ADH) problems 33 5
Sluggish cognitive tempo 29 5ADH subscale: Inattentive 24 6ADH subscale: Hyperactivity-impulsivity 24 16
Significant differences after adjustment for multiple comparisons

FASD vs Non-FASD TRF T-score (SD); Raw (IQR) Behaviour scale FASD Non-FASDADH problems subscale: Inattention 4 (3 – 9) 2 (0 – 4)Attention problems 60.9 (8.8) 54.1 (5.6)Attention problems subscale: Inattention 9 (6 – 20) 3 (1 – 9)Attention problems subscale: Hyperactivity-impulsivity
8 (3 – 13) 4 (0 – 7)
ADH problems 61.3 (9.7) 54.7 (5.9)ADH problems subscale: Hyperactivity-impulsivity
7 (2 – 10) 3 (0 – 5)
Thought problems 56.8 (5.6) 52.2 (3.9)Academic performance 35.2 (0.4) 41.6 (9.4)Social problems 60.4 (8.7) 53.8 (5.5)Post-traumatic stress 59.2 (8.9) 53.9 (5.4)Sluggish cognitive tempo 59.5 (9.0) 53.9 (5.4)Withdrawn / depressed 59.4 (8.1) 54.4 (6.3) 17
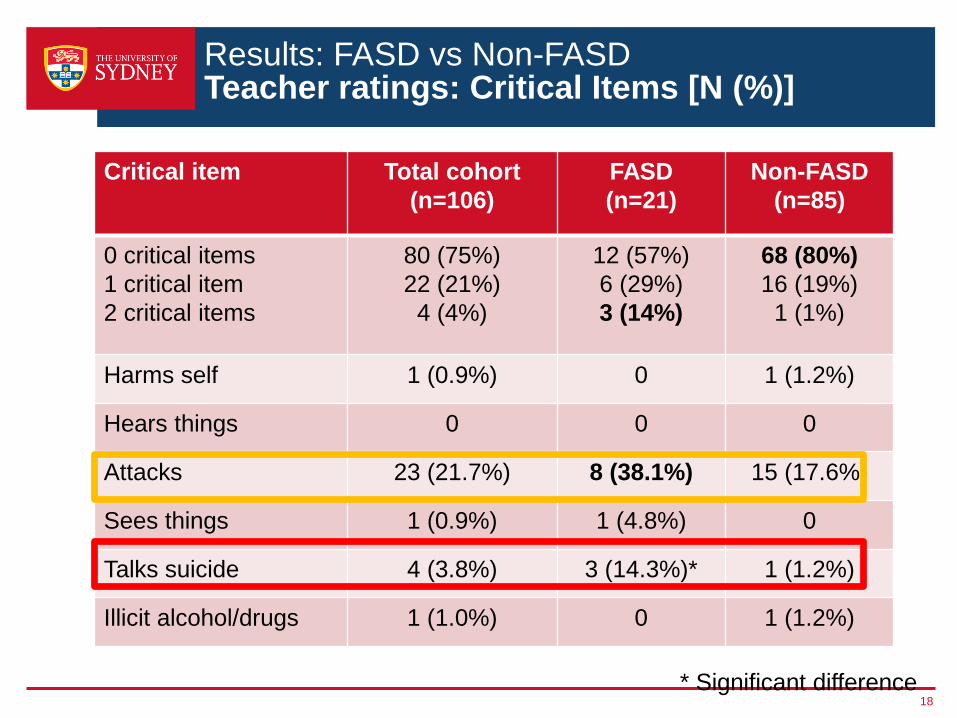
Results: FASD vs Non-FASDTeacher ratings: Critical Items [N (%)]
Critical item Total cohort (n=106)
FASD (n=21)
Non-FASD (n=85)
0 critical items1 critical item2 critical items
80 (75%)22 (21%)4 (4%)
12 (57%)6 (29%)3 (14%)
68 (80%)16 (19%)1 (1%)
Harms self 1 (0.9%) 0 1 (1.2%)
Hears things 0 0 0
Attacks 23 (21.7%) 8 (38.1%) 15 (17.6%)
Sees things 1 (0.9%) 1 (4.8%) 0
Talks suicide 4 (3.8%) 3 (14.3%)* 1 (1.2%)
Illicit alcohol/drugs 1 (1.0%) 0 1 (1.2%)
18* Significant difference

Summary› First investigation of behaviour in FASD in remote Aboriginals› First study to examine all scales & Critical items, CBCL & TRF› Prevalent problems (Total cohort):
- Academic performance, Attacking others; Internalizing problems, Externalizing problems, Total problems; Aggressive behaviour; Conduct problems.
› Children with FASD show:- Poorer academic performance; more attention problems,
sluggish cognitive tempo, adaptive function problems, affective problems, social problems, talking of suicide.
› Parent vs teacher ratings:- Consistent for total cohort for composite problem scores
(Total, Internalizing, Externalizing problems)- Inconsistent in comparisons of FASD v Non-FASD
19

For all the Family
Positive Parenting ProgramTriple P International
20 accredited Parent Coaches, 14 Aboriginal, 10 organisations