Specifi cation 1.1 Introduction to statistics 1 1.8...
7
GCSE 2010 SP a (part) Understand and use statistical problem-solving process… SP d (part) … distinguishing between different types of data SP e Extract data from printed tables and lists GM o (part) Interpret scales on a range of measuring instruments and recognise the inaccuracy of measurements GM p Convert measurements from one unit to another GM q Make sensible estimates of a range of measures FS Process skills Recognise that a situation has aspects that can be represented using mathematics Select the mathematical information to use Find results and solutions FS Performance Level 2 Identify the situation or problems and identify the mathematical methods needed to solve them Specification 1.1 Introduction to statistics 1.8 Secondary data Concepts and skills • • Specify the problem and plan. • • Collect data from a variety of suitable primary and secondary sources. • • Sort, classify and tabulate data and discrete or continuous quantitative data. • • Extract data from lists and tables. • • Know that measurements using real numbers depend upon the choice of unit. • • Convert metric units to metric units. • • Choose appropriate units for estimating or carrying out measurement. Functional skills • • L2 Collect and represent discrete and continuous data…. Starter • • Imagine you have just witnessed a smash-and-grab raid. The police ask you to describe the person responsible, their height, hair colour and number of accomplices. • • Ask several students to write down a description of the people above. Main teaching and learning • • Tell students that the things used in their descriptions are called variables, and a collection of these is called data. • • Display PowerPoint 1.1, slide 1 and discuss the following points: they are all variables to do with people; you can describe hair colour but cannot measure it; you can estimate height and represent it as a number. • • Now discuss classifying variables into two types as shown on PowerPoint 1.1, slide 2. Each click on the slide lists each variable in turn under one of the two headings. Variables described in words, such as colour, are qualitative variables. Variables with numeric values, such as height, are quantitative variables. • • Explain that quantitative variables can then be divided into two types as shown on PowerPoint 1.1, slide 3. Each click on the slide lists each variable in turn under its respective heading. Those that can take on any value on a numeric scale (height) are continuous variables. Those that can only take certain values on a numeric scale (number of accomplices) are discrete variables. • • Explain that continuous data is collected in metric units and that students will need to be able to convert between different metric units and also be able to select an appropriate unit of measure. • • Section 1.8 on Secondary data has been added to the lesson notes for 1.1 as considering primary and secondary data is another way of understanding types of data and follows on from the types of data discussed in 1.1. Common misconceptions • • Many students get the words qualitative and quantitative mixed up. Remind them that they come from the words ‘quality’ and ‘quantity’. Enrichment • • What test would you use to decide if data came from a qualitative or quantitative variable? (Can you describe it as a number?) • • How can you tell if numerical data is discrete? (It should be an exact number and not one that is estimated to the nearest.) • • Discuss primary and secondary data. If we collect data ourselves it is primary data. If we get data from some source such as the internet or a magazine, it is secondary data. Discrete and continuous data can also be primary or secondary data. Plenary • • Give an example of each of the following: (a) qualitative data (colour of hair) (b) quantitative data (distances) (c) discrete data (shoe size) (d) continuous data (weight) • • Can data be both qualitative and discrete? (No, ‘discrete’ and ‘continuous’ refers only to quantitative data.) ● 1 1 Collecting and recording data continuous data discrete data hypothesis primary data qualitative data quantitative data 2 CD Resources PowerPoint 1.1 Introduction to data Links http://www.mathsisfun.com/data/data. html Resources 1 1
Transcript of Specifi cation 1.1 Introduction to statistics 1 1.8...

GCSE 2010SP a (part) Understand and use
statistical problem-solving process…
SP d (part) … distinguishing between
different types of data
SP e Extract data from printed tables
and lists
GM o (part) Interpret scales on a range
of measuring instruments and recognise
the inaccuracy of measurements
GM p Convert measurements from one
unit to another
GM q Make sensible estimates of a
range of measures
FS Process skillsRecognise that a situation has
aspects that can be represented using
mathematics
Select the mathematical information
to use
Find results and solutions
FS PerformanceLevel 2 Identify the situation or problems
and identify the mathematical methods
needed to solve them
Specifi cation 1.1 Introduction to statistics 1.8 Secondary data
Concepts and skills
•• Specify the problem and plan.
•• Collect data from a variety of suitable primary and secondary sources.
•• Sort, classify and tabulate data and discrete or continuous quantitative data.
•• Extract data from lists and tables.
•• Know that measurements using real numbers depend upon the choice of unit.
•• Convert metric units to metric units.
•• Choose appropriate units for estimating or carrying out measurement.
Functional skills
•• L2 Collect and represent discrete and continuous data….
Starter
•• Imagine you have just witnessed a smash-and-grab raid. The police ask you to describe the person responsible, their height, hair colour and number of accomplices.
•• Ask several students to write down a description of the people above.
Main teaching and learning
•• Tell students that the things used in their descriptions are called variables, and a collection of these is called data.
•• Display PowerPoint 1.1, slide 1 and discuss the following points: they are all variables to do with people; you can describe hair colour but cannot measure it; you can estimate height and represent it as a number.
•• Now discuss classifying variables into two types as shown on PowerPoint 1.1, slide 2. Each click on the slide lists each variable in turn under one of the two headings. Variables described in words, such as colour, are qualitative variables. Variables with numeric values, such as height, are quantitative variables.
•• Explain that quantitative variables can then be divided into two types as shown on PowerPoint 1.1, slide 3. Each click on the slide lists each variable in turn under its respective heading. Those that can take on any value on a numeric scale (height) are continuous variables. Those that can only take certain values on a numeric scale (number of accomplices) are discrete variables.
•• Explain that continuous data is collected in metric units and that students will need to be able to convert between different metric units and also be able to select an appropriate unit of measure.
•• Section 1.8 on Secondary data has been added to the lesson notes for 1.1 as considering primary and secondary data is another way of understanding types of data and follows on from the types of data discussed in 1.1.
Common misconceptions
•• Many students get the words qualitative and quantitative mixed up. Remind them that they come from the words ‘quality’ and ‘quantity’.
Enrichment
•• What test would you use to decide if data came from a qualitative or quantitative variable? (Can you describe it as a number?)
•• How can you tell if numerical data is discrete? (It should be an exact number and not one that is estimated to the nearest.)
•• Discuss primary and secondary data. If we collect data ourselves it is primary data. If we get data from some source such as the internet or a magazine, it is secondary data. Discrete and continuous data can also be primary or secondary data.
Plenary
•• Give an example of each of the following:(a) qualitative data (colour of hair) (b) quantitative data (distances) (c) discrete data (shoe size) (d) continuous data (weight)
•• Can data be both qualitative and discrete? (No, ‘discrete’ and ‘continuous’ refers only to quantitative data.)
�1 1 Collecting and recording data
continuous data discrete data hypothesis primary data qualitative data quantitative data 2
CD ResourcesPowerPoint 1.1 Introduction to data
Linkshttp://www.mathsisfun.com/data/data.
html
Resources
11
GCSE 2010SP a (part) Understand and use …
handling data cycle
SP c Design an experiment or survey
FS Process skillsSelect the mathematical information
to use
FS PerformanceLevel 2 Understand routine and
non-routine problems in familiar and
unfamiliar contexts and situations
Specifi cation
ResourcesClass set of ‘support’ and ‘not support’
sheets
Resources
1.2 Sampling methods
Concepts and skills
•• Decide what data to collect …
•• Understand sample and population.
•• Select and justify a sampling scheme and a method to investigate a population, including random … sampling.
•• Design an experiment or survey.
Functional skills
•• L2 Collect and represent discrete and continuous data…
Starter
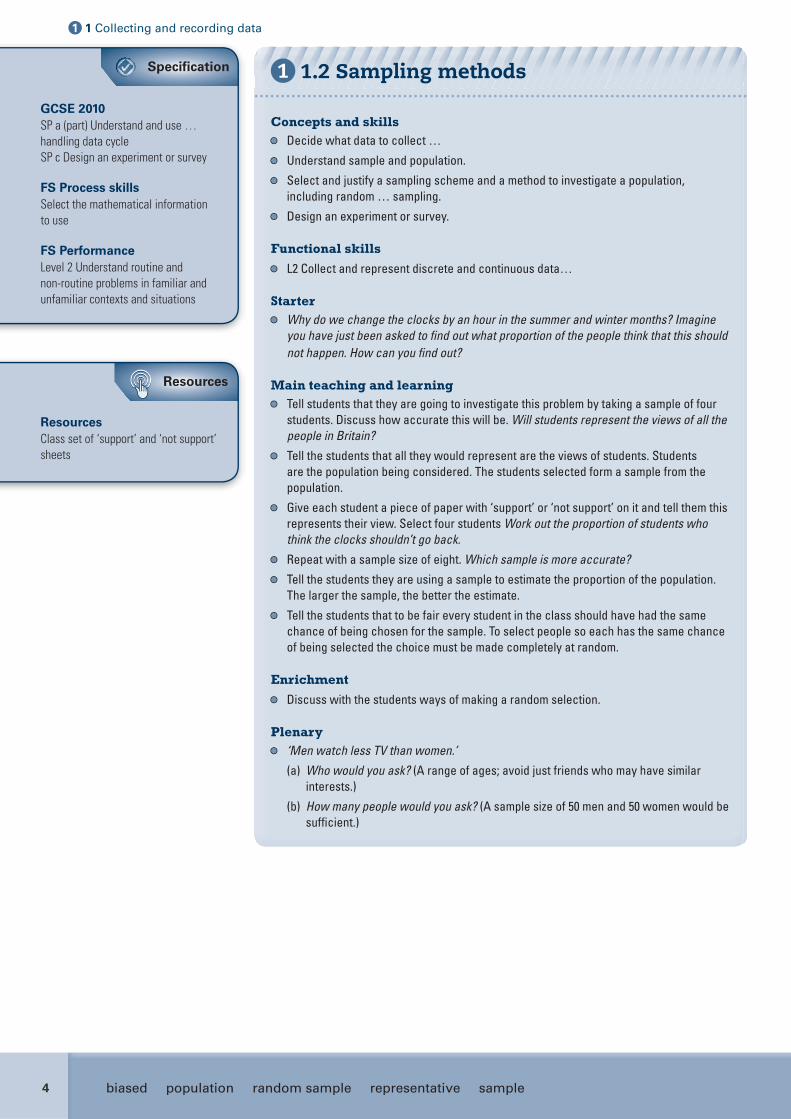
•• Why do we change the clocks by an hour in the summer and winter months? Imagine you have just been asked to fi nd out what proportion of the people think that this should not happen. How can you fi nd out?
Main teaching and learning
•• Tell students that they are going to investigate this problem by taking a sample of four students. Discuss how accurate this will be. Will students represent the views of all the people in Britain?
•• Tell the students that all they would represent are the views of students. Students are the population being considered. The students selected form a sample from the population.
•• Give each student a piece of paper with ‘support’ or ‘not support’ on it and tell them this represents their view. Select four students Work out the proportion of students who think the clocks shouldn’t go back.
•• Repeat with a sample size of eight. Which sample is more accurate?
•• Tell the students they are using a sample to estimate the proportion of the population. The larger the sample, the better the estimate.
•• Tell the students that to be fair every student in the class should have had the same chance of being chosen for the sample. To select people so each has the same chance of being selected the choice must be made completely at random.
Enrichment
•• Discuss with the students ways of making a random selection.
Plenary
•• ‘Men watch less TV than women.’
(a) Who would you ask? (A range of ages; avoid just friends who may have similar interests.)
(b) How many people would you ask? (A sample size of 50 men and 50 women would be suffi cient.)
biased population random sample representative sample
�1 1 Collecting and recording data
4
1
GCSE 2010SP c Design an experiment or survey
FS Process skillsSelect the mathematical information
to use
Find results and solutions
FS PerformanceLevel 2 Identify the situation or problems
and identify the mathematical methods
needed to solve them
Specifi cation 1.3 Stratifi ed sampling
Concepts and skills
•• Design an experiment or survey.
•• Select and justify a sampling scheme and a method to investigate a population, including … stratifi ed sampling.
•• Use stratifi ed sampling.
Functional skills
•• L2 Collect and represent discrete and continuous data…
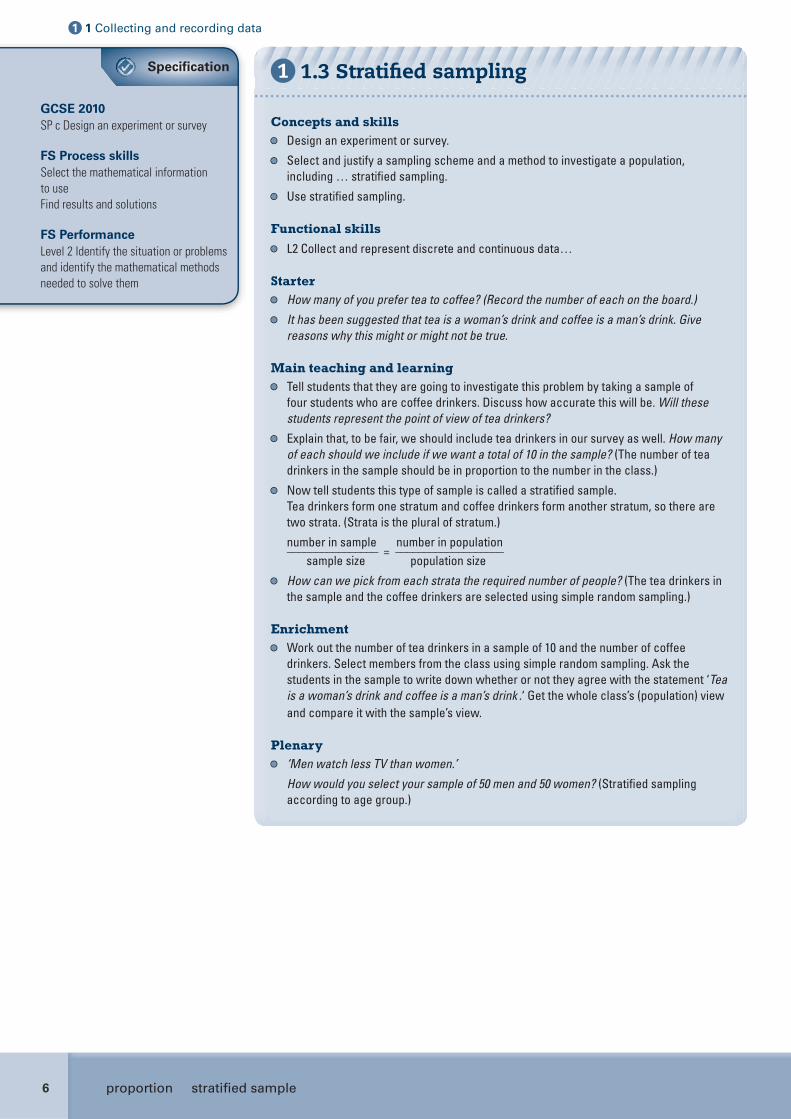
Starter
•• How many of you prefer tea to coffee? (Record the number of each on the board.)
•• It has been suggested that tea is a woman’s drink and coffee is a man’s drink. Give reasons why this might or might not be true.
Main teaching and learning
•• Tell students that they are going to investigate this problem by taking a sample of four students who are coffee drinkers. Discuss how accurate this will be. Will these students represent the point of view of tea drinkers?
•• Explain that, to be fair, we should include tea drinkers in our survey as well. How many of each should we include if we want a total of 10 in the sample? (The number of tea drinkers in the sample should be in proportion to the number in the class.)
•• Now tell students this type of sample is called a stratifi ed sample.Tea drinkers form one stratum and coffee drinkers form another stratum, so there are two strata. (Strata is the plural of stratum.)
number in sample number in population–––––––––––––––– = ––––––––––––––––––– sample size population size
•• How can we pick from each strata the required number of people? (The tea drinkers in the sample and the coffee drinkers are selected using simple random sampling.)
Enrichment
•• Work out the number of tea drinkers in a sample of 10 and the number of coffee drinkers. Select members from the class using simple random sampling. Ask the students in the sample to write down whether or not they agree with the statement ‘Tea is a woman’s drink and coffee is a man’s drink .‘ Get the whole class’s (population) view and compare it with the sample’s view.
Plenary
•• ‘Men watch less TV than women.’
How would you select your sample of 50 men and 50 women? (Stratifi ed sampling according to age group.)
proportion stratifi ed sample
�1 1 Collecting and recording data
6
1

GCSE 2010SP a (part) Understand and use…
handling data cycle
SP c (part) Design an experiment or
survey
SP d (part) Design data-collection
sheets…
GM o (part) Interpret scales on a range
of measuring instruments and recognise
the inaccuracy of measurements
FS Process skillsSelect the mathematical information
to use
Find results and solutions
FS PerformanceLevel 2 Apply a range of mathematics to
fi nd solutions
Specifi cation
CD ResourcesPowerPoint 1.4 Collecting and recording
data
Linkshttp://nrich.maths.org/6044
ActiveTeach resourcesFrequency polygons interactive
Resources
1.4 Collecting data by observation and experiment
Concepts and skills
•• Collect data from a variety of suitable primary and secondary sources.
•• Use suitable data collection techniques.
•• Process and represent the data.
•• Identify which primary data they need to collect and in what format, including grouped data.
•• Design and use data-collection sheets for grouped, discrete and continuous data.
•• Collect data using various methods.
•• Sort, classify and tabulate data and discrete or continuous quantitative data.
•• Group discrete and continuous data into class intervals of equal width.
•• Interpret scales on a range of measuring instruments: seconds, minutes, hours, days, weeks, months and years.
•• Use correct notation for time, 12- and 24-hour clock.
•• Work out time intervals.
•• Recognise the inaccuracy of measurements.
•• Recognise that measurements given to the nearest whole unit may be inaccurate by up to one half in either direction.
Functional skills
•• L2 Collect and represent discrete and continuous data…
Starter
•• Who had cereal for breakfast? Did you have something healthy, or do you have a sweet tooth in the mornings? How much sugar do you think there is in cereal?
Main teaching and learning
•• Explain that to collect data you may have to use measuring instruments and will therefore need to be able to read different scales. Go through a number of examples of different instruments, including clocks and time intervals.
•• Tell students that they are going to collect data on breakfast cereals. PowerPoint 1.4, slide 1, shows how much sugar there is in 16 different breakfast cereals. (This information is given on the side of the packet.) Discuss how accurate this will be. Why is the fi gure given per 100 g?
•• Now explain that the fi gures are given in any order, but to make them understandable they can be put in order (PowerPoint 1.4, slide 2).
•• Explain that it is not easy to see a pattern to the numbers. To see a pattern the fi gures are put into groups. If we let s be the number of grams of sugar per 100 g, a group could be 20 � s � 25. 20 to 25 is known as the class interval. 20 and 25 are called class limits. 25 – 20 = 5 is the class size.
•• Now show students how to complete the table on PowerPoint 1.4, slide 3. Explain that this is a data-collection sheet. You can use a stroke | to represent one number and to make counting easier you can use | | | | to represent fi ve numbers.
•• Finally, tell students that the total number in a group is called the class frequency. Do not save the PowerPoint.
Enrichment
•• With the students, work out the group that has the highest frequency. Discuss other ways of collecting data.
Plenary
•• Ask students in pairs to toss a 2p coin 50 times and record the number of Heads and Tails they ‘score’ by keeping a tally. Why is tallying a good way to keep a record of the number of times something occurs? (It is a simple but effective way of recording different events. The number of times each event occurred is easy to count.)
class intervals collecting data by experiment collecting data by observation
�1 1 Collecting and recording data
8
1
GCSE 2010SP c Design an experiment or survey
SP d (part) Design data-collection
sheets…
FS Process skillsDraw conclusions in light of situations
FS PerformanceLevel 2 Interpret and communicate
solutions to … practical problems in
familiar and unfamiliar contexts and
situations
Specifi cation
CD resourcesPowerPoint 1.5 Questionnaires
Linkshttp://www.statistics.gov.uk/StatBase/
Explodata/Spreadsheets/D3687.xls
http://www.bbc.co.uk/schools/
gcsebitesize/maths/data/
questionnairesact.shtml
ActiveTeach resourcesCounting traffi c 2 video
Resources
1.5 Questionnaires
Concepts and skills
•• Design an experiment or survey.
•• Consider fairness.
•• Design a question for a questionnaire.
•• Criticise questions for a questionnaire.
•• Collect data using various methods.
Functional skills
•• L2 Collect and represent discrete and continuous data…
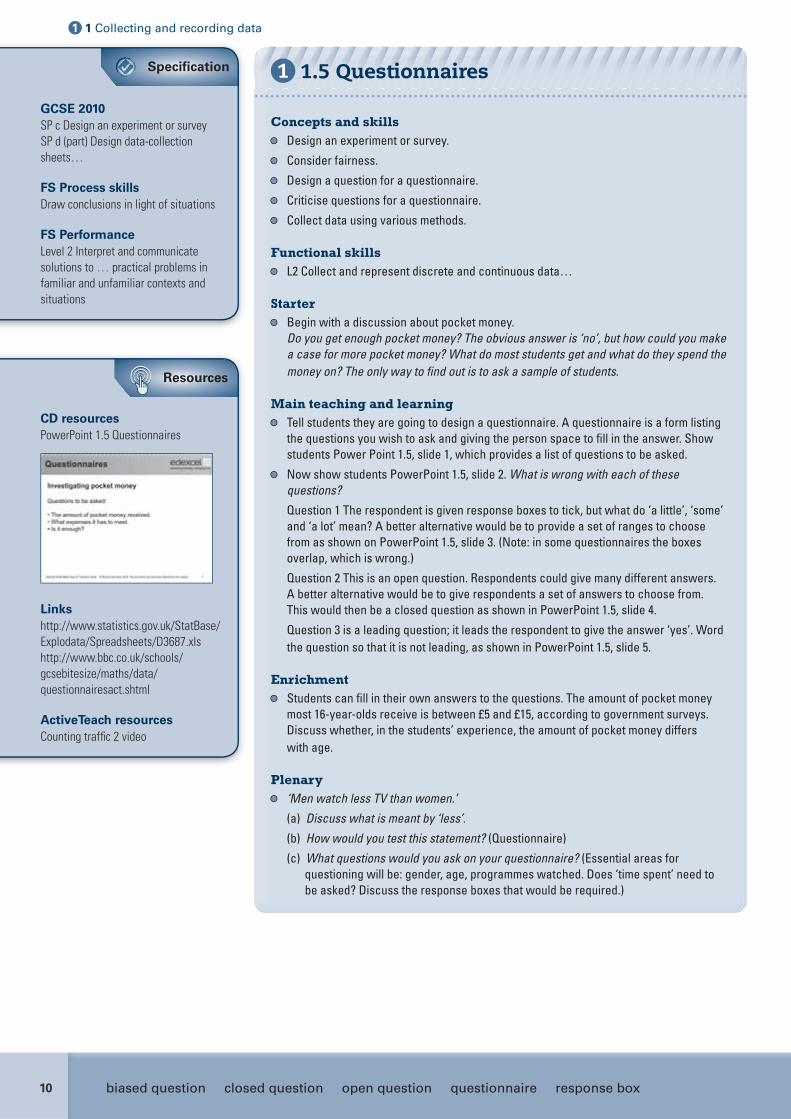
Starter
•• Begin with a discussion about pocket money. Do you get enough pocket money? The obvious answer is ‘no’, but how could you make a case for more pocket money? What do most students get and what do they spend the money on? The only way to fi nd out is to ask a sample of students.
Main teaching and learning
•• Tell students they are going to design a questionnaire. A questionnaire is a form listing the questions you wish to ask and giving the person space to fi ll in the answer. Show students Power Point 1.5, slide 1, which provides a list of questions to be asked.
•• Now show students PowerPoint 1.5, slide 2. What is wrong with each of these questions?
Question 1 The respondent is given response boxes to tick, but what do ‘a little’, ‘some’ and ‘a lot’ mean? A better alternative would be to provide a set of ranges to choose from as shown on PowerPoint 1.5, slide 3. (Note: in some questionnaires the boxes overlap, which is wrong.)
Question 2 This is an open question. Respondents could give many different answers. A better alternative would be to give respondents a set of answers to choose from. This would then be a closed question as shown in PowerPoint 1.5, slide 4.
Question 3 is a leading question; it leads the respondent to give the answer ‘yes’. Word the question so that it is not leading, as shown in PowerPoint 1.5, slide 5.
Enrichment
•• Students can fi ll in their own answers to the questions. The amount of pocket money most 16-year-olds receive is between £5 and £15, according to government surveys. Discuss whether, in the students’ experience, the amount of pocket money differs with age.
Plenary
•• ‘Men watch less TV than women.’
(a) Discuss what is meant by ‘less’.
(b) How would you test this statement? (Questionnaire)
(c) What questions would you ask on your questionnaire? (Essential areas for questioning will be: gender, age, programmes watched. Does ‘time spent’ need to be asked? Discuss the response boxes that would be required.)
biased question closed question open question questionnaire response box
�1 1 Collecting and recording data
10
1
GCSE 2010SP a (part) Understand and use
statistical problem solving process …
SP d (part) Design data collection sheets
distinguishing between different types
of data
SP e Extract data from printed tables
and lists
SP f Design and use two-way tables for
discrete and grouped data
N u (part) Approximate to specifi ed
or appropriate degrees of accuracy
including a given power of ten, number
of decimal places and signifi cant fi gures
FS Process skillsSelect the mathematical information
to use
Find results and solutions
FS PerformanceLevel 2 Apply a range of mathematics to
fi nd solutions
Specifi cation
ResourcesRailway timetables, travel catalogues
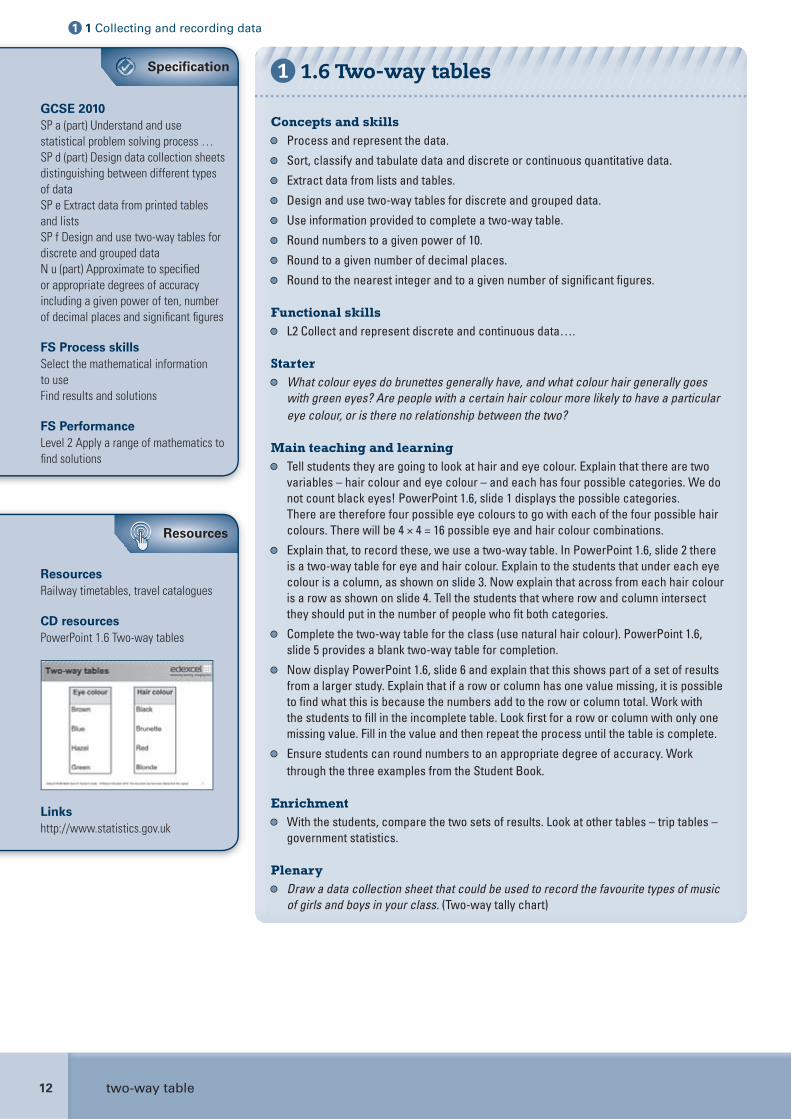
CD resourcesPowerPoint 1.6 Two-way tables
Linkshttp://www.statistics.gov.uk
Resources
1.6 Two-way tables
Concepts and skills
•• Process and represent the data.
•• Sort, classify and tabulate data and discrete or continuous quantitative data.
•• Extract data from lists and tables.
•• Design and use two-way tables for discrete and grouped data.
•• Use information provided to complete a two-way table.
•• Round numbers to a given power of 10.
•• Round to a given number of decimal places.
•• Round to the nearest integer and to a given number of signifi cant fi gures.
Functional skills
•• L2 Collect and represent discrete and continuous data….
Starter
•• What colour eyes do brunettes generally have, and what colour hair generally goes with green eyes? Are people with a certain hair colour more likely to have a particular eye colour, or is there no relationship between the two?
Main teaching and learning
•• Tell students they are going to look at hair and eye colour. Explain that there are two variables – hair colour and eye colour – and each has four possible categories. We do not count black eyes! PowerPoint 1.6, slide 1 displays the possible categories. There are therefore four possible eye colours to go with each of the four possible hair colours. There will be 4 × 4 = 16 possible eye and hair colour combinations.
•• Explain that, to record these, we use a two-way table. In PowerPoint 1.6, slide 2 there is a two-way table for eye and hair colour. Explain to the students that under each eye colour is a column, as shown on slide 3. Now explain that across from each hair colour is a row as shown on slide 4. Tell the students that where row and column intersect they should put in the number of people who fi t both categories.
•• Complete the two-way table for the class (use natural hair colour). PowerPoint 1.6, slide 5 provides a blank two-way table for completion.
•• Now display PowerPoint 1.6, slide 6 and explain that this shows part of a set of results from a larger study. Explain that if a row or column has one value missing, it is possible to fi nd what this is because the numbers add to the row or column total. Work with the students to fi ll in the incomplete table. Look fi rst for a row or column with only one missing value. Fill in the value and then repeat the process until the table is complete.
•• Ensure students can round numbers to an appropriate degree of accuracy. Work through the three examples from the Student Book.
Enrichment
•• With the students, compare the two sets of results. Look at other tables – trip tables – government statistics.
Plenary
•• Draw a data collection sheet that could be used to record the favourite types of music of girls and boys in your class. (Two-way tally chart)
two-way table
�1 1 Collecting and recording data
12
1
GCSE 2010SP a Understand and use statistical
problem solving process/handling data
cycle
SP b Identify possible sources of bias
SP c Design an experiment or survey
FS Process skillsDraw conclusions in light of situations
FS PerformanceLevel 2 Draw conclusions and provide
mathematical justifi cations
Specifi cation 1.7 Sources of bias
Concepts and skills
•• Interpret and discuss the data.
•• Discuss how data relate to a problem, identify possible sources of bias and plan to minimise it.
•• Understand how different sample sizes may affect the reliability of conclusions drawn.
•• Consider fairness.
Functional skills
•• L2 Collect and represent discrete and continuous data…
Starter
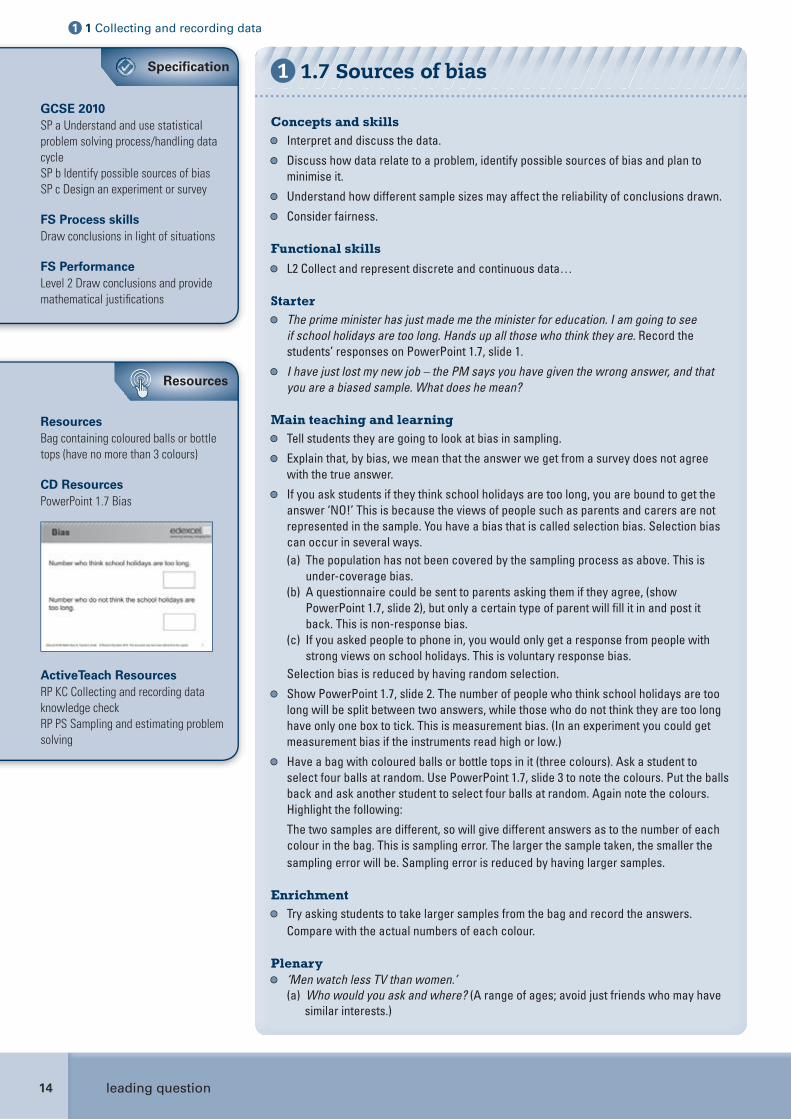
•• The prime minister has just made me the minister for education. I am going to see if school holidays are too long. Hands up all those who think they are. Record the students’ responses on PowerPoint 1.7, slide 1.
•• I have just lost my new job – the PM says you have given the wrong answer, and that you are a biased sample. What does he mean?
Main teaching and learning
•• Tell students they are going to look at bias in sampling.
•• Explain that, by bias, we mean that the answer we get from a survey does not agree with the true answer.
•• If you ask students if they think school holidays are too long, you are bound to get the answer ‘NO!’ This is because the views of people such as parents and carers are not represented in the sample. You have a bias that is called selection bias. Selection bias can occur in several ways.(a) The population has not been covered by the sampling process as above. This is
under-coverage bias.(b) A questionnaire could be sent to parents asking them if they agree, (show
PowerPoint 1.7, slide 2), but only a certain type of parent will fi ll it in and post it back. This is non-response bias.
(c) If you asked people to phone in, you would only get a response from people with strong views on school holidays. This is voluntary response bias.
Selection bias is reduced by having random selection.
•• Show PowerPoint 1.7, slide 2. The number of people who think school holidays are too long will be split between two answers, while those who do not think they are too long have only one box to tick. This is measurement bias. (In an experiment you could get measurement bias if the instruments read high or low.)
•• Have a bag with coloured balls or bottle tops in it (three colours). Ask a student to select four balls at random. Use PowerPoint 1.7, slide 3 to note the colours. Put the balls back and ask another student to select four balls at random. Again note the colours. Highlight the following:
The two samples are different, so will give different answers as to the number of each colour in the bag. This is sampling error. The larger the sample taken, the smaller the sampling error will be. Sampling error is reduced by having larger samples.
Enrichment
•• Try asking students to take larger samples from the bag and record the answers. Compare with the actual numbers of each colour.
Plenary •• ‘Men watch less TV than women.’
(a) Who would you ask and where? (A range of ages; avoid just friends who may have similar interests.)
leading question
�1 1 Collecting and recording data
14
ResourcesBag containing coloured balls or bottle
tops (have no more than 3 colours)
CD ResourcesPowerPoint 1.7 Bias
ActiveTeach ResourcesRP KC Collecting and recording data
knowledge check
RP PS Sampling and estimating problem
solving
Resources
1