
Species level quantitative metagenomics Preprocessing and ... · 36626 - Next Generation Sequencing...
22
36626 - Next Generation Sequencing Analysis Species level quantitative metagenomics Simon Rasmussen 36626: Next Generation Sequencing analysis DTU Bioinformatics
Transcript of Species level quantitative metagenomics Preprocessing and ... · 36626 - Next Generation Sequencing...

36626 - Next Generation Sequencing Analysis
Preprocessing and SNP calling Natasja S. Ehlers, PhD student Center for Biological Sequence Analysis Functional Human Variation Group
Species level quantitative metagenomics
Simon Rasmussen36626: Next Generation Sequencing analysis
DTU Bioinformatics

36626 - Next Generation Sequencing Analysis
Nothing really new hereNothing new- but the technology

36626 - Next Generation Sequencing Analysis
Classical measures
• Abundance
• Richness
• Rarefaction
• Diversity
Global terrestrial diversity

Abundance (counts)

36626 - Next Generation Sequencing Analysis
Species richness
• The number of different species in a system
13/06/2016 Quantitative Metagenomics 10 DTU Sytems Biology, Technical University of Denmark
Abundance (Count)
Lion 64 Zebra 128 Giraffe 64 leopard 64 rhinoceros 64 hippopotamus 128 gazelle 128 elephant 64 monkey 9
9 observed species

36626 - Next Generation Sequencing Analysis
Rarefaction
• Species richness is a function of our no. observations
• When have we sampled enough?
Rarefaction curve

36626 - Next Generation Sequencing Analysis
Species diversity• “Effective number of species” represented in a
dataset
• Richness & Evenness
• Alpha diversity (within sample)
• Beta diversity (between samples)

36626 - Next Generation Sequencing Analysis
Alpha diversity• Shannon index
• Quantify the entropy (information content)
• Quantifies the uncertainty (degree of surprise) associated with a prediction
Pi = species proportionR = observed species

36626 - Next Generation Sequencing Analysis
Alpha diversity
13/06/2016 Quantitative Metagenomics 14 DTU Sytems Biology, Technical University of Denmark
Richness
Lion 1 Zebra 2 Giraffe 1 Leopard 1 Rhinoceros 1 Hippopotamus 2 Gazelle 2 Elephant 1 Monkey 0
Species richness estimators: Chao1 index = Sobs + f12/(2f2) Sobs = observed species f1 = species observed once f2 = species observed twice
8 observed species
Chao1 index = 8 + 52/(2*3) = 12.17
H’ = -(ln(0.090.09) + ln(0.180.18) + … = 2.0

36626 - Next Generation Sequencing Analysis
Beta diversity• Between samples (communities)
13/06/2016 Quantitative Metagenomics 26 DTU Sytems Biology, Technical University of Denmark
Beta-Diversity
Lion 0 2 Zebra 3 2 Giraffe 0 4 Leopard 0 2 Rhinoceros 1 2 Hippodrome 4 0 Gazelle 0 1 Elephant 1 0 Total 9 13
13/06/2016 Quantitative Metagenomics 26 DTU Sytems Biology, Technical University of Denmark
Beta-Diversity
Lion 0 2 Zebra 3 2 Giraffe 0 4 Leopard 0 2 Rhinoceros 1 2 Hippodrome 4 0 Gazelle 0 1 Elephant 1 0 Total 9 13

36626 - Next Generation Sequencing Analysis
Bray-curtis dissimilarity
13/06/2016 Quantitative Metagenomics 27 DTU Sytems Biology, Technical University of Denmark
Beta-Diversity Lion 0 2 Zebra 3 2 Giraffe 0 4 Leopard 0 2 Rhinoceros 1 2 Hippodrome 4 0 Gazelle 0 1 Elephant 1 0 Total 9 13
Bray-Curtis dissimilarity metric
Bij = 1 - 2Cij / (Si + Sj) C = sum of the lowest count of common species S = total count of the sample Bs1s2 = 1 – 2*3 / 22 = 0.73 - Dissimilar C = 3 Ss1 + Ss2 = 22
0 ≤ B ≤ 1 Bij = 1 - 2Cij / (Si + Sj)
C = sum of the lowest count of common species
S = total count of the sample
Bs1s2 = 1 - 2*(2+1) / (9 + 13) = 0.73
0 ≤ B ≤ 1

36626 - Next Generation Sequencing Analysis
Sampling effect• To be fair we should sample equally in the systems
we investigate
downsizingTo be fair we should sample equally carefully in the systems we investigate
Did you find any bacteria?
No - not here

Sample sizes

36626 - Next Generation Sequencing Analysis
Sample sizes
• Accounting for different sample sizes:
• Normalise to sample size
• Rarefy (downsize) samples
• Statistically model the variance
36626 - Next Generation Sequencing Analysis
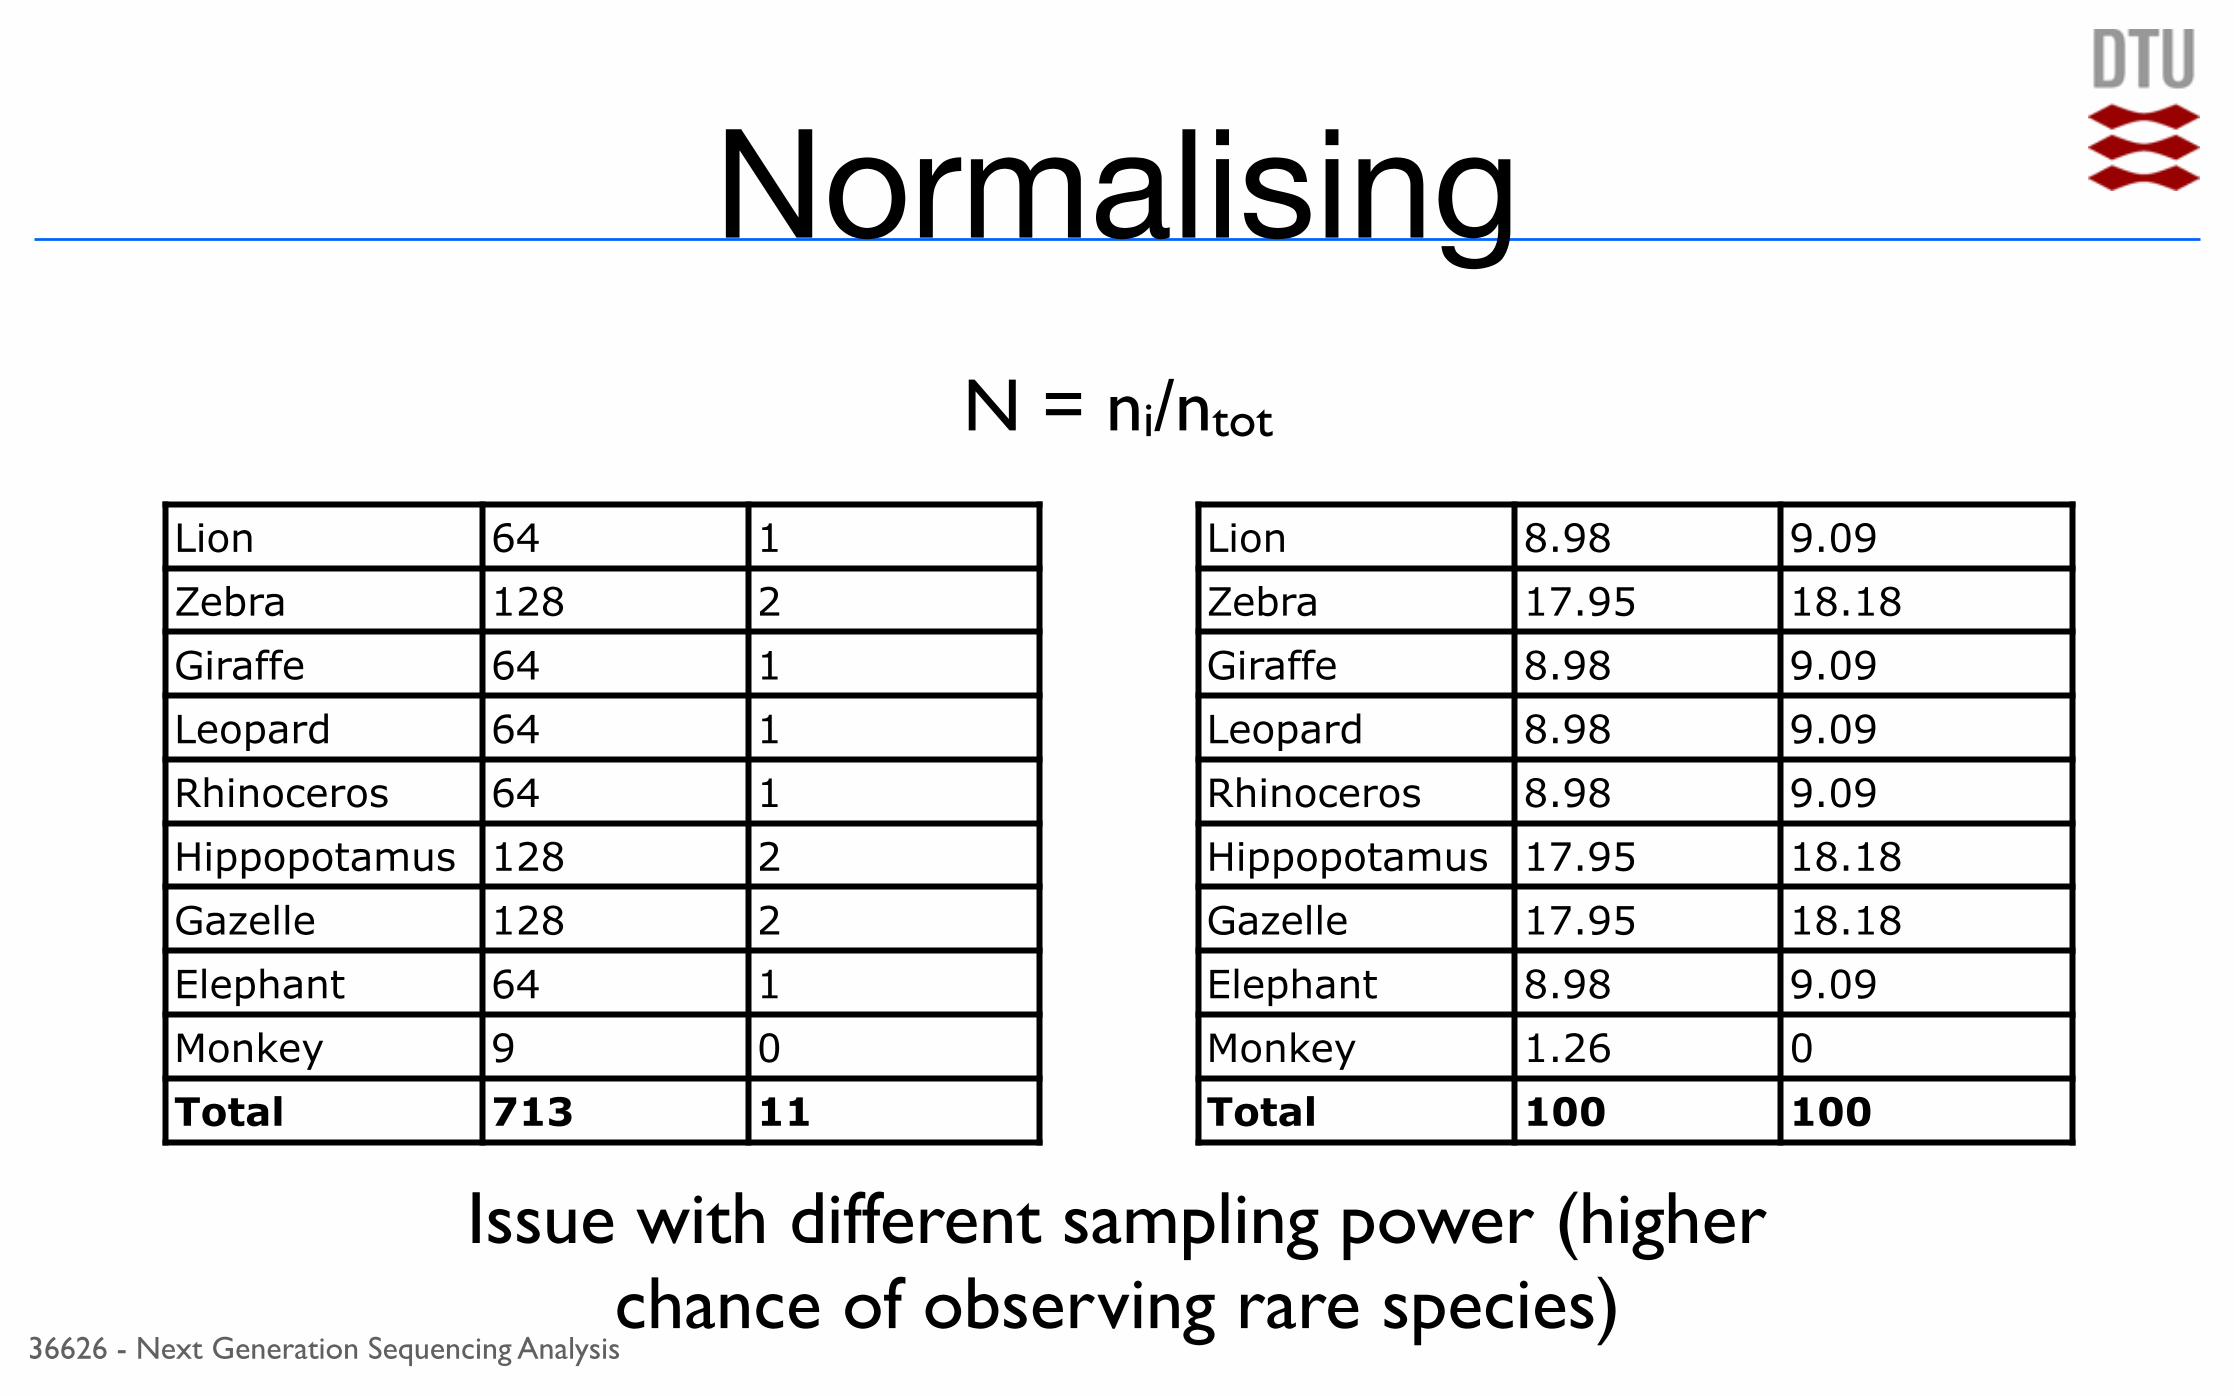
Normalising
13/06/2016 Quantitative Metagenomics 22 DTU Sytems Biology, Technical University of Denmark
Sample Sizes
Lion 64 1 Zebra 128 2 Giraffe 64 1 Leopard 64 1 Rhinoceros 64 1 Hippopotamus 128 2 Gazelle 128 2 Elephant 64 1 Monkey 9 0 Total 713 11
Normalize to library size: Norm = ni/ntot
Lion 8.98 9.09 Zebra 17.95 18.18 Giraffe 8.98 9.09 Leopard 8.98 9.09 Rhinoceros 8.98 9.09 Hippopotamus 17.95 18.18 Gazelle 17.95 18.18 Elephant 8.98 9.09 Monkey 1.26 0 Total 100 100
N = ni/ntot
Issue with different sampling power (higher chance of observing rare species)

36626 - Next Generation Sequencing Analysis
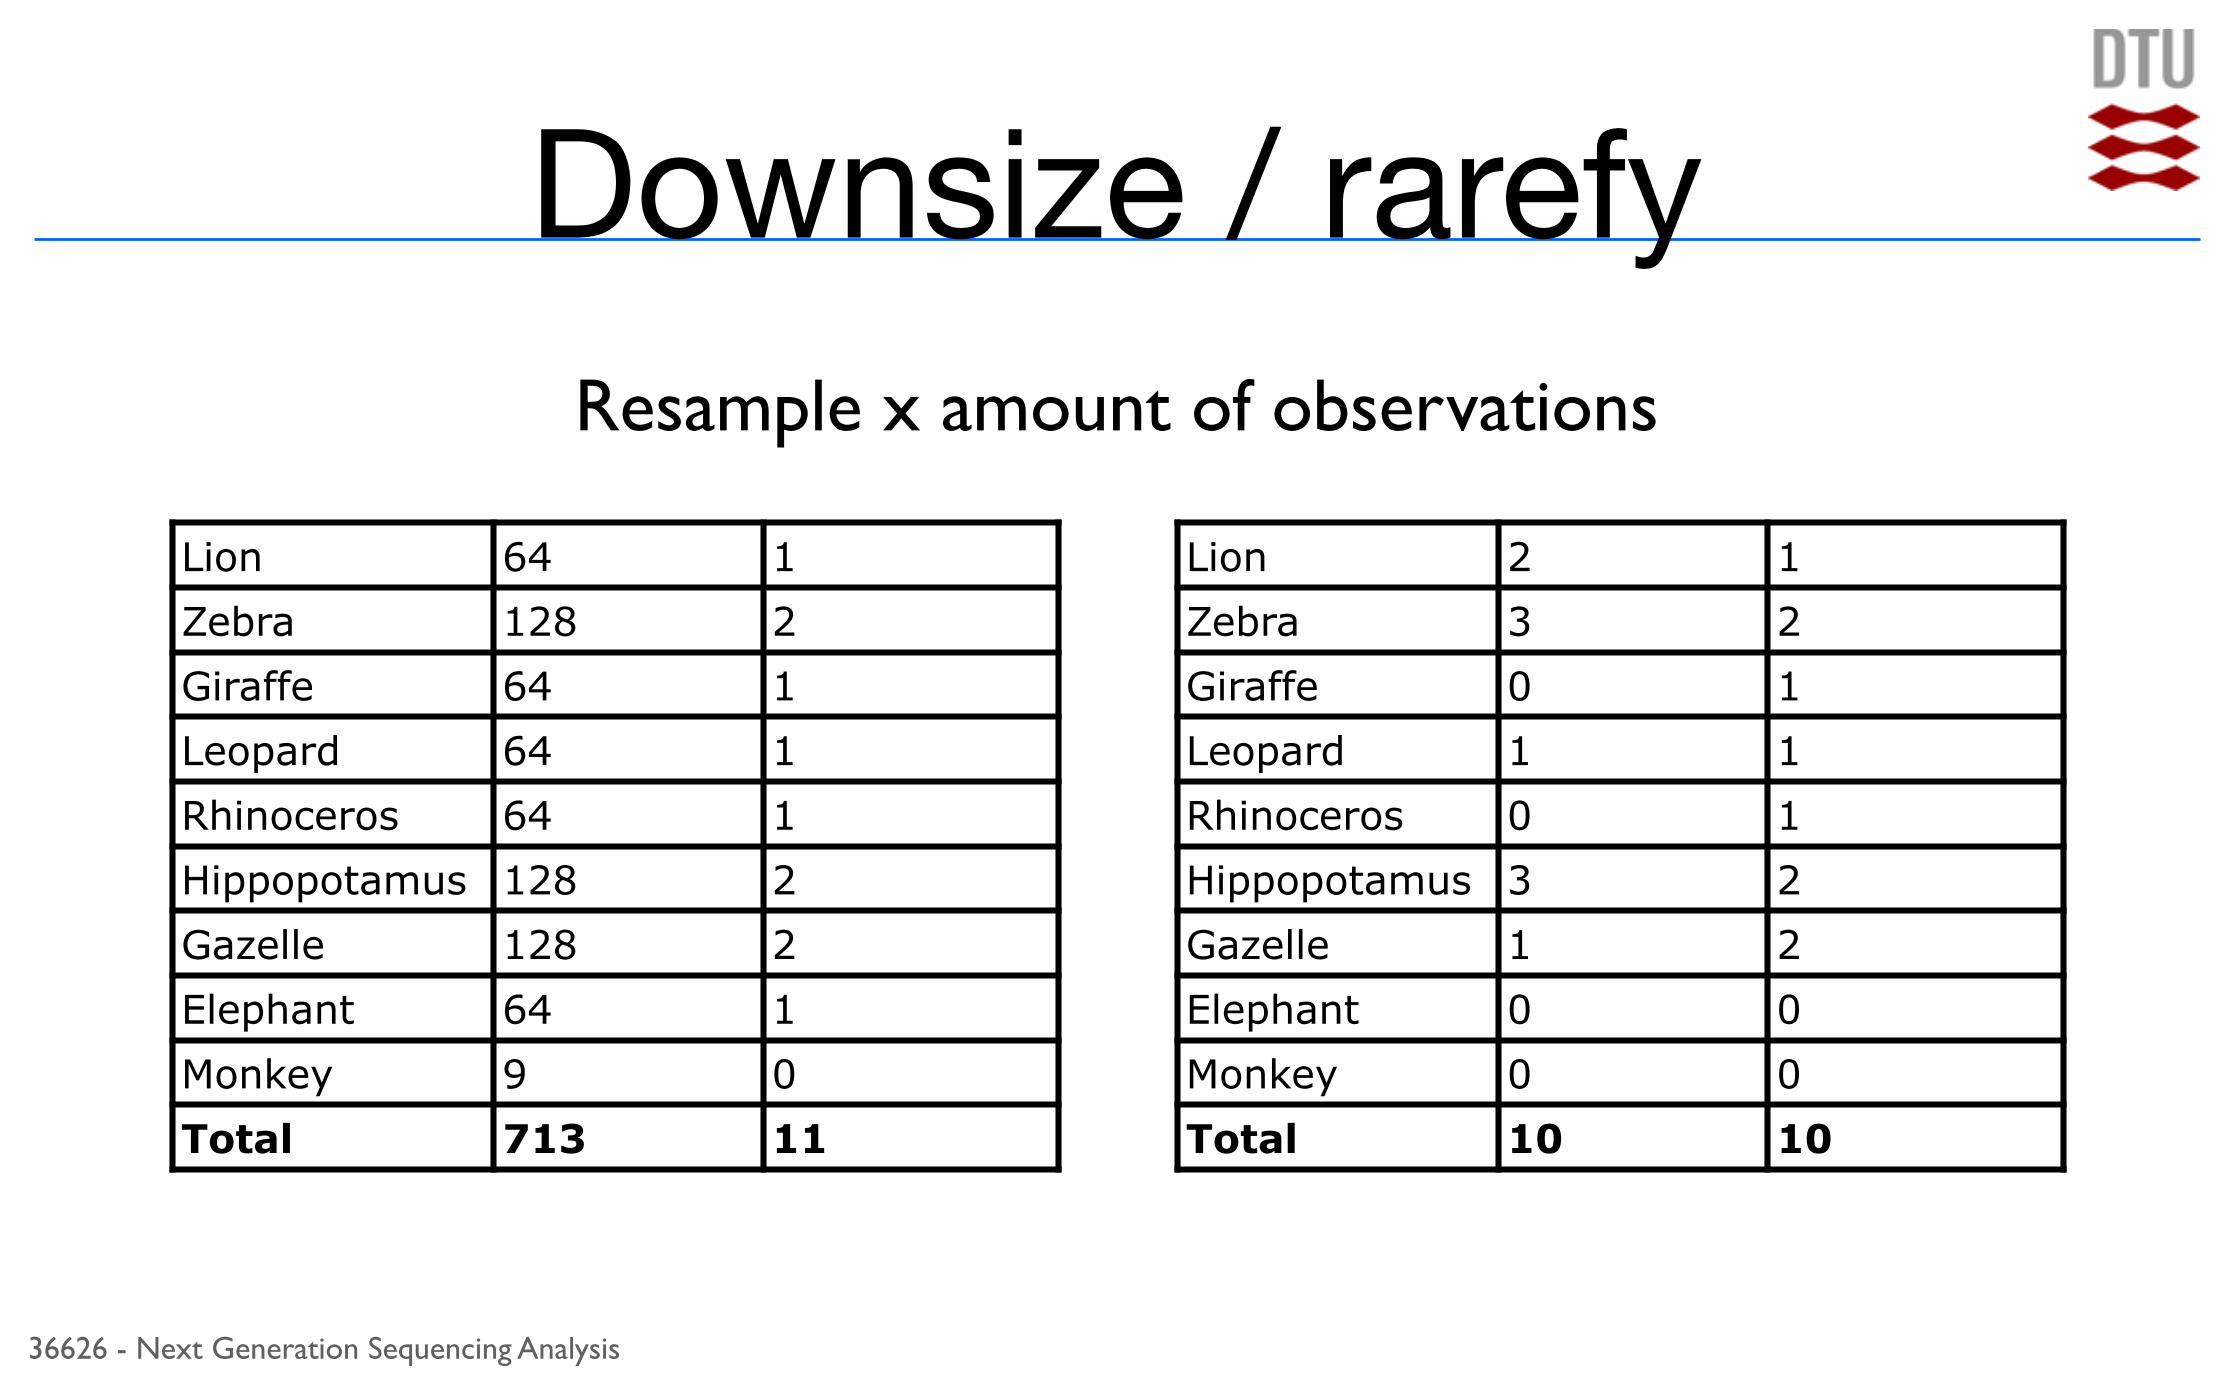
Downsize / rarefy
• Resample an equal number of observations (reads) from each sample
• Select the target depth carefully
• The more reads we keep the more sensitive
• We may have to remove samples with few counts
36626 - Next Generation Sequencing Analysis
Downsize / rarefy
13/06/2016 Quantitative Metagenomics 23 DTU Sytems Biology, Technical University of Denmark
Sample Sizes
Rarefying to smaller library size:
Lion 64 1 Zebra 128 2 Giraffe 64 1 Leopard 64 1 Rhinoceros 64 1 Hippopotamus 128 2 Gazelle 128 2 Elephant 64 1 Monkey 9 0 Total 713 11
Lion 2 1 Zebra 3 2 Giraffe 0 1 Leopard 1 1 Rhinoceros 0 1 Hippopotamus 3 2 Gazelle 1 2 Elephant 0 0 Monkey 0 0 Total 10 10
Resample x amount of observations

36626 - Next Generation Sequencing Analysis
Sample sizes• Statistically model the variance &
heteroscedasticity
• Use packages developed for RNA-seq such as DESeq2 and edgeR (negative binomial)
• Wilcoxon rank-sum statistics (ok for downsized data)

Lets try itTake a sample and count the animals!
Determine Richness, Species abundance and calculate Shannon diversity index
Calculate Bray-Curtis dissimilarity with your neighbour
36626 - Next Generation Sequencing Analysis
Computational exercise• Continuation from yesterday
• 124 gut microbiome samples (MetaHIT)
• Sequenced using Illumina (~5Gbp)
• De novo assembly, gene prediction, gene count matrix


![the Netherlands, Slovenia, Yvet, Maureen, Natasja, Jonas, [A4T] (1).pptx](https://static.fdocuments.in/doc/165x107/577cc9971a28aba711a42642/the-netherlands-slovenia-yvet-maureen-natasja-jonas-a4t-1pptx.jpg)

