Specialty Distribution Report Q4 2016 - SDR Ventures Buyer Inv. Date Select Corporate Acquisitions...
11
Transcript of Specialty Distribution Report Q4 2016 - SDR Ventures Buyer Inv. Date Select Corporate Acquisitions...
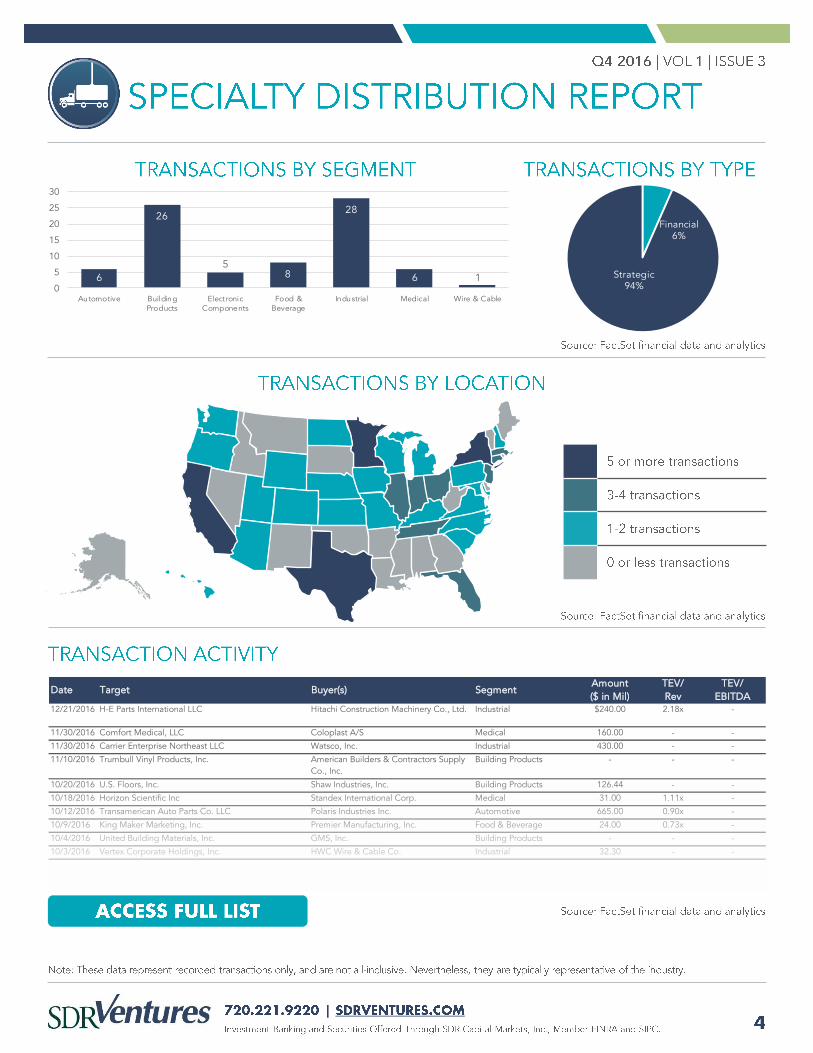
Financial6%
Strategic94%
6
26
58
28
6 10
5
10
15
20
25
30
Automotive BuildingProducts
ElectronicComponents
Food &Beverage
Industrial Medical Wire & Cable
Date Target Buyer(s) SegmentAmount
($ in Mil)
TEV/
Rev
TEV/
EBITDA12/21/2016 H-E Parts International LLC Hitachi Construction Machinery Co., Ltd. Industrial $240.00 2.18x -
11/30/2016 Comfort Medical, LLC Coloplast A/S Medical 160.00 - -
11/30/2016 Carrier Enterprise Northeast LLC Watsco, Inc. Industrial 430.00 - -
11/10/2016 Trumbull Vinyl Products, Inc. American Builders & Contractors Supply
Co., Inc.
Building Products - - -
10/20/2016 U.S. Floors, Inc. Shaw Industries, Inc. Building Products 126.44 - -
10/18/2016 Horizon Scientific Inc Standex International Corp. Medical 31.00 1.11x -
10/12/2016 Transamerican Auto Parts Co. LLC Polaris Industries Inc. Automotive 665.00 0.90x -
10/9/2016 King Maker Marketing, Inc. Premier Manufacturing, Inc. Food & Beverage 24.00 0.73x -
10/4/2016 United Building Materials, Inc. GMS, Inc. Building Products - - -
10/3/2016 Vertex Corporate Holdings, Inc. HWC Wire & Cable Co. Industrial 32.30 - -

Strategic Buyer Inv. Date Select Corporate Acquisitions
Beacon Roofing Supply, Inc. 12/16/2016 ▪ BJ Building Material Supply
6/1/2016 ▪ Woodfeathers, Inc.
5/2/2016 ▪ Fox Brothers Company
4/1/2016 ▪ Atlantic Building Products, Inc.
12/29/2015 ▪ Statewide Wholesale, Inc.
GMS Inc. 12/6/2016 ▪ Two Interior Products Supply Divisions of SGI, Inc.
11/1/2016 ▪ Ryan Building Materials, Inc.
10/4/2016 ▪ United Building Materials, Inc.
9/2/2016 ▪ Olympia Building Supplies, LLC
8/30/2016 ▪ Steven Kempf Building Material Company
7/6/2016 ▪ RockWise, LLC
5/3/2016 ▪ Wall & Ceiling Supply Company, Inc.
4/1/2016 ▪ Professional Handling and Distribution, Inc.
Distribution International, Inc. 7/14/2016 ▪ E.O. Wood Co
6/2/2016 ▪ Johnson Insulation, LLC (Certain Assets)
3/7/2016 ▪ 3i Supply Company
12/1/2015 ▪ RHEM, LLC (dba E.J. Bartells)
10/20/2015 ▪ Selle Supply Company and PBI Supply, Inc.
6/3/2015 ▪ Insulation Fabricators, Inc.
Genuine Parts Company (GPC) 10/5/2016 ▪ Braas Co.
7/19/2016 ▪ OBBCO Safety & Supply
6/21/2016 ▪ Auto-Camping Ltd.
6/21/2016 ▪ Rochester Midland (Certain Assets)
5/19/2016 ▪ The Safety Zone
3/9/2016 ▪ Covs Parts Pty Ltd
3/8/2016 ▪ Epperson & Company
2/16/2016 ▪ Missouri Power
2/1/2016 ▪ Olympus Imported Auto Parts Corporation
US LBM Holdings, LLC 6/1/2016 ▪ Raymond Building Supply
3/31/2016 ▪ American Lumber Corporation
12/18/2015 ▪ Parker's Building Supply
10/27/2015 ▪ Building Supply Association, Inc.
9/24/2015 ▪ Loumac Distributors, Inc.
4/17/2015 ▪ Rosen Materials, LLC
4/2/2015 ▪ Richardson Gypsum, LLC
11/10/2016 ▪ Trumbull Vinyl Products
10/25/2016 ▪ Ace Aluminum Distributors
9/13/2016 ▪ Sidewinder Supply Inc.
8/29/2016 ▪ L&W Supply Corporation
6/7/2016 ▪ GK Building Supply Corporation
5/17/2016 ▪ T&C Supply, Inc.
12/30/2015 ▪ Rooftek Roofing Supplies, Inc.
SRS Distribution, Inc. 12/2/2016 ▪ Metro Roofing Supplies
11/7/2016 ▪ Tri State Aluminum Products
10/24/2016 ▪ MidSouth Building Supply
8/22/2016 ▪ National Building & Roofing Supplies
8/8/2016 ▪ Monroe Aluminum Products, Inc.
5/10/2016 ▪ Atlantic Roofing Distributors LLC
12/21/2015 ▪ Willoughby Supply Company's South Florida Locations
3/25/2015 ▪ Roofers Supply & Service
American Builders & Contractors Supply Co., Inc
(ABC Supply)

Finacial Buyer Inv. Date Select Corporate Acquisitions
Kodiak Building Partners 4/18/2016 ▪ Factory Builder Stores, Inc.
9/29/2014 ▪ Barnsco Inc.
8/11/2014 ▪ AO, Inc.
12/27/2013 ▪ Jones Heartz Drywall Supply, LLC
6/12/2013 ▪ East Coast Building Materials LLC
Platinum Equity, LLC 11/16/2016 ▪ Microlease Plc (UK)
11/3/2016 ▪ Northeast Wholesale Nail & Fastener Supply
6/16/2016 ▪ Data Blue
6/8/2016 ▪ ConAgra Foods, Inc. JM Swank Business
5/31/2016 ▪ Electro Rent Corporation
3/27/2015 ▪ PrimeSource Building Products, Inc.
The Sterling Group 12/30/2016 ▪ Stetson Building Products, Inc.
11/1/2016 ▪ Border Construction Specialties LLC
11/1/2016 ▪ Brock White Co. LLC
7/31/2015 ▪ Aurora Parts & Accessories, LLC

-20%
-15%
-10%
-5%
0%
5%
10%
15%
20%
Automotive Building Products Electronic Components Food & Beverage
Industrial Medical Wire & Cable S&P 500
Company Name SymbolMarket Cap
($ in Mil)Price ($)
Quarter
Change
YTD
Change
% of 52
Week High
Est.
Revenue
Growth
EBITDA
Margin
TEV/
Rev
TEV/
EBITDA
Price/
EPS
TEV/
NTM
Revenue
TEV/
NTM
EBITDA
Genuine Parts Co. GPC-US 14,210$ 95.54$ -4.9% 11.2% 90.2% 4.0% 8.5% 1.0x 11.9x 20.6x 0.9x 10.8x
LKQ Corp. LKQ-US 9,425 30.65 -13.6% 3.4% 84.3% 17.6% 11.3% 1.5x 12.3x 20.0x 1.2x 10.4x
Dorman Products, Inc. DORM-US 2,529 73.06 14.3% 53.9% 92.5% 10.7% 21.8% 2.9x 14.4x 25.6x 2.6x 12.2x
Kaman Corp. KAMN-US 1,326 48.93 11.4% 19.9% 96.1% 3.2% 9.3% 0.9x 11.9x 26.0x 0.9x 9.6x
Uni-Sélect, Inc. UNS-CA 928 21.99 -7.8% -13.9% 80.1% 9.2% 9.7% 0.9x 10.2x 15.8x 0.8x 9.0x
Essendant, Inc. ESND-US 773 20.90 1.9% -35.7% 59.7% (0.6%) 3.7% 0.3x 7.5x NM 0.3x 7.7x
Lawson Products, Inc. LAWS-US 209 23.80 34.2% 1.9% 92.2% 3.9% 6.2% 0.8x 21.7x NM 0.7x 12.3x
Segment Average $4,200 5.1% 5.8% 85.0% 6.8% 10.1% 1.2x 12.8x 21.6x 1.1x 10.3x
Segment Median $1,326 1.9% 3.4% 90.2% 4.0% 9.3% 0.9x 11.9x 20.6x 0.9x 10.4x
Market Stats Operating Stats LTM Multiples NTM Multiples

Company Name SymbolMarket Cap
($ in Mil)Price ($)
Quarter
Change
YTD
Change
% of 52
Week High
Est.
Revenue
Growth
EBITDA
Margin
TEV/
Rev
TEV/
EBITDA
Price/
EPS
TEV/
NTM
Revenue
TEV/
NTM
EBITDA
Wolseley Plc WOS-GB 15,505$ 61.31$ 13.9% 34.4% 96.9% 18.1% 7.5% 0.9x 12.8x 20.5x 0.8x 10.7x
HD Supply Holdings, Inc. HDS-US 8,556 42.51 32.9% 41.6% 96.2% 4.3% 12.9% 1.7x 13.9x 8.4x 1.6x 12.6x
Pool Corp. POOL-US 4,313 104.34 10.4% 29.2% 96.6% 6.7% 11.6% 1.8x 17.1x 30.2x 1.8x 16.2x
Beacon Roofing Supply, Inc. BECN-US 2,760 46.07 9.5% 11.9% 93.4% 5.5% 10.6% 0.9x 10.8x 30.9x 0.9x 10.0x
BMC Stock Holdings, Inc. BMCH-US 1,299 19.50 10.0% 16.4% 90.7% 12.3% 6.8% 0.6x 9.9x NM 0.5x 7.5x
Boise Cascade Co. BCC-US 863 22.50 -11.4% -11.9% 75.1% 7.9% 4.8% 0.3x 7.4x 23.7x 0.3x 6.4x
Huttig Building Products, Inc. HBP-US 168 6.61 14.4% 73.9% 94.4% NM 4.6% 0.3x 9.1x 9.9x NM NM
BlueLinx Holdings, Inc. BXC-US 67 7.47 -15.9% 40.9% 77.0% NM 2.3% 0.2x 18.3x NM NM NM
Segment Average $4,192 8.0% 29.6% 90.0% 9.1% 7.6% 0.9x 12.4x 20.6x 1.0x 10.6x
Segment Median $2,029 10.2% 31.8% 93.9% 7.3% 7.1% 0.8x 11.8x 22.1x 0.8x 10.3x
Market Stats Operating Stats LTM Multiples NTM Multiples
Company Name SymbolMarket Cap
($ in Mil)Price ($)
Quarter
Change
YTD
Change
% of 52
Week High
Est.
Revenue
Growth
EBITDA
Margin
TEV/
Rev
TEV/
EBITDA
Price/
EPS
TEV/
NTM
Revenue
TEV/
NTM
EBITDA
W.W. Grainger, Inc. GWW-US 13,835$ 232.25$ 3.3% 14.6% 96.5% 3.5% 15.2% 1.6x 10.4x 20.8x 1.5x 10.8x
Arrow Electronics, Inc. ARW-US 6,387 71.30 11.5% 31.6% 97.5% 1.5% 4.5% 0.4x 8.1x 12.8x 0.4x 7.9x
Avnet, Inc. AVT-US 6,077 47.61 16.0% 11.1% 92.4% (23.2%) 4.4% 0.3x 8.3x 14.1x 0.4x 8.8x
Tech Data Corp. TECD-US 2,983 84.68 0.0% 27.6% 92.6% 1.0% 1.4% 0.1x 7.1x 14.1x 0.1x 6.8x
WESCO International, Inc. WCC-US 3,231 66.55 8.2% 52.4% 90.7% 1.2% 5.9% 0.6x 11.3x 31.0x 0.6x 11.3x
ScanSource, Inc. SCSC-US 1,015 40.35 10.5% 25.2% 92.8% 2.3% 3.1% 0.3x 9.9x 16.9x 0.3x 9.4x
Richardson Electronics Ltd. RELL-US 67 6.30 -7.1% 11.1% 87.0% 1.3% (5.3%) 0.1x NM NM 0.1x NM
Segment Average $4,799 6.1% 24.8% 92.8% (1.8%) 4.1% 0.5x 9.2x 18.3x 0.5x 9.1x
Segment Median $3,231 8.2% 25.2% 92.6% 1.3% 4.4% 0.3x 9.1x 15.5x 0.4x 9.1x
Market Stats Operating Stats LTM Multiples NTM Multiples
Company Name SymbolMarket Cap
($ in Mil)Price ($)
Quarter
Change
YTD
Change
% of 52
Week High
Est.
Revenue
Growth
EBITDA
Margin
TEV/
Rev
TEV/
EBITDA
Price/
EPS
TEV/
NTM
Revenue
TEV/
NTM
EBITDA
Sysco Corp. SYY-US 30,284$ 55.37$ 13.0% 35.0% 97.0% 8.6% 5.6% 0.7x 13.3x 30.6x 0.7x 11.9x
US Foods Holding Corp. USFD-US 6,062 27.48 16.4% NA 98.9% 2.0% 4.0% 0.4x 10.9x 43.3x 0.4x 9.6x
Performance Food Group Co. PFGC-US 2,481 24.00 -3.2% 3.7% 85.3% 6.1% 1.5% 0.2x 11.6x 35.3x 0.2x 9.6x
United Natural Foods, Inc. UNFI-US 2,414 47.72 19.2% 21.2% 91.5% 11.1% 3.3% 0.3x 9.9x 19.2x 0.3x 9.1x
Core-Mark Holding Co., Inc. CORE-US 1,988 43.07 20.3% 5.1% 86.1% 15.4% 0.9% 0.2x 17.3x 37.8x 0.1x 12.6x
SpartanNash Co. SPTN-US 1,482 39.54 36.7% 82.7% 98.9% (13.7%) 3.0% 0.3x 6.9x 19.6x 0.2x 7.8x
The Chefs' Warehouse, Inc. CHEF-US 415 15.80 41.8% -5.3% 76.0% 9.7% 4.5% 0.6x 12.4x 790.0x 0.6x 11.5x
Segment Average $6,447 20.6% 23.8% 90.5% 5.6% 3.2% 0.4x 11.7x 139.4x 0.4x 10.3x
Segment Median $2,414 19.2% 13.2% 91.5% 8.6% 3.3% 0.3x 11.6x 35.3x 0.3x 9.6x
Market Stats Operating Stats LTM Multiples NTM Multiples

Company Name SymbolMarket Cap
($ in Mil)Price ($)
Quarter
Change
YTD
Change
% of 52
Week High
Est.
Revenue
Growth
EBITDA
Margin
TEV/
Rev
TEV/
EBITDA
Price/
EPS
TEV/
NTM
Revenue
TEV/
NTM
EBITDA
Genuine Parts Co. GPC-US 14,210$ 95.54$ -4.9% 11.2% 90.2% 4.0% 8.5% 1.0x 11.9x 20.6x 0.9x 10.8x
W.W. Grainger, Inc. GWW-US 13,835 232.25 3.3% 14.6% 96.5% 3.5% 15.2% 1.6x 10.4x 20.8x 1.5x 10.8x
Fastenal Co. FAST-US 13,579 46.98 12.4% 15.1% 94.0% 5.3% 22.6% 3.5x 15.6x 27.3x 3.3x 15.0x
HD Supply Holdings, Inc. HDS-US 8,556 42.51 32.9% 41.6% 96.2% 4.3% 12.9% 1.7x 13.9x 8.4x 1.6x 12.6x
MSC Industrial Direct Co., Inc. MSM-US 4,137 92.39 25.9% 64.2% 97.2% NM NM 2.0x 12.9x NM 2.2x 13.5x
WESCO International, Inc. WCC-US 3,231 66.55 8.2% 52.4% 90.7% 1.2% 5.9% 0.6x 11.3x 31.0x 0.6x 11.3x
NOW, Inc. DNOW-US 2,200 20.47 -4.5% 29.4% 87.0% 15.9% (7.5%) 1.0x NM NM 0.9x NM
MRC Global, Inc. MRC-US 1,931 20.26 23.3% 57.1% 90.0% 2.5% (1.9%) 0.8x 42.3x NM 0.8x 18.9x
Lawson Products, Inc. LAWS-US 209 23.80 34.2% 1.9% 92.2% 3.9% 6.2% 0.8x 21.7x NM 0.7x 12.3x
Segment Average $6,877 14.5% 31.9% 92.6% 5.1% 7.7% 1.4x 17.5x 21.6x 1.4x 13.1x
Segment Median $4,137 12.4% 29.4% 92.2% 4.0% 7.3% 1.0x 13.4x 20.8x 0.9x 12.5x
Market Stats Operating Stats LTM Multiples NTM Multiples
Company Name SymbolMarket Cap
($ in Mil)Price ($)
Quarter
Change
YTD
Change
% of 52
Week High
Est.
Revenue
Growth
EBITDA
Margin
TEV/
Rev
TEV/
EBITDA
Price/
EPS
TEV/
NTM
Revenue
TEV/
NTM
EBITDA
McKesson Corp. MCK-US 31,754$ 140.45$ -15.8% -28.8% 70.0% 2.7% 2.2% 0.2x 7.8x 15.9x 0.2x 7.7x
Cardinal Health, Inc. CAH-US 23,035 71.97 -7.4% -19.4% 79.5% 7.8% 2.3% 0.2x 8.6x 17.4x 0.2x 7.6x
AmerisourceBergen Corp. ABC-US 17,210 78.19 -3.2% -24.6% 74.4% 10.1% 1.6% 0.1x 9.4x 12.4x 0.1x 8.4x
Henry Schein, Inc. HSIC-US 12,211 151.71 -6.9% -4.1% 82.9% 7.2% 8.7% 1.2x 14.3x 25.2x 1.2x 13.1x
Patterson Cos., Inc. PDCO-US 4,017 41.03 -10.7% -9.2% 81.4% 2.1% 7.2% 0.9x 10.1x 19.1x 0.9x 11.4x
Owens & Minor, Inc. OMI-US 2,171 35.29 1.6% -1.9% 85.1% (2.2%) 2.7% 0.3x 9.3x 19.3x 0.3x 9.2x
Aceto Corp. ACET-US 660 21.97 15.7% -18.6% 79.0% 14.9% 10.7% 1.3x 10.7x 21.8x 1.1x 8.9x
Segment Average $13,008 (3.8%) (15.2%) 78.9% 6.1% 5.1% 0.6x 10.0x 18.7x 0.6x 9.5x
Segment Median $12,211 (6.9%) (18.6%) 79.5% 7.2% 2.7% 0.3x 9.4x 19.1x 0.3x 8.9x
Market Stats Operating Stats LTM Multiples NTM Multiples
Company Name SymbolMarket Cap
($ in Mil)Price ($)
Quarter
Change
YTD
Change
% of 52
Week High
Est.
Revenue
Growth
EBITDA
Margin
TEV/
Rev
TEV/
EBITDA
Price/
EPS
TEV/
NTM
Revenue
TEV/
NTM
EBITDA
Genuine Parts Co. GPC-US 14,210 95.54 -4.9% 11.2% 90.2% 4.0% 8.5% 1.0x 11.9x 20.6x 0.9x 10.8x
Arrow Electronics, Inc. ARW-US 6,387 71.30 11.5% 31.6% 97.5% 1.5% 4.5% 0.4x 8.1x 12.8x 0.4x 7.9x
Avnet, Inc. AVT-US 6,077 47.61 16.0% 11.1% 92.4% (23.2%) 4.4% 0.3x 8.3x 14.1x 0.4x 8.8x
Anixter International, Inc. AXE-US 2,679 81.05 25.7% 34.2% 96.4% 3.5% 5.3% 0.5x 10.6x 28.7x 0.5x 9.9x
Houston Wire & Cable Co. HWCC-US 106 6.50 5.0% 23.1% 84.3% 13.3% (1.6%) 0.5x 85.3x NM 0.5x 26.2x
Segment Average $5,892 10.6% 22.3% 92.2% (0.2%) 4.2% 0.5x 24.9x 19.1x 0.5x 12.7x
Segment Median $6,077 11.5% 23.1% 92.4% 3.5% 4.5% 0.5x 10.6x 17.4x 0.5x 9.9x
Market Stats Operating Stats LTM Multiples NTM Multiples