Special Report: FAO/WFP Crop and Food Security … · s p e c i a l r e p o r t fao/wfp crop and...
68
World Food Programme S P E C I A L R E P O R T FAO/WFP CROP AND FOOD SECURITY ASSESSMENT MISSION TO SOUTH SUDAN 26 May 2017
Transcript of Special Report: FAO/WFP Crop and Food Security … · s p e c i a l r e p o r t fao/wfp crop and...
World Food Programme
S P E C I A L R E P O R T
FAO/WFP CROP AND FOOD SECURITY ASSESSMENT MISSION TO SOUTH SUDAN
26 May 2017

Disclaimer This report has been prepared by Mario Zappacosta and William Ian Robinson (FAO) and Rogério Bonifácio (WFP) under the responsibility of the FAO and WFP Secretariats with information from official and other sources. Furthermore, the designations employed and the presentation of material in this information product do not imply the expression of any opinion whatsoever on the part of the organizations of the United Nations concerning the legal or development status of any country, territory, city or area or of its authorities, or concerning the delimitation of its frontiers or boundaries. Since conditions may change rapidly, please contact the undersigned for further information if required. Mario Zappacosta Valerie Guarnieri Senior Economist, EST-GIEWS Regional Director Trade and Markets Division, FAO East and Central Africa (RBN) E-mail: [email protected] E-mail: [email protected] FAO information products are available on the FAO website (www.fao.org/publications) and can be purchased through [email protected] . Please note that this Special Report is also available on the Internet as part of the FAO World Wide Web www.fao.org at the following URL address: http://www.fao.org/giews/ and http://www.wfp.org/food-security/reports/CFSAM The Special Alerts/Reports can also be received automatically by E-mail as soon as they are published, by subscribing to the GIEWS/Alerts report ListServ. To do so, please send an E-mail to the FAO-Mail-Server at the following address: [email protected], leaving the subject blank, with the following message:
subscribe GIEWSAlertsWorld-L To be deleted from the list, send the message:
unsubscribe GIEWSAlertsWorld-L Please note that it is possible to subscribe to regional lists to only receive Special Reports/Alerts by region: Africa, Asia, Europe or Latin America (GIEWSAlertsAfrica-L, GIEWSAlertsAsia-L, GIEWSAlertsEurope-L and GIEWSAlertsLA-L). These lists can be subscribed to in the same way as the worldwide list.
S P E C I A L R E P O R T
FAO/WFP CROP AND FOOD SECURITY ASSESSMENT MISSION TO SOUTH SUDAN
26 May 2017
FOOD AND AGRICULTURE ORGANIZATION OF THE UNITED NATIONS WORLD FOOD PROGRAMME
Rome, 2017

The designations employed and the presentation of material in this information product do not imply the expression of any opinion whatsoever on the part of the Food and Agriculture Organization of the United Nations (FAO) concerning the legal or development status of any country, territory, city or area or of its authorities, or concerning the delimitation of its frontiers or boundaries. The mention of specific companies or products of manufacturers, whether or not these have been patented, does not imply that these have been endorsed or recommended by FAO in preference to others of a similar nature that are not mentioned. The views expressed in this information product are those of the author(s) and do not necessarily reflect the views or policies of FAO. ISBN 978-92-5-109713-7 © FAO, 2017 FAO encourages the use, reproduction and dissemination of material in this information product. Except where otherwise indicated, material may be copied, downloaded and printed for private study, research and teaching purposes, or for use in non-commercial products or services, provided that appropriate acknowledgement of FAO as the source and copyright holder is given and that FAO’s endorsement of users’ views, products or services is not implied in any way. All requests for translation and adaptation rights, and for resale and other commercial use rights should be made via www.fao.org/contact-us/licence-request or addressed to [email protected]. FAO information products are available on the FAO website (www.fao.org/publications) and can be purchased through [email protected]. Cover page photographs by: L. Visser.

- 5 -
TABLE OF CONTENTS
Page
Acronyms and abbreviations .....................................................................................................................6 Mission Highlights .......................................................................................................................................7 1. OVERVIEW .......................................................................................................................................7 2. SOCIO-ECONOMIC CONTEXT .......................................................................................................9 2.1 Population ........................................................................................................................................9 2.2 Economy ..................................................................................................................................... 10 2.2.1 Economic growth and national budget ......................................................................... 10 2.2.2 Exchange rate .............................................................................................................. 11 2.2.3 Inflation ........................................................................................................................ 12 2.3 Agriculture ..................................................................................................................................... 13 3. CEREAL PRODUCTION IN 2016 ................................................................................................. 14 3.1 Cereal harvested area and yield estimates ................................................................................... 14 3.2 Factors affecting yields .................................................................................................................. 18 3.2.1 Rainfall ......................................................................................................................... 18 3.2.2 Inputs in the traditional smallholder sector .................................................................. 21 3.2.3 Pests, diseases and weeds ......................................................................................... 22 3.3 Agricultural production in 2016 ...................................................................................................... 22 3.3.1 Cereal production ......................................................................................................... 22 3.3.2 Other crops .................................................................................................................. 28 3.3.3 Livestock ...................................................................................................................... 29 4. CEREAL SUPPLY/DEMAND SITUATION ................................................................................... 31 4.1 Cereal balance ............................................................................................................................... 31 4.2 Cereal and livestock markets ......................................................................................................... 31 5. HOUSEHOLD FOOD SECURITY SITUATION ............................................................................. 35 5.1 Methodology .................................................................................................................................. 35 5.2 Main drivers of food insecurity in 2017 .......................................................................................... 36 5.3 Current and projected IPC food security outcomes for 2017…………… ...................................... 36 5.4 Evolution of the food security situation using the CARI approach ................................................. 37 5.5 Household staple food supply: markets vs household production ................................................ 39 5.6 Food expenditure: recent patterns and at-harvest situation .......................................................... 41 5.7 Household coping strategies ......................................................................................................... 42 5.8 Estimated food assistance requirements in 2017 .......................................................................... 43 6. RECOMMENDATIONS FOR 2017 ................................................................................................ 43 Annex 1: Indicative seasonal cropping calendar ........................................................................................ 46 Annex 2: Crop assessment strategy for sustainable crop monitoring and yield estimations ..................... 47 Annex 3: Situation by area during the Task Force (October-December) harvest-time missions ............... 48

- 6 -
Acronyms and abbreviations
AFIS Agriculture and Food Information System BCS Body Condition Score BOSS Bank of South Sudan CARI Consolidated Approach for Reporting of food security Indicators BQ Black Quarter CBPP Contagious Bovine Pleuropneumonia CBT Cash-Based Transfer CCPP Contagious Caprine Pleuropneumonia CCMC County Crop Monitoring Committee CFSAM Crop and Food Security Assessment Mission DAP Di-ammonium Phosphate DLCO Desert Locust Control Organization ECF East Coast Fever EU European Union FAO Food and Agriculture Organization FFA Food for Assets FMD Foot and Mouth Disease FSNMS Food Security and Nutrition Monitoring System FSMS Food Security Monitoring System FSTS Food Security Technical Secretariat GDP Gross Domestic Product GFD General Food Distribution GRSS Government of the Republic of South Sudan ha hectare (0.42 hectares = 1 feddan) hh Household IDPs Internally Displaced Persons IFDC International Fertilizer Development Company IGAD Intergovernmental Authority on Development IPC Integrated Food Security Phase Classification LPI Logistics Performance Index MAF Ministry of Agriculture and Food Security mm Millimetres MOAF Ministry of Agriculture and Forestry NARO National Agricultural Research Organization NBHS National Baseline Household Survey NBS National Bureau of Statistics ND Newcastle Disease NDVI Normalized Difference Vegetation Index NGO Non-Governmental Organization OCHA Office for the Coordination of Humanitarian Affairs P4P Purchase for Progress PET Pictorial Evaluation Tool (Crop yield & livestock condition photo-indicators) PoC Protection of Civilians RFE Rainfall Estimate RRC Relief and Rehabilitation Commission SDG Sudanese Pound SMoA State Ministry of Agriculture SSP South Sudanese Pound t Tonne UN United Nations UNHCR Office of the United Nations High Commissioner for Refugees UNICEF United Nations International Children's Emergency Fund USD United States Dollar VAM Vulnerability Assessment and Monitoring WFP World Food Programme
- 7 -
Mission Highlights
Throughout 2016, rains have been generally favourable, with timely onset and good distribution. Dry spells were reported in southern Jonglei and Eastern Equatoria from August 2016 onwards.
The 2016 net cereal production (after deduction of post-harvest losses and seed use) in the traditional sector is estimated at about 826 000 tonnes, the smallest amount harvested since the start of the conflict. Both harvested area and yields have declined following the increase in intensity and scale of the conflict which had disrupted farming activities, particularly during the second season. Major reductions in cereal production are estimated in Greater Equatoria Region and in Western Bahr el Ghazal State.
Livestock conditions were generally good due to adequate pasture and water availability. As during the previous two years, widespread events of cattle raiding and altered marketing/migration routes occurred in all areas of major conflict/insecurity.
With a projected population of about 12 million in mid-2017, the overall cereal deficit in the January-December 2017 marketing year is estimated at about 500 000 tonnes, over 30 percent above the deficit estimated for 2016.
Hyperinflation and limited import capacity due to insecurity and shortage of foreign currency have severely impacted market functioning and the availability of food commodities. Cereal prices increased up to ten times in 2016 following the sharp devaluation of the local currency and the increasing transport costs. The number of traders and the level of their food stocks have declined sharply during the second semester of 2016, with strong reduction in food availability and variety.
The number of IDPs in the country stood at about 1.9 million in February 2017. The number of refugees in neighbouring countries was close to 1.8 million in February 2017 of which over 1 million new arrivals were recorded in the twelve months to March 2017.
Food insecurity has reached new records during 2016 (67 percent of the population at harvest time, with over 14 percent severely food insecure), twice the pre-conflict levels and a marked worsening from the same time last year, when food insecurity stood at 49 percent (12 percent severely food insecure). Only one-quarter (26 percent) of the households were found to have acceptable food consumption. The coming lean period of mid-2017 will likely see food insecurity levels rise further.
In January 2017, 32 percent of the population of South Sudan (about 3.8 million) was classified in the IPC (Integrated Phase Classification) Phases 3 (Crisis), 4 (Emergency) and 5 (Catastrophe). In July, at the peak of the 2017 lean period, this proportion is likely to rise to 47 percent (5.5 million people). The most serious situations are in Unity State, where the population in some counties is facing famine or risk of famine, and Northern Bahr el Ghazal.
In 2017, WFP plans to assist approximately 4 million people with just under 300 000 tonnes of mixed food commodities and cash transfers. This includes emergency food assistance for 3 million people mostly affected by acute food insecurity and a further 1 million people through resilience-building development-oriented activities (school meals, nutrition, cash and food assistance for assets, P4P). Restrictions in humanitarian access due to on-going insecurity and inadequate funding will impose constraints in reaching populations in urgent need of assistance.
Under the 2017 emergency response, FAO plans to distribute vegetable/fishing kits and crop seeds (including through seed fairs) to approximately 900 000 vulnerable households. Moreover, the livestock vaccination and treatment campaign is targeting approximately 5 million heads.
1. OVERVIEW An FAO/WFP Crop and Food Security Assessment Mission (CFSAM) visited South Sudan from 30 November to 12 December 2016 to estimate cereal production during 2016 and assess the overall food security situation. The CFSAM reviewed the findings of several crop assessment missions conducted at planting and harvest time in the different agro-ecological zones of the country from May to December 2016. As during 2014 and 2015, all assessment missions were carried out by a Task Force team that comprised staff from the Ministry of Agriculture and Food Security (MAF), the National Bureau of Statistics (NBS) and FAO. Task Force team members have been trained during the last years to conduct rapid assessments using established protocols and techniques, such as driving and walking transects, scoring standing crops according to yield and livestock according to body condition, perform key informant interviews and farmer case studies. In addition, supported by the FAO AFIS Project, over 20 County Crop Monitoring Committees (CCMCs) have been formed in 2016, with a view to extending the responsibility of collecting more objective data at local level.
- 8 -
Building on the successful experience of the new assessment format introduced in 2014 and 2015, the 2016 annual crop assessment in South Sudan was also planned to follow a year-long roadmap, with a series of assessments at State level from planting to harvest to be conducted by Task Force teams. Unfortunately, severe insecurity conditions prevailing since July 2016 have precluded the full execution of the plan, with a significant reduction of fieldwork activities. Overall, three first-season early harvest missions were conducted in Western, Central and Eastern Equatoria in June, followed by nine short harvesting missions between September and November in accessible locations of Northern Bahr el Ghazal, Lakes, Warrap, Abyei Administrative Area, Eastern Equatoria, Upper Nile, Jonglei and Western Bahr el Ghazal. In the whole of Unity State, Central and Western Equatoria, access has been precluded at harvesting time for second season crops. In all visited areas, concerns over security precluded to conduct driving transects and the assessment was mainly done through walking transects to assess yields. In addition, 550 farmer case studies and 36 interviews with key informants were conducted over the two periods of activity. Using standard CFSAM procedures with regard to secondary sources of information, the Task Force team reviewed and commented on factors affecting crop performance during the 2016 production year, estimated national cereal production during the year and assessed the overall food security situation. Where risks to team safety through local breakdowns of law and order were considered to be too severe to allow any access at crucial times, “remote” assessments, based on telephone interviews with key informants, were used to derive estimates. Regarding the traditional farming sector, the aggregate cereal harvested area in 2016 is estimated at 940 000 hectares, about 7.4 percent below the previous year’s level. The favourable start of the rainy season (except in the southeast) and the high prices prevailing in most markets, encouraged the expansion of planted area during the first season. However, the situation changed dramatically since July when security conditions rapidly deteriorated causing widespread displacements of farmers. The estimated harvested area has declined significantly, between 15 and 40 percent, in Greater Equatoria Region and Western Bahr el Ghazal State due to a reduction in the number of farming households as well as the average area planted per household. The highest contraction in the harvested area is reported in the most productive zones of the Greenbelt. By contrast, the area harvested has increased between 5 and 20 percent in the rest of the country, particularly in Warrap and Lakes states, as farming has expanded in secure areas around homesteads. As rainfall in 2016 has been mostly favourable in terms of amounts and distribution (except in some areas of Eastern Equatoria and Jonglei) and crop losses due to pests and diseases have been minimal, the increase in intensity and scale of the conflict has been the most significant driver in reducing yields through the disruption of farming activities, particularly during the second season. Net cereal production in 2016 from the traditional sector, after deduction of post-harvest losses and seed use, is estimated at about 826 000 tonnes, the smallest output since the start of the conflict, over 10 and 18 percent below the output obtained in 2015 and 2014, respectively. The decrease in 2016 estimated national production is essentially due to the impact on the area planted and yields, especially of second season crops, in Greater Equatoria and in Western Bahr el Ghazal states. A dramatic reduction in production is estimated in Central Equatoria, with about 45 percent below previous year level. By contrast, production is estimated to increase in Warrap and Lakes by 16 and 25 percent, respectively. Moderate increases, between 4 and 12 percent, are also estimated in all states of Greater Upper Nile Region, although it still remains well below the pre-conflict levels of production. With a mid-2017 projected population of about 12 million people, consuming on average about 110 kg of cereals/capita/year, the cereal requirement in 2017 is estimated at about 1.324 million tonnes. Accordingly, an overall rounded cereal deficit of 500 000 tonnes is estimated in the traditional sector for the 2017 January-December marketing year. Net cereal production from the mechanized sector in Upper Nile State plus the Tonychol sorghum scheme in Northern Bahr el Ghazal State is estimated at 44 100 tonnes. Although part of this production is expected to be traded across the border in the Sudan, some quantities are likely to be marketed internally, offering also options for local purchases by the GRSS and humanitarian agencies. The country is facing a dramatic macro-economic crisis. The spiralling effects of hyperinflation, shortage of foreign currency and depreciation of the South Sudanese Pound, compounded by low availability and high prices of fuel, severely impacted market functioning and the availability of food commodities. After July 2016, the number of food traders (either wholesalers or importers) has diminished by over 50 percent and the quantities/varieties of food were very low in most markets. At the end of 2016, prices of sorghum and maize were at exceptionally high levels, up to ten times higher than 12 months earlier, severely constraining access to food for market-dependent households, especially in urban areas.

- 9 -
In January 2017, 32.3 percent of the population of South Sudan (about 3.8 million people) was classified in the IPC Phases 3 (Crisis), 4 (Emergency) and 5 (Catastrophe). In the lean period of mid-2017, this proportion is likely to rise to 46.7 percent (5.5 million people). The most serious situations are in Unity State (where the population in some counties is facing famine or risk of famine) and Northern Bahr el Ghazal – over 50 percent of the population is in IPC Phases 3 to 5. The situation is expected to worsen during the lean period of 2017 (up to July). The main driver behind this situation is the conflict situation that has affected the country since 2013. In 2016, this has become more widespread and has now reached the highly productive areas of the Greenbelt, leading to a noticeable impact on national crop production. Conflict-related disruption of trade routes and commodity flows has severely affected the supply of staple foods to less productive, more isolated areas. Coupled to a major macro-economic crisis and very high inflation, this resulted in sharp increases in food insecurity across the country, even in the areas not directly affected by the hostilities. Food insecurity has reached new records during 2016 (67 percent of the population at harvest time, with over 14 percent severely food insecure), twice the pre-conflict levels and a marked worsening from the same time last year when food insecurity stood at 49 percent (12 percent severely food insecure). Only one-quarter (26 percent) of the households were found to have acceptable food consumption. The coming lean period of mid-2017 is likely to see food insecurity levels rise further. Households remain extremely dependent on markets, particularly in Northern Bahr el Ghazal, Western Bahr el Ghazal, Lakes, Warrap and Eastern Equatoria where they are the main suppliers of staples for 70 to 80 percent of the households during the lean period. Therefore, the rural households in these regions are highly vulnerable to price shocks such as those occurring in 2016. Food assistance contribution has been most significant in the three conflict states and has most importance in Jonglei and Unity states, where it compensated for shortfalls in market supply. Market dependence and price shocks led to a rise in the proportion of households with high food expenditure – latest values in December 2016 (41 percent of households) were the highest for the post-harvest period, since records began. The more extreme values of high food expenditure are in Northern Bahr el Ghazal and neighbouring regions, precisely those more affected by the disruption of trade networks by insecurity. This is behind the high levels of food insecurity in these regions. In 2017, WFP plans to assist approximately 4 million people with just under 300 000 tonnes of mixed food commodities. This includes emergency food assistance for 3 million people most affected by acute food insecurity and a further 1 million people through resilience-building development-oriented activities (school meals, cash and food assistance for assets, P4P). Under the 2017 emergency response, FAO plans to distribute vegetable/fishing kits and crop seeds (including through seed fairs) to approximately 900 000 vulnerable households. Moreover, the livestock vaccination and treatment campaign is targeting approximately 5 million heads. 2. SOCIO-ECONOMIC CONTEXT 2.1 Population Since the conflict started in mid-December 2013, population size and geographical distribution have significantly changed. According to OCHA and UNHCR, by end-December 2016, over 3 million people were forced to flee their homes due to insecurity, including about 1.85 million IDPs (with about 195 000 people in UNMISS Protection of Civilians (PoC) sites across the country) and 1.2 million people that fled into neighbouring countries (Uganda, the Sudan, the Democratic Republic of the Congo, Ethiopia and Kenya). The highest concentration of IDPs is still in conflict-affected areas of the Greater Upper Nile Region, with about two-thirds of the total population (roughly 1.2 million). However, displacements have increased significantly in 2016 in the rest of the country following the spread of the conflict in new areas. At the end of December 2016, there were over 268 000 IDPs in Central Equatoria and more than 100 000 IDPs in every state of Eastern Equatoria, Western Equatoria and Western Bahr el Ghazal. The country’s largest PoC site is in Bentiu (Unity State), hosting about 120 000 people, followed by the PoC sites in Juba and Malakal with about 39 000 and 33 000 people, respectively. Close to 1.8 million people are living in neighbouring countries as refugees and asylum seekers. The first significant part of the exodus took place during the first semester of 2014, with over 420 000 people leaving

- 10 -
the country. Then, the flow slowed down between July 2014 and July 2016, with an average of about 12 000 people fleeing per month. After the resumption of the conflict in July 2016 until the end of the year, about 500 000 people left the country and moved mainly to Uganda, Ethiopia and the Sudan. In 2014 and 2015, most South Sudanese refugees were from the Greater Upper Nile Region, while in 2016 their origins included also the Greater Equatoria Region as well as Western and Northern Bahr el Ghazal states. At the same time, the country hosts about 242 000 refugees from South Kordofan and Blue Nile states in the Sudan and about 15 000 refugees from the Democratic Republic of the Congo. According to NBS data, revised by OCHA to take into consideration movements of people within the country, the country’s population for mid-2016 was estimated at 11.61 million. This figure, including the breakdown at county and state levels, has also been used for the 2016 IPC analysis. Given the implicit annual increment of 3 percent, as suggested by the NBS, the population for mid-2017 has been estimated by the Mission at 11.96 million. 2.2 Economy 2.2.1 Economic growth and national budget Since independence in 2011, South Sudan’s economic growth has been extremely volatile amidst disruptions in oil production, adverse weather conditions and internal conflict. After two years of moderate growth in 2013 and 1014, the country’s real Gross Domestic Product (GDP) contracted by 5 percent in 2015 and by 13 percent in 2016 as a consequence of the severe impact of the protracted conflict on the overall economy, particularly on export revenues from the oil sector as well as Government consumption and fixed investments. The gap between Government expenditures and revenues has been mostly bridged by domestic borrowing from the Bank of South Sudan which depleted foreign exchange reserves and induced to print money with consequent increase in money supply and inflation. In addition, the lack of US dollars hampered the ability of the Bank of South Sudan to protect the local currency, leading to its accelerated devaluation in the parallel market. Since the start of the conflict in 2014, oil production has averaged about 140 000/160 000 barrels/day, compared to the country’s output of 240 000 barrels/day in 2013 and 330 000 barrels/day before the January 2012 shut-down. The impact of low oil production is compounded by the decline in international crude oil prices, which dropped by more than 70 percent between mid-2014 and early 2016, from USD 112/barrel in June 2014 to a record low level of USD 26/barrel in January 2016 and then partially resumed at about USD 50-55/barrel at the end of 2016 (see Figure 1).
Figure 1: South Sudan - Europe Brent Spot Price (f.o.b.)
Source: U.S. Energy Information Administration.
The decline in international crude oil prices has severely affected the South Sudanese economy by reducing the export revenue. In addition, transit and pipeline fees as well as direct financial transfers to be paid to the Sudan have been increasingly onerous as they are calculated on a volume basis, without considering fluctuations of international prices. In fact, under the agreement signed in September 2012 with the Sudan, oil transit fees for the use of the pipeline to Port Sudan were negotiated at about USD 24/barrel. Consequently, noting also that South Sudan oil is sold at a discount of about USD 10/barrel given its low quality, profits due
0
20
40
60
80
100
120
140
Jul 20
11
Nov 2
011
Ma
r 2
01
2
Jul 20
12
No
v 2
012
Ma
r 2
01
3
Jul 20
13
Nov 2
013
Ma
r 2
01
4
Jul 20
14
Nov 2
014
Ma
r 2
01
5
Jul 20
15
Nov 2
015
Ma
r 2
01
6
Jul 20
16
Nov 2
016
US
D p
er
ba
rre
l

- 11 -
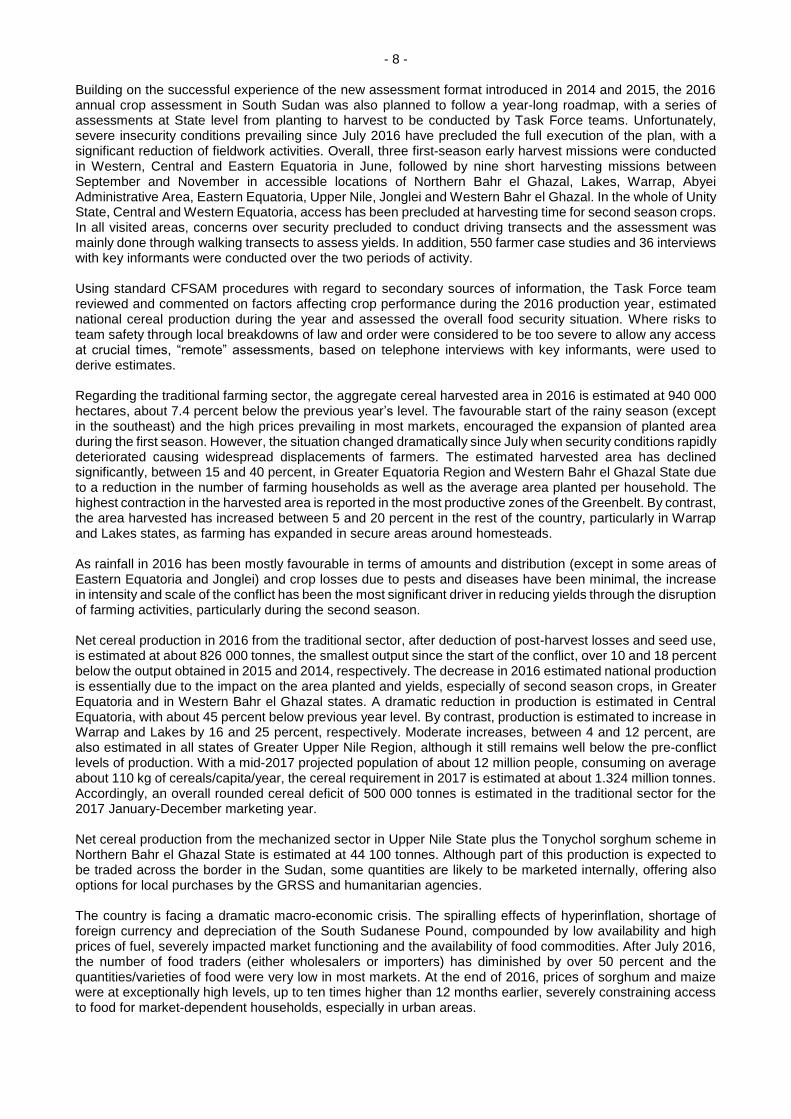
to oil extraction were minimal throughout 2016. However, in December 2016, a new agreement has been signed between the two countries and South Sudan agreed to pay USD 15/barrel when oil sale prices are USD 50/barrel and above, while lower fees will be applied below this threshold. According to the GOSS, oil production in the former Unity State is expected to resume in 2017 after oilfields were shut down at the beginning of 2014. If this occurs, oil production may increase by about 80 000 barrels/day, bringing some relief to fiscal and external balances. The 2016/17 draft budget, presented to the Transitional National Legislature in October 2016, forecast total revenues at SSP 18.5 billion, compared to SSP 7 billion in 2015/16. In real terms, 2016/17 resources are considerably lower than last year as the increase in nominal terms is due to the impact of the high exchange rate on oil revenues and the high inflation rate on other non-oil revenues. The 2016/17 total spending from Government resources, including about SSP 5.7 billion externally-funded spending, is estimated at SSP 38.1 billion. Although in nominal terms, this value is more than double compared to 2015/16 fiscal year outturns of SSP 15.5 billion, the real value of expenditure has fallen by over half due to inflation. Recognizing the current macro-economic crisis affecting the country, expenditure allocation by chapters intends to allow the Government functioning and guaranteeing the most essential services, such as security and education. As a consequence, budget expenditure for salaries of Government employees and State transfers (which includes salaries for teachers, health workers and agricultural extension officers at State level) is set at about 60 percent of total domestically-financed budget, leaving low amounts available for operating and capital spending. About SSP 5 billion have been allocated for the implementation and consolidation of peace, including reparation of damaged infrastructures and costs related to return to their homes of displaced population. Regarding budget allocations by sectors, it has not changed markedly from budgets in previous years. Security, Rule of Law and Public Administration still are the largest sectors of expenditure, together accounting for about 60 percent of Government expenditure. Funds for natural resources and rural development represent only about 2.2 percent of the total budget and are set at about SSP 750 million, with about half of the resources needed to pay the salaries of wildlife forces at national and State levels. As 2016/17 estimated expenditures exceed revenues by about SSP 15 billion, new borrowings will be needed to cover the deficit and they will further increase country’s total indebtedness position that was provisionally estimated (without including Government arrears as no accurate estimate currently exists) at SSP 35.3 billion as of 30 June 2016. 2.2.2 Exchange rate The South Sudanese Pound (SSP) was introduced following independence in July 2011 and it was initially intended to have parity with the Sudanese Pound (SDG). Until mid-December 2015, the Bank of South Sudan (BOSS) maintained an official fixed exchange rate of SSP 2.95/USD, providing limited amounts of dollars for sale by approved banks and exchange bureaus at SSP 3.16/USD. Rationing of foreign currencies since early 2012 (due to the oil production shutdown decided after the disagreement with the Sudan about transit fees) led to the development of a parallel market where the exchange rate was granted a premium. The parallel exchange rate has been quite stable moving within a band between SSP 3.9 and 5.1/USD up to the end of 2014, when the shortage of foreign exchange (due to shrinking oil revenues caused by reduced domestic oil production in conflict-affected areas as well as record low international oil prices) started to severely limit the ability of the BOSS to defend the value of the local currency. This situation led to a steady devaluation of the SSP in the parallel market as reported in Figure 2 that shows midpoints between buying and selling parallel exchange rates in the capital city, Juba, since the start of the conflict at the end of 2013. It is worth to note, after tripling during 2015, the average exchange rate increased in 2016 by five times, from about SSP 20/USD in early January to SSP 100 at the end of December. On 14 December 2015, with the aim to narrow the difference between official and parallel exchange rates, the BOSS decided to abandon the fixed rate, letting the rate to freely float. As a consequence of the new regime, the official exchange rate at the end of 2015 went up to SSP 18-19/USD, compared to about SSP 20-22/USD in the parallel market. As an accompanying measure, the BOSS has introduced periodical auctioning of foreign exchange since end-2015 with the aim to provide some liquidity in the monetary system and contain the fall of the local currency. The effect of auctions has been rather modest as the rate in the parallel market has constantly increased and maintained an average difference of about 20 percent on the commercial official rate. In addition, auctions have substantially eroded the already meagre official foreign reserves. As a result, during the last two years, the gap between official and parallel rates persisted, with an average difference of about
- 12 -
20 percent. The gap peaked up to 50 percent during the second half of July 2016 as a consequence of deeply worsening security conditions and increasing uncertainty in the country.
Figure 2: South Sudan (Juba) - Market exchange rates in commercial and parallel markets
Source: High Frequency Survey in South Sudan by the National Bureau of Statistics and the World Bank.
http://dataviz.worldbank.org/views/MarketSurveys/Dashboard
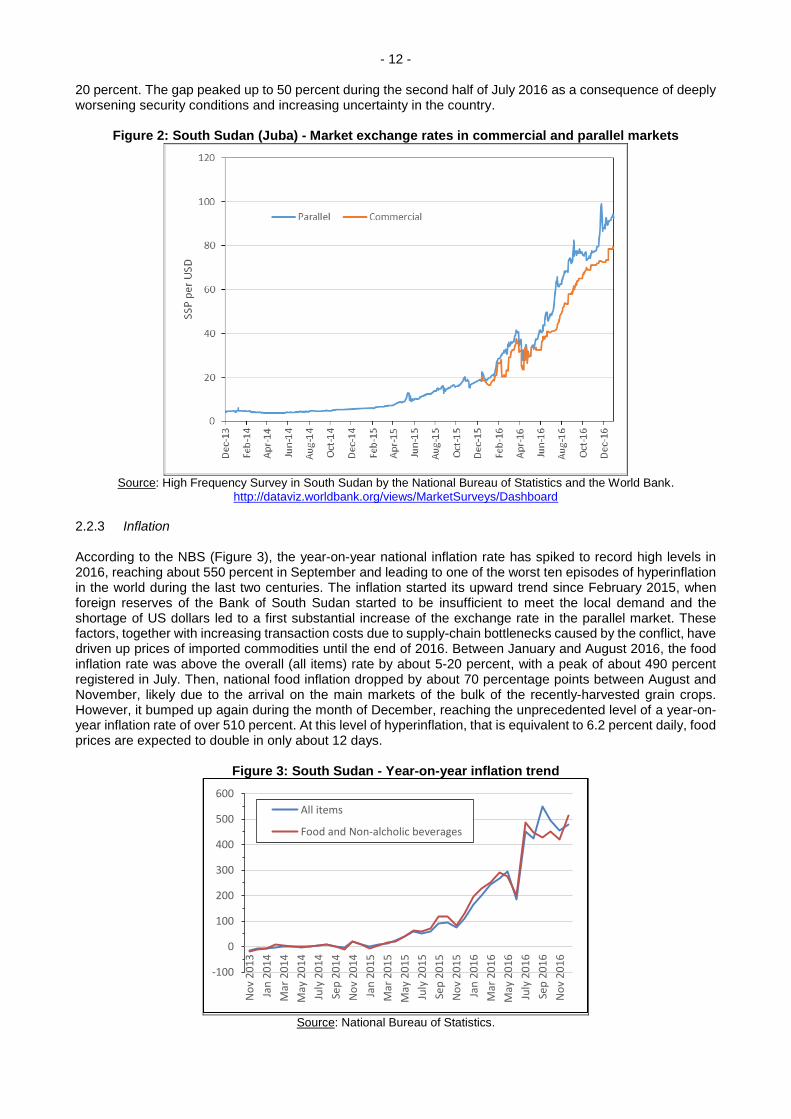
2.2.3 Inflation According to the NBS (Figure 3), the year-on-year national inflation rate has spiked to record high levels in 2016, reaching about 550 percent in September and leading to one of the worst ten episodes of hyperinflation in the world during the last two centuries. The inflation started its upward trend since February 2015, when foreign reserves of the Bank of South Sudan started to be insufficient to meet the local demand and the shortage of US dollars led to a first substantial increase of the exchange rate in the parallel market. These factors, together with increasing transaction costs due to supply-chain bottlenecks caused by the conflict, have driven up prices of imported commodities until the end of 2016. Between January and August 2016, the food inflation rate was above the overall (all items) rate by about 5-20 percent, with a peak of about 490 percent registered in July. Then, national food inflation dropped by about 70 percentage points between August and November, likely due to the arrival on the main markets of the bulk of the recently-harvested grain crops. However, it bumped up again during the month of December, reaching the unprecedented level of a year-on-year inflation rate of over 510 percent. At this level of hyperinflation, that is equivalent to 6.2 percent daily, food prices are expected to double in only about 12 days.
Figure 3: South Sudan - Year-on-year inflation trend
Source: National Bureau of Statistics.
-100
0
100
200
300
400
500
600
No
v 2
01
3
Jan
20
14
Mar
20
14
May
20
14
July
20
14
Sep
20
14
No
v 2
01
4
Jan
20
15
Mar
20
15
May
20
15
July
20
15
Sep
20
15
No
v 2
01
5
Jan
20
16
Mar
20
16
May
20
16
July
20
16
Sep
20
16
No
v 2
01
6
All items
Food and Non-alcholic beverages
- 13 -
2.3 Agriculture
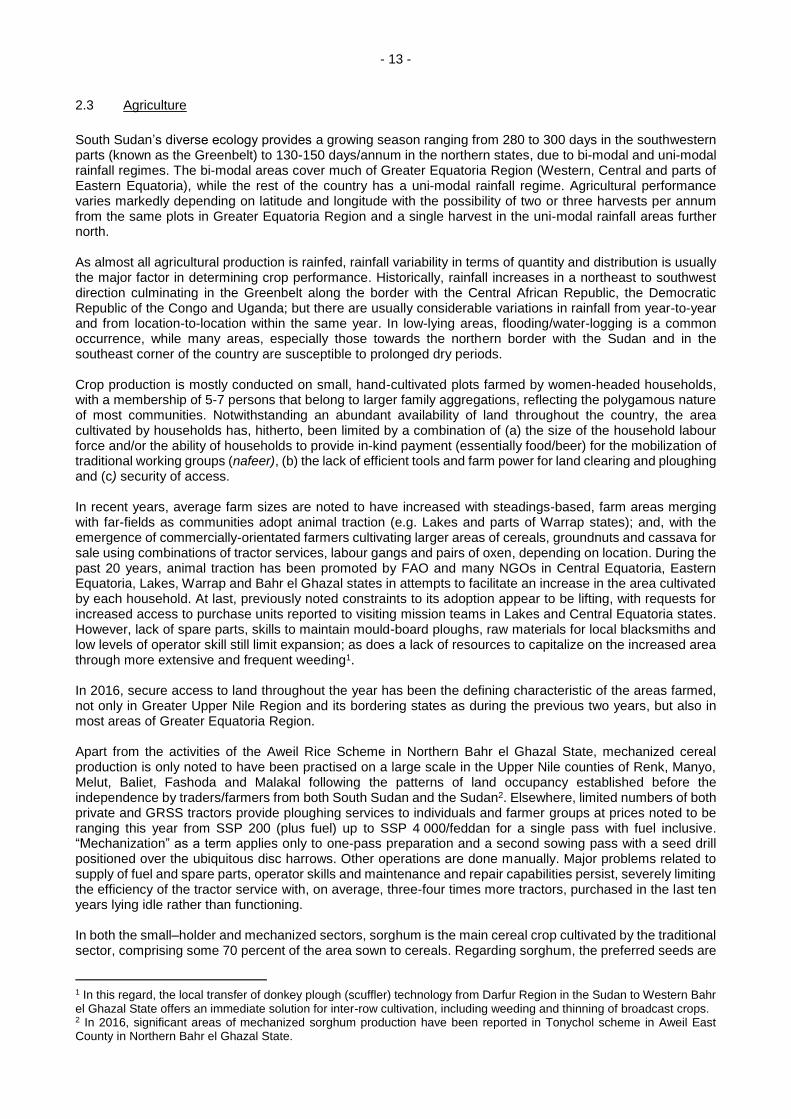
South Sudan’s diverse ecology provides a growing season ranging from 280 to 300 days in the southwestern parts (known as the Greenbelt) to 130-150 days/annum in the northern states, due to bi-modal and uni-modal rainfall regimes. The bi-modal areas cover much of Greater Equatoria Region (Western, Central and parts of Eastern Equatoria), while the rest of the country has a uni-modal rainfall regime. Agricultural performance varies markedly depending on latitude and longitude with the possibility of two or three harvests per annum from the same plots in Greater Equatoria Region and a single harvest in the uni-modal rainfall areas further north. As almost all agricultural production is rainfed, rainfall variability in terms of quantity and distribution is usually the major factor in determining crop performance. Historically, rainfall increases in a northeast to southwest direction culminating in the Greenbelt along the border with the Central African Republic, the Democratic Republic of the Congo and Uganda; but there are usually considerable variations in rainfall from year-to-year and from location-to-location within the same year. In low-lying areas, flooding/water-logging is a common occurrence, while many areas, especially those towards the northern border with the Sudan and in the southeast corner of the country are susceptible to prolonged dry periods. Crop production is mostly conducted on small, hand-cultivated plots farmed by women-headed households, with a membership of 5-7 persons that belong to larger family aggregations, reflecting the polygamous nature of most communities. Notwithstanding an abundant availability of land throughout the country, the area cultivated by households has, hitherto, been limited by a combination of (a) the size of the household labour force and/or the ability of households to provide in-kind payment (essentially food/beer) for the mobilization of traditional working groups (nafeer), (b) the lack of efficient tools and farm power for land clearing and ploughing and (c) security of access. In recent years, average farm sizes are noted to have increased with steadings-based, farm areas merging with far-fields as communities adopt animal traction (e.g. Lakes and parts of Warrap states); and, with the emergence of commercially-orientated farmers cultivating larger areas of cereals, groundnuts and cassava for sale using combinations of tractor services, labour gangs and pairs of oxen, depending on location. During the past 20 years, animal traction has been promoted by FAO and many NGOs in Central Equatoria, Eastern Equatoria, Lakes, Warrap and Bahr el Ghazal states in attempts to facilitate an increase in the area cultivated by each household. At last, previously noted constraints to its adoption appear to be lifting, with requests for increased access to purchase units reported to visiting mission teams in Lakes and Central Equatoria states. However, lack of spare parts, skills to maintain mould-board ploughs, raw materials for local blacksmiths and low levels of operator skill still limit expansion; as does a lack of resources to capitalize on the increased area through more extensive and frequent weeding1. In 2016, secure access to land throughout the year has been the defining characteristic of the areas farmed, not only in Greater Upper Nile Region and its bordering states as during the previous two years, but also in most areas of Greater Equatoria Region. Apart from the activities of the Aweil Rice Scheme in Northern Bahr el Ghazal State, mechanized cereal production is only noted to have been practised on a large scale in the Upper Nile counties of Renk, Manyo, Melut, Baliet, Fashoda and Malakal following the patterns of land occupancy established before the independence by traders/farmers from both South Sudan and the Sudan2. Elsewhere, limited numbers of both private and GRSS tractors provide ploughing services to individuals and farmer groups at prices noted to be ranging this year from SSP 200 (plus fuel) up to SSP 4 000/feddan for a single pass with fuel inclusive. “Mechanization” as a term applies only to one-pass preparation and a second sowing pass with a seed drill positioned over the ubiquitous disc harrows. Other operations are done manually. Major problems related to supply of fuel and spare parts, operator skills and maintenance and repair capabilities persist, severely limiting the efficiency of the tractor service with, on average, three-four times more tractors, purchased in the last ten years lying idle rather than functioning. In both the small–holder and mechanized sectors, sorghum is the main cereal crop cultivated by the traditional sector, comprising some 70 percent of the area sown to cereals. Regarding sorghum, the preferred seeds are
1 In this regard, the local transfer of donkey plough (scuffler) technology from Darfur Region in the Sudan to Western Bahr el Ghazal State offers an immediate solution for inter-row cultivation, including weeding and thinning of broadcast crops. 2 In 2016, significant areas of mechanized sorghum production have been reported in Tonychol scheme in Aweil East County in Northern Bahr el Ghazal State.
- 14 -
found among many local landraces with lengths to maturity fitting agro-ecological niches3 ranging from short-season (<90 days) to very long-season (>220 days) types. There are also several improved, short-term varieties of sorghum from the Sudan that have become well-established in both large-scale mechanized farms and hand-cultivated farming areas, with cross-border access to the Sudan located from Renk via Abyei to Aweil4. Maize is estimated to be planted in about 27 percent of the cereal area. However, this percentage breakdown is not universally applicable to product availability due to regional differences. Maize is the most popular cereal in the Greenbelt, where Longi varieties (especially Longi-5) from Uganda are grown in series in two crops per year on the same land (200 percent occupancy). It is also the main cereal in southcentral parts of Unity State, along the Sobat River in Upper Nile State and in eastern Jonglei counties near the Ethiopian border, where mixed Longi varieties, local landraces and Ethiopian releases are noted. Elsewhere, maize is only cultivated in very limited areas close to homesteads, where it is consumed green with the first early sorghums in August-September. Bulrush millet, finger millet and rice are estimated to make up the remaining 3 percent of the cereal area. In Northern and Western Bahr el Ghazal, Warrap and Lakes states, sorghum is intercropped with bulrush millet; whereas finger millet and upland rice are mostly found in Greater Equatoria Region. Other crops of most importance to food security include cassava and groundnuts, sweet potatoes and yams. Cassava is estimated to make up 30 percent to 40 percent of the planted area in Western and Central Equatoria states and 27 percent of the cultivated area in Western Bahr el Ghazal State. Groundnut areas range from 5 to 15 percent according to location. Groundnut, usually red beauty and Mr. Lake varieties, is usually cultivated on sandier soils and, after cereals, make the most important contribution to household diets throughout the northern states, where they are also the main cash crop5. Okra, cowpea, green-gram, pumpkin, Bambara nut and tobacco are also widely grown around homesteads in all areas. Vegetables such as onions or tomatoes are increasingly cultivated near cities to supply the urban markets. With the exception of farmers close to the borders with the Sudan or Uganda and vulnerable households receiving timely NGO distributions, most farmers use their own seed saved from the previous year’s harvest or local seeds purchased from markets or borrowed from relatives. Chemical inputs such as commercial fertilizers6, pesticides or herbicides are not used by small farmers on field crops, although some use of herbicides has been noted in previous CFSAM reports on large scale mechanized farms in Upper Nile with access to supplies from Kosti (the Sudan). Regarding pest control campaigns, before South Sudan independence, aerial spraying of nesting sites routinely controlled migratory Quelea quelea bird populations near the mechanized areas. Although the practice was resumed in 2013, with some aerial spraying conducted by the Desert Locust Control Organization (DLCO) based in Nairobi, no widespread actions have been taken since then as the areas concerned are exclusively in conflict-affected states, which leaves the January-harvested sorghum crops in Upper Nile State increasingly vulnerable to attacks. Livestock are very important assets throughout the country, the main species being cattle, goats and sheep raised extensively under transhumant systems of management. The sale of livestock, especially small ruminants, provides a significant contribution to incomes and, therefore, household food security of both transhumant pastoralists and sedentary livestock rearers. 3. CEREAL PRODUCTION IN 2016
3.1 Cereal harvested area and yield estimates In the absence of any nationally-generated, crop-yield estimates and empirical data from annual cropped land surveys disaggregated by crop, cereal production for the smallholder sub-sector is assessed by the CFSAM team using estimates of the following variables: (1) estimates of the numbers of farm households actively
3 Short-season landraces provide an early harvest in August/September, while long-season landraces, able to withstand both dry spells and water logging, are harvested in December/January. 4 Afargadamek, Wad Ahmed, Gaddam el Hammam. 5 Sesame, noted in traditional systems in all states intercropped with sorghum, is increasing in popularity in the north where it is sold to traders from the Sudan. 6 IFDC trials noted in Central Equatoria stopped three years ago and were considered as a failure, i.e. over-priced fertilizers gave no financial advantage over yields (previously underestimated) normally achieved by progressive farmers.
- 15 -
farming in each county, based on a) total county population figures (NBS data adjusted for UN/OCHA figures for population movement viz refugees, IDPs, returnees), and b) average household size and estimated proportion of household farming per county reflecting the proportion of rural to urban dwellers and access to land; (2) standard estimates of the average area per farm household under cereals for each county, adjusted according to Mission observations made during field visits; (3) estimates of average cereal yield for each county, based on Mission transect observations made using: a) PET photo indicators and associated protocols; b) farmer case studies and c) information from semi-structured interviews with key informants from State Ministries of Agriculture, NGOs and others involved in agriculture. Combining the products of each of these three sources of information gives the cereal production estimates for each county. The county figures are then added to provide the cereal production figures for each of the ten states and for the country as a whole. The number of assumptions incorporated into this methodology means that the final production figures should not be regarded as necessarily exact, but rather as the best estimates under the prevailing circumstances. In years up to 2013, the actions noted above have all been undertaken by a CFSAM Rome-based team of specialists during six-week missions to South Sudan in November-December, working with staff from MAF, NBS and FAO national staff. Starting in 2014, in a departure from the usual one-off CFSAM at harvest time, teams led by members of a Task Force of selected specialists from MAF, NBS and FAO national staff conducted a series of intermediate missions at planting and harvest time. All missions were timed to match the pertinent agricultural activities that occur at different times of the year in different agricultural zones in accordance with a “Roadmap”. The effect of the change in approach was noticeable in the greater coverage obtained including a proper assessment of production from the first season harvest in the Greenbelt and being able to assess standing crops in Warrap State for the first time in several years. In 2015, the “Roadmap” was applied again as far as security-restricted access allowed. In 2016, implementing similar procedures has not been straight forward. In June, the Task Force teams were able to conduct three planting/first-season early harvest missions in Western, Central and Eastern Equatoria states. However, prolonged periods of severe insecurity since early July meant that only nine short harvest/post-harvest missions were carried out between late September and November, with no possibility of driving transects7. Furthermore, in a pilot attempt earlier in the year to increase coverage and participation of local line agencies, AFIS set up 20 County Crop Monitoring Committees (CCMCs) whose members were trained to observe and report using a standard form designed to capture qualitative and quantitative information. In November-December, the Task Force teams were joined by the international CFSAM team members from FAO and WFP. During the harvest assessment missions from October to December, security and related access implications required that field work was conducted in pre-sited locations reachable only by air or separated by main roads where at least two UN vehicles were required to drive in-tandem or, military escorts were necessary to accompany the vehicles. As in 2015, this meant that “walking”8 transects in specific locations were the major objective approach used rather than long-distance “driving” transects used in the past to estimate yields. During the whole year 2016, Task Force teams were able to visit 77 locations in 41 counties in Northern Bahr el Ghazal, Lakes, Warrap, Abyei Administrative Area, Eastern Equatoria, Upper Nile, Jonglei and Western Bahr el Ghazal states. They completed 550 farmer case studies and 36 key informant interviews with senior staff in previously-designated State Ministries of Agriculture (SMoA), county officials and staff of NGOs and international agencies based in the field. Further, returns from functioning CCMCs offered qualitative information on events and resulting actions of farmers to such events. Growing conditions reported in the case studies and interviews were then compared against 2016 Normalized Difference Vegetation Indices (NDVIs) data and remote sensed rainfall estimates provided by WFP-VAM for all areas, along with the long-term averages and rainfall data collected locally through a recently AFIS-rehabilitated network of manual rain-gauges. As access has been precluded to assessment missions in several areas due to deteriorating local security conditions, especially since early July, processes of “remote” assessment, through email and telephone
7 Compared to no driving transects but 200 walking transects in 2015. 8 Team members independently walk for about two hours along paths through fields, scoring yields in every plot/field passed by colour code according to “close-up level” of PET photo-indicators for each major crop. Scores made are then converted from colour codes into tonnes/hectare and weighted averages calculated for each “transect” walked.
- 16 -
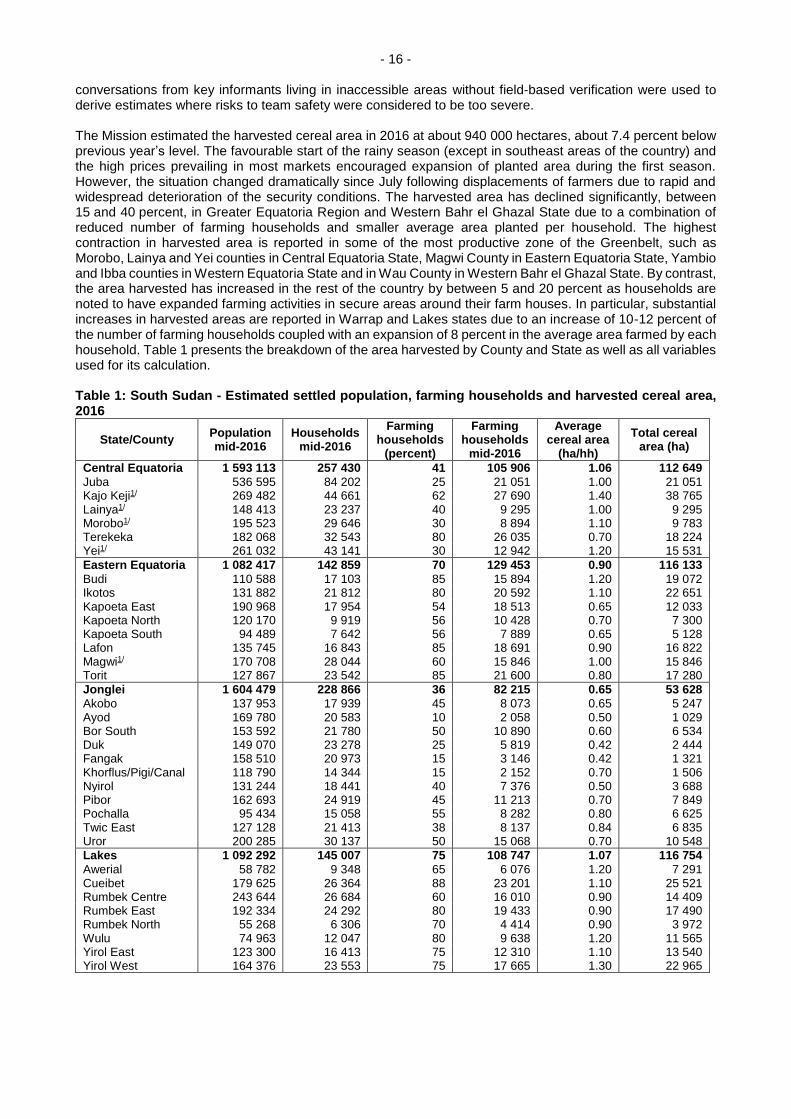
conversations from key informants living in inaccessible areas without field-based verification were used to derive estimates where risks to team safety were considered to be too severe. The Mission estimated the harvested cereal area in 2016 at about 940 000 hectares, about 7.4 percent below previous year’s level. The favourable start of the rainy season (except in southeast areas of the country) and the high prices prevailing in most markets encouraged expansion of planted area during the first season. However, the situation changed dramatically since July following displacements of farmers due to rapid and widespread deterioration of the security conditions. The harvested area has declined significantly, between 15 and 40 percent, in Greater Equatoria Region and Western Bahr el Ghazal State due to a combination of reduced number of farming households and smaller average area planted per household. The highest contraction in harvested area is reported in some of the most productive zone of the Greenbelt, such as Morobo, Lainya and Yei counties in Central Equatoria State, Magwi County in Eastern Equatoria State, Yambio and Ibba counties in Western Equatoria State and in Wau County in Western Bahr el Ghazal State. By contrast, the area harvested has increased in the rest of the country by between 5 and 20 percent as households are noted to have expanded farming activities in secure areas around their farm houses. In particular, substantial increases in harvested areas are reported in Warrap and Lakes states due to an increase of 10-12 percent of the number of farming households coupled with an expansion of 8 percent in the average area farmed by each household. Table 1 presents the breakdown of the area harvested by County and State as well as all variables used for its calculation. Table 1: South Sudan - Estimated settled population, farming households and harvested cereal area, 2016
State/County Population mid-2016
Households mid-2016
Farming households
(percent)
Farming households
mid-2016
Average cereal area
(ha/hh)
Total cereal area (ha)
Central Equatoria 1 593 113 257 430 41 105 906 1.06 112 649
Juba 536 595 84 202 25 21 051 1.00 21 051 Kajo Keji1/ 269 482 44 661 62 27 690 1.40 38 765 Lainya1/ 148 413 23 237 40 9 295 1.00 9 295 Morobo1/ 195 523 29 646 30 8 894 1.10 9 783 Terekeka 182 068 32 543 80 26 035 0.70 18 224 Yei1/ 261 032 43 141 30 12 942 1.20 15 531
Eastern Equatoria 1 082 417 142 859 70 129 453 0.90 116 133
Budi 110 588 17 103 85 15 894 1.20 19 072 Ikotos 131 882 21 812 80 20 592 1.10 22 651 Kapoeta East 190 968 17 954 54 18 513 0.65 12 033 Kapoeta North 120 170 9 919 56 10 428 0.70 7 300 Kapoeta South 94 489 7 642 56 7 889 0.65 5 128 Lafon 135 745 16 843 85 18 691 0.90 16 822 Magwi1/ 170 708 28 044 60 15 846 1.00 15 846 Torit 127 867 23 542 85 21 600 0.80 17 280
Jonglei 1 604 479 228 866 36 82 215 0.65 53 628
Akobo 137 953 17 939 45 8 073 0.65 5 247 Ayod 169 780 20 583 10 2 058 0.50 1 029 Bor South 153 592 21 780 50 10 890 0.60 6 534 Duk 149 070 23 278 25 5 819 0.42 2 444 Fangak 158 510 20 973 15 3 146 0.42 1 321 Khorflus/Pigi/Canal 118 790 14 344 15 2 152 0.70 1 506 Nyirol 131 244 18 441 40 7 376 0.50 3 688 Pibor 162 693 24 919 45 11 213 0.70 7 849 Pochalla 95 434 15 058 55 8 282 0.80 6 625 Twic East 127 128 21 413 38 8 137 0.84 6 835 Uror 200 285 30 137 50 15 068 0.70 10 548
Lakes 1 092 292 145 007 75 108 747 1.07 116 754
Awerial 58 782 9 348 65 6 076 1.20 7 291 Cueibet 179 625 26 364 88 23 201 1.10 25 521 Rumbek Centre 243 644 26 684 60 16 010 0.90 14 409 Rumbek East 192 334 24 292 80 19 433 0.90 17 490 Rumbek North 55 268 6 306 70 4 414 0.90 3 972 Wulu 74 963 12 047 80 9 638 1.20 11 565 Yirol East 123 300 16 413 75 12 310 1.10 13 540 Yirol West 164 376 23 553 75 17 665 1.30 22 965

- 17 -
N Bahr el Ghazal 1 347 370 250 779 80 200 621 0.76 156 658
Aweil Centre 112 356 24 394 60 14 636 0.84 12 294 Aweil East 543 261 99 699 85 84 744 0.70 59 321 Aweil North 248 184 47 843 85 40 666 0.84 34 160 Aweil South 131 328 25 003 70 17 502 0.84 14 702 Aweil West 312 241 53 840 80 43 072 0.84 36 181
Unity 1 006 831 121 119 32 38 307 0.42 16 089
Abiemnhom 24 223 2 572 60 1 543 0.42 648 Guit 47 425 4 644 25 1 161 0.42 488 Koch 136 422 14 496 40 5 798 0.42 2 435
Leer 114 512 15 212 10 1 521 0.42 639 Mayendit 81 737 10 042 30 3 013 0.42 1 265 Mayom 178 011 22 439 40 8 975 0.42 3 770
Panyijar 74 765 12 788 40 5 115 0.42 2 148 Pariang 143 588 18 219 50 9 110 0.42 3 826 Rubkona 206 148 20 708 10 2 071 0.42 870
Upper Nile 1 143 175 169 240 43 72 448 0.65 48 103
Baliet 70 572 10 669 15 1 600 0.60 960 Fashoda 32 185 5 197 10 520 0.50 260 Longochuk 14 226 1 864 75 1 398 0.50 699 Luakpiny/Nasir 313 605 43 352 55 23 844 0.60 14 306 Maban 64 200 13 949 55 7 672 0.70 5 370
Maiwut 103 349 13 626 60 8 176 0.50 4 088 Malakal 132,272 17 666 10 1 767 0.42 742 Manyo 43 035 7 233 40 2 893 0.50 1 447 Melut 57 665 8 323 50 4 162 1.00 4 162 Panyikang 28 927 4 628 35 1 620 0.42 680 Renk 157 358 25 693 40 10 277 1.00 10 277 Ulang 125 781 17 040 50 8 520 0.60 5 112
W Bahr el Ghazal 557 017 98 300 61 60 235 0.85 51 081
Jur River 205 571 33 417 70 23 392 0.90 21 053 Raga 111 186 20 868 50 10 434 0.60 6 260 Wau 240 260 44 015 60 26 409 0.90 23 768
Warrap 1 372 392 238 587 69 163 707 0.95 154 970
Abyei 74 450 11 117 60 6 670 1.20 8 004 Gogrial East 146 238 26 220 65 17 043 0.80 13 634 Gogrial West 335 338 61 848 80 49 478 1.10 54 426 Tonj East 137 038 23 309 65 15 151 0.70 10 606 Tonj North 213 339 38 335 70 26 834 0.85 22 809 Tonj South 111 668 18 751 70 13 126 1.20 15 751 Twic 354 321 59 007 60 35 404 0.84 29 740
Western Equatoria 813 889 151 880 61 93 048 1.22 113 296
Ezo1/ 108 815 24 493 30 7 348 1.00 7 348 Ibba1/ 49 555 12 401 75 9 301 1.40 13 021 Maridi1/ 102 146 16 250 70 11 375 1.30 14 787 Mundri East1/ 61 018 8 614 45 3 876 0.80 3 101 Mundri West1/ 55 516 6 580 60 3 948 0.80 3 158 Mvolo 61 657 8 402 70 5 881 0.80 4 705 Nagero 16 066 3 418 70 2 392 0.80 1 914 Nzara1/ 76 499 18 998 80 15 198 1.30 19 758 Tambura1/ 76 563 18 414 90 16 573 1.40 23 202 Yambio1/ 206 053 34 311 50 17 156 1.30 22 302
South Sudan 11 612 974 1 846 449 57 1 054 686 0.89 939 361
1/ First and second harvest areas combined - this year mostly first season only.
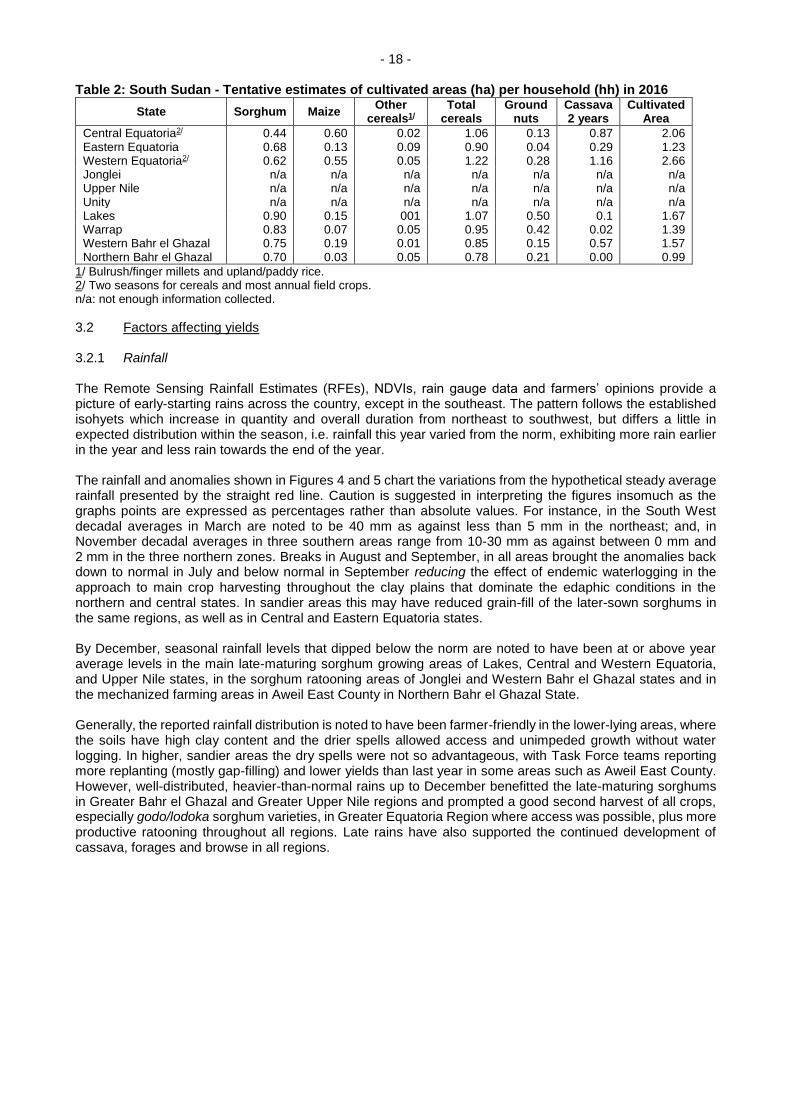
Table 2 provides tentative estimates of areas of other crops grown in 2016. They are based on proportions noted in 2013, 2014 and 2015 adjusted by information from the 2016 Task Force teams’ case studies. The estimates reflect the following issues: i) lower levels of second season planting of annual crops in Greater Equatoria Region and Western Bahr el Ghazal states; ii) increased importance of groundnuts in Lakes, Warrap and Northern Bahr el Ghazal states; and iii) the mission-assumed resilience of cassava as a safety net in times of temporary displacement of farming communities due to the transitory presence of armed groups.
- 18 -
Table 2: South Sudan - Tentative estimates of cultivated areas (ha) per household (hh) in 2016
State Sorghum Maize Other
cereals1/ Total
cereals Ground
nuts Cassava 2 years
Cultivated Area
Central Equatoria2/ 0.44 0.60 0.02 1.06 0.13 0.87 2.06 Eastern Equatoria 0.68 0.13 0.09 0.90 0.04 0.29 1.23 Western Equatoria2/ 0.62 0.55 0.05 1.22 0.28 1.16 2.66 Jonglei n/a n/a n/a n/a n/a n/a n/a Upper Nile n/a n/a n/a n/a n/a n/a n/a Unity n/a n/a n/a n/a n/a n/a n/a Lakes 0.90 0.15 001 1.07 0.50 0.1 1.67 Warrap 0.83 0.07 0.05 0.95 0.42 0.02 1.39 Western Bahr el Ghazal 0.75 0.19 0.01 0.85 0.15 0.57 1.57 Northern Bahr el Ghazal 0.70 0.03 0.05 0.78 0.21 0.00 0.99
1/ Bulrush/finger millets and upland/paddy rice. 2/ Two seasons for cereals and most annual field crops. n/a: not enough information collected.
3.2 Factors affecting yields 3.2.1 Rainfall The Remote Sensing Rainfall Estimates (RFEs), NDVIs, rain gauge data and farmers’ opinions provide a picture of early-starting rains across the country, except in the southeast. The pattern follows the established isohyets which increase in quantity and overall duration from northeast to southwest, but differs a little in expected distribution within the season, i.e. rainfall this year varied from the norm, exhibiting more rain earlier in the year and less rain towards the end of the year. The rainfall and anomalies shown in Figures 4 and 5 chart the variations from the hypothetical steady average rainfall presented by the straight red line. Caution is suggested in interpreting the figures insomuch as the graphs points are expressed as percentages rather than absolute values. For instance, in the South West decadal averages in March are noted to be 40 mm as against less than 5 mm in the northeast; and, in November decadal averages in three southern areas range from 10-30 mm as against between 0 mm and 2 mm in the three northern zones. Breaks in August and September, in all areas brought the anomalies back down to normal in July and below normal in September reducing the effect of endemic waterlogging in the approach to main crop harvesting throughout the clay plains that dominate the edaphic conditions in the northern and central states. In sandier areas this may have reduced grain-fill of the later-sown sorghums in the same regions, as well as in Central and Eastern Equatoria states. By December, seasonal rainfall levels that dipped below the norm are noted to have been at or above year average levels in the main late-maturing sorghum growing areas of Lakes, Central and Western Equatoria, and Upper Nile states, in the sorghum ratooning areas of Jonglei and Western Bahr el Ghazal states and in the mechanized farming areas in Aweil East County in Northern Bahr el Ghazal State. Generally, the reported rainfall distribution is noted to have been farmer-friendly in the lower-lying areas, where the soils have high clay content and the drier spells allowed access and unimpeded growth without water logging. In higher, sandier areas the dry spells were not so advantageous, with Task Force teams reporting more replanting (mostly gap-filling) and lower yields than last year in some areas such as Aweil East County. However, well-distributed, heavier-than-normal rains up to December benefitted the late-maturing sorghums in Greater Bahr el Ghazal and Greater Upper Nile regions and prompted a good second harvest of all crops, especially godo/lodoka sorghum varieties, in Greater Equatoria Region where access was possible, plus more productive ratooning throughout all regions. Late rains have also supported the continued development of cassava, forages and browse in all regions.

- 19 -
Figure 4: South Sudan - Rainfall amounts RFE and NDVI

- 20 -
Figure 5: South Sudan - Rainfall anomalies during 2016
- 21 -
The completed returns confirm favourable rains in the central and western locations, and, less favourable rains in the eastern side of the country. Comparison with the rainfall descriptions given by farmers and key informants during semi-structured interviews and case studies, shows that in the small holder and emerging farmer sector:
In Jonglei and Eastern Equatoria the rainfall patterns were considered to be unfavourable.
In Central Equatoria, the responses were more mixed, suggesting greater diversity around an average year.
Elsewhere, an earlier/normal start to the rains encouraged planting that was sustained during April, May, June and July. Short dry spells caused i) some replanting gap filling needed to overcome patchiness in germination of early/middle-cycle sorghums; and ii) some yield reduction of first harvest crops in Central Equatoria.
Although some waterlogging was reported in areas known to be flood plains in Warrap and Northern Bahr el Ghazal, farmers experienced reduced flood/waterlogging damage in August and September this year compared to previous years.
In areas with a high proportion of late-maturing sorghum or ratooning, the rains are noted to have increased to above average after October.
Regarding the mechanized farming sector in Upper Nile State, the early rainfall prompted timely cultivation and reduced rains in August and September allowed continued tractor access. Continuous rain until November supported all crops in all the mechanized areas where farming occurred. 3.2.2 Inputs in the traditional smallholder sector The two main inputs in the traditional sector are manual labour and local planting material (seeds and cuttings) with farmers relying on movement to sustain soil fertility in most areas except Northern Bahr el Ghazal. Regarding hand cultivation, availability of hand tools and people to use them are the most significant limiting factors for agricultural activities. For the majority of households, farm size is limited to the area of land that the farming families themselves can clear, cultivate and weed with the ubiquitous cutlass, the flat-bladed, long-handled hoe called the maloda, the local short-handled, bent hoe called the toriah, or the East African hoe or jembe. Due to the fall of the value of the SSP, prices of hand tools have increased ten-fold. However, it should be noted that producer prices for livestock and crops have also increased and although that may be of scant value to vulnerable subsistence farmers, for those households with access to more land and labour such price rises affect livelihoods quite positively. Having said that, labour hiring rates have also risen with hand-digging9 matching or exceeding the cost of ploughing (of which the bulk of the cost comes from the fuel) at prices in 2016 ranging from SSP 1 500-3 000/feddan. Such prices change according to location with the highest prices noted by Task Force teams to be near Juba. The acceptance of animal traction in all counties in Lakes State, where the uptake of the technology appears to be its highest, and, in parts of Warrap and Central Equatoria states, is also reflected in the price of bullock ploughing per feddan with hiring rates in 2016 at around SSP 800-1 000 compared to SSP 150-350/feddan last year. As most farmers in Lakes State now use their own or hired bullocks, area cultivated to all crops has increased noticeably since independence and continues to increase due to the popularity of groundnuts as both a cash crop and a second staple. Soil fertility is sustained by shifting and fallowing within a recognizable farm area or domain and by the use of animal dung in Northern Bahr el Ghazal, Warrap. Western Bahr el Ghazal (Jur River County) and Lakes states. Whereas in most locations the dung comes from the farmers’ own livestock, in Northern Bahr el Ghazal State, where shifting opportunities are limited, contract-dunging by pastoralists’ herds and flocks on private farmland is a traditional way of sustaining fertility. Such actions were reported again this year, with contracted terms clearly depending on relationships between herders and farmers, ranging from 100 kg of sorghum per week to supplying all meals and drinks for the herders, including slaughtering goats as needed. Regarding chemical fertilizers, as was reported last year, the International Fertilizer Development Company trials on maize in Central and Western Equatoria states have been discontinued with no apparent gains recorded and Aweil Rice stopped using fertilizer five years ago. Any fertilizer that may still be used is noted to
9 Cheaper hand labour in noted in Western and Central Equatoria due to local employment of immigrant labourers from the Democratic Republic of the Congo and Uganda respectively, still being reported this year; challenging statements of a rural exodus.

- 22 -
be used on vegetables in locations close to the Uganda border, by entrepreneurs who have access to Uganda markets and Uganda shillings; however, displacement and disturbances around Yei County, since June, suggest that such purchases are unlikely this year. Regarding planting material, farmers in all regions use either a) their own seeds of niche sorghums (early, second-early, main-crop and late-maturing landraces) carried over from the previous harvest; b) market purchased seeds for crops with high storage losses, including locally multiplied, improved varieties of maize such as the ex-NARO10 (Uganda) Longi 5; and improved groundnut varieties (Red Beauty); or c) they borrow seeds from extended family members. In 2016, as a response to the emergency situation caused by the conflict, FAO provided seeds through direct distribution by NGOs in Greater Upper Nile Region and through internal seed fairs organized by NGOs in Greater Bahr el Ghazal Region. In such ways, 390 tonnes of sorghum (to plant approximately 26 000 hectares), 159 tonnes of maize (for about 6 360 hectares); 248 tonnes of cowpeas (for about 8 300 hectares) and 123 tonnes of groundnuts (for about 1 250 hectares) have been distributed as against the estimated 15 000 tonnes of local sorghum seed that are expected to have been planted last year. No further information on seed supply is available. 3.2.3 Pests, diseases and weeds A wide selection of pests, diseases and weeds are found every year in South Sudan. However, insect pests and diseases remain untreated with farmers accepting the losses as inevitable, while weeds and vertebrate pests are treated manually through a) weeding at 1-2-3 times per season according to crop; and b) by bird scaring and protecting fields from wild animals and domestic livestock. Before independence, pests of crops were categorized as either national (migratory pests) that were subject to control by spraying by the Ministry of Agriculture supported by the DLCO for eastern Africa; or, as local pests that were controlled by the farmers themselves. Although South Sudan is a member of the DLCO, no control over migratory pests has been conducted since 2013, when WFP funded spraying of Quelea quelea birds’ nests in riverine areas in Upper Nile. Since then, no further aerial or ground-based spraying of migratory pests has been conducted. This year, in Upper Nile, both traditional smallholder farmers and large-scale mechanized farmers expressed concern to Task Force teams regarding the increasing numbers of migratory Quelea quelea which they are considering to be a major threat to the late sorghum harvest in January. Common non-migratory pests noted include stalk (stem) borers, green grasshoppers, caterpillars, millipedes, termites, aphids, local birds, monkeys, rodents, wild pigs, porcupines, and domestic livestock. All insect pest infestations were considered to be mild in most places this year. Weeds are noted to have been the main problem, as confirmed by early rainfall and average or above-average vegetation indices throughout the main growing season. Controlling grass and broadleaf weeds11 by weeding once, twice and even three times is noted this year throughout the traditional sector to get the best possible crops for home use and for sale. Where farmers had no access to new plots and continued to dig or plough exhausted plots, the plant parasite striga remains a problem that may be addressed by the use of manure or by transplanting seedlings at three-four weeks old from nurseries or from striga free fields. As in previous years, the major plant diseases comprise rosette virus and leaf spot of groundnuts, mosaic virus of cassava and sorghum smut. 3.3 Agricultural production in 2016 3.3.1 Cereal production A. Traditional smallholder sector Cereal production in the traditional sector is determined by multiplying yield per unit area by the disaggregated area estimates derived from secondary data, as described in Section 3.1. In 2016, Task Force-led teams’ estimates of production of cereals in each state were compiled from county-level disaggregated data. Such information was gained from historical time-series data adjusted by findings
10 National Agricultural Research Organization. 11 An unusual new broadleaf weed called babashiro, supposedly from the Democratic Republic of the Congo, is noted to be causing concern in Western Equatoria Greenbelt.
- 23 -
from a series of missions conducted by the Task Force which included, over a period from mid-July to mid-December 2016, a) 550 detailed, on-farm case studies with sample farmers and key informant interviews with staff from State Ministries, NGOs and projects; b) empirical data obtained from more than 77 localities using, where possible, the updated South Sudan’s PET. In such transects, PET-based scores of crop yield are cross-checked by weighing crop-cut samples taken during the case studies. The empirical data obtained was finally reviewed using secondary data from reports provided by FAO, WFP, NBS and various NGOs plus the RFE and NDVI satellite data provided by WFP-VAM for the current season compared with previous seasons and the long-term average as well as rainfall data collected at county level by AFIS-trained recorders. The planting/harvest time missions completed by Task Force teams are listed below:
In June, missions to assess yields of first season maize (Longi 5 variety) and other cereal crops were conducted in Western Equatoria State covering Nzara, Yambio, Maridi and Mundri West counties. Teams also conducted similar missions in Eastern Equatoria State in Lafon, Magwi, Pageri and Torit counties as well as in Central Equatoria State in Yei River, Lainya, Morobo, Lobonok and Juba counties.
In September and October, short missions to assess yields of cereal crops were conducted in Northern Bahr el Ghazal State (Aweil West, Aweil South, Aweil Centre and Aweil East counties), Warrap State (Twic and Gogrial West counties plus Abyei Administrative Area) and in Lakes State (Cuibet, Wulu, Rumbek East and Rumbek Central counties). Crop reported included short-cycle sorghum landraces Cham, Nanjung, Rapjung, Abele plus medium-cycle sorghum landraces Alep Cham, Nyethin, Nyandok, Rabdit, Aleul, Aiyella and improved feterita-type sorghums from the Sudan, such as Afargadamek, Wad Ahmed, Gaddam el Hammam; late sorghum landrace kec and groundnuts (Red Beauty and Mr Lake); plus very limited maize areas around the steadings.
In October, missions to assess yields of cereal crops including local landraces of sorghum (Kabi) and small areas of maize in Greater Kapoeta Region (North, East and South) in Eastern Equatoria State.
In November, missions to assess yields of local landraces of sorghum (Leuwarding and Agono) and maize in the small-holder sector plus landraces Afargadamek, Wad Ahmed, Gaddam el Hammam in the mechanized sector were conducted in Maban, Renk and Melut counties in Upper Nile State; in Pibor and Akobo counties in Jonglei State and later maturing sorghums in Jur River and Wau counties in Western Bahr el Ghazal State.
In December, a mission to assess yields at Aweil Rice, Ton Chol mechanized sector, including long-driving transects to observe post-harvest conditions of crops in Aweil West, Aweil Centre and Aweil East counties. Further information for Renk and Melut counties was provided by telephone interviews with State Directors of Agriculture and NGO agriculturalists and for Kajo-Keji and Morobo (Central Equatoria) was provided by CCMC members.
Estimates of 2016 cereal production in the traditional sector, disaggregated by (former) states and counties, are presented in Table 3. The national gross cereal production from the smallholder sector in 2016 is estimated at slightly above 1 million tonnes. As in previous assessments, post-harvest losses and seed use for sowing in 2017 are assumed to account for 20 percent of total production, leaving a net amount of about 826 000 tonnes available for local consumption. This result is about 10 percent below the output obtained in 2015 and slightly below the last five-year average production estimates. The decline in 2016 is essentially due to displacements of farmers and disruption of farming activities following the increased insecurity and violence since July. The major reduction in production, between 15 and 45 percent less than 2015, occurred in most key-cropping areas of Greater Equatoria Region and Western Bahr el Ghazal State. By contrast, some increases were reported in less productive areas such as Warrap (+25 percent), Lakes (+16 percent) and the whole Greater Upper Nile Region (between +5 and +10 percent). The mean gross cereal yield from the smallholder sector is estimated at 1.10 tonne/hectare, about 3 percent lower than last year’s estimate of 1.13 tonnes/hectare and 12 percent lower than estimated in 2014. The reversal reflects widespread loss second season harvest in the Greenbelt following displacement and the increase in cereal area in less productive regions such as Lakes and Warrap. As during 2014 and 2015, conservative yield values have been used for areas not visited by Task Force teams at harvest time and where no independent assessments have been conducted12.
12 It applies especially to the whole Unity State and many locations in Jonglei State plus Raga County in Western Bahr el Ghazal State.

- 24 -
Table 3: South Sudan - Estimated cereal harvested area (ha), yield (t/ha), production (t), consumption and balance (traditional sector), 2016
State/ County
Cereal area 2016 (ha)
2016 gross yield (t/ha)
2016 gross cereal
production (t)
2016 net cereal
production (t)
Population mid-2017
2017 cereal req’t (t)
2017 surplus/ deficit (t)
Central Equatoria
112 649 1.33 150 291 120 233 1 640 906 209 309 -89 076
Juba 21 051 1.10 23 156 18 524 552 693 77 378 -58 853 Kajo Keji 38 765 1.50 58 148 46 518 277 566 33 308 13 210 Lainya 9 295 1.30 12 083 9 667 152 865 18 344 -8 677 Morobo 9 783 1.60 15 653 12 522 201 389 24 167 -11 644 Terekeka 18 224 0.90 16 402 13 122 187 530 22 504 -9 383 Yei River 15 531 1.60 24 849 19 879 268 863 33 608 -13 729
Eastern Equatoria
116 133 1.06 123 164 98 531 1 114 889 138 360 -39 828
Budi 19 072 1.00 19 072 15 258 113 906 13 669 1 589 Ikotos 22 651 1.10 24 916 19 933 135 838 16 980 2 953 Kapoeta East 12 033 0.90 10 830 8 664 196 697 24 587 -15 923 Kapoeta North
7 300 1.00 7 300 5 840 123 776 15 472 -9 633
Kapoeta South
5 128 0.60 3 077 2 462 97 324 12 652 -10 190
Lafon 16 822 1.10 18 504 14 804 139 817 16 778 -1 975 Magwi 15 846 1.40 22 185 17 748 175 829 21 099 -3 352 Torit 17 280 1.00 17 280 13 824 131 703 17 122 -3 298
Jonglei 53 628 0.80 43 061 34 449 1 652 613 185 238 -150 789 Akobo 5 247 1.00 5 247 4 198 142 092 15 630 -11 433 Ayod 1 029 0.70 720 576 174 873 19 236 -18 660 Bor South 6 534 0.80 5 227 4 182 158 200 18 193 -14 011 Duk 2 444 0.70 1 711 1 369 153 542 16 890 -15 521 Fangak 1 321 0.70 925 740 163 265 17 959 -17 219 Khorflus/ Pigi/Canal
1 506 0.63 949 759 122 354 13 459 -12 700
Nyirol 3 688 0.80 2 951 2 360 135 181 14 870 -12 510 Pibor 7 849 0.90 7 064 5 652 167 574 20 109 -14 457 Pochalla 6 625 1.00 6 625 5 300 98 297 11 796 -6 495 Twic East 6 835 0.70 4 785 3 828 130 942 14 404 -10 576 Uror 10 548 0.65 6 856 5 485 206 294 22 692 -17 207
Lakes 116 754 1.14 132 761 106 209 1 125 061 123 758 -17 550 Awerial 7 291 1.00 7 291 5 833 60 545 6 660 -827 Cueibet 25 521 1.20 30 625 24 500 185 014 20 352 4 148 Rumbek Centre
14 409 1.10 15 850 12 680 250 953 27 605 -14 925
Rumbek East 17 490 1.20 20 988 16 790 198 104 21 791 -5 001 Rumbek North
3 972 1.00 3 972 3 178 56 927 6 262 -3 084
Wulu 11 565 1.20 13 878 11 103 77 211 8 493 2 609 Yirol East 13 540 1.10 14 895 11 916 126 999 13 970 -2 055 Yirol West 22 965 1.10 25 261 20 209 169 307 18 624 1 584
N. Bahr el Ghazal
156 658 0.99 155 243 124 194 1 387 791 152 657 -28 462
Aweil Centre 12 294 1.15 14 139 11 311 115 727 12 730 -1 419 Aweil East 59 321 0.80 47 457 37 965 559 559 61 551 -23 586 Aweil North 34 160 1.05 35 868 28 694 255 630 28 119 575 Aweil South 14 702 1.10 16 172 12 938 135 268 14 879 -1 942 Aweil West 36 181 1.15 41 608 33 286 321 608 35 377 -2 091
Unity 16 089 0.68 10 930 8 744 1 037 036 90 272 -81 529 Abiemnhom 648 0.50 324 259 24 949 2 120 -1 861 Guit 488 0.60 293 234 48 848 4 152 -3 917 Koch 2 435 0.80 1 948 1 559 140 515 11 944 -10 385 Leer 639 0.70 447 358 117 947 10 027 -9 669 Mayendit 1 265 0.70 886 709 84 189 7 157 -6 448 Mayom 3 770 0.63 2 375 1 900 183 351 15 585 -13 685 Panyijar 2 148 0.50 1 074 859 77 008 6 546 -5 686 Pariang 3 826 0.80 3 061 2 449 147 896 12 571 -10 123 Rubkona 870 0.60 522 417 212 332 20 172 -19 754

- 25 -
State/ County
Cereal area 2016 (ha)
2016 gross yield (t/ha)
2016 gross cereal
production (t)
2016 net cereal
production (t)
Population mid-2017
2017 cereal req’t (t)
2017 surplus/ deficit (t)
Upper Nile 48 103 0.77 37 017 29 613 1 177 470 102 257 -72 644 Baliet 960 0.60 576 461 72 689 6 179 -5 718 Fashoda 260 0.60 156 125 33 151 2 818 -2 693 Longochuk 699 0.60 419 336 14 653 1 245 -910 Luakpiny/ Nasir
14 306 0.80 11 445 9 156 323 013 27 456 -18 300
Maban 5 370 0.80 4 296 3 437 66 126 5 621 -2 184 Maiwut 4 088 0.60 2 453 1 962 106 449 9 048 -7 086 Malakal 742 0.70 519 415 136 240 12 942 -12 527
Manyo 1 447 0.80 1 157 926 44 326 3 768 -2 842 Melut 4 162 1.00 4 162 3 329 59 395 5 049 -1 719 Panyikang 680 0.80 544 435 29 795 2 533 -2 097 Renk 10 277 0.80 8 222 6 577 162 079 14 587 -8 010 Ulang 5 112 0.60 3 067 2 454 129 554 11 012 -8 558
W. Bahr el Ghazal
51 081 1.11 56 815 45 452 573 727 64 439 -18 987
Jur River 21 053 1.10 23 158 18 526 211 738 23 292 -4 766 Raga 6 260 1.20 7 512 6 010 114 522 11 452 -5 442 Wau 23 768 1.10 26 145 20 916 247 468 29 696 -8 780
Warrap 154 970 1.14 176 808 141 447 1 413 564 136 763 4 684 Abyei 8 004 1.30 10 405 8 324 76 684 6 901 1 423 Gogrial East 13 634 1.00 13 634 10 908 150 625 14 309 -3 402 Gogrial West 54 426 1.20 65 311 52 249 345 398 36 267 15 982 Tonj East 10 606 0.80 8 485 6 788 141 149 14 115 -7 327 Tonj North 22 809 1.00 22 809 18 247 219 739 21 973 -3 726 Tonj South 15 751 1.30 20 476 16 381 115 018 10 351 6,030 Twic 29 740 1.20 35 687 28 550 364 951 32 846 -4 296
W. Equatoria 113 296 1.29 146 169 116 935 838 306 121 554 -4 619 Ezo 7 348 1.40 10 287 8 230 112 079 16 252 -8 022 Ibba 13 021 1.30 16 927 13 542 51 041 7 401 6 141 Maridi 14 787 1.30 19 223 15 379 105 210 15 256 123 Mundri East 3 101 1.00 3 101 2 481 62 849 9 113 -6 632 Mundri West 3 158 1.10 3 474 2 779 57 182 8 291 -5 512 Mvolo 4 705 0.90 4 234 3 388 63 507 9 209 -5 821 Nagero 1 914 1.10 2 105 1 684 16 548 2 399 -715 Nzara 19 758 1.40 27 661 22 129 78 794 11 425 10 704 Tambura 23 202 1.30 30 162 24 130 78 860 11 435 12 695 Yambio 22 302 1.30 28 993 23 194 212 235 30 774 -7 580
South Sudan 939 361 1.10 1 032 258 825 807 11 961 364 1 324 608 -498 801

- 26 -
Table 4: South Sudan - Cereal harvested area and net production (rounded) in the traditional sector, 2012-2016
Zone/State
2012 2013 2014 2015 2016
Area (000 ha)
Net Prod. (000 t)
Net Yield (t/ha)
Area (000 ha)
Net Prod. (000 t)
Net Yield (t/ha)
Area (000 ha)
Net Prod. (000 t)
Net Yield (t/ha)
Area (000 ha)
Net Prod. (000 t)
Net Yield (t/ha)
Area (000 ha)
Net Prod. (000 t)
Net Yield (t/ha)
Upper Nile 243 112 0.46 254 136 0.53 82 50 0.61 108 68 0.63 118 73 0.62
Upper Nile 83 38 0.46 84 40 0.48 36 19 0.53 45 27 0.53 48 30 0.63 Unity 47 15 0.32 54 26 0.48 15 8 0.53 16 9 0.55 16 9 0.56 Jonglei 113 59 0.52 116 70 0.60 31 23 0.74 47 32 0.76 54 34 0.63
Bahr el Ghazal 448 287 0.64 451 310 0.69 415 403 0.97 440 379 0.86 480 416 0.87
N. Bahr el Ghazal 119 78 0.66 115 85 0.74 128 113 0.88 147 114 0.84 157 124 0.79 W. Bahr el Ghazal 61 48 0.79 62 50 0.81 69 75 1.06 65 58 0.89 51 45 0.88 Lakes 99 70 0.70 107 75 0.70 94 92 0.99 97 94 1.01 117 106 0.91 Warrap 169 91 0.54 167 100 0.60 124 123 0.99 131 113 0.9 155 141 0.91
Greater Equatoria 451 391 1.15 468 445 0.95 517 562 1.09 467 465 1.00 346 336 0.97
Central Equatoria 155 114 0.92 160 150 0.94 199 223 1.12 197 216 1.19 117 120 1.03 Eastern Equatoria 135 116 1.07 139 116 0.83 151 142 0.94 139 116 0.98 116 99 0.85 Western Equatoria 161 161 1.25 169 179 1.06 167 197 1.19 131 133 1.00 113 117 1.04
South Sudan 1 141 790 0.69 1 173 892 0.76 1 014 1 015 1.00 1 015 912 0.90 940 826 0.88

- 27 -
B. Mechanized sector South Sudan’s rainfed mechanized sector includes demarcated, large-scale farmers in Upper Nile with multiple aggregations of 500 feddan units (about 200 hectares) known as mushroor, in locations from Renk to Malakal; plus un-demarcated traditional farmers, who farm units up to 50 feddans (20 hectares) along-side the large-scale farmers, hiring their tractors and equipment. The sector also includes a rice scheme (Aweil Rice Scheme, Aweil West) and a mechanized sorghum area in Ton Chol, Aweil East, both located in Northern Bahr el Ghazal State. There are also mechanized areas in other states, particularly in Greater Equatoria, which are normally unaccounted for in assessments, as are the emerging commercial farms in Greater Bahr el Ghazal, expanding through the use of labour gangs, digging fields by hand or using animal traction. The area of mechanized farms in Upper Nile is at least ten times greater than all the other areas added together. The degree of mechanization is limited to land preparation and sowing seed using seed boxes placed over ubiquitous disc harrows. All other operations to harvesting are carried out by hand, with the exception, in previous years, of a few farmers using herbicides sourced from Kosti, the Sudan. This year, Task Force-led missions visited Renk, Melut and Aweil. Face-to-face and telephone interviews with the State Director of Agriculture and a practising farmer based in Renk suggest that, despite the conflict, mechanized farming was undertaken by locally-based farmers in Upper Nile. Positive contributing factors this year were:
Rainfall distribution was conducive to mechanized farming.
Sixty new tractors were supplied by GRSS.
Large-scale farmers in Renk received 8 x 200 litre drums/tractor unit from GRSS.
Smaller-scale farmers received ½ x 200 l drum/unit.
In Melut, the Task Force reported that farmers received four drums/tractor and 62 working tractors were identified- at 15 litres/hectares, using GRSS fuel alone the farmers might disc- harrow 3 300 hectares.
In Renk, 112 local farmers were registered in 2015 but no data were available regarding farmers registering this year, neither do we know if farmers from the north returned to farm as they did in 2013. In any event, the number does not include the undemarcated farmers, who, by definition are unregistered. The Renk-based Director of Agriculture estimates that 315 000 hectares of sorghum and sesame were sown in the mechanized sector in 2016. These numbers suggest a three-fold increase in tractor availability, which, given the security situation and the availability of finance for farming, seems unlikely. However, previous experience of the CFSAM team gained since 1995 confirms that farmers both sides of the border are resilient and persistent and that the border is porous and smuggled fuel may be available as are spare parts and labour. Production depends on timing and quality of cultivation, quality of seeds used, weeding frequency and pest and disease profiles. This year, that the rains were most conducive allowing access and supporting growth of both early and late sown crops. Farmers’ own seeds were available for sowing in July and August for the short-maturing improved sorghum varieties of Wad Ahmed, Gaddam el Hammam and Afargadamek that cover most of the planted area nowadays instead of the much long-maturing, local landrace Agono that dominated planting ten years ago. Weeding was conducted by labour gangs at SSP 750/feddan; and, apart from early flocks of Quelea quelea birds, pest challenges to the first sown crops were reported to be mild. However, the later sown crops will not be harvested before the migratory Quelea quelea bird threats in January. Consequently, the Director of Agriculture estimates only one-third (about 100 000 hectares) will be harvested for sorghum and some 2 000 hectares will be harvested for sesame. Using time series yield data, the overall yield of sorghum in the mechanized farms in all locations in Upper Nile is estimated at 44 100 tonnes being around 2 sacks/feddan (0.44 tonnes/hectare from 100 000 hectares) three times last year’s conservative estimate. Elsewhere, in late November/early December the Senior Consultant visited the Aweil Rice National Project and mechanized farmers using the rice basins for a) for rice (1 080 hectares) and b) for mechanized sorghum production (840 hectares); and Ton Chol (6 300 hectares) mechanized farming areas in Aweil East. With the ratoons expected in January, Ton Chol is expected to produce 6 700 tonnes of sorghum; the old rice basins located between Udham and Aweil planted to sorghum are expected to have produced 1 260 tonnes; and the combined rice fields are expected to produce 1 328 tonnes from 1 080 hectares.
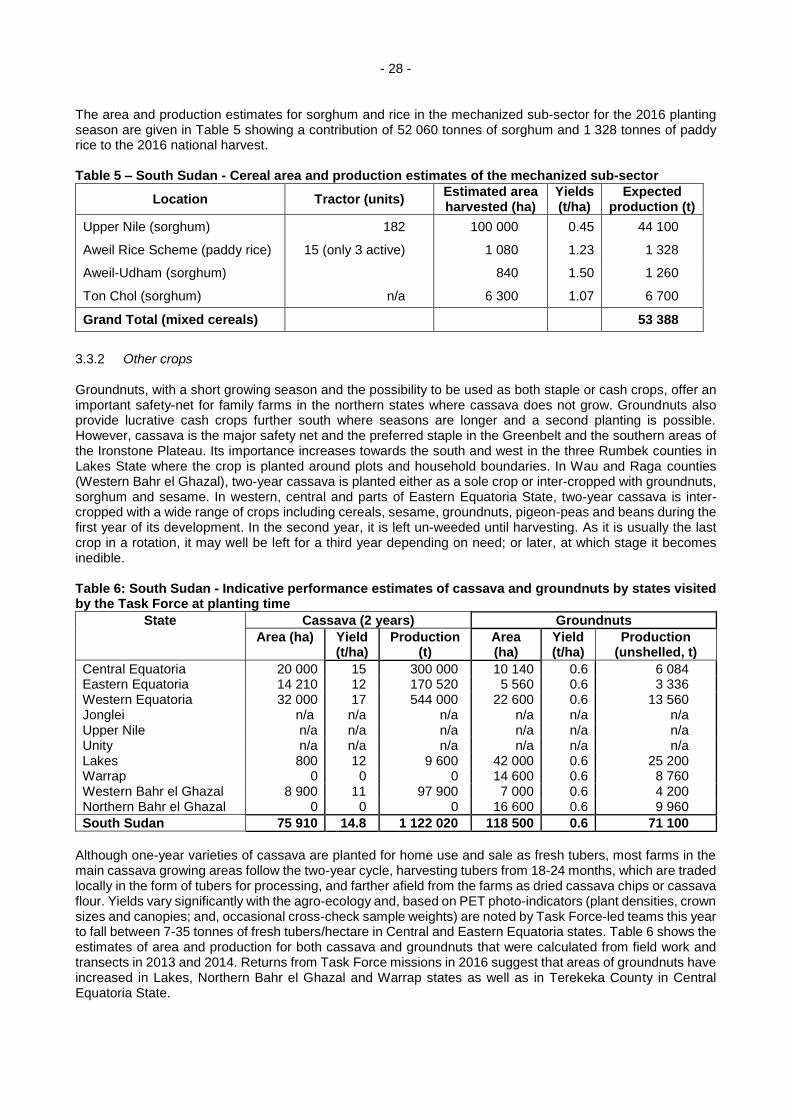
- 28 -
The area and production estimates for sorghum and rice in the mechanized sub-sector for the 2016 planting season are given in Table 5 showing a contribution of 52 060 tonnes of sorghum and 1 328 tonnes of paddy rice to the 2016 national harvest. Table 5 – South Sudan - Cereal area and production estimates of the mechanized sub-sector
Location Tractor (units) Estimated area harvested (ha)
Yields (t/ha)
Expected production (t)
Upper Nile (sorghum) 182 100 000 0.45 44 100
Aweil Rice Scheme (paddy rice) 15 (only 3 active) 1 080 1.23 1 328
Aweil-Udham (sorghum) 840 1.50 1 260
Ton Chol (sorghum) n/a 6 300 1.07 6 700
Grand Total (mixed cereals) 53 388
3.3.2 Other crops Groundnuts, with a short growing season and the possibility to be used as both staple or cash crops, offer an important safety-net for family farms in the northern states where cassava does not grow. Groundnuts also provide lucrative cash crops further south where seasons are longer and a second planting is possible. However, cassava is the major safety net and the preferred staple in the Greenbelt and the southern areas of the Ironstone Plateau. Its importance increases towards the south and west in the three Rumbek counties in Lakes State where the crop is planted around plots and household boundaries. In Wau and Raga counties (Western Bahr el Ghazal), two-year cassava is planted either as a sole crop or inter-cropped with groundnuts, sorghum and sesame. In western, central and parts of Eastern Equatoria State, two-year cassava is inter-cropped with a wide range of crops including cereals, sesame, groundnuts, pigeon-peas and beans during the first year of its development. In the second year, it is left un-weeded until harvesting. As it is usually the last crop in a rotation, it may well be left for a third year depending on need; or later, at which stage it becomes inedible. Table 6: South Sudan - Indicative performance estimates of cassava and groundnuts by states visited by the Task Force at planting time
State Cassava (2 years) Groundnuts
Area (ha) Yield (t/ha)
Production (t)
Area (ha)
Yield (t/ha)
Production (unshelled, t)
Central Equatoria 20 000 15 300 000 10 140 0.6 6 084 Eastern Equatoria 14 210 12 170 520 5 560 0.6 3 336 Western Equatoria 32 000 17 544 000 22 600 0.6 13 560 Jonglei n/a n/a n/a n/a n/a n/a Upper Nile n/a n/a n/a n/a n/a n/a Unity n/a n/a n/a n/a n/a n/a Lakes 800 12 9 600 42 000 0.6 25 200 Warrap 0 0 0 14 600 0.6 8 760 Western Bahr el Ghazal 8 900 11 97 900 7 000 0.6 4 200 Northern Bahr el Ghazal 0 0 0 16 600 0.6 9 960
South Sudan 75 910 14.8 1 122 020 118 500 0.6 71 100
Although one-year varieties of cassava are planted for home use and sale as fresh tubers, most farms in the main cassava growing areas follow the two-year cycle, harvesting tubers from 18-24 months, which are traded locally in the form of tubers for processing, and farther afield from the farms as dried cassava chips or cassava flour. Yields vary significantly with the agro-ecology and, based on PET photo-indicators (plant densities, crown sizes and canopies; and, occasional cross-check sample weights) are noted by Task Force-led teams this year to fall between 7-35 tonnes of fresh tubers/hectare in Central and Eastern Equatoria states. Table 6 shows the estimates of area and production for both cassava and groundnuts that were calculated from field work and transects in 2013 and 2014. Returns from Task Force missions in 2016 suggest that areas of groundnuts have increased in Lakes, Northern Bahr el Ghazal and Warrap states as well as in Terekeka County in Central Equatoria State.

- 29 -
The CCMCs confirmed the importance of both groundnut and cassava crops. However, whereas cassava is likely to have withstood the upheavals caused by displacement during the second season in Yei, Morobo and Lainya counties, it is unlikely that the second season groundnut planting have attained the same good levels as last year. Regarding other field crops grown at household level, information on oilseeds (sesame, safflower and sunflower) is too scanty to try deriving production figures. As in 2015, the mechanized sector in Upper Nile State is expected to produce some 7 000 tonnes of sesame from 23 000 feddans (9 600 hectares) that is likely to be purchased immediately from the field by Sudanese traders. 3.3.3 Livestock The most recent documented estimate of cattle numbers made by FAO in 2009, suggests a cattle population of 11.7 million head, very similar to contemporary population estimates of sheep and goats at around 12-13 million head for each species. The CFSAM observations in 2013 suggested that, for cattle, 1) the age at first calving is at least three years; 2) male store or slaughter stock are retained for several years (five years) before sale or slaughter; and, 3) adult death rates range from 5-10 percent/annum. In such conditions, breeding cows are unlikely to make up more than 30-35 percent of estimated cattle numbers. Furthermore, with calving intervals of three years noted by Task Force teams, and a potentially high mortality rate of young stock (25 percent), any unit of 100 head is unlikely to produce more than eight viable heads per annum. In a herd of long-standing, this suggests that no more than four mature cows and four males (50 percent sex ratio) enter the herd each year, a replacement rate that approximately matches herd adult mortality and off-take that may occur. In this case, the conservative livestock population growth rates determined for use in Ethiopia for cattle at 0.06 percent may also be applied for South Sudan for the past years. Using this conservative figure, the cattle population estimated at 11 823 700 in the Draft FAO Livestock Strategy Paper in 2014 to increases to 11 830 800 head in 2016, distributed as shown in Table 7. Table 7: South Sudan - Cattle estimates by State, 2014-2016 (thousands)
State 2014 2015 2016
Central Equatoria 885 885.5 886.0 Eastern Equatoria 895 895.5 896.0 Western Equatoria 679 679.4 679.8 Jonglei 1 475 1 475.8 1 476.7 Upper Nile 989 989.5 990.1 Unity 1 188 1 188.7 1 189.4 Lakes 1 320 1 320.7 1 321.5 Warrap 1 539 1 539.9 1 540.8 Western Bahr el Ghazal 1 257 1 257.7 1 258.5 Northern Bahr el Ghazal 1 590 1 590.9 1 591.9
South Sudan 11 817 11 823.7 11 830.8
Source: CFSAM, 2013 and Draft FAO Livestock Strategy Paper, 2014. The same Draft FAO Livestock Strategy Paper estimates the population of small ruminants at 13 974 135 head for goats and 12 611 522 head for sheep, providing a combined small ruminant population of about 26.6 million head, over 2 million greater than the figures in the 2013 CFSAM report. The validity of these theoretical livestock data, particularly the distribution by State, is difficult to assess. In 2010, Benke, R and H Osman, IGAD LPI Working Paper No. 1 – 12, “The Contribution of Livestock to the Sudanese Economy”; estimated livestock numbers in South Sudan to be: cattle 12 411 369; sheep 12 941 632; and goats 12 988 859 head compared to the Sudan (northern states only before independence) cattle 29 210 477; sheep 30 332 270; goats 38 743 585 and camels 4 520 999. Given the transhumant nature of the grazing systems which crosses the borders of states, the spectre of double-counting should not be ignored. However, as the numbers are based on the Sudan’s Ministry of Animal Resources and Forestry extrapolation from data collected in 1976 based on a herd growth model which uses stable rates of herd growth irrespective of the effects on livestock numbers of i) civil wars; ii) changing access to resources; iii) the impact of major droughts and fluctuating weather; iv) localized insecurity; v) earlier rinderpest epidemics and other significant disease outbreaks; and vi) widely fluctuating market conditions; the numbers must be considered with caution on both sides of the international frontier. Regarding South Sudan, since the conflict started in 2014, enforced and voluntary livestock migration from the conflict-affected states into different states and across international borders; and, redistribution through systemic theft within the states by the warring forces has reportedly taken place on an enormous scale,

- 30 -
affecting the location and even the very existence of thousands of head. This looting seems to have been particularly prominent in Unity State and Jonglei, but its effect on extant livestock population is hard to be assessed during field interviews. Given the nature of CFSAMs, Task Force mission teams collect information from settled livestock systems and those elements of transhumant herds and flocks kept close to the steadings. In 2016, the case study returns for livestock herds and flocks of the agro-pastoralists interviewed by Task Force teams during all missions suggest a) low calving percentages at 30 percent; b) high death rates of young stock (neonatal-to-weaning) quoted at 15-40 percent. However, the PET Body Condition Score (BCS) modes of all adult cattle are noted to be at BCS 3 or above, with very few individual PET BCS 1s. This suggests all classes of stock are in good body condition due to abundant forages and plenty of water through the season until December. This year, no attempt has been made to extrapolate changes in population for small ruminants due to fewer returns containing indicators in the case studies conducted by the Task Force teams. Regarding livestock diseases, in common with previous years, incidents of endemic diseases reported in Task Force case studies and key-informant interviews include: Haemorrhagic Septicaemia, Black-Quarter, Contagious Bovine Pleuropneumonia, Anthrax, East Coast Fever, peste des petits ruminants, Sheep Pox, Newcastle Disease, Contagious Caprine Pleuropneumonia, Foot-and-Mouth Disease, Lumpy-Skin Disease and the presence of internal and external parasites. However, this year none of these incidents were described as outbreaks, neither have any cases been confirmed by laboratory analyses. To counteract the threats of such disease outbreaks, exacerbated by the changes to movements noted above, in 2014 FAO provided about 2.5 million doses of vaccines for domestic livestock (some 7 percent of the estimated livestock population) to NGOs for distribution up January 2015. According to Table 8, during period (a) January 2014-January 2015, 45 percent of the vaccines went to the three conflict-affected states in Greater Upper Nile with 36 percent in Greater Bahr el Ghazal. Similar data have been provided to the Task Force for distributions in period (b) October 2015-October 2016). Twice as many animals appear to have been vaccinated during the latter period during (b) with only 36 percent in Greater Upper Nile and some 58 percent of the vaccinations given in Greater Bahr el Ghazal. No developments are noted regarding production from non-ruminant livestock. Poultry and pig production occurs at backyard level. Millions of heads of poultry are kept free-range at household level and fed handfuls of grain daily. High levels of poultry mortality are the norm rather than the exception. Any development from small-scale laying/broiler or pig production units into commercial enterprises remains undocumented, but their emergence will depend on identifying reliable sources of locally-produced carbohydrates. A maize-growing farm with a processing unit and over 1 000 out-growers previously visited by CFSAM teams in consecutive years in Kajo Keji County in Central Equatoria State is an example of such an enterprise looking to diversify in such directions, however, performance of the unit this year was not determined by the Task Force as access to Kajo Keji County was prevented by UN security regulations. Table 8: South Sudan - Vaccines distributed to NGOs (a) from January 2014 to January 2015 and (b) from October 2015 to October 2016
State Cattle
(a) Sheep/goats
(a) Total Percent
Cattle (b)
Sheep/goats (b)
Total Percent
Abyei 40 500 60 000 100 500 4.0 n/a n/a n/a n/a Warrap 268 000 65 000 333 000 13.3 492 539 230 762 723 301 13 N. B el Gh. 270 000 103 100 373 100 14.8 1 320 627 684 024 200 4651 37 W. B el Gh. 15 000 0 15 000 0.6 166 933 69 806 236 739 4 Lakes 127 500 55 000 182 500 7.3 153 172 49 232 202 404 4 Upper Nile 145 000 130 000 275 000 10.9 142 006 103 875 245 881 5 Unity 185 000 158 900 343 900 13.7 318 783 187 007 505 790 9 Jonglei 341 500 230 000 571 500 22.7 305 740 344 433 650 173 12 Central 70 000 25 000 95 000 3.8 164 693 132 286 296 979 6 W. Equatoria 37 500 10 000 47 500 1.9 19 905 69 806 89 711 2 E. Equatoria 75 000 101 000 176 000 7.0 237 728 193 026 430 754 8
South Sudan 1 575 000 938 000 2 513 000 100.0 3 304 126 2 064 257 5 386 383 100

- 31 -
4. CEREAL SUPPLY/DEMAND SITUATION
4.1 Cereal balance Total cereal consumption in 2017 is estimated slightly above 1.32 million tonnes, using a projected 2017 mid-year population of 11.96 million and an average per capita consumption of about 110 kg of cereals per year. Estimates of cereal per capita consumption are based on information provided by the 2009 National Baseline Household Survey (NBHS) at state level and adjusted at county level to take into account the differences between urban and rural areas and the relative importance in local diets of other crops (notably cassava and groundnuts), livestock and wild foods. In particular, the estimated production of at least 1 million tonnes of fresh cassava and over 80 000 tonnes of unshelled groundnuts is expected to provide some 300 000 tonnes and 71 000 tonnes of grain equivalents, respectively, bringing the estimated average per capita consumption to 142 kg of cereal equivalent per year, suggesting a level fairly close to the estimates for neighbouring countries. With an estimated net cereal production from the traditional sector of about 826 000 tonnes, a cereal deficit of about 500 000 tonnes is forecast for the 2017 marketing year, over 30 percent greater than last year’s deficit of about 380 000 tonnes. Table 9 summarizes the estimated cereal supply situation for each previously designated State in 2017 and compares it with the Mission’s estimates for the previous three years. The largest shortfall is forecast in the Greater Upper Nile Region, with an aggregate 2017 cereal deficit of about 300 000 tonnes, similar to 2016. However, the situation is particularly worrisome in the Greater Equatoria Region, where the Region passed from producing a moderate surplus in past years to an aggregate deficit of about 134 000 tonnes. Here, traditional food surplus-producing areas of Yei, Morobo, Lainya and Magwi counties, that together accounted for a surplus of about 85 000 tonnes in 2016, are estimated to have a reduction in output by about 120 000 tonnes, which will determine an aggregate food deficit of about 37 000 tonnes. Countrywide, as in 2016, the major area of food deficit is expected to be Juba County where about 60 000 tonnes of cereals, representing almost one-fifth of the total national food gap, are needed to cover the food requirements of mainly urban households. A moderate deficit of about 19 000 tonnes is estimated in Western Bahr el Ghazal State due to a significant decline in output, especially in Wau and Raga counties. Compared to 2016, the food deficit in 2017 is likely to decline in Lakes and Warrap states, due to better security conditions that allowed farmers to expand the planted area by between 10 and 50 percent in most counties. Table 9: South Sudan - Estimated cereal surplus/deficit, 2014-2017
State 2014 2015 2016 2017
Central Equatoria -46 077 25 196 13 901 -89 076 Eastern Equatoria -18 383 6 338 -22 302 -39 828 Western Equatoria 69 657 86 767 23 258 -4 619 Jonglei -101 205 -149 738 -147 126 -150 789 Upper Nile -56 182 -78 942 -74 311 -72 644 Unity -64 347 -80 298 -82 608 -81 529
Lakes -48 553 -30 812 -35 143 -17 550
Warrap -50 149 -4 907 -18 370 4 684 Western Bahr el Ghazal -11 965 16 044 -2 918 -18 987 Northern Bahr el Ghazal -67 214 -38 315 -35 120 -28 462
South Sudan -394 418 -248 666 -380 739 -498 801
Cereal production from the rainfed large and small mechanized sector in Northern Bahr el Ghazal and Upper Nile is expected to provide an additional 53 388 tonnes of cereals. Although some sorghum is expected to be traded across the border in the Sudan, some amounts are expected to be marketed internally, depending on security conditions, transportation costs compounded by local “taxes” imposed on traders moving grains to major markets and fluctuations of exchange rates between currencies in the Sudan and South Sudan. As in past years, this production represents an interesting option for local purchases by international institutions providing food assistance in the localities of production. 4.2 Cereal and livestock markets Prices of cereals started to soar in late 2015 on account of local currency devaluation, a general economic downturn and widespread insecurity. In Juba, prices of maize and sorghum tripled between November 2015 and June 2016, while prices of wheat flour more than doubled over the same period. In July 2016, the already
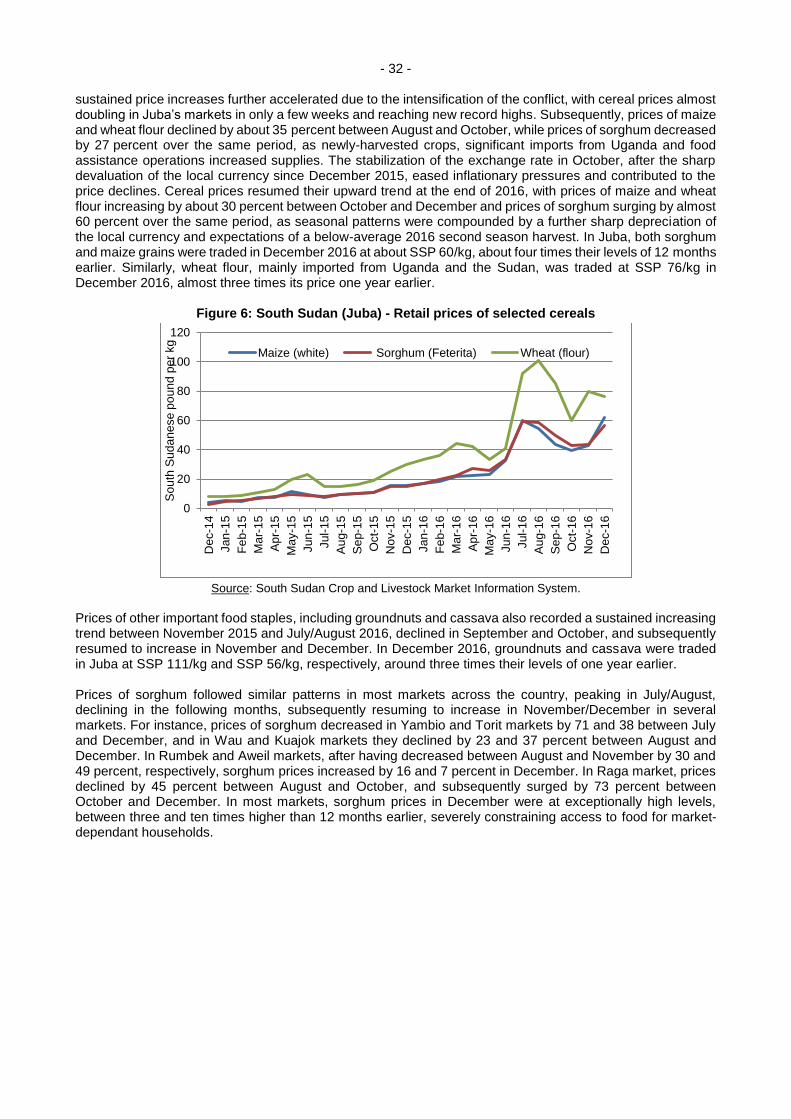
- 32 -
sustained price increases further accelerated due to the intensification of the conflict, with cereal prices almost doubling in Juba’s markets in only a few weeks and reaching new record highs. Subsequently, prices of maize and wheat flour declined by about 35 percent between August and October, while prices of sorghum decreased by 27 percent over the same period, as newly-harvested crops, significant imports from Uganda and food assistance operations increased supplies. The stabilization of the exchange rate in October, after the sharp devaluation of the local currency since December 2015, eased inflationary pressures and contributed to the price declines. Cereal prices resumed their upward trend at the end of 2016, with prices of maize and wheat flour increasing by about 30 percent between October and December and prices of sorghum surging by almost 60 percent over the same period, as seasonal patterns were compounded by a further sharp depreciation of the local currency and expectations of a below-average 2016 second season harvest. In Juba, both sorghum and maize grains were traded in December 2016 at about SSP 60/kg, about four times their levels of 12 months earlier. Similarly, wheat flour, mainly imported from Uganda and the Sudan, was traded at SSP 76/kg in December 2016, almost three times its price one year earlier.
Figure 6: South Sudan (Juba) - Retail prices of selected cereals
Source: South Sudan Crop and Livestock Market Information System.
Prices of other important food staples, including groundnuts and cassava also recorded a sustained increasing trend between November 2015 and July/August 2016, declined in September and October, and subsequently resumed to increase in November and December. In December 2016, groundnuts and cassava were traded in Juba at SSP 111/kg and SSP 56/kg, respectively, around three times their levels of one year earlier. Prices of sorghum followed similar patterns in most markets across the country, peaking in July/August, declining in the following months, subsequently resuming to increase in November/December in several markets. For instance, prices of sorghum decreased in Yambio and Torit markets by 71 and 38 between July and December, and in Wau and Kuajok markets they declined by 23 and 37 percent between August and December. In Rumbek and Aweil markets, after having decreased between August and November by 30 and 49 percent, respectively, sorghum prices increased by 16 and 7 percent in December. In Raga market, prices declined by 45 percent between August and October, and subsequently surged by 73 percent between October and December. In most markets, sorghum prices in December were at exceptionally high levels, between three and ten times higher than 12 months earlier, severely constraining access to food for market-dependant households.
0
20
40
60
80
100
120
Dec-1
4
Jan
-15
Fe
b-1
5
Ma
r-1
5
Ap
r-15
Ma
y-1
5
Jun
-15
Jul-
15
Au
g-1
5
Se
p-1
5
Oct-
15
Nov-1
5
Dec-1
5
Jan
-16
Fe
b-1
6
Ma
r-1
6
Ap
r-16
Ma
y-1
6
Jun
-16
Jul-
16
Au
g-1
6
Se
p-1
6
Oct-
16
Nov-1
6
Dec-1
6
So
uth
Su
da
ne
se
po
un
d p
er
kg
Maize (white) Sorghum (Feterita) Wheat (flour)

- 33 -
Figure 7: South Sudan - Retail prices of white sorghum in selected markets
Source: World Bank.
Food prices normally show a marked volatility and differ significantly among markets in the country as a consequence of the poorly-developed road network, the high level of fuel prices and transport costs which include the economic losses due to the high risk of looting along the main roads. Most roads, including those in the western corridor connecting Juba with Rumbek to Wau up to Aweil, are subject to significant constraints during the rainy season (May-October) when they become often impassable compromising the stability of supply flows. Transportation costs are in general more than proportional to the distance from markets, due to multiple taxation (both official and unofficial), time spent at customs, check points and road blocks as well as increasing risks of looting. The intensification of the conflict during 2016 and its differential impact on various parts of the country further exacerbated price volatility and market fragmentation. Most local economies, in particular those in conflict-affected areas, have become so shallow that market prices react quickly and disproportionally to any contingent and short-lived situations such as a one-day road block, an isolated episode of violence or the delivery of food assistance even in limited quantities. For instance, as of December 2016, prices of 1 kg of sorghum varied from a low SSP 12.5 in Maridi, to about SSP 30 in Yambio and Torit, to SSP 42-48 in Raga, Kuajok and Aweil, to about SSP 57 in Wau and Juba, up to a record high SSP 61 in Rumbek. Difficult access to fuel and its high price also played an important role in determining food price differentials. Fuel availability has been often very limited in 2016 and average prices per litre in the parallel market have been quite different across the country, varying (in the second week of October) from SSP 35-40 in Juba, Torit and Bor, to SSP 130-167 in Wunrok, Yida and Aweil, up to SSP 200 in Bentiu. Compared to their levels of 12 months earlier, diesel prices in October were almost six times higher in Juba and up to eight times higher across the country.
0
20
40
60
80
100
120
De
c-1
4
Jan
-15
Fe
b-1
5
Ma
r-1
5
Ap
r-15
Ma
y-1
5
Jun
-15
Jul-
15
Au
g-1
5
Se
p-1
5
Oct-
15
No
v-1
5
De
c-1
5
Jan
-16
Fe
b-1
6
Ma
r-1
6
Ap
r-16
Ma
y-1
6
Jun
-16
Jul-
16
Au
g-1
6
Se
p-1
6
Oct-
16
No
v-1
6
De
c-1
6
So
uth
Su
da
ne
se
po
un
d p
er
kg
Yambio Torit Rumbek Raga Maridi Kuajok Aweil
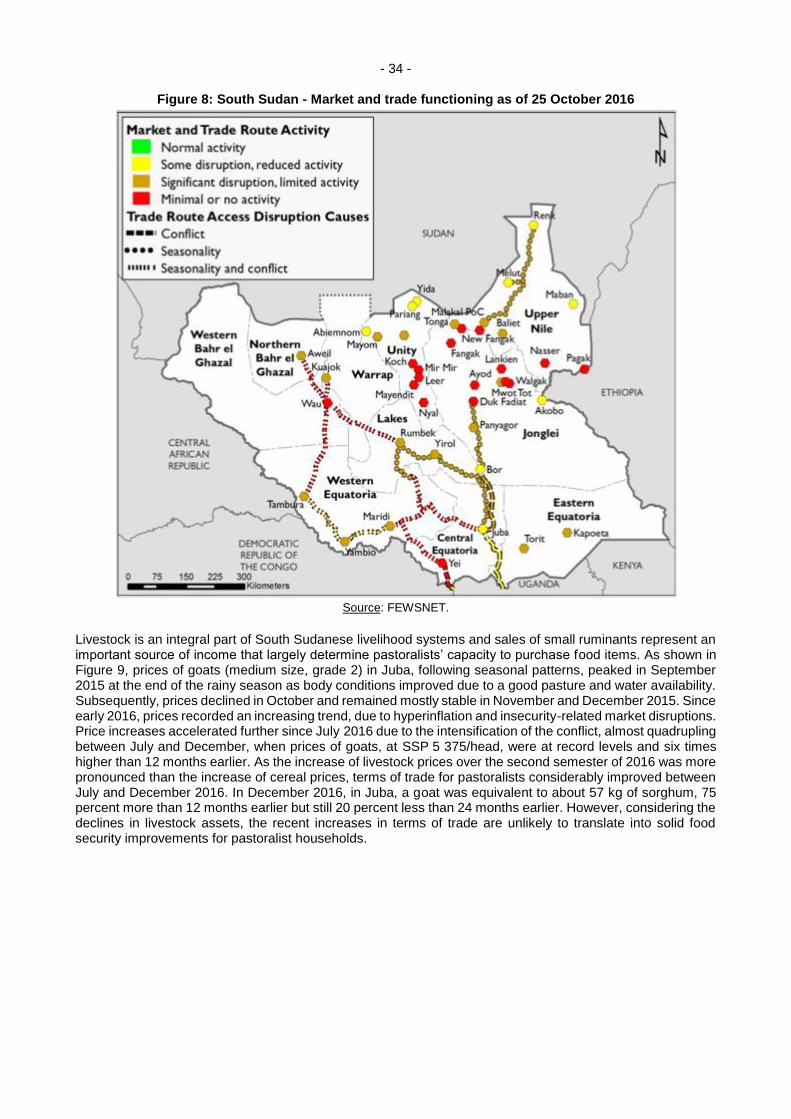
- 34 -
Figure 8: South Sudan - Market and trade functioning as of 25 October 2016
Source: FEWSNET.
Livestock is an integral part of South Sudanese livelihood systems and sales of small ruminants represent an important source of income that largely determine pastoralists’ capacity to purchase food items. As shown in Figure 9, prices of goats (medium size, grade 2) in Juba, following seasonal patterns, peaked in September 2015 at the end of the rainy season as body conditions improved due to a good pasture and water availability. Subsequently, prices declined in October and remained mostly stable in November and December 2015. Since early 2016, prices recorded an increasing trend, due to hyperinflation and insecurity-related market disruptions. Price increases accelerated further since July 2016 due to the intensification of the conflict, almost quadrupling between July and December, when prices of goats, at SSP 5 375/head, were at record levels and six times higher than 12 months earlier. As the increase of livestock prices over the second semester of 2016 was more pronounced than the increase of cereal prices, terms of trade for pastoralists considerably improved between July and December 2016. In December 2016, in Juba, a goat was equivalent to about 57 kg of sorghum, 75 percent more than 12 months earlier but still 20 percent less than 24 months earlier. However, considering the declines in livestock assets, the recent increases in terms of trade are unlikely to translate into solid food security improvements for pastoralist households.

- 35 -
Figure 9: South Sudan (Juba) - Retail prices of goats and terms of trade (kg of sorghum per one goat)
Source: South Sudan Crop and Livestock Market Information System.
Casual labourers have also experienced some improvements in their ability to buy cereals with their daily earning in recent months. The Terms of Trade of the daily wage rate against white maize in Juba increased by 56 percent in September 2016 compared to the previous month, but remained well below their levels of one year earlier. In September 2016, in Juba, one day of causal labour was equivalent to 1.4 kg of maize, about half than in the same month of the previous year. 5. HOUSEHOLD FOOD SECURITY SITUATION
5.1 Methodology
This section looks at food security trends in South Sudan, the evolution of its drivers, and how they relate to the agricultural production data presented in previous sections. The analysis is based on data from the Food Security and Nutrition Monitoring System (FSNMS) run by WFP and partners (FSTS, UNICEF, FAO, MOAF, NBS, RRC and NGOs). It opens with the overall food security diagnostics from the IPC analysis undertaken in January 2017. The FSNMS was initiated in 2010 (then known as FSMS) and has established itself as the crucial source of information on the food security situation in South Sudan. The FSNMS used to be conducted three rounds per year, February, June and October/November, but more recently is being conducted twice per year. These two rounds are conducted in October-November, right after or at harvest time, and June, at the peak of the lean season. Each FSNMS round covers all ten states. Currently, the survey is based on a sampling plan provided by the National Bureau of Statistics in order to obtain statistically representative results by each State. A two-stage cluster design was employed with the first stage involving selection of cluster/enumeration areas and the second stage involving selection of households. A total of 351 clusters were thus selected with 15 households from each cluster. Thus, the sample covered a total of 5 175 households with an estimated 5 192 children under the age of five in those households. By late 2016, 19 rounds of data collection had taken place with the latest round conducted on December 2016, providing a solid basis to distinguish the effects of seasonality from those of shocks. It is important to note that insecurity constraints related to the conflict situation have occasionally changed the survey dates and actually prevented a couple of survey rounds from taking place. Some of the most insecure areas have remained inaccessible to teams – this is of particular concern for Unity State, where is the most severe food insecurity situation. Teams have not been able to reach the worst affected areas and the results for this Region are unlikely to properly reflect the seriousness of the situation.
0
20
40
60
80
100
120
140
0
1000
2000
3000
4000
5000
6000
De
c-1
4
Jan
-15
Fe
b-1
5
Ma
r-1
5
Ap
r-15
Ma
y-1
5
Jun
-15
Jul-
15
Au
g-1
5
Se
p-1
5
Oct-
15
No
v-1
5
De
c-1
5
Jan
-16
Fe
b-1
6
Ma
r-1
6
Ap
r-16
Ma
y-1
6
Jun
-16
Jul-
16
Au
g-1
6
Se
p-1
6
Oct-
16
No
v-1
6
De
c-1
6
kg
of so
rgh
um
pe
r g
oa
t h
ea
d
SS
P p
er
go
at h
ea
d
Goat (medium size, grade 2) kg of sorghum per goat

- 36 -
5.2 Main drivers of food insecurity in 2017
The conflict has been the main determinant of the food security patterns during 2017. Its spread out of the Greater Upper Nile Region into other regions of the country, namely the productive areas of the Greenbelt led to decreases in national crop production while its disruption of trade routes and commodity flows coupled with the fall in the price of oil led to sharp rises in market prices. The resulting negative impacts on food security are widespread across the country. Conflict in 2017 – The major factor influencing the general food security situation during 2017 remains the violent conflict that started in late December 2013. Not only this has not been resolved, the intensity of the conflict increased in mid-2016 (July) and is continuing into 2017. While conflict affected mostly the Greater Upper Nile Region (states of Upper Nile, Unity and Jonglei) during the initial stage of the conflict. However, this has spread out across the country and in particular spread into the major producing areas of the country, such as Western and Central Equatoria and neighbouring areas of Eastern Equatoria. Western Bahr el Ghazal has also been affected by fighting. These situations have geographically wider repercussions: disruption of farming leads to drops in national crop production, while its impacts on markets and trade routes lead to problems in the supply of staple foods to the more remote areas of the country. Crop Production in 2016 – As reported in Chapter 3, planted area dropped by 7.4 percent, while gross crop yield decreased by 3 percent relative to last year. This was due mostly to the expansion of conflict into the most productive Greenbelt regions: increased insecurity and violence since July led to displacements of farmers and disruption of farming activities. Although areas untouched by direct conflict saw increases in area planted and in crop yield, but not enough to compensate losses from high productivity regions – overall national crop production decreased by just under 10 percent relative to last year’s production. This leads to a cereal deficit of just under 500 000 tonnes, worse than last year’s deficit of about 380 000 tonnes. The conflict-affected regions of Greater Upper Nile contribute the most for the deficit, but this season only Warrap was able to post a modest surplus. Market Prices – Conflict has continued to affect the supply of commodities to households through large-scale disruption of trade flows into and within South Sudan. Prices had been increasing since late 2015 and the intensification and expansion of the conflict in July 2016, led to further sharp rises in cereal prices, with a five to six-fold increase in from mid-2015 to mid-2016. Prices declined in October, but started rising again from November onwards. Prices in late 2016 and early 2017 were again exceptionally high. Population Displacements: IDPs, Refugees – A major outcome of the conflict was the displacement of over 3 million people from which 1.85 million remain in the country and 1.2 million fleeing into neighbouring countries (see section 2.1 for details). Most IDPs (1.2 million) remained within the conflict states, presenting an additional demand for food while largely not being able to farm and produce food. The remainder are in the Greater Equatoria Region and in Western Bahr el Ghazal. The country also hosts close to one-quarter of a million refugees from the Sudan with additional small numbers from the Democratic Republic of the Congo. 5.3 Current and projected IPC food security outcomes for 2017 In January 2017, the highest proportions of the population in IPC Phases 3 to 5 are in Northern Bahr el Ghazal and Unity states (over 50 percent). Later in May-July 2017, these proportions are expected to rise to over 60 percent, a situation that will also be seen in Jonglei. In Lakes and Western Bahr el Ghazal, these proportions are expected to rise to around 50 percent during the same period. From April 2016 (lean period) to January 2017 (post-harvest), the situation has only improved in Western Equatoria, Western Bahr-el-Ghazal, Lakes, Warrap, Upper Nile and Unity (though here levels remain the highest in the country), when the recent harvest should have led to a general improvement. Central Equatoria, Northern Bahr el Ghazal and Jonglei, saw a worsening of the situation. This becomes generalized across the country, with only Western Equatoria and Warrap experiencing an improvement compared to April 2016. These results show that the impact of conflict has a reach far beyond the regions where it actually takes place. The analysis in this section will show that impacts in Northern Bahr el Ghazal, for example, are linked to the high dependency of the population on market supplies and, therefore, to their very high vulnerability to the extreme staple food prices such as were verified in South Sudan during 2016 (see Section 4.2). Conflict is one of the major reasons behind the high food prices and as such is the major driver of food insecurity in Northern Bahr el Ghazal although this particular Region has been free from fighting and insecurity. Similarly, the looming famine in Unity State is tied to vulnerable populations being cut-off from food supplies provided by both markets and humanitarian assistance.

- 37 -
Figure 10: South Sudan – IPC situation map in January 2017 (left) and projected for May-July 2017 (right)
Table 10: South Sudan – Proportion of population in IPC phases 3, 4 and 5 in January 2017 and projected for May-July 2017
State Phase 3-5 January 2017 (percent)
Phase 3-5 May-July 2017 (percent)
Central Equatoria 36.5 35.4
Eastern Equatoria 35.6 38.1
Jonglei 40.1 65.6
Lakes 23.8 54.8
Northern Bahr el Ghazal 52.2 62.4
Unity 54.7 65.3
Upper Nile 16.3 39.7
Warrap 17.9 22.8
Western Bahr el Ghazal 15.6 49.5
Western Equatoria 7.8 17.7
South Sudan 32.3 46.7
Source: http://www.ipcinfo.org/fileadmin/user_upload/ipcinfo/docs/IPC_South_Sudan_Key%20Messages_Feb2017.pdf IPC phases are determined based on a range of indicators related to food consumption levels, livelihoods changes, nutritional status, and mortality. The next sections explore the drivers and mechanisms behind the situation described above.
5.4 Evolution of the food security situation using the CARI approach The FSNMS surveys use the Consolidated Approach for Reporting of food security Indicators (CARI) approach to assess food security. The CARI approach is based on the following components: 1. Food consumption, measured by the Food Consumption Score, based on dietary diversity and food
frequency. 2. The share of household expenditure on food. 3. The type/degree of livelihood coping strategies employed by households. Based on these factors, households are classified into four categories: severely food insecure, moderately food insecure, marginally food secure and food secure. The current method was introduced mid-way through the life of the FSNMS (June 2014). As the previous method considered a single “food secure” class, for inter-comparison across survey rounds the two food secure classes of the current method were grouped into a single “food secure” group. In the discussion that follows, the expression “food insecure” refers to the groups “severely food insecure” and “moderately food insecure” lumped together. In December 2016, just over 67 percent of the population of South Sudan were food insecure with over 14 percent severely food insecure (see Figure 11), a new record in the proportion of food insecure population
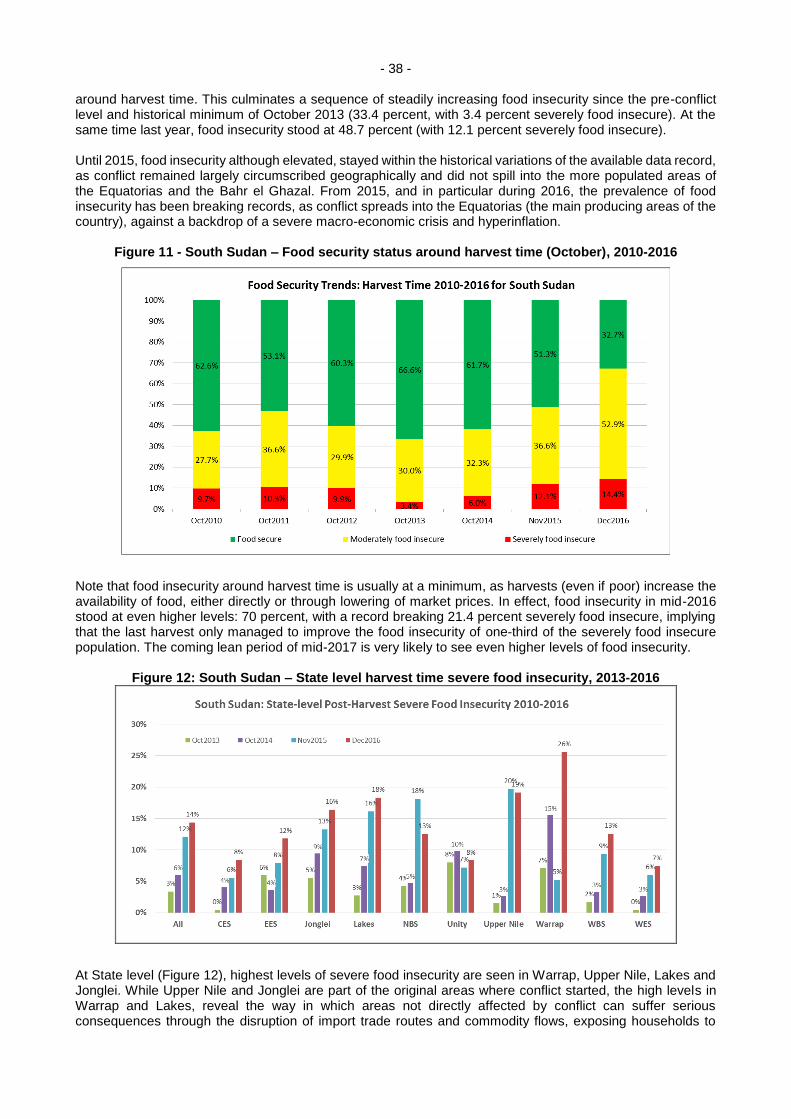
- 38 -
around harvest time. This culminates a sequence of steadily increasing food insecurity since the pre-conflict level and historical minimum of October 2013 (33.4 percent, with 3.4 percent severely food insecure). At the same time last year, food insecurity stood at 48.7 percent (with 12.1 percent severely food insecure). Until 2015, food insecurity although elevated, stayed within the historical variations of the available data record, as conflict remained largely circumscribed geographically and did not spill into the more populated areas of the Equatorias and the Bahr el Ghazal. From 2015, and in particular during 2016, the prevalence of food insecurity has been breaking records, as conflict spreads into the Equatorias (the main producing areas of the country), against a backdrop of a severe macro-economic crisis and hyperinflation.
Figure 11 - South Sudan – Food security status around harvest time (October), 2010-2016
Note that food insecurity around harvest time is usually at a minimum, as harvests (even if poor) increase the availability of food, either directly or through lowering of market prices. In effect, food insecurity in mid-2016 stood at even higher levels: 70 percent, with a record breaking 21.4 percent severely food insecure, implying that the last harvest only managed to improve the food insecurity of one-third of the severely food insecure population. The coming lean period of mid-2017 is very likely to see even higher levels of food insecurity.
Figure 12: South Sudan – State level harvest time severe food insecurity, 2013-2016
At State level (Figure 12), highest levels of severe food insecurity are seen in Warrap, Upper Nile, Lakes and Jonglei. While Upper Nile and Jonglei are part of the original areas where conflict started, the high levels in Warrap and Lakes, reveal the way in which areas not directly affected by conflict can suffer serious consequences through the disruption of import trade routes and commodity flows, exposing households to

- 39 -
impacts of high food prices. The plot also makes evident the rise in food insecurity since 2013 and how it spread out across the whole country. The food consumption component of the food security indicator (Figure 13) displays a similar behaviour but does emphasize the worsening situation developing from late 2013. The proportion of population with poor food consumption reached 44 percent nationally, with peaks in Lakes (60 percent) and Western Equatoria (56 percent).
Figure 13: South Sudan – State level harvest time poor food consumption, 2013-2016
5.5 Household staple food supply: markets vs household production This section analyses the relative importance of markets and own production in the supply of staple foods to the household and how this changes across the country and along the season. We focus on the sources of cereals and roots consumed by households as this covers the staple sources of food across the country. Other food items have fairly fixed supply sources – e.g. for vegetables, the major source is own production complemented by gathering, while fish, meat, oils and fats are overwhelmingly sourced from markets. Dairy products arise from own production only in states where livestock has a significant presence (Unity State, Warrap, Eastern Equatoria, Jonglei to a lesser degree). Figure 14: South Sudan - Relative importance of different sources of cereals and roots consumed by
households for June and December 2016
Figure 14 shows the contribution of different sources of cereal and roots to households in South Sudan in June and December 2016. As expected, the two dominant sources of cereals and roots for households are markets and the household’s own crop production. While in June (lean period) the majority of the households depend

- 40 -
on markets for their staple food supply, in December the households depend more on their own production as a result of the recent or ongoing harvest. This pattern has not changed since data collection began – at the national level, household crop production is the dominant supply of staples only in the period following the harvest and even then for no more than 60 percent of the households. Outside of this window, markets are always the dominant supplier (up to 75 percent of the households during the lean period), as most households exhaust their stocks a few months after the harvest. Food assistance became a noticeable contribution at the national aggregate level after the conflict started and agencies scaled up their assistance. It is now the main supplier of staples for about 5-15 percent of the households, depending on the time of the year. Figure 15: South Sudan - Relative importance of different sources of cereals and roots consumed by
households at State level in June 2016 (top) and December 2016 (bottom)
This overall picture hides very considerable variation between states (Figure 15).
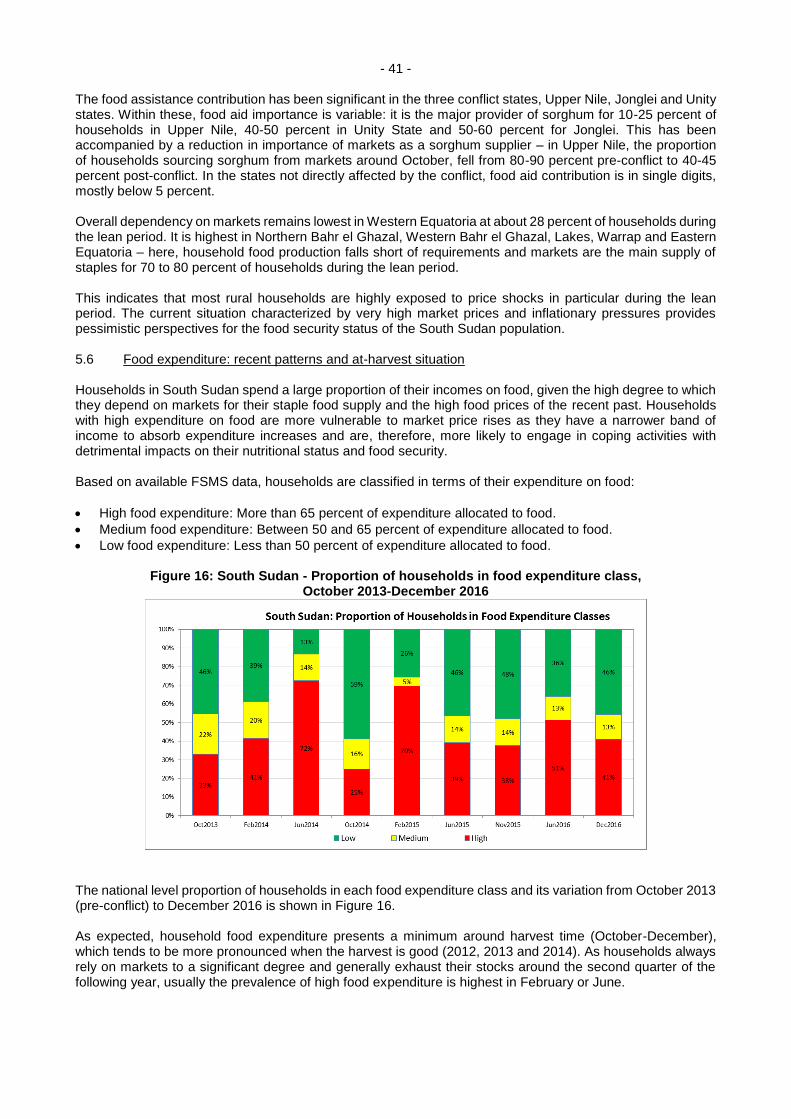
- 41 -
The food assistance contribution has been significant in the three conflict states, Upper Nile, Jonglei and Unity states. Within these, food aid importance is variable: it is the major provider of sorghum for 10-25 percent of households in Upper Nile, 40-50 percent in Unity State and 50-60 percent for Jonglei. This has been accompanied by a reduction in importance of markets as a sorghum supplier – in Upper Nile, the proportion of households sourcing sorghum from markets around October, fell from 80-90 percent pre-conflict to 40-45 percent post-conflict. In the states not directly affected by the conflict, food aid contribution is in single digits, mostly below 5 percent. Overall dependency on markets remains lowest in Western Equatoria at about 28 percent of households during the lean period. It is highest in Northern Bahr el Ghazal, Western Bahr el Ghazal, Lakes, Warrap and Eastern Equatoria – here, household food production falls short of requirements and markets are the main supply of staples for 70 to 80 percent of households during the lean period. This indicates that most rural households are highly exposed to price shocks in particular during the lean period. The current situation characterized by very high market prices and inflationary pressures provides pessimistic perspectives for the food security status of the South Sudan population. 5.6 Food expenditure: recent patterns and at-harvest situation Households in South Sudan spend a large proportion of their incomes on food, given the high degree to which they depend on markets for their staple food supply and the high food prices of the recent past. Households with high expenditure on food are more vulnerable to market price rises as they have a narrower band of income to absorb expenditure increases and are, therefore, more likely to engage in coping activities with detrimental impacts on their nutritional status and food security. Based on available FSMS data, households are classified in terms of their expenditure on food:
High food expenditure: More than 65 percent of expenditure allocated to food.
Medium food expenditure: Between 50 and 65 percent of expenditure allocated to food.
Low food expenditure: Less than 50 percent of expenditure allocated to food.
Figure 16: South Sudan - Proportion of households in food expenditure class, October 2013-December 2016
The national level proportion of households in each food expenditure class and its variation from October 2013 (pre-conflict) to December 2016 is shown in Figure 16. As expected, household food expenditure presents a minimum around harvest time (October-December), which tends to be more pronounced when the harvest is good (2012, 2013 and 2014). As households always rely on markets to a significant degree and generally exhaust their stocks around the second quarter of the following year, usually the prevalence of high food expenditure is highest in February or June.

- 42 -
The impact of the conflict on the supply of food and other commodities to local markets led to a sharp increase in overall food expenditure levels in mid-2014 and early 2015. The countrywide proportion of households with high food expenditure reached an all-time high of more than 70 percent (the previous record stood at 46 percent in June 2012 following the 2011 drought). The situation has been more stable since, but high food expenditure rates have increased again in mid and late 2016 relative to identical periods in 2015. Latest values in December 2016 (41 percent of households with high expenditure) were the highest for the post-harvest period, since records began. As far as the State-level picture is concerned, Northern Bahr el Ghazal stands out as the Region with the most extreme proportions of high food expenditure – 85 percent in June 2016 (over 90 percent in the previous two years). Western Bahr el Ghazal, Warrap and Eastern Equatoria also show significant proportion of high food expenditure between 60 to 70 percent during the lean period. In contrast, regions of higher crop production (Western and Central Equatoria) have rates of high food expenditure of around 30 percent during the lean period. Regions directly impacted by conflict (Unity State, Upper Nile, Jonglei) and where food assistance has plugged market supply gaps, show little variation in rates of high food expenditure during the lean period – these have remained at levels comparable to those of the pre-conflict period. 5.7 Household coping strategies The most widely and frequently-adopted coping strategies involve changes in food intake: eating less preferred foods, eating fewer meals, limiting portion size. The least favoured (and last resort) coping strategies are the sale or consumption of resources such as animals and seed stocks. In Figure 17, the three leftmost strategies imply a reduction in household assets, while the four rightmost strategies imply decreases in food intake.
Figure 17: South Sudan - Prevalence of different coping strategies in 2012-2016
Figure 17 makes clear the severe impact of conflict on households with a very sharp increase in the adoption of most coping strategies from mid-2014 onwards, after they had reached a minimum in late 2013 just before the start of hostilities. Another impact of conflict was the disappearance of what was a pronounced seasonal variation in the degree of coping (increase from a harvest time minimum to a lean period peak, as household food stocks decreased and market prices increased) – now coping takes place all year round at fairly high levels.
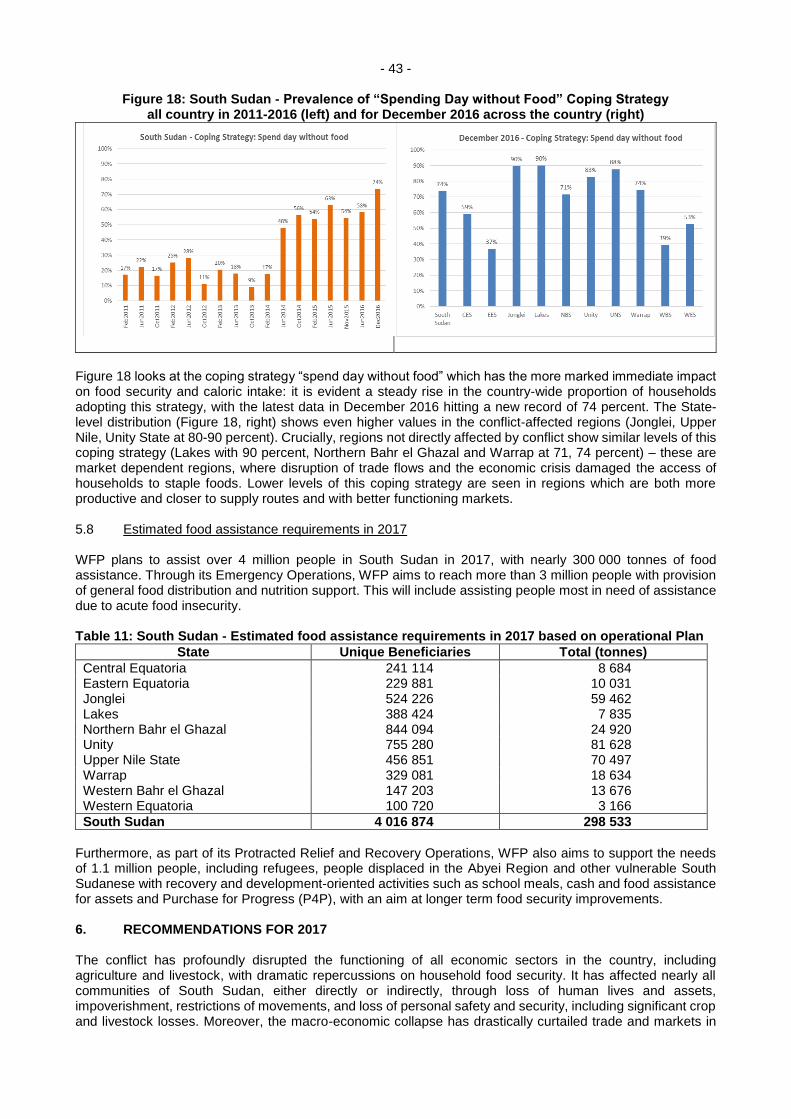
- 43 -
Figure 18: South Sudan - Prevalence of “Spending Day without Food” Coping Strategy
all country in 2011-2016 (left) and for December 2016 across the country (right)
Figure 18 looks at the coping strategy “spend day without food” which has the more marked immediate impact on food security and caloric intake: it is evident a steady rise in the country-wide proportion of households adopting this strategy, with the latest data in December 2016 hitting a new record of 74 percent. The State-level distribution (Figure 18, right) shows even higher values in the conflict-affected regions (Jonglei, Upper Nile, Unity State at 80-90 percent). Crucially, regions not directly affected by conflict show similar levels of this coping strategy (Lakes with 90 percent, Northern Bahr el Ghazal and Warrap at 71, 74 percent) – these are market dependent regions, where disruption of trade flows and the economic crisis damaged the access of households to staple foods. Lower levels of this coping strategy are seen in regions which are both more productive and closer to supply routes and with better functioning markets. 5.8 Estimated food assistance requirements in 2017 WFP plans to assist over 4 million people in South Sudan in 2017, with nearly 300 000 tonnes of food assistance. Through its Emergency Operations, WFP aims to reach more than 3 million people with provision of general food distribution and nutrition support. This will include assisting people most in need of assistance due to acute food insecurity. Table 11: South Sudan - Estimated food assistance requirements in 2017 based on operational Plan
State Unique Beneficiaries Total (tonnes)
Central Equatoria 241 114 8 684 Eastern Equatoria 229 881 10 031 Jonglei 524 226 59 462 Lakes 388 424 7 835 Northern Bahr el Ghazal 844 094 24 920 Unity 755 280 81 628 Upper Nile State 456 851 70 497 Warrap 329 081 18 634 Western Bahr el Ghazal 147 203 13 676 Western Equatoria 100 720 3 166
South Sudan 4 016 874 298 533
Furthermore, as part of its Protracted Relief and Recovery Operations, WFP also aims to support the needs of 1.1 million people, including refugees, people displaced in the Abyei Region and other vulnerable South Sudanese with recovery and development-oriented activities such as school meals, cash and food assistance for assets and Purchase for Progress (P4P), with an aim at longer term food security improvements. 6. RECOMMENDATIONS FOR 2017 The conflict has profoundly disrupted the functioning of all economic sectors in the country, including agriculture and livestock, with dramatic repercussions on household food security. It has affected nearly all communities of South Sudan, either directly or indirectly, through loss of human lives and assets, impoverishment, restrictions of movements, and loss of personal safety and security, including significant crop and livestock losses. Moreover, the macro-economic collapse has drastically curtailed trade and markets in

- 44 -
2016. As a result, the aggregate food gap has increased compared to the previous year and the commercial and humanitarian mechanisms put in place to fill that gap are facing serious challenges. Expanding domestic food production in 2017 is, therefore, essential to prevent escalating food insecurity in 2017 and beyond. Achieving a stable and lasting peace is the paramount recommendation in order to progress in terms of agricultural development and improving food security. While understanding the complexities of the prevailing situation during the process of reconciliation and peace-building, the following recommendations are made with hopes that the national peace deal will progress successfully for a better future of the South Sudanese people. Agriculture In order to strengthen domestic food production and reduce the food gap in 2017:
Provide support to 2017 cereal production by the timely provision of agricultural inputs and seed fairs.
Provide coordinated support to people returning to some conflict-affected areas to reconstruct their livelihood systems by facilitating access to land and agricultural inputs, while ensuring adequate food assistance to meet short-term needs.
Strengthen farmer and pastoral field schools to support the adoption and utilization of sustainable agro-pastoral production systems.
Continue improving crop assessment tools and methodology, with particular emphasis on strengthening assessment skills of agricultural officers at county level by broadening the involvement of local Government officers and NGOs in the annual crop assessment and seasonal monitoring exercise and by providing them with specific training.
Livestock
Deepening and expanding animal health interventions. In particular: (1) to train animal health professionals and to allow them to move freely in order to discharge their duties in all states; (2) to review vaccination campaigns and procedures according to established vaccination calendars; (3) to expand coverage of vaccination programmes, avoiding incorrect vaccine protocols and sub-optimal vaccination.
Re-establish access to seasonal grazing areas and routes that have been disrupted since the start of the conflict by supporting a process of negotiation amongst various herding groups.
Establish a livestock information system to monitor key indicators, including animal production, marketing, migration and health.
Markets
Closely monitoring food stocks and trade behaviours in the main markets and facilitating the distribution of food from surplus to deficit areas, taking into consideration local market dynamics, as well as along the main corridors for both commercial and humanitarian commodities.
Maintain and strengthen the market and price monitoring system in order to inform on the food availability and price situation in different markets across the country and allow timely intervention.
Expand the use of Cash Based Transfers (CBTs) in areas where markets are functioning to encourage supply and greater market stability through demand side stimulation.
Food security
Target food assistance to the most vulnerable households in the areas with the highest food deficits and with highest levels of food insecurity, especially in parts of Greater Upper Nile, Great Bahr el Ghazal and Eastern Equatoria. Given the high cereal deficit, hyperinflation and the prevailing insecurity in parts of the country, the level of household food insecurity is likely to be higher than the previous year. Thus, scaled-up efforts are required to support the populations most in need for assistance. Assistance, where appropriate, should be provided through food-for-asset activity and agriculture-based livelihood support programmes. These activities should aim to provide opportunities to rehabilitate livelihoods and strengthen coping mechanisms. The design and implementation of food assistance activities should take into consideration an in-depth analysis of local contexts: Cash Based Transfers (CBTs) should be carried out in locations where markets are functional and food availability assured; and secondly, in areas where there is on-farm surpluses, thereby allowing targeted beneficiaries to purchase food from households with surpluses. In areas needing food assistance and where the above-mentioned conditions are not satisfied, in-kind assistance should be considered.
- 45 -
Encourage the design and implementation of multi-sectorial interventions, both through conditional and unconditional modalities, and explore market-based transfers in areas where markets are properly functioning to address household food insecurity as well as support the local economy.
Provide context-appropriate emergency livelihood support for food insecure and displaced households in conflict-affected areas by delivering vegetable seeds and fishing kits.
Improve access to micro-nutrient and protein-rich food through the use of nutrition vouchers to be traded against locally-sourced vegetables, fish and milk.
Integrate a nutrition education component in the food security interventions (GFDs, FFAs, CBTs).
Refine a prioritization matrix for the identification of locations for food security and nutrition response in the conflict-affected states to include, when feasible, available screening data on maternal nutrition.
Continuously monitor food security and nutrition conditions, especially in conflict-affected areas, in order to periodically fine-tune the humanitarian emergency strategy and response.
Continued negotiation with the conflict parties to increase humanitarian access, especially for the most affected food insecure areas is encouraged.
Strengthen early warning systems by improving the monitoring of rainfall and cropping conditions along the season. This should involve: i) monitoring the rainfall performance through remote sensing and geographic information system techniques, in order to improve the quality of crop forecasting and thus the reliability of assessments; and ii) exploring the availability of high-resolution satellites imagery, which can be used to estimate the area planted, yield and production.

- 46 -
Annex 1
South Sudan - Indicative Seasonal Cropping Calendar- NB recent changes are blurring the divisions
Recommendations for Roadmap 2017:
Maintain planting assessments to spot checks on planted area only in representative sample counties.
As soon as security allows, conduct CFSAM-PET training for carefully selected MoA and NGO staff in all new states.
Provide CFSAM guides, PET tools and PET manuals to new states.
Introduce PET apps for use by the Federal Task Force and selected staff members of State Ministries that have already demonstrated a willingness and a capacity to assess production properly using the PET manuals. The introduction should be planned during a short series of training courses early in the first season in Western/Central Equatoria.
Increase the range of timing of full harvest assessments to allow each main crop, in each State to be assessed.
Continue to transfer the responsibility of conducting all the field work of all assessments in a staggered manner (to accommodate harvest dates) to State MoAs, funded by AFIS, ONLY where suitable levels of competence and integrity have been demonstrated. This means adjusting the role of National Task Force to “remote” supervisory and analytical duties only in the states where MoA teams have exhibited sufficient competence. In the states that continue to misrepresent performance presenting hearsay as evidence, the Task Force should conduct independent assessments.
CCMC membership should be re-assessed with Committee members required to pass functional numeracy tests before recruitment. (Agricultural numeracy packages are available for training and testing assessors and the AgriTechTalk- International website).
Mar Apr May June July Aug Sept Oct Nov Dec Jan Feb
Uni-modal rainfall zone found in Greater Bahr el Ghazal; Greater Upper Nile
Rainfall Dry season Wet season Dry season
Main crop Land preparation and planting
Growing season Harvest
Long-cycle crops
Growing season Harvest
Bi-modal rainfall zone found in Greater Equatoria
Rainfall Dry season
Wet season Dry season
First crop Land preparation and planting
Growing season Harvest
Second & third crops
Land preparation and planting
Growing season Harvest

- 47 -
Annex 2
South Sudan - Crop Assessment Strategy for Sustainable Crop Monitoring and Yield Estimations
Task Force – Activities in 2016
Task Force Activity
Time of operation (2016)
Jan Feb Mar Apr May Jun Jul Aug Sep Oct Nov Dec
Crop Assessment
Evacuation of UN/FAO
Western, Central and
Eastern Equatoria
(1st season planting/
harvesting)
Main Season Crop Assessment
Warrap
Lakes
Northern Bahr el Ghazal
Eastern Equatoria
Upper Nile (Melut, Renk,
Maban)
Western Bahr el Ghazal
Spot Crop Assessments
Jonglei State – Pibor, Akobo
Mabior
Senior Consultant: Aweil
West, Aweil East - harvest
transects

- 48 -
Annex 3
South Sudan
Situation by area during the Task Force October-December harvest-time missions
GREATER EQUATORIA Western Equatoria First season planting and early harvest missions were conducted in June involving case studies of 72 farmers and ten key informant interviews. Thereafter, information has been limited due to insecurity increasing during the second season. The early mission combined with CFSAM extrapolation from data collected over the past ten years compared and contrasted with comprehensive rainfall estimates and NDVI data provided by WFP-VAM for the whole year (2016) has enabled the CFSAM assessment to be made.
Figure A3-1 (Western Equatoria) - Seasonal Rainfall and NDVI graphs (WFP-VAM), 2016

- 49 -
Growing conditions Combined graphs of 2016 rainfall estimates and vegetation index graphs for six locations selected across Western Equatoria (Tambura, Yambio, Ibba, Maridi, Mundri West and Mundri East) are shown in Figure A3-1. A consolidated start in March was followed by production enhancing rains until a slight blip in the first dekad of June, which was immediately compensated by heavier rain in the second dekad of the same month. Thereafter, rainfall followed the expected pattern sustaining crop and general vegetation growth until December; even in the drier eastern areas (Mundri East) where more variation from the norm is noted. The June 2016 mission reported increased planting in all locations with 10-25 percent increase in area sown. Seeds used are mostly own seeds carried over from the previous harvest or purchased in the local markets. Of the other crops, cassava is grown at levels similar to cereals through the Greenbelt and provides a security network that withstands displacement and disruption. Proportions of estimated areas of crops planted is given in Table A3-1, derived from 2013/14 when access was still unrestricted. Table A3-1: South Sudan (Western Equatoria) - Estimated crop proportions from transects (percent)
Crop 1st harvest 2nd harvest Combined 1st & 2nd
Maize 51 22 37 Sorghum 5 25 15 Cassava 37 40 381/ Groundnuts 5 9 7 Others 2 4 3
Total 100 100 100 Source: CFSAM, 2014. 1/ Nineteen percent may be harvested.
Although new tractors from GRSS were distributed to newly-created states, their effect is reported to have been limited due to lack of equipment and spare parts suggesting that, as in previous years, area planted was dependent on household and hired labour. Labour hiring rates for digging and weeding are noted to be much higher than in 2015 and vary from SSP 1 000/feddan for migrant labour from the Democratic Republic of the Congo to SSP 1 500/feddan for local labour, depending on location. Crop pest and disease levels were again mild this year with principal problems being green grasshoppers, local birds, monkeys and ants. However, infestations of a weed called “babashiro” is noted to be causing concern where weeding two or three times in the same location (grass and broadleaf weeds) is already a serious drain on household resources. This year, the greatest problems reported by farmers have been connected to harassment of youth, widespread extortion by military, general insecurity on the roads upsetting access to markets and fields especially in named pockets of disruption/displacement. Production Production estimates have been made on the basis of time-series information, adjusted downwards due to insecurity. Cereal yields are estimated at an average yield of 1.29 tonnes/hectare across all cereals and both harvests, lower than last year’s yield estimates due to less access for weeding and untimely harvesting the second season crop. Harvested area has been reduced by about 4 percent for similar reasons that are deemed to have offset the earlier increases noted at planting time. Consequently, gross cereal production from all harvests is estimated at 146 169 tonnes exhibiting a further reduction on the low performance noted last year, showing for the first time in recent years a small deficit of about 4 600 tonnes in an area usually producing five times more surplus for sale. The contribution of cassava to household food economy at State level is again assumed to be highly significant, and harvesting is unlikely to have been affected by less than timely access. If all 2nd year crops are harvested around 158 000 tonnes of cereal equivalent calculated using 42 percent dry matter and a gross processing efficiency of 70 percent are likely to be available for use. Groundnuts may also add an estimated 22 000 tonnes of gross dry matter (unshelled). Only counties in the northeast of the State may be considered as livestock areas due to tse-tse infestation in the forested zones that dominate the remaining counties. Livestock numbers are low compared to other states. No body condition scores are available but as water and vegetation are in as good a condition as noted last

- 50 -
year, PET scores of 3-4 are likely to have been sustained. Vaccination programmes for livestock were conducted around the towns earlier in the year amounting to 2 percent of the vaccines distributed in the country. Central Equatoria The Task Force teams undertook a first season/assessment mission in June 2016, involving interviews/cases studies of more than 100 farmers but no key informer interviews. No second season mission was made due to widespread insecurity. However, reports on the second season in Morobo and Yei River were prepared and delivered by two CCMC members. Figure A3-2: South Sudan (Central Equatoria) - Seasonal Rainfall and NDVI graphs (WFP-VAM), 2016
Growing conditions Combined graphs of 2016 rainfall estimates and vegetation index graphs are shown in Figure A3-2 for six locations selected across Central Equatoria (Terekeka, Juba, Lainya, Kajo Keji, Yei and Morobo). A good early start of the rains in March was followed by less rain than expected during May and again, to a greater extent, in August and September. Although general vegetation growth is noted to be average throughout the year in all places right up until December, local difficulties are noted in the form of some replanting in May (first season gap filling in Lainya and Kejo Keji ) and a poorer performance of annual crops during the second season.

- 51 -
Enthusiastic planting driven by high market prices (Yei) caused an increase in first season cereal area which was successfully harvested before the insecurity that followed was noted throughout the area south of Juba, causing displacement and severely disrupting the second season. Maize is noted to have been the preferred cereal grown in the first season, with Longi-5 being the most commonly grown variety throughout the State, usually grown with no other inputs. Actually, 3/60 farmers are noted to have used DAP on the first planted maize crops, presumably, inspired to do so by the inflated market prices. Longi varieties are also being provided by seed companies and NGOs promoting commercial agriculture, however, in the cases noted own seeds were used and the DAP mentioned is thought to have been left over from earlier trails, not imported this year. Areas of second plantings of maize using seeds from the first harvest are estimated to have been reduced substantially due to displacement and intimidation, especially in Lainya, Morobo and Yei. A proportion of estimated areas of crops usually planted is presented in Table A3-2. Table A3-2: South Sudan (Central Equatoria) - Estimated crop proportions from transects (percent
Crop 1st harvest 2nd harvest Combined 1st & 2nd
Maize 59 16 38 Sorghum 5 37 21 Cassava 28 38 33 Groundnuts 7 5 6 Others 1 4 2
Total 100 100 100
Central Equatoria has more functioning tractors than any other areas except Upper Nile. Forty new units are noted to have been distributed by GRSS and to be functioning in Terekeka (20) and in Yei (first season only 20). Tractor ploughing hiring rates have soared since 2015 due to inflation and sustained interest in agriculture and are now noted at SSP 1 000-2 000 for one pass per feddan in all areas. Last year, the State Agricultural Office recommended that farmers find alternative methods of cultivation which in Kajo Keji and Lainya means mostly animal traction and, in Yei and Morobo, hand labour. In 2016, hand labour gangs, other than those from Uganda, charged even higher prices than the tractor owners with smaller garden plot contracts reaching SSP 5 000–8 000/feddan. Weeds, pests and diseases have remained at mild levels this year. The most troublesome pests noted are grass weeds, stalk-borer in maize, local birds, termites, grasshoppers and rodents. Striga is noted to be of concern to farmers in the continually-farmed areas with no rotation in Terekeka. Production Production estimates have been made on the basis of the first season Task Force returns and CCMC reports from case studies, compared and contrasted with time series data. With a 43 percent reduction in cereal area due to reduced second season planting/harvesting, gross production is estimated at 150 291 tonnes suggesting a 45 percent decrease, leaving Central Equatoria with a cereal deficit of about 8 900 tonnes. Estimated at 90 000 tonnes of cereal equivalent assuming 42 percent dry matter and 30 percent losses in processing, the contribution of cassava chips/flour is, therefore, even more clearly significant this year. Groundnuts will add an estimated 12 000 tonnes (gross dry matter unshelled) of saleable product to the household food economy of the State. Livestock conditions and pasture/browse and water supplies are noted to be good, with no reported significant outbreaks of livestock diseases. Some 6 percent of the livestock vaccinations in 2016 are reported to have been conducted in Central Equatoria.

- 52 -
Eastern Equatoria The Task Force teams undertook assessment missions in June 2016 and harvest assessments in Kapoeta Region in October/November. The missions involved interviews/case studies of more than 80 farmers and six key informers during earlier missions in Pageri, Magwi, Lafon and Torit, and main harvest assessments in Kapoeta South, Kapoeta East and Kapoeta North. Figure A3-3: South Sudan (Eastern Equatoria) - Seasonal Rainfall and NDVI graphs (WFP-VAM), 2016
Growing conditions Combined graphs of 2016 rainfall estimates and vegetation index graphs for six locations selected across Eastern Equatoria (Budi, Ikotos, Lafon, Torit, Kapoeta North and East) are shown in Figure A3-3. All six locations reflect an unfavourable pattern of distribution following three sine curves of peaks and troughs, which, nevertheless produced vegetation growth that matched the average production pattern in all places until September.
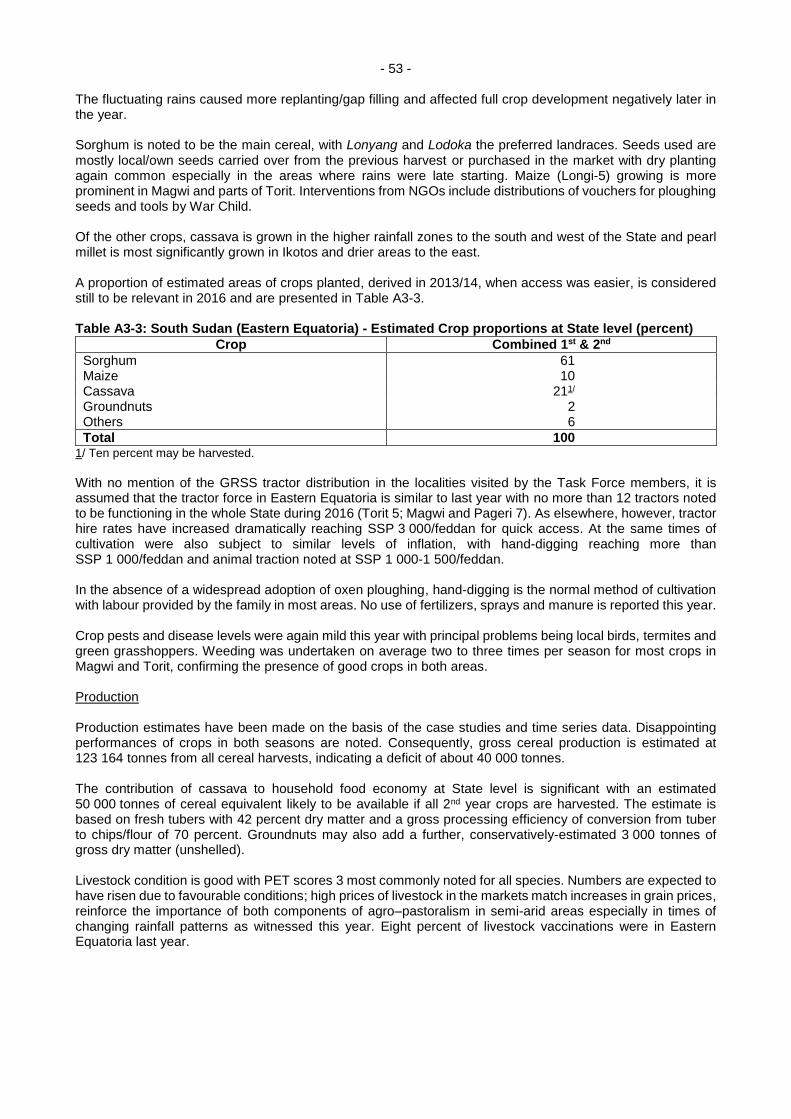
- 53 -
The fluctuating rains caused more replanting/gap filling and affected full crop development negatively later in the year. Sorghum is noted to be the main cereal, with Lonyang and Lodoka the preferred landraces. Seeds used are mostly local/own seeds carried over from the previous harvest or purchased in the market with dry planting again common especially in the areas where rains were late starting. Maize (Longi-5) growing is more prominent in Magwi and parts of Torit. Interventions from NGOs include distributions of vouchers for ploughing seeds and tools by War Child. Of the other crops, cassava is grown in the higher rainfall zones to the south and west of the State and pearl millet is most significantly grown in Ikotos and drier areas to the east. A proportion of estimated areas of crops planted, derived in 2013/14, when access was easier, is considered still to be relevant in 2016 and are presented in Table A3-3. Table A3-3: South Sudan (Eastern Equatoria) - Estimated Crop proportions at State level (percent)
Crop Combined 1st & 2nd
Sorghum 61 Maize 10 Cassava 211/ Groundnuts 2 Others 6
Total 100 1/ Ten percent may be harvested.
With no mention of the GRSS tractor distribution in the localities visited by the Task Force members, it is assumed that the tractor force in Eastern Equatoria is similar to last year with no more than 12 tractors noted to be functioning in the whole State during 2016 (Torit 5; Magwi and Pageri 7). As elsewhere, however, tractor hire rates have increased dramatically reaching SSP 3 000/feddan for quick access. At the same times of cultivation were also subject to similar levels of inflation, with hand-digging reaching more than SSP 1 000/feddan and animal traction noted at SSP 1 000-1 500/feddan. In the absence of a widespread adoption of oxen ploughing, hand-digging is the normal method of cultivation with labour provided by the family in most areas. No use of fertilizers, sprays and manure is reported this year. Crop pests and disease levels were again mild this year with principal problems being local birds, termites and green grasshoppers. Weeding was undertaken on average two to three times per season for most crops in Magwi and Torit, confirming the presence of good crops in both areas. Production Production estimates have been made on the basis of the case studies and time series data. Disappointing performances of crops in both seasons are noted. Consequently, gross cereal production is estimated at 123 164 tonnes from all cereal harvests, indicating a deficit of about 40 000 tonnes. The contribution of cassava to household food economy at State level is significant with an estimated 50 000 tonnes of cereal equivalent likely to be available if all 2nd year crops are harvested. The estimate is based on fresh tubers with 42 percent dry matter and a gross processing efficiency of conversion from tuber to chips/flour of 70 percent. Groundnuts may also add a further, conservatively-estimated 3 000 tonnes of gross dry matter (unshelled). Livestock condition is good with PET scores 3 most commonly noted for all species. Numbers are expected to have risen due to favourable conditions; high prices of livestock in the markets match increases in grain prices, reinforce the importance of both components of agro–pastoralism in semi-arid areas especially in times of changing rainfall patterns as witnessed this year. Eight percent of livestock vaccinations were in Eastern Equatoria last year.

- 54 -
GREATER BAHR EL GHAZAL Northern Bahr el Ghazal The Task Force teams undertook a harvest assessment mission in September-October with members of the State Ministry of Agriculture. The joint activities comprised 30 case studies, five key informant interviews and some short walking transects in Aweil West and Aweil East counties.
Figure A3-4: South Sudan (Northern Bahr el Ghazal) - Seasonal Rainfall and NDVI graphs (WFP-VAM), 2016

- 55 -
Growing conditions Combined graphs of 2016 rainfall estimates and vegetation index graphs for six locations selected across Nothern Bahr el Ghazal (all sites, Aweil North; Aweil Centre, Aweil East, Aweil West and Aweil South) are shown in Figure A3-4. All five of the spot locations reflect an early start, no breaks or significant reductions in precipitation until late August/September, when the main sorghum crops were maturing and being harvested, reducing waterlogging and flooding. The NDVIs support the farmer/herder friendly nature of the season with growth matching the long-term averages except in Aweil South where the NDVI estimates appear to be out of correlation with the rainfall estimates. Access to farm land is not generally reported as restricted and initial planting exceeded the previous years’ by some 10 percent in some areas, according to key informants and field observations. The increases were prompted by encouraging rainfall and high prices of cereals in the market. In addition, 60 tractors were provided by GRSS for use generally in the new states and a further 15 units were provided to Aweil Rice13. In 2015, there were 20 functional tractors in the State (12 private and eight from the Government) but performance was noted to have been impaired by poor supply chains for fuel and spare parts. As nothing has changed in terms of supply chains to the area, the conditions epitomized by tractors in the Aweil Rice Scheme where only three out of seven are working in 2015, still pertain in 2016 in both the Rice Scheme and more generally across the State. Firstly, the new tractors were supplied without spare parts and equipment. Secondly, the only fuel generally available comes from the Sudan, arriving in jerry cans along smuggler routes across the border. Consequently, only three of the new tractors were used in the Rice Scheme and effective use of the new imports was limited to persons of influence farming in Ton Chol (Aweil East) and in the abandoned rice basins. Nevertheless, hiring rates, escalating to SSP 1 300-1 500/feddan from SSP 300-500/feddan in the previous year, indicate the strength of the demands for the service. Oxen plough is expanding in the State but more slowly than in Lakes or Warrap. Donkey ploughing on sandier soils with farmers hiring donkeys for SSP 20 for 30 minutes stints for groundnut planting in Aweil East was noted in 2014 and is assumed to have continued this year. Hand labour still prevails in all counties with family and nafeer systems are still the most usual sources of man-power for farmers wishing to expand. In this regard, for the first time the CFSA mission noted competition for land between village communities wishing to expand sorghum-growing in the abandoned rice basins in Udham and mechanized farmers who have taken over 2 000 feddans; re-affirming the expanding approach to planting irrespective of the OCHA reported exodus of young males migrating to the Sudan in search of work and better living conditions14. Regarding inputs, sorghum is by far the preferred cereal throughout the State. Seed sources are noted to be mostly local/own seeds carried over from the previous harvest for early to main crop sorghum known collectively as cham, alep cham and nyanchung or athel. The preferred improved sorghum seeds in the mechanized and traditional sectors are of the Sudan provenance, i.e. Wad Ahmed, Gaddam el Hammam and Afargadamek. Local groundnuts and sesame seeds were planted at the same time as the early sorghums plus small areas of local maize. The area planted to sorghum in this agricultural season ranges from 0.42-0.84 hectares/household in the four counties visited and the area covered with groundnuts in Aweil North and Aweil East ranges from 0.42-1.26 hectares/household. No significant need to replant was reported this year in any area. Other than shifting location, which is easier in Aweil West and South than in Aweil East and North, the most common way of maintaining soil fertility is by local and transhumant herds grazing over farmland on contract. Pests and diseases have remained at mild levels this year. The most troublesome pests noted are grass weeds with weeding undertaken on average one to two times per season for sorghum but three times by commercial groundnut farmers. As well as local birds, termites, grasshoppers, stalk-borer in sorghum and rodents, striga is noted to be of concern to small household units in the over-used areas with no livestock and no means of shifting.
13 Aweil Rice is a national project. It received some tractors, but without budget for their use. 14 Family farms are mostly cultivated and tended by women using the long handled maloda. Other family members do the weeding (one or two times for sorghum).
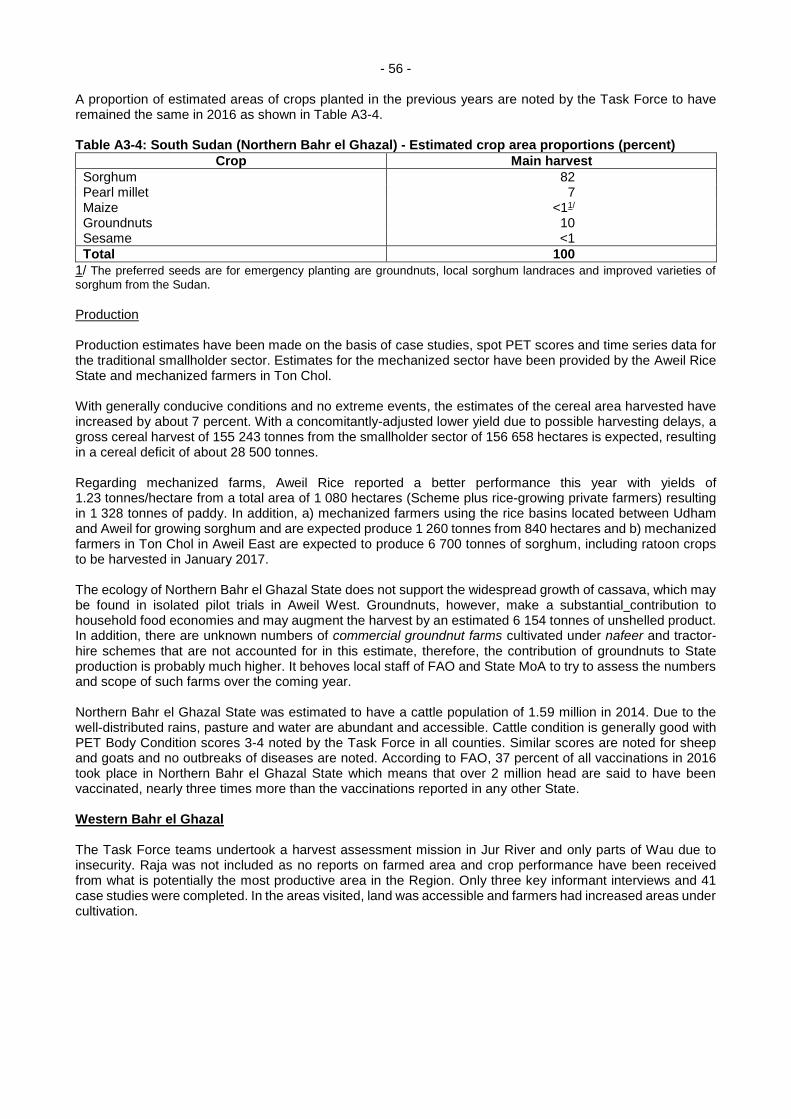
- 56 -
A proportion of estimated areas of crops planted in the previous years are noted by the Task Force to have remained the same in 2016 as shown in Table A3-4. Table A3-4: South Sudan (Northern Bahr el Ghazal) - Estimated crop area proportions (percent)
Crop Main harvest
Sorghum 82 Pearl millet 7 Maize <11/ Groundnuts 10 Sesame <1
Total 100
1/ The preferred seeds are for emergency planting are groundnuts, local sorghum landraces and improved varieties of
sorghum from the Sudan. Production Production estimates have been made on the basis of case studies, spot PET scores and time series data for the traditional smallholder sector. Estimates for the mechanized sector have been provided by the Aweil Rice State and mechanized farmers in Ton Chol. With generally conducive conditions and no extreme events, the estimates of the cereal area harvested have increased by about 7 percent. With a concomitantly-adjusted lower yield due to possible harvesting delays, a gross cereal harvest of 155 243 tonnes from the smallholder sector of 156 658 hectares is expected, resulting in a cereal deficit of about 28 500 tonnes. Regarding mechanized farms, Aweil Rice reported a better performance this year with yields of 1.23 tonnes/hectare from a total area of 1 080 hectares (Scheme plus rice-growing private farmers) resulting in 1 328 tonnes of paddy. In addition, a) mechanized farmers using the rice basins located between Udham and Aweil for growing sorghum and are expected produce 1 260 tonnes from 840 hectares and b) mechanized farmers in Ton Chol in Aweil East are expected to produce 6 700 tonnes of sorghum, including ratoon crops to be harvested in January 2017. The ecology of Northern Bahr el Ghazal State does not support the widespread growth of cassava, which may be found in isolated pilot trials in Aweil West. Groundnuts, however, make a substantial contribution to household food economies and may augment the harvest by an estimated 6 154 tonnes of unshelled product. In addition, there are unknown numbers of commercial groundnut farms cultivated under nafeer and tractor-hire schemes that are not accounted for in this estimate, therefore, the contribution of groundnuts to State production is probably much higher. It behoves local staff of FAO and State MoA to try to assess the numbers and scope of such farms over the coming year. Northern Bahr el Ghazal State was estimated to have a cattle population of 1.59 million in 2014. Due to the well-distributed rains, pasture and water are abundant and accessible. Cattle condition is generally good with PET Body Condition scores 3-4 noted by the Task Force in all counties. Similar scores are noted for sheep and goats and no outbreaks of diseases are noted. According to FAO, 37 percent of all vaccinations in 2016 took place in Northern Bahr el Ghazal State which means that over 2 million head are said to have been vaccinated, nearly three times more than the vaccinations reported in any other State. Western Bahr el Ghazal The Task Force teams undertook a harvest assessment mission in Jur River and only parts of Wau due to insecurity. Raja was not included as no reports on farmed area and crop performance have been received from what is potentially the most productive area in the Region. Only three key informant interviews and 41 case studies were completed. In the areas visited, land was accessible and farmers had increased areas under cultivation.

- 57 -
Figure A3-5: South Sudan (Western Bahr el Ghazal) - Seasonal Rainfall and NDVI graphs
(WFP-VAM), 2016
Growing conditions Combined graphs of 2016 rainfall estimates and vegetation index graphs for four locations selected across Western Bahr el Ghazal (all sites, Raja; Jur River and Wau ) are shown in Figure A3-5. All three spot locations reflect an early start, no breaks or significant reductions in precipitation until November. The NDVIs support the farmer/herder friendly nature of the season with growth matching the long-term average NDVI estimates. In Wau and Jur River counties, only hand cultivation and oxen ploughing were the main means of cultivation. Both systems are noted to have increased charges this year connecting to digging and ploughing charges of SSP 1 500–2 000/feddan compared to SSP 500/feddan last year. Family and communal labour (nafeer) are most usually the means of weeding and harvesting. Sorghum is by far the preferred cereal and seed sources are noted to be only local/own seeds carried over from the previous harvest with a preference for the long-maturing landrace (kec) in 2015. Small plots of early sorghums (bende) and main crop sorghum (mabior) plus small areas of local maize, local groundnuts and sesame seeds were planted at the same time as the kec main crop. A proportion of estimated areas of crops planted is given in Table A3-5. Table A3-5: South Sudan (Western Bahr el Ghazal) - Estimated crop proportions (percent)
Crop Main harvest
Sorghum 46 Cassava 271/ Groundnuts 10 Maize 6 Sesame 11
Total 100 1/ Thirteen percent may be harvested.
No significant outbreaks of pests and diseases are noted.
- 58 -
Production Production has been conservatively-estimated for sorghum on the basis of such limited information and on the assumption that farming in Raja has been severely restricted. The gross production of cereals (mostly late-maturing sorghum) is estimated at a very conservative 56 815 tonnes, marking a 22 percent reduction on last year’s estimates essentially due to a reduction in area. This leaves Western Bahr el Ghazal with a possible cereal deficit of about 19 000 tonnes. Cassava grows in Kpale, Wau County and in Raja. The two-year system of production is most common. Production this year is noted to be normal but conservatively-estimated at 11 tonnes/hectare following the Task Force-led team returns in previous years. The contribution of cassava to food security in the State is estimated at 28 783 tonnes of cereal equivalent (gross dry matter). Groundnuts at household level will possibly add an estimated 4 000 tonnes of unshelled product. The indigenous households of Western Bahr el Ghazal are not large scale livestock owners, however, 4 percent of all livestock vaccinations are noted by FAO to have been conducted in the State this year compared with 0.6 percent last year. The condition of cattle and goats noted is good with the dominant PET Body Condition Score 4 for both species and no significant pest and disease outbreaks were recorded. In all areas, pasture and water availability are generally adequate, but large scale migrations of cattle from Darfur usually occur later in the year. Warrap State (including Abyei Administrative Area) The Task Force teams undertook the harvest assessment mission in October to cover the production of the main harvest in the State. The harvest time actions comprised 39 case studies, three key informant interviews and 13 walking transects in fields of growing crops in Gogrial West, Twic and Abyei. All areas reported easy access and increased planting due to the encouraging conditions and high market prices.
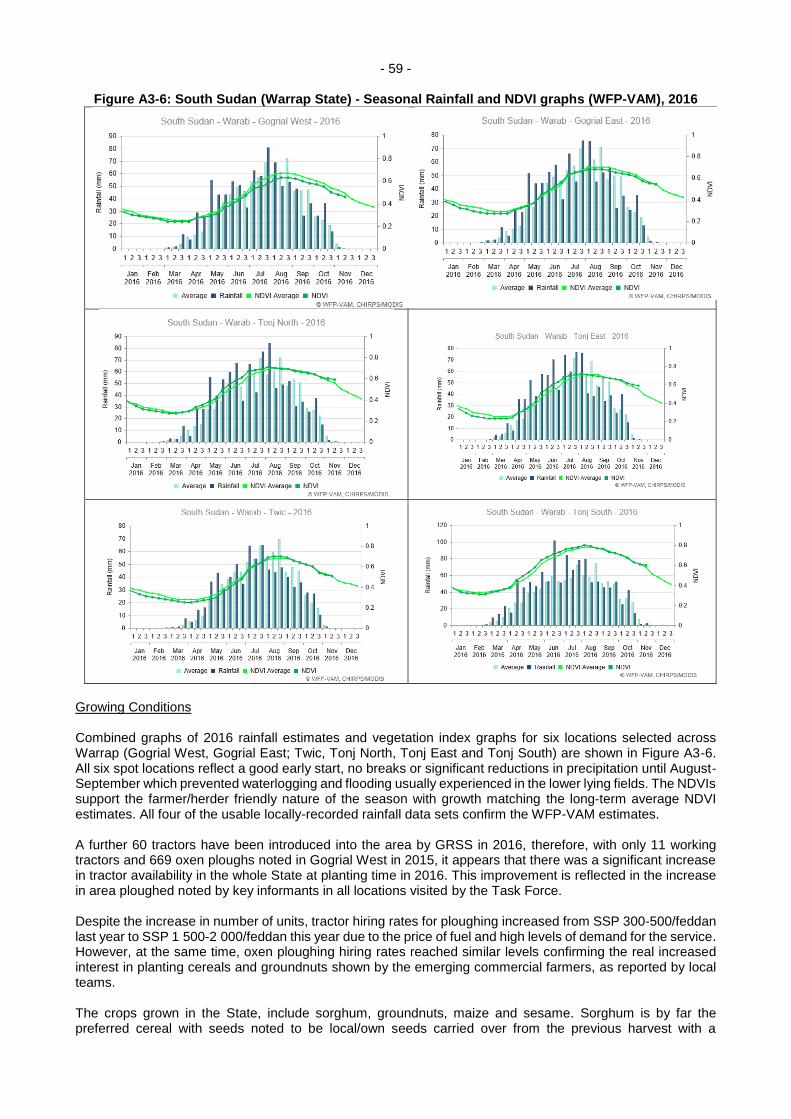
- 59 -
Figure A3-6: South Sudan (Warrap State) - Seasonal Rainfall and NDVI graphs (WFP-VAM), 2016
Growing Conditions Combined graphs of 2016 rainfall estimates and vegetation index graphs for six locations selected across Warrap (Gogrial West, Gogrial East; Twic, Tonj North, Tonj East and Tonj South) are shown in Figure A3-6. All six spot locations reflect a good early start, no breaks or significant reductions in precipitation until August- September which prevented waterlogging and flooding usually experienced in the lower lying fields. The NDVIs support the farmer/herder friendly nature of the season with growth matching the long-term average NDVI estimates. All four of the usable locally-recorded rainfall data sets confirm the WFP-VAM estimates. A further 60 tractors have been introduced into the area by GRSS in 2016, therefore, with only 11 working tractors and 669 oxen ploughs noted in Gogrial West in 2015, it appears that there was a significant increase in tractor availability in the whole State at planting time in 2016. This improvement is reflected in the increase in area ploughed noted by key informants in all locations visited by the Task Force. Despite the increase in number of units, tractor hiring rates for ploughing increased from SSP 300-500/feddan last year to SSP 1 500-2 000/feddan this year due to the price of fuel and high levels of demand for the service. However, at the same time, oxen ploughing hiring rates reached similar levels confirming the real increased interest in planting cereals and groundnuts shown by the emerging commercial farmers, as reported by local teams. The crops grown in the State, include sorghum, groundnuts, maize and sesame. Sorghum is by far the preferred cereal with seeds noted to be local/own seeds carried over from the previous harvest with a
- 60 -
preference for the short landraces (yaar, athel and nyanjung) to be harvested in September. Late-maturing sorghum (kec) sown in Tonj South was too early to be effectively scored during the mission. Local groundnuts and sesame seeds were planted at the same time as sorghum plus small areas of local maize. A proportion of estimated areas of crops planted is given in Table A3-6. Table A3-6: South Sudan (Warrap State and Abyei) - Estimated crop proportions planted (percent)
Crop Main harvest
Sorghum 95 Pearl Millet <1 Maize <1 Groundnuts 3
Total 100 Note: Sesame is often intercropped, but areas/yields have not been estimated.
No significant outbreaks of pests and diseases were reported. Production Cereal production estimates have been made for sorghum only. Gross cereal production in Warrap (including Abyei) is estimated at 176 808 tonnes from an area estimated to have increased by 18 percent to 154 970 hectares due to accessible land, good early conditions, high prices and heightened commercial interests influenced by markets in Abyei. Yield estimates are estimated to be 6 percent higher than last year due to the empirical evidence from a series of well–timed transects completed by the Task Force in harvestable crops. Warrap State’s agro-ecology does not support the widespread growth of cassava, which is found only around the edges of the fields and pathways. Groundnuts, however, make a much more substantial contribution and may add an estimated 8 700 tonnes of unshelled product to the household food economies. There are also unknown numbers of commercial groundnut farms that are not being captured by the system, therefore, their contribution to the State production is probably much higher. It behoves local staff of FAO and SMoA to try to assess the numbers and scope of such farms over the coming year. Livestock condition is good, noting body condition scores of 3-4 for all classes of stock. Pasture and water availability are noted to be seasonally more than adequate. No outbreaks of pests and diseases were noted in the counties visited which were assisted by a vaccination programme that accounted for 13 percent of the national livestock vaccinations in 2016. Lakes The Task Force teams undertook harvest assessment missions in Lakes in September. The harvest-time action comprised 60 case studies, five key informant interviews and walking transects allowing yields to be predicted objectively in spot locations. In all the areas visited, access to land was unimpeded compared to last year and an expansion of activity was noted, increasing the areas under the cultivation of both cereals and groundnuts.
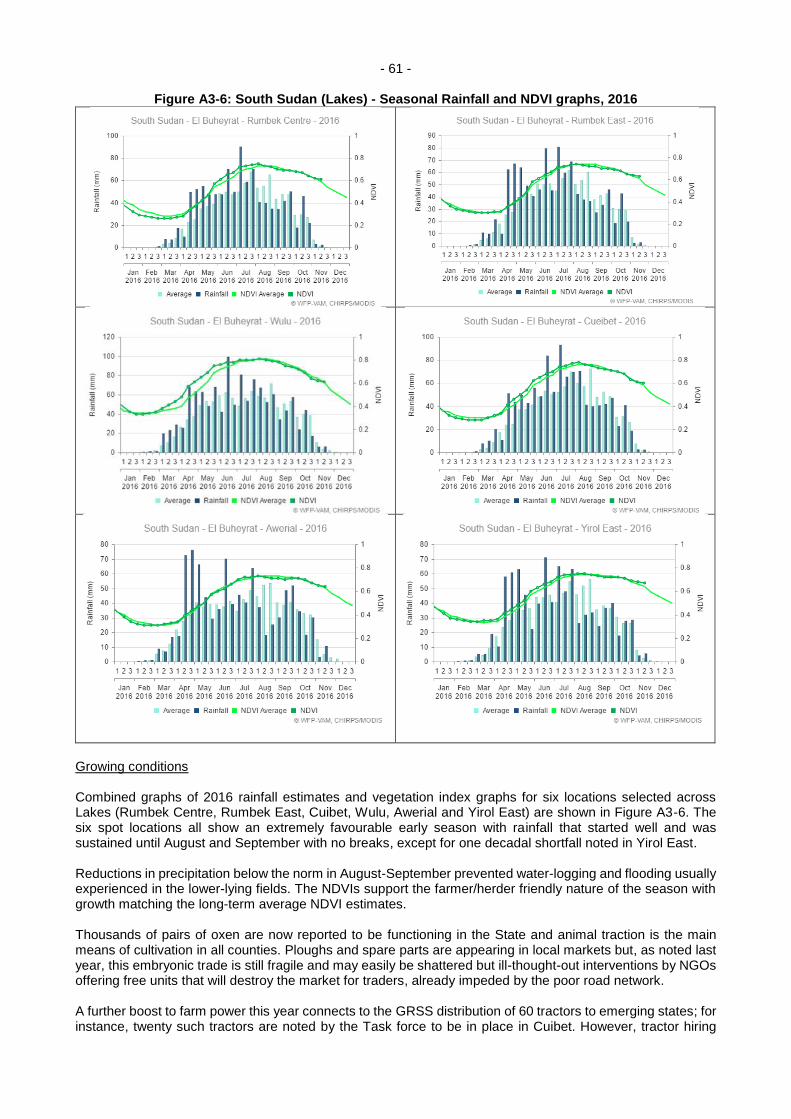
- 61 -
Figure A3-6: South Sudan (Lakes) - Seasonal Rainfall and NDVI graphs, 2016
Growing conditions Combined graphs of 2016 rainfall estimates and vegetation index graphs for six locations selected across Lakes (Rumbek Centre, Rumbek East, Cuibet, Wulu, Awerial and Yirol East) are shown in Figure A3-6. The six spot locations all show an extremely favourable early season with rainfall that started well and was sustained until August and September with no breaks, except for one decadal shortfall noted in Yirol East. Reductions in precipitation below the norm in August-September prevented water-logging and flooding usually experienced in the lower-lying fields. The NDVIs support the farmer/herder friendly nature of the season with growth matching the long-term average NDVI estimates. Thousands of pairs of oxen are now reported to be functioning in the State and animal traction is the main means of cultivation in all counties. Ploughs and spare parts are appearing in local markets but, as noted last year, this embryonic trade is still fragile and may easily be shattered but ill-thought-out interventions by NGOs offering free units that will destroy the market for traders, already impeded by the poor road network. A further boost to farm power this year connects to the GRSS distribution of 60 tractors to emerging states; for instance, twenty such tractors are noted by the Task force to be in place in Cuibet. However, tractor hiring
- 62 -
rates at SSP 1 600/feddan, due to the high price of fuel, may restrict access to the units, but oxen power at SSP 300/unit provides a cheaper and readily available alternative. With the increase in available farm power sources, farm size is no longer limited to hand labour; cereal and groundnut-planted area is increasing and the assessments confirmed that farm area sizes of 1-2 hectares, already reported in the past two years, have been sustained. No national migratory pests are noted to have been reported in 2016, but usual local pests (birds, monkeys, green grasshoppers, termites, millipedes, stalk borers) diseases (smut and lack-spot) and pests of grains in store have become causes of concern reflecting the increases in production and longer periods of storage before sale. Production Production estimates have been made for sorghum on the basis of time series data adjusted by PET scores and case studies. Gross cereal production is estimated at 132 761 tonnes reflecting a 16 percent increase in area. With no further information available, groundnut yields are expected to have been similar to 2014 from an increased area, resulting in a conservatively estimated production of 25 050 tonnes of unshelled product arising from two crops over the year. The ecology of Lakes State does support the growth of cassava as well as groundnuts but cattle-keeping is preventing its expansion in all counties, therefore, cassava is estimated to only make a minor contribution of 7 200 tonnes of fresh tubers or 2 116 tonnes of cereal equivalents. PET body condition scores of 3-4 have been reported by the Team and key informants for all species reflecting ample and accessible pasture and water. No disease outbreaks are noted and vaccinations for the State have fallen from about 7 to 4 percent of the national total. GREATER UPPER NILE Upper Nile The Task Force teams undertook harvest assessment missions in Upper Nile in November visiting Renk, Melut and Maban. The harvest time action comprised 87 case studies, three key informant interviews and walking transects allowing yields to be predicted objectively in spot locations. In all areas visited, access to land was unimpeded compared to last year and an expansion of activity is noted, increasing the areas under cultivation in the mechanized and traditional (small holder and emerging farmer) sectors.

- 63 -
Figure A3-7: South Sudan (Upper Nile) - Seasonal Rainfall and NDVI graphs, 2015
Growing conditions Combined graphs of 2016 rainfall estimates and vegetation index graphs for six locations selected across Upper Nile (Renk, Maban, Melut, Ulang, Baliet and Panyikang) are shown in Figure A3-7. The six spot locations all show a favourable early season with rainfall that started well and was sustained until August and September with no significant breaks. Given that most soils in Upper Nile are vertisols (clay plains) rainfall was enough to sustain NDVI levels at average or above-average levels of development and dry spells in June and again in August/September would have facilitated the early access to the clay soils for timely cultivation for both early and late-plated sorghum crops.

- 64 -
The Task Force-led missions visited farmers in major farming centres viz Renk, Melut, and Maban. The State Director of Agriculture reported significant increases in the planting of sorghum in the mechanized sector – reaching pre-independence levels when farmers were supported with loans from the Agricultural Bank (Khartoum). In the past two years the area under cultivation has been reduced because:
Security – most of the Sudan-based farmers did not venture south as they had done previously both pre- and post-independence.
No credit was available from the Agricultural banks on either side of the border.
High fuel prices.
Tractor spare parts were only available from smugglers and were more expensive than in previous years. This year, it appears that some problems may have been reduced through the provision of 60 new tractors and fuel to both large (4 x 200 litre drums/tractor) and small-scale farmers (half drum/tractor) in Renk and Melut allowing pre-independence levels of planting to be claimed. The Task Force team’s experience in the area suggests that production will depend on the timing and quality of cultivation, quality of seeds used and weeding frequency and pest and disease profiles. In particular:
The rains were most conducive allowing access and supporting growth of both early and late-sown crops.
Farmer-saved seeds were available for sowing in July and August for the short maturing improved sorghum varieties of Wad Ahmed, Gaddam el Hammam and Afargadamek that cover most of the planted area nowadays instead of the much long maturing, local landrace Agono that dominated planting ten years ago.
Apart from birds, the usual pests and diseases, though present have been at expected levels of infestation. But although much of the harvest will have been collected (if not threshed) before the migratory Quelea quelea bird threats in January, the migratory Quelea quelea nesting sites in riverine areas have not been sprayed. It was reported to the Task Force that over the past two months, Quelea quelea numbers have been building and their local presence has had a negative effect on yields of the early-harvested sorghum.
As a result of the increase in Quelea quelea population, it is expected that two-thirds of the late-sown mechanized farming sorghum area in Upper Nile will not be harvested because of losses due to the January migration of Quelea quelea birds.
The Task Force team assessing in Maban confirmed that access to land was not a problem as fields were accessible and all fields were cultivated by hand by family members. The main field crops grown are noted to be late-maturing sorghum (agono) and early-maturing maize with seeds coming mostly from household stocks, markets or family members. No use of credit, fertilizers or manures is noted, however, hand weeding in noted to have been undertaken two to three times on all crops in all case studies. No major pest or disease outbreaks are noted although most farmers named local birds, grasshoppers and caterpillars as being present, the former requiring attention through bird-scaring and then the use of smoke to prevent losses. Production Based on the returns, production in Upper Nile is estimated at 37 017 tonnes of mixed cereals from 48 103 hectares being an 8 percent increase over last year’s assessed harvest. The Upper Nile Director of Agriculture’s estimates for the mechanized sector connect to a gross production of sorghum in the mechanized farms in all locations of 44 000 tonnes being 0.44 tonnes/hectare from 100 000 hectares, some 300 percent more than last year’s low estimate. Sesame production is estimated at 880 tonnes. Upper Nile is a comparatively minor livestock-producing area, sedentary production systems in Maban are noted by the Task Force to have had no major disease problems, a situation which, when coupled with adequate water and pasture, has resulted in PET condition scores of 3-4 for all classes of livestock. FAO returns indicate that 5 percent of the livestock vaccinated in the country in 2016 were located in Upper Nile localities.

- 65 -
Unity State No information was available to the CFSAM team except for population movement details (OCHA) and WFP–VAM, RFE and NDVI graphs.
Figure A3-8: South Sudan (Unity State) - Seasonal Rainfall and NDVI graphs (WFP-VAM), 2016
Growing conditions Combined graphs of 2016 rainfall estimates and vegetation index graphs for six locations selected across Unity State (Guit, Koch, Leer, Mayendit, Mayom and Rubkona) are shown in Figure A3-8. The six spot locations all show a favourable early season with rainfall that started well and was sustained until August and September with no significant breaks. Such rains will have supported a good production of first season maize. The shortfall of rain during August and September is likely to have reduced water logging/flooding, but will have been sufficient to support the sorghum crop harvested in October and November. Given that most soils in Unity State are heavy clays, the NDVIs follow a pattern that shows vegetation growth that is better than normal for most of the year in all locations. CFSAM production estimates are, therefore, conservatively placed at 10 930 tonnes of mixed cereals comprising early maize and sorghum harvests from 16 089 hectares suggesting a 4 percent increase due to area.

- 66 -
Notwithstanding reports of a decimated livestock sector following a mass exodus of cattle designed to avoid sequestration by armed groups, general looting and slaughter of any livestock remaining, especially when territories exchange hands between opposing forces; FAO vaccination returns indicate that half a million head were vaccinated in the State during 2016, 200 000 more vaccinations than in 2015. Jonglei State Access to information from Jonglei State has again been limited by the conflict. Three harvest assessment missions were completed in November to specific locations in Akobo, Pibor, and Twic East. The Task Force-led teams carried out short walking transects in the locations where the 55 case studies and six key informant interviews took place. Access to areas close to villages meant that more families were noted to be farming, however, farm sizes are noted to be smaller as far fields are not being cultivated.
Figure A3-9: South Sudan (Jonglei State) - Seasonal Rainfall and NDVI graphs, 2015
- 67 -
Growing conditions Combined graphs of 2016 rainfall estimates and vegetation index graphs for six locations selected across Jonglei State (Akobo, Fangak, Nyirol, Pibor, Twic East and Bor South) are shown in Figure A3-9. The six spot locations all show a favourable early season with rainfall that started well, but with breaks in May in Twic East, Pibor and Bor South. The NDVIs show some variation about the norm which is more obvious in the three fore-mentioned localities. Such rains will have supported a good production of the first season maize. As in Unity State, the shortfall of rain during August is likely to have reduced water logging/flooding, but may have been challenging for the main sorghum crop harvested in October and November. In the areas visited by the Task Force teams, sorghum is noted to be the main cereal grown. Seeds used are mostly own seeds carried over from the previous harvest or borrowed from relatives. Of the other crops, cassava is noted to be grown in the areas visited in Pochalla County. A proportion of estimated areas of crops planted is given in Table A3-9. Table A3-9: South Sudan (Jonglei State) - Estimated crop proportions (percent)
Crop Main harvest
Sorghum 61 Maize 35 Groundnuts 2 Others (finger millet) 2
Total 100
No tractors and very little animal traction are noted in the assessment returns. Hand-digging is the normal method of cultivation accomplished by family or labour-sharing groups. Ratooning of sorghum is prevalent but generally goes unreported. Crop pest and disease levels were again mild this year with principal problems being local birds, monkeys and ants. Production Cereal production in Jonglei is estimated at 43 061 tonnes due to an increase in area of 15 percent due to more families farming and a relatively low yield estimate due to variable rains in August/September. The production reflects conservative estimates of areas per household that actually farmed with yield reflecting more than one harvest and ratooning. Cassava production is observed in Pochalla only, therefore, is not included as a possible significant addition to estimate the State supply of staple foods. Groundnuts may, however, add a further 500-600 tonnes to the household’s food economy at State level. Jonglei is a major livestock-producing area, production systems are based on transhumance and the herds/flocks are exceptionally mobile and well-used to conflict. As most of Jonglei State’s huge grazing areas are in partisan territory, some transhumance is likely to have been accomplished, albeit with caution. In the secure counties visited by the mission teams, PET body condition scores are noted to be 3 as elsewhere at this time of year. Variable water and browse/pasture levels were reported as areas close to the steadings dried up. Although all endemic diseases were reported as present, no significant outbreaks were noted. FAO vaccination returns indicate that 12 percent of all vaccinations were conducted in Jonglei. Livestock price ranges are noted to be firm, similar to the prices elsewhere.