Special issue on gum arabic - unctad.orgunctad.org/en/PublicationsLibrary/suc2017d4_en.pdf ·...
83
UNITED NATIONS CONFERENCE ON TRADE AND DEVELOPMENT No. 8 COMMODITIES AT A GLANCE Special issue on gum arabic Photo courtesy of ALLAND & ROBERT
Transcript of Special issue on gum arabic - unctad.orgunctad.org/en/PublicationsLibrary/suc2017d4_en.pdf ·...

U N I T E D N AT I O N S C O N F E R E N C E O N T R A D E A N D D E V E L O P M E N T
No. 8
COMMODITIES AT A GLANCESpecial issue on gum arabic
Phot
o co
urte
sy o
f ALL
AND
& RO
BERT
Phot
o co
urte
sy o
f ALL
AND
& RO
BERT

U N I T E D N AT I O N S C O N F E R E N C E O N T R A D E A N D D E V E L O P M E N T
No. 8
COMMODITIES AT A GLANCESpecial issue on gum arabic
New York and Geneva, 2018Phot
o co
urte
sy o
f ALL
AND
& RO
BERT

© 2018, United Nations
This work is available through open access by complying with the Creative Commons licence created for intergovernmental organizations, available at http://creativecommons.org/licenses/by/3.0/igo/.
The designations employed and the presentation of material on any map in this work do not imply the expression of any opinion whatsoever on the part of the United Nations concerning the legal status of any country, territory, city or area or of its authorities, or concerning the delimitation of its frontiers or boundaries.
Photocopies and reproductions of excerpts are allowed with proper credits.
This publication has not been formally edited.
United Nations publication issued by the United Nations Conference on Trade and Development.
UNCTAD/SUC/2017/4
eISBN 978-92-1-363264-2
ISSN 2522-7866

iii
ACKNOWLEDGEMENTS
The series Commodities at a Glance aims to collect, present and disseminate accurate and relevant statistical information linked to international primary commodity markets in a clear, concise and reader-friendly format.
This edition of Commodities at a Glance was prepared by Mario Jales, Economic Affairs Officer at the Commodi-ties Branch, Division on International Trade and Commodities, UNCTAD, under the overall guidance of Janvier Nkurunziza, Chief, Commodity Research and Analysis Section,Commodities Branch.
The cover of this publication was created by Magali Studer, UNCTAD. For cover page and chapters I, III, IV and VI: photo courtesy of Alland & Robert. For chapters II and V: photo credit © Fotolia.
For further information about this publication, please contact the Special Unit on Commodities, UNCTAD, Palais des Nations, CH-1211 Geneva 10, Switzerland, tel. 41 22 917 5766/6286, email: [email protected].
ACKNOWLEDGEMENTS
iv COMMODITIES AT A GLANCE - Special issue on gum arabic
NOTES
Reference to “dollars”, or use of the dollar symbol ($), signifies United States dollars, unless otherwise specified.
The term “tons” refers to metric tons.
Unless otherwise stated, all prices in this report are in nominal terms.
Data sources are indicated under each table and figure.
Reference to “official sources” denotes the following sources: Administración Federal de Ingresos Públicos, Argentina; ASEAN Statistics Division; Asociación Latinoamericana de Integración; Banco Central de Costa Rica; Banco Central de Reserva de El Salvador; Banco Central del Ecuador; Banco Central del Paraguay; Census and Statistics Department, Hong Kong (China); Central Bureau of Statistics, Aruba; Central Statistical Bureau, Latvia; Central Statistical Office, Trinidad and Tobago; Central Statistical Office of Poland; Department of Customs, Nepal; Department of Revenue and Customs, Bhutan; Department of Statistics, Jordan; Dirección General de Aduanas, Costa Rica; Direction générale des douanes, France; Eurostat, European Union; Federal Competitiveness and Statistics Authority, United Arab Emirates; General Authority of Statistics, Saudi Arabia; Ghana Statistical Service; Hungarian Central Statistical Office; Institut national de la statistique et de la démographie, Burkina Faso; Instituto Nacional de Estadística, Bolivarian Republic of Venezuela; Instituto Nacional de Estadística y Censo, Panama; Lebanese Customs Administration; Lesotho Bureau of Statistics; Ministry of Development, Planning and Statistics, Qatar; Ministry of Industry, Foreign Trade and Services, Brazil; National Bureau of Statistics, Seychelles; National Institute of Statistics, Cabo Verde; National Institute of Statistics, Romania; National Statistical Committee of the Republic of Belarus; National Statistical Institute, Bulgaria; National Statistical Service of the Republic of Armenia; National Statistics Office of the Republic of Georgia; Oficina Nacional de Estadística, Dominican Republic; Pakistan Bureau of Statistics; Philippine Statistics Authority; Regional Statistics Programme, Caribbean Community Secretariat; Secretaría de Estado de Comercio, Spain; Secretaría de Integración Económica Centroamericana; Southern African Customs Union; State Statistical Committee of the Republic of Azerbaijan; Statistics and Census Service, Macao (China); Statistical Office of the Republic of Serbia; Statistics Canada; Statistics Lithuania; Stats NZ Tatauranga Aotearoa, New Zealand; Swiss Federal Customs Administration; United States International Trade Commission; Vanuatu National Statistics Office; and Zimbabwe National Statistics Agency.

vACRONYMS
ACRONYMS
AAGR average annual growth rate
ASI Achats Service International (Niger)
CAS cleaned amber and sifted
CEXPRO Compagnie Commerciale pour l’Exportation des Produits (Cameroon)
CFA Financial Cooperation in Central Africa
CFAF CFA franc
CIF cost, insurance and freight
CNI Colloïdes Naturels International (France)
DFQF duty free and quota free
EUV export unit value
FAO Food and Agriculture Organization of the United Nations
FNC Forests National Corporation (Sudan)
FOB free on board
GAC Gum Arabic Company (Sudan)
GAU Gum Arabic Union (Sudan)
GEF Global Environmental Fund
HPS handpicked select
HS Harmonized Commodity Description and Coding System
IFAD International Fund for Agricultural Development
INDC Intended Nationally Determined Contribution
INS International Numbering System for Food Additives
JECFA Joint FAO-WHO Expert Committee on Food Additives
LDC least developed country
MFN most favoured nation
NAPA National Adaptation Programme of Action
ROW rest of the world
SDG Sudanese pound
SOMIEX Société Malienne d’Importation et Exportation (Mali)
SONIMEX Société Nationale d’Importation et d’Exportation (Mauritania)
WHO World Health Organization

vi COMMODITIES AT A GLANCE - Special issue on gum arabic
CONTENTS
Acknowledgements ............................................................................................................. iii
Notes ............................................................................................................................... iv
Acronyms ...........................................................................................................................v
CHAPTER I INTRODUCTION .................................................................................. 1
A. Historical overview .............................................................................................................. 2
B. Regulatory status ................................................................................................................ 3
C. Geographical distribution and ecological characteristics ...................................................... 5
D. Biochemical structure and functions .................................................................................... 6
CHAPTER II USES ................................................................................................ 7
A. Traditional uses ................................................................................................................... 8
B. Industrial uses ..................................................................................................................... 8
CHAPTER III VALUE CHAIN .................................................................................... 13
A. Producers ........................................................................................................................... 16
B. Traders ................................................................................................................................ 18
C. Exporters ............................................................................................................................ 19
D. Processors .......................................................................................................................... 20
E. Users .................................................................................................................................. 21
F. Value addition ..................................................................................................................... 22
CHAPTER IV SUPPLY AND DEMAND ...................................................................... 27
A. Crude gum arabic exports ................................................................................................... 28
B. Crude gum arabic imports .................................................................................................. 40
C. Processed gum arabic exports ............................................................................................ 46
D. Processed gum arabic imports ............................................................................................ 51
CHAPTER V PRICES .............................................................................................. 59
CHAPTER VI CONCLUSION ..................................................................................... 63
REFERENCES................................................................................................................ 65
ANNEX ........................................................................................................................ 69
viiCONTENTS
TABLES
Table 1 Gum arabic products by ascending level of sophistication ................................................... 15
Table 2 Value addition in the formal market for friable gum, Cameroon, 2006 .................................. 22
Table 3 Value addition in the informal market for friable gum, Cameroon, 2006 ................................ 23
Table 4 Value addition in the market for hard gum in Hawata, Gedaref State, Sudan, 2013 ............. 25
Table 5 Estimated crude gum arabic export quantities, by country of origin, 1992–2016 ................. 30
Table 6 Estimated crude gum arabic export values (FOB), by country of origin, 1992–2016 ............. 37
Table 7 Crude gum arabic import quantities, by country or region of destination, 1992–2016 ......... 41
Table 8 Crude gum arabic import values (FOB), by country or region of destination, 1992–2016 ..... 43
Table 9 Processed gum arabic export quantities, by country or region of origin, 1992–2016 ........... 47
Table 10 Processed gum arabic export values (FOB), by country or region of origin, 1992–2016 ....... 49
Table 11 Processed gum arabic mirror import quantities, by country or region of destination, 1992–2016 ......................................................................................................................... 52
Table 12 Processed gum arabic mirror import values (FOB), by country or region of destination, 1992–2016 ......................................................................................................................... 54
viii COMMODITIES AT A GLANCE - Special issue on gum arabic
FIGURES
Figure 1 Gum arabic global value chain: Simplified scheme .............................................................. 14
Figure 2 Shares of total value added and FOB price, formal market for friable gum, Cameroon, 2006 .. 23
Figure 3 Margins in the formal and informal markets for friable gum, Cameroon, 2006 ...................... 24
Figure 4 Distribution of FOB export price by market type, Indian processed friable gum, 2006 .......... 24
Figure 5 Reported and estimated crude gum arabic exports, 1992–2016 ......................................... 29
Figure 6 Reported and estimated crude gum arabic exports, Sudan and Senegal, 1992–2016......... 32
Figure 7 Crude gum arabic export quantities, by main exporters, 1992–2016 ................................... 32
Figure 8 Crude gum arabic export quantity market shares, by main exporters, 1992–2016............... 32
Figure 9 Crude gum arabic export quantities, other Africa, 1992–2016 ............................................ 34
Figure 10 Crude gum arabic export quantities, medium exporters, 1992–2016................................... 34
Figure 11 Crude gum arabic re-exports, by country group, 1992–2016 ............................................. 35
Figure 12 Crude gum arabic re-exports as a percentage of exports from the African gum belt, 1992–2016 ......................................................................................................................... 35
Figure 13 Gum arabic exports and mirror imports, Central African Republic, 1994–2000 .................... 36
Figure 14 Gum arabic mirror imports from countries in the vicinity of producing countries, 2000–2016 .. 36
Figure 15 Freight and insurance factors for crude and processed gum arabic, 1992–2016 ................. 36
Figure 16 Crude gum arabic export values (FOB), by main exporters, 1992–2016 .............................. 39
Figure 17 Crude gum arabic export value market shares, by main exporters, 1992–2016 ................... 39
Figure 18 Crude gum arabic import quantities, by main importers, 1992–2016 ................................... 40
Figure 19 Crude gum arabic import quantity market shares, by main importers, 1992–2016 .............. 40
Figure 20 Crude gum arabic import values (FOB), by main importers, 1992–2016 .............................. 45
Figure 21 Crude gum arabic import value market shares, by main importers, 1992–2016 ................... 45
Figure 22 Processed gum arabic export quantities, by main exporters, 1992–2016 ............................ 51
Figure 23 Processed gum arabic export quantity market shares, by main exporters,1992–2016 ......... 51
Figure 24 Processed gum arabic export values, by main exporters, 1992–2016 ................................. 51
Figure 25 Processed gum arabic export value market shares, by main exporters, 1992–2016 ............ 51
Figure 26 Processed gum arabic import quantities,by main importers, 1992–2016 ............................. 56
Figure 27 Processed gum arabic import quantity market shares, by main importers, 1992–2016 ....... 56
Figure 28 Processed gum arabic import values, by main importers, 1992–2016 ................................. 56
Figure 29 Processed gum arabic import value market shares, by main importers, 1992–2016 ............ 56
Figure 30 Kordofan hashab, FOB Port Sudan, 2006–2016 ................................................................. 60
Figure 31 Nigeria Grades 1 and 2, CIF NW Europe,1997–2009 ......................................................... 60
Figure 32 Reference price and export unit value, Sudan, 2006–2016 ................................................... 61
Figure 33 Reference prices and export unit value, Nigeria, 1998–2006 ................................................... 61
Figure 34 Export unit values, Sudan, Chad and Nigeria,1992–2016 .................................................... 61
ixCONTENTS
Figure A1 Burkina Faso: Reported and estimated exports of crude gum arabic, 1992–2016 ............... 69
Figure A2 Cameroon: Reported and estimated exports of crude gum arabic, 1992–2016 ................... 69
Figure A3 Eritrea: Reported and estimated exports of crude gum arabic, 1992–2016 ......................... 69
Figure A4 Ethiopia: Reported and estimated exports of crude gum arabic, 1992–2016 ....................... 69
Figure A5 Kenya: Reported and estimated exports of crude gum arabic, 1992–2016 ......................... 69
Figure A6 Mali: Reported and estimated exports of crude gum arabic, 1992–2016 ............................. 69
Figure A7 Mauritania: Reported and estimated exports of crude gum arabic, 1992–2016 ................... 70
Figure A8 Niger: Reported and estimated exports of crude gum arabic, 1992–2016 ........................... 70
Figure A9 Nigeria: Reported and estimated exports of crude gum arabic, 1992–2016 ........................ 70
Figure A10 Senegal: Reported and estimated exports of crude gum arabic, 1992–2016....................... 70
Figure A11 Sudan: Reported and estimated exports of crude gum arabic, 1992–2016 ......................... 70
Figure A12 Uganda: Reported and estimated exports of crude gum arabic, 1992–2016 ....................... 70
Figure A13 United Republic of Tanzania: Reported and estimated exports of crude gum arabic, 1992–2016 ......................................................................................................................... 70


CHAPTER IINTRODUCTION
Phot
o co
urte
sy o
f ALL
AND
& RO
BERT

2 COMMODITIES AT A GLANCE - Special issue on gum arabic
Gum arabic is a dried exudate obtained from the stems and branches of certain species from the Acacia genus.1 Given its many desirable properties, safety record and natural origin, it is the most commercially valuable exudate gum, with wide applications in industries as diverse as food and beverages, pharmaceuticals, cosmetics, printing, ceramics, photosensitive chemicals, pyrotechnics, textiles, paper, ink, paints and adhesives. Produced primarily in arid wooded savannas in sub-Saharan Africa, but also in smaller quantities in South Asia and the Arabian Peninsula, gum arabic is consumed predominantly by manufacturers in developed and emerging economies. Exports of crude and semi-processed gum arabic almost tripled in the last 25 years, from an annual average of 35,000 tons in 1992–1994 to an annual average of 102,000 tons in 2014–2016. In addition, exports of processed gum arabic more than tripled, from 17,000 tons to 53,000 tons in the same period. Export revenues reached an estimated average of $337 million per year in 2014–2016, 44 per cent of which accrued to crude and semi-processed gum and 56 per cent to processed gum. Overcoming the uneven distribution of economic gains along the value chain by increasing local processing and ensuring higher compensation for resource-poor gum collectors are among the main challenges faced by producing countries.
Due to its potential to generate foreign exchange reserves, ensure food security, promote sustainable agriculture and forestry, and combat desertification and climate change, gum arabic is a promising commodity for a number of sub-Saharan African countries. It has the potential of playing a critical role in producer countries’ efforts to achieve the Sustainable Development Goals set forth in the 2030
1 The ownership of the Latin genus name Acacia has been the object of one of the longest-running debates in the history of botanical nomenclature. When the botanist George Bentham defined the modern Acacia genus in the 1840s, he named it after Acacia nilotica, a widely-known Afro-Asiatic species described by Linnaeus in 1753. Subsequently, the genus ex-panded to over 1,300 species with morphological similarities to Afro-Asiatic acacias, of which approximately 1,000 were native to Australia. Increased demand by botanists to split the large cosmopolitan genus into monophyletic genera culminated in a controversial decision, at the 2005 International Botanical Congress, to reserve the name Acacia for a new genus com-posed of Australian species and adopt new names for the non-Australian genera. This decision generated an unprecedented amount of public indignation because the normal application of the rules of priority would instead have kept the name Acacia for a subset of species native to Africa, Asia and the Americas (Kull and Rangan, 2012). The current report adopts the pre-2005 nomenclature, according to which both Australian and non-Australian species belong to the Acacia genus.
Agenda for Sustainable Development. This issue of the Commodities at a Glance series explores the economic, social and environmental relevance of the gum arabic sector, with a focus on supply, demand, prices and market organization. Its aim is to present information in a clear, concise and reader-friendly format. In particular, the report makes an important contribution by constructing a comprehensive and improved dataset on crude and processed gum arabic trade flows.
This special issue on gum arabic is organized in six chapters. The remainder of the current introductory chapter reviews the history, regulatory status, geographical distribution, ecological characteristics and biochemical properties and functions of gum arabic. Chapter II discusses traditional uses and modern industrial applications. Chapter III describes the gum arabic value chain, with a focus on the main agents at different stages of transformation. Chapter IV examines global supply and demand for crude and processed gum arabic. Chapter V analyses the evolution of gum arabic prices over time and across countries and product types. Chapter VI presents policy recommendations and concludes the report.
A. HISTORICAL OVERVIEW
Recorded use of gum arabic dates back to 2000 B.C., when ancient Egyptians employed it in foodstuffs, hieroglyphic paints and mummification ointments. Its properties were discussed in Theophrastus’s Historia Plantarum and Pliny’s Historia Naturalis, two of the most important natural history treatises written in classical antiquity. Gum arabic was also used in mural paintings in early Christian catacombs and in manuscript illumination and medical treatments in medieval Europe and the Middle East. At the time, European traders classified gums into geographical varieties, to which commercial value was attributed based on their purity levels. The term “gum arabic” was ascribed to high-quality African gum imported from Arab ports, such as Alexandria and Jeddah. As the Ottoman Empire controlled these ports in the Late Middle Ages, the product was once commonly known as “Turkey gum”. By contrast, the term “East Indian gum” referred to gum that was imported into Mumbai from Red Sea ports, mixed with inferior quality local gums, and re-exported.
European maritime expansion put an end to the gum monopoly exerted by Turkish-Arab ports. In the second half of the fifteenth century, Portuguese traders moved

3CHAPTER I - INTRODUCTION
up the Senegal and Gambia rivers, exchanging cloth and hardware for gum arabic, gold and slaves. As the centre of gravity of European trade shifted from the Mediterranean Sea to the Atlantic Ocean, the “Gum Coast” of present-day Mauritania and Senegal became virtually the sole commercial supplier of gum arabic to Europe.2 Competition between European powers for control of the gum trade led to the so-called “Gum Wars” in the eighteenth century. Gum arabic was the only agricultural or arboreal commodity that was exported from West Africa to Europe in substantial quantities prior to the abolition of the Atlantic slave trade in the nineteenth century.
The Industrial Revolution stimulated European demand for gum arabic – which was indispensable in the production of textiles, paper, ink and cosmetics – and bolstered commercial opportunities for the gum-producing region in the upper Nile river valley, in the present-day Sudan. Control of the lucrative gum arabic trade was one factor that motivated the Egyptian invasion of the Sudan in 1820. The Egyptians imposed a monopoly on gum arabic marketing and provided export concessions to a small number of European merchants. Mounting international pressure led Egypt to liberalize gum arabic trade in 1842–1843 and again in 1849. By the early twentieth century, the Anglo-Egyptian Sudan replaced Senegal as the most important world supplier. Concomitantly, France and Great Britain reinforced their position as leaders in the processing and re-exporting of gum arabic.
The thriving Sudanese gum arabic trade aroused interest in British administrators in the Protectorate of Nigeria, where large stretches of land covered in acacia trees remained economically unexploited due to lack of expertise in gum collection and marketing. Early efforts by British firms to export gum arabic from Nigeria were not met with success, as improper sorting and grading resulted in low-quality gum that commended unprofitable prices in Europe. After studying the organization of gum arabic production in the Sudan and the sorting and grading practices in the transhipment ports of Bordeaux and Trieste, the British established a steady gum trade between Nigeria and Europe in the 1930s. European colonialism was also behind the development of a modern gum industry in the Horn of Africa. During the 1940s, Italian colonial authorities introduced organized tapping and harvesting of natural gums on a commercial scale in
2 The gum arabic exported through European trading posts in the Gum Coast originated from the Sahelian zones of present-day Mali, Mauritania and Senegal.
Somalia and Eritrea, from where it spread to Ethiopia. The commercial potential of gum arabic in most other sub-Saharan African countries remained largely untapped until cultivation began in Chad in the 1950s.
The prolonged drought in the Sahel in 1968–1975, the shorter drought in 1983–1985 and intermittent political unrest resulted in substantial setbacks to gum trade. As acacia forests and plantations were decimated, production and exports dropped sharply and stocks were depleted. Exports revived at a slow pace in the 1980s and 1990s, despite the return of normal rainfall levels, since part of the pre-existing demand in developed countries switched to substitutes during the periods of short supply. Unfavourable domestic policies, such as excessive taxation and marketing and export monopolies, further reduced producer prices and discouraged production in a number of African countries.
Market liberalization, rising demand from emerging markets and the advent of new commercial applications, such as in nutraceutical and pharmacological products, improved the sector’s prospects in the new millennium. High producer prices in 2005 pushed world crude gum arabic exports beyond 70,000 tons for the first time since the early 1970s. Trade volumes more than doubled within 15 years, from 50,000 tons in the early 2000s to 113,000 tons in 2016. Since the opening of Africa’s first gum arabic spray drying3 facilities in Nigeria and the Sudan in the late 1990s and early 2000s, countries that once exported only crude and semi-processed gums are now gradually entering the market for higher value added processed gums, which is dominated by firms from developed countries. Recent developments in gum arabic supply, demand and prices are discussed in detail in chapters IV and V.
B. REGULATORY STATUS
The term “gum arabic” may be used with varying degrees of restrictiveness. In its broadest sense, it encompasses dried exudates from the Acacia, Albizia and Combretum genera. Another broad conception comprises gums from all Acacia species, but excludes
3 Spray drying is an advanced method of processing liquid feeds into customized formulations. It consists of three stag-es: (i) atomization, when droplets are formed; (ii) drying, when liquids are evaporated through exposure to gas; and (iii) pow-der recovery, when dried particles and gas are separated. The method is widely applied in the production of flavour, encap-sulated fragrance, pharmaceutical, cosmetic, light industrial and animal feed products.
4 COMMODITIES AT A GLANCE - Special issue on gum arabic
gums from other genera. More restricted definitions of gum arabic may refer to gums produced by Acacia senegal and a subset of related Acacia species, or even to gums produced exclusively by Acacia senegal.
In the context of food additives, an internationally-accepted and unambiguous definition of gum arabic was first established in 1969 by the Joint FAO-WHO Expert Committee on Food Additives (JECFA), an international scientific expert committee administered jointly by the Food and Agriculture Organization of the United Nations (FAO) and the World Health Organization (WHO). Since then, JECFA has been the competent authority on the subject, periodically re-evaluating and updating the international definition and standard characteristics. International definitions for food additives arise from the need to ensure that their ingestion is not associated with health hazards. Products that comply with JECFA specifications have been tested and shown to be safe for human consumption. The latest specification, published in 1999, defines gum arabic as “a dried exudation obtained from the stems and branches of Acacia senegal (L.) Willdenow or Acacia seyal (fam. Leguminosae)”, and lists a number of identification and purity characteristics, such as solubility, constituents, ash content, lead content and loss on drying.
As the JECFA specification has important market implications, it has been the subject of heated international debate. By determining the types of gum that can be labelled as gum arabic for food additive purposes, the JECFA characterization provides incentives to producers of specific species. The breadth of the definition has fluctuated significantly over time. In 1986, JECFA defined gum arabic as “a dried exudation obtained from the stems and branches of Acacia senegal (L.) Willdenow or related species of Acacia (Family Leguminosae)”. Since the specification did not provide details on what constituted a “related species”, more than one thousand Acacia species and subspecies could potentially be identified as sources of gum arabic. In 1990, JECFA adopted a new specification with three explicit criteria: (i) gum arabic should originate from Acacia senegal or “closely related species”, (ii) its optical rotation4 should be between minus 26 and minus 34 degrees, and (iii) its nitrogen content should be between 0.27 per cent and 0.39 per cent. These 4 Optical rotation is the angle through which the plane of polar-
ized light is turned after passing through an optically active substance.
parameters were seemingly selected to ensure that only gum from Acacia senegal (and closely related species) could qualify as gum arabic (Coppen, 1995). However, in 1995, JECFA dropped the optical rotation and nitrogen content requirements, as they had the unintended effect of excluding gums from certain types of Acacia senegal.5 Finally, JECFA replaced the reference to “closely related species” with a direct reference to Acacia seyal in 1998, and republished the specification in 1999 to include editorial changes. The inclusion of a direct reference to Acacia seyal was supported by countries with extensive populations of this species, such as Chad and Nigeria, and opposed by the Sudan, where gum was produced mostly from Acacia senegal.
Although the definition of gum arabic for food additive purposes has remained unchanged since 1998–1999, the issue continues to generate disagreement among gum-producing countries. In 2016, the Sudan put forward a proposal at JECFA to divide gum arabic into two subclasses based on the botanical sources of natural gum extracts, for which separate safety evaluations would be necessary. Burkina Faso, Chad, Eritrea, Ethiopia, Kenya, the Niger, Nigeria, Senegal and South Sudan sustain that there is no technical or scientific evidence to justify having more than one specification for the botanical sources currently classified as gum arabic (Codex Alimentarius Commission, 2016). For purposes of this issue of the Commodities at a Glance series, the term “gum arabic” is defined as in the 1999 JECFA specification. Unless otherwise stated, references to gum arabic are understood to encompass gums obtained from both Acacia senegal and Acacia seyal. Gums obtained from other Acacia species or from other genera are not covered in this report. The choice of the JECFA definition in the current report is appropriate, given that the majority of the gum arabic traded internationally is used in the food and beverages sectors and must, therefore, comply with stricter food additive specifications.
The use of the JECFA definition of gum arabic implies that gums that may be marketed as gum arabic, but which do not originate from Acacia senegal or Acacia seyal, are not analysed in this report. This includes, for example, gums originating from Acacia karroo 5 For example, according to the JECFA specification in effect
between 1990 and 1995, Kenyan gum originating from Aca-cia senegal of the kerensis variety did not qualify as gum ara-bic, as it fell outside the established limits for optical rotation and nitrogen content (Jurasek et al., 1993).

5CHAPTER I - INTRODUCTION
in Southern Africa or Acacia polyacantha in Benin, Côte d’Ivoire, Ghana and Togo (Chikamai, 1998). Other Acacia species from which lower quality gums are collected include Acacia dudgeoni, Acacia laeta, Acacia nilotica, Acacia paoli and Acacia sieberana (ITC, 1978; Coppen, 1995; Muller and Wata, 1998).
In addition to the JECFA specifications, FAO and WHO established a harmonized naming system for food additives known as the International Numbering System for Food Additives (INS). In this system, gum arabic is identified by the code INS 414. Australia, the Cooperation Council for the Arab States of the Gulf, the European Union, Iceland, Israel, New Zealand, Norway, South Africa and Switzerland have adopted national food additive numbering systems that generally correspond to the INS. On packaging, approved food additives are written with a prefix E in the European Union, Iceland, Norway and Switzerland (i.e. E414) and without a prefix in Australia and New Zealand (i.e. 414). Canada, Japan and the United States of America are among the countries that do not use INS codes on packaging.
Some countries and regional blocks also publish their own definitions of gum arabic, which may differ from the JECFA specification. For example, the European Union, Japan and the United States take a broader view of gum arabic in their food additives regulations, since they consider it to include dried exudations obtained from Acacia senegal or related species of Acacia (“closely related species” in the case of the European Union). Other national and regional regulations have also influenced global supply and demand. In the United States, the characterization of gum arabic as “generally recognized as safe” (GRAS) in 1961 and its affirmation for direct use in foodstuffs in 1974 increased its appeal to users. The European Union decision to grant gum arabic the official food ingredient status in 2008 also improved its marketability, as hitherto it was only allowed to be marketed as a food additive.
C. GEOGRAPHICAL DISTRIBUTION AND ECOLOGICAL CHARACTERISTICS
The principal area of geographical distribution of Acacia senegal and Acacia seyal, the two internationally recognized botanical sources of gum arabic, is the so-called gum belt of Africa: the vast arid wooded savannas that span sub-Saharan Africa, from Mauritania and Senegal, in the west, to the Sudan, Eritrea, Somalia, Kenya and the United Republic of
Tanzania, in the east. The two Acacia species are also found in Oman, Pakistan (provinces of Baluchistan and Sindh) and India (States of Gujarat, Haryana, Madhya Pradesh, Punjab, Rajasthan and Uttar Pradesh).6
Acacia senegal grows best in deep, sandy and well-drained soils, in areas with average precipitation between 200 and 500 mm per year and a bioclimate of the warm subdesert type (i.e. dry season of 9–11 months per year). However, the species is also found in poorly drained soils (such as light sandy-clay soils, brown clays or clay sandstones), in areas receiving up to 800 mm of rain per year and a bioclimate of the dry tropical type (i.e. dry season of 8 months per year) (ITC, 1978).
Acacia seyal thrives in clay, sandy-clay and sandy soils that are often flooded in the winter time. It grows frequently on alluvial plains and previously cultivated grounds. From the climatic point of view, it is found in areas with isohyets ranging between 200 and 1000 mm per year and bioclimates ranging from the warm subdesert type to the strongly tropical type (i.e. dry season of 7–8 months per year) (ITC, 1978).
The presence of trees from the Acacia senegal or Acacia seyal species in a given region is a necessary, albeit insufficient, condition for gum arabic production. Acacia forests may remain commercially unexploited due to the lack of production and marketing skills, capital shortfalls, poor infrastructure, and civil and political unrest, among other reasons.
Due to encroaching desertification, a southward shift in the natural distribution of Acacia senegal and Acacia seyal has been observed in recent decades. If soil overexploitation and climate change are left unchecked, this shift is projected to continue. Paradoxically, planting acacia trees in large tracks of land can be used to prevent desert encroachment and even reclaim desert land. In 2007, the African Union launched the Great Green Wall project, a pan-African effort to battle desertification and tackle poverty and land degradation across the Sahel region by planting trees and creating economic opportunities for the local population. As part of this initiative, the World Bank and the Global Environmental Fund (GEF) are supporting the Government of Mauritania as it fights
6 Some sources stipulate that gum arabic-yielding species were introduced to Australia, Egypt, Puerto Rico and the Virgin Is-lands. However, Liogier and Martorell (2000) contend that the species known as “gum arabic tree” in the Caribbean is in fact Acacia nilotica, a species that is not included in the JECFA definition of gum arabic.

6 COMMODITIES AT A GLANCE - Special issue on gum arabic
desertification by regenerating acacia trees and expanding gum arabic production.7
Since Acacia senegal and Acacia seyal trees fix nitrogen to the soil, they contribute to climate change mitigation and adaptation by increasing soil fertility, plant coverage and crop yields. For example, in the Sudan, acacia cultivation is often rotated with crop cultivation: aging acacia gardens are cleared for the cultivation of sorghum, sesame, millet or groundnuts; when crop yields decline, fields are abandoned for adjacent locations; abandoned plots are then recolonized by acacia trees, which increase soil fertility in preparation for a new cycle of crop cultivation.
In the context of the United Nations Framework Convention on Climate Change, the Governments of four gum arabic producing countries – Ethiopia, Senegal, South Sudan and the Sudan – included the rehabilitation of acacia woodlands and the establishment of acacia nurseries as priority activities within their National Adaptation Programmes of Action (NAPA). Furthermore, the Governments of four gum arabic producing countries – Mali, the Niger, Somalia and the Sudan – included explicit references to the planting and rehabilitation of acacia gardens in their Intended Nationally Determined Contributions (INDC).
In certain regions of the African gum belt, practices at the micro level reflect the goals set by national authorities. For example, in the Bara district of North Kordofan State, in the Sudan, 42.9 per cent of sampled households in 2014 expanded Acacia senegal plantations as an adaptation strategy to combat climate change and improve crop yields (Khalifa et al., 2016). Other strategies used in the region include the formation of gum arabic producer associations and the adoption of communal forests, reported by respectively 18.6 per cent and 10 per cent of respondents. In the gum producing regions of the Niger, the restocking and planting of valuable trees (including acacia trees) and the protection of acacia seedlings were the second and third most widely adopted climate change coping strategies, cited by 15.6 per cent and 14.7 per cent of respondents, respectively (Djibo et al., 2016).
7 Initiated in 2016, the World Bank-GEF project is expected to promote sustainable landscape management techniques, enhance access to commercial markets and enable the de-velopment of a sustainable gum arabic value chain in 39 com-munes in the regions of Brakna, Gorgol and Trarza, in south-ern Mauritania.
D. BIOCHEMICAL STRUCTURE AND FUNCTIONS
Gum arabic is a complex composite of glycoproteins, polysaccharides and salts that takes the form of solid spheroidal tears of varying size. The gum obtained from Acacia senegal ranges in colour from pale white to orange-brown and possesses a matt surface texture. When processed to the broken or kibbled state, it acquires a paler and glassy appearance. The gum from Acacia seyal is darker and more brittle than the hard tears obtained from Acacia senegal. Other commercially available forms of gum arabic include white to yellowish-white flakes, granules and roller-dried or spray-dried powders. Unlike most natural gums, gum arabic dissolves well in water and does not interact with other chemical compounds. It is also odourless, tasteless and translucent. For marketing purposes, Acacia senegal gum is designated as hard gum, whereas Acacia seyal gum is referred to as friable gum. In the Sudan, these two types of gum arabic are commonly known as hashab and talha, respectively.
The chemical composition of gum arabic may vary with botanical source, tree age, climatic conditions and soil environment (Dauqan and Abdullah, 2013). Studies have shown that there is genetic variability among the Acacia senegal genotypes growing in Africa, particularly across the four recognized varieties: Acacia senegal var. senegal, Acacia senegal var. kerensis, Acacia senegal var. leirhochis, and Acacia senegal var. rostrata (Mokwunye and Aghughu, 2010). Nevertheless, the principal polysaccharide is found to be arabic acid, a polymeric carbohydrate molecule linking a D-galactose with branches composed of L-arabinose, L-rhamnose and D-glucuronic acids; proteins are essentially arabinogalactans; and the major amino acids are hydroxyproline, serine, proline and aspartic acid (Badreldin et al., 2008).
Gum arabic has two highly desirable properties: (i) it readily dissolves in water to form highly concentrated solutions of relatively low viscosity, and (ii) it effectively stabilizes oil-in-water emulsions (William and Philipps, 2001). Given its biochemical structure and properties, gum arabic performs a number of important functions. It can serve as an emulsifier, stabilizer, thickener, bulking agent, carrier, glazing agent, antioxidant, humectant and firming agent. Industrial applications derived from these functional classes are described in the next chapter.

CHAPTER IIUSES
Phot
os c
redi
t: ©
Fot
olia

8 COMMODITIES AT A GLANCE - Special issue on gum arabic
Gum arabic has many uses, in both traditional practices and modern industrial applications. A gum’s suitability for each use depends largely on product specifications. For certain usages, hard gum obtained from Acacia senegal may be more desirable than friable gum from Acacia seyal, or vice-versa. In addition, industrial applications may require sophisticated processing capabilities that are usually not available in the regions where crude gum arabic is produced.
A. TRADITIONAL USES
In the drylands of sub-Saharan Africa, gum arabic is used as food, traditional medicine and a basic item for domestic activities, such as laundering and plastering. It is consumed as a famine food in periods of severe drought and food insecurity (Ruffo et al., 2002; Fratkin et al., 2004) and as a regular foodstuff by herders and gum tappers in remote arid zones (Gachathi and Eriksen, 2011).8 Given its lack of taste and the stigma associated with its consumption, gum arabic is generally rejected as a food source in normal times.9
Gum arabic is also used in traditional medicine and religious rituals in various countries in the African gum belt. The gum is believed to combat sore throats, the common cold, backaches, painful joints, stomach and intestinal disorders, kidney pains, eye diseases and haemorrhages. Moreover, in certain communities, gum arabic is perceived to drive away evil spirits and witches. Based on such customary beliefs, the Government of the Sudan developed a marketing campaign to encourage local gum consumption (Muller and Okoro, 2004).
The degree of utilization of gum arabic varies significantly across regions in Africa, in accordance with traditional knowledge associated with acacia trees. For instance, in the Sudan, where experience in gum arabic production has accumulated throughout generations, the gum is the most widely used part of acacia trees. By contrast, in Uganda, where local knowledge of gum arabic is limited, local populations generally opt for using the trunks and branches of acacia trees for fuelwood, fencing and fodder for
8 Whereas fresh wet gum may be eaten directly, dried gum must be diluted in water.
9 In a survey of 184 rural households in the Luwero and Na-kasongola districts of Uganda, Obua et al. (2006) found that 6.5 per cent of respondents acknowledged consuming gum arabic as food. Gum arabic is also used as an appetite sup-pressant in Burkina Faso (Shackleton et al., 2011).
domestic animals (Obua et al., 2006; Egadu et al., 2007).
Eltahir et al. (2013) record 23 local uses of gum arabic among gum tappers, collectors and the general population in rural villages in the State of North Kordofan, in the Sudan. For example, gum powder and runny gum are blended with charcoal to produce an ink preparation widely used in schools. In addition, dusty and impure gums are fermented in animal waste, mud and water to yield a special paint that protects houses from heavy rain. In Cameroon and Nigeria, gum arabic is used in the production and cleaning of traditional head caps (Muller and Okoro, 2004; Njomaha, 2008). In the subregion of Karamoja, in Uganda, peasants use gum arabic for repairing household items, gumming spears, gluing arrows and joining leather (Obua et al., 2006). In the Middle East, gum arabic is used as a depilatory or mixed with fat or grease to anoint the body (Wickens et al., 1995).
Although heaps of gum arabic may be found in local markets in the gum belt of Africa, domestic use and local trade are small in relation to exported volumes. Most gum arabic produced in Africa is shipped to developed and emerging economies, where it is processed and used in modern industrial applications.
B. INDUSTRIAL USES
Thanks to its properties and multiple functions, gum arabic is used for a variety of purposes across many industries. Its principal industrial applications are in confectionary, where it controls texture and inhibits sugar crystallization, and in beverages, where it functions as an emulsifier and flavour encapsulator. Gum arabic is also used in other sectors of the food industry, such as in dairy products, bakery products, dressings, flavourings and dietary fibres. Moreover, it plays an important role as an emulsifier and stabilizer in the pharmaceutical and cosmetic industries. Additional industrial applications are found in ink, paper, printing, lithography, ceramics, photography and pyrotechnics. Once important, use in textiles, paints and adhesives – including the traditional office glue and postage stamps – has decreased significantly, especially in developed countries (Magid et al., 2014).
The exemption of gum arabic from the broad economic sanctions imposed by the United States against the Sudan seems to highlight the crucial role played by the product in some key industries. Introduced in November 1997, the original sanctions prohibited the importation of any goods or services

9CHAPTER II - USES
of Sudanese origin, other than information or informational materials. However, due to inadequate commercial quantities of high-grade raw gum arabic available from other countries, the Secretary of the Treasury, upon recommendation of the Secretary of State, issued limited licences between 1997 and 2000 to permit United States processors to import gum arabic in raw form from the Sudan. Finally, in November 2000, following pressure from domestic manufacturers,10 the United States Congress adopted legislation that required prompt consideration of any license application for the import of gum arabic from the Sudan, making the dried acacia exudate the sole product to be effectively exempted from the comprehensive trade restrictions for almost 17 years.11
The gum arabic market can be best understood as the sum of separate market segments. In each segment, the special properties of the gum allow it to perform important functions in product formulations. The main market segments for gum arabic are examined below.
Confectionery
An important reason for the prominent role of the confectionary industry among users of gum arabic is that this essential input may be used in high concentrations in some confections. For example, hard candies are prepared using gum arabic at concentrations between 40 per cent and 55 per cent of total solids. Soft candies, including candy bars, chocolates and nougat, are generally 30 to 35 per cent gum arabic. In the United States, food safety regulations allow soft candies to be up to 85 per cent by weight gum arabic.
The first key function played by gum arabic in most confectionary products is the prevention of sugar crystallization. Therefore, it finds substantial application in confections with a high sugar content and low moisture content, such as jujubes and pastilles. The second main function played by gum arabic is to act as an emulsifier, maintaining a uniform distribution of fat across products and preventing the formation of greasy and oxidisable films at the surface.
10 United States manufacturers argued that unilateral sanctions lessened the quality of their products, reduced their sales domestically and abroad, and provided a qualitative advan-tage to foreign competitors. The inability to import high quality Sudanese gum arabic negatively impacted not only domestic gum arabic processors, but also numerous domestic manu-facturers in the beverage, food, pharmaceutical and other industries.
11 The United States comprehensive ban on imports from the Sudan was revoked on 12 October 2017.
In addition, gum arabic has other important functions for particular types of confections. For example, it may be used as a whipping agent in aerated confections (such as marshmallows, nougat and meringues), a film former in confectionary coatings (such as chocolates, nuts and dragees), a gelling agent in the preparation of liquorice, or a binding agent in the production of chewing gum. While hard gum is the best type of gum arabic for most applications in the confectionary industry, friable gum is preferred for confectionary coatings.
In low-calorie candies, gum arabic is used to compensate for the loss of texture, mouthfeel and body resulting from the replacement of sugars by artificial sweeteners (Checkuri et al., 1983; Huzinec and Graff, 1987). Moreover, the caloric content of a confection may be decreased by increasing the percentage by weight of gum arabic in the product formulation (Flowerman, 1985).
The global gum arabic shortages in 1973–1974 and 1984–1985 led many companies to develop alternative formulations involving other hydrocolloids, such as starches or pectins, for partial or total replacement of the unavailable gum. In the United States, non-dietetic hard and gummy candy makers nearly completely eliminated the use of gum arabic in the second half the 1980s, in favour of readily available, less costly and only slightly underperforming starches. In confectionary coatings, the switch was only temporary, as manufacturers readopted gum arabic after starch reformulations proved inferior in quality (Flowerman, 1985). In the wine gum industry of the United Kingdom of Great Britain and Northern Ireland, gum arabic was found to produce a clarity that could not be matched by other hydrocolloids, in addition to providing a controlled flavour release (Williams and Phillips, 2001).
Beverages
Gum arabic is widely used in the preparation of concentrated flavour oil emulsions for use in cola and citrus-based soft drinks. It inhibits droplet flocculation and coalescence in concentrated emulsions and solutions with sugar-containing carbonated water. A typical beverage emulsion contains 5–20 per cent gum arabic, 4–8 per cent flavour oil, and 4–8 per cent weighting agent. Gum concentration in the finished product is lower than during the manufacturing process (usually under 1 per cent). In the United States, gum arabic may not exceed 2 per cent by

10 COMMODITIES AT A GLANCE - Special issue on gum arabic
weight of beverages and beverage bases. This contrasts sharply with the high permitted usage levels in soft candies.
Gum arabic is an effective foam stabilizer for beverages and is largely responsible for the lace curtain effect on the sides of beer glasses. It also functions as a clouding agent, giving an eye-appealing opacity to beverages, which imitates the effect of added fruit pulps and juices. In winemaking, the major application of gum arabic is to stabilize young red wines against colour pigment precipitation and copper, iron and protein hazes. In addition, it reinforces organoleptic characteristics in both white and red wines, imparting softness and roundness, diminishing bitterness and astringency, and leading to a better taste and mouthfeel perception (Iniesta Ortiz and Ramírez Carrera, 2005; Teissedre, 2012). In beverage dry mixes, gum arabic produces opacity, appearance, mouthfeel and palatability similar to natural fruit juices. Gum arabic is also a source of soluble fibre in low-calorie and dietetic beverages (Phillips, 1998).
Hard gum is the preferred type of gum arabic in the beverage market segment, as it is best at stabilizing beverages with various ingredients. However, both hard gums and friable gums are used in winemaking: the former for their stabilizing power; the latter for imparting roundness and improving mouthfeel. Beverages are the main application of gum arabic in Europe, due to its wide utilization in wine, beer, whisky and other beverages. The beverage segment is also important in certain non-European countries with significant wine production, such as Argentina, Chile, South Africa and Uruguay.
Other food industries
Gum arabic finds extensive use as an encapsulating agent for flavours that are incorporated into dry foods, such as soups and dessert mixes. The gum forms a coating around the flavour particles and inhibits oxidation and evaporation of volatile material. Generally, dry food mixes are 7 per cent flavour and 28 per cent gum arabic. However, in order to reduce costs, gum arabic may be used in conjunction with maltodextrin, in a proportion of 10 per cent flavour, 15 per cent gum arabic and 25 per cent maltodextrin.
In the dairy industry, gum arabic is used as a stabilizer in frozen products due to its water absorbing properties. Its addition produces a finer texture in ice cream, prevents the formation of ice crystals and retards melting. Gum arabic provides sealing and glossy
coating in cereals and baked goods, and a fibrous, fruit-like texture in jelly products. It also functions as an emulsifier in chips, pretzels and dressings; as a stabilizer and thickener in non-dairy milk, creamers, coffee and toppings; and as an emulsifier, stabilizer and thickener in gelatines, puddings and fillings.
Hard gum, which is 85 per cent soluble dietary fibre, is used in foods bearing fibre-related nutritional claims. However, as gum concentrations in such applications are high, some manufacturers prefer to use cheaper friable gum. Functional foods are a new and growing segment, the development of which is closely linked to regulatory approvals of health claims by competent authorities. For example, previously accepted only as a food additive, gum arabic is now accepted as a food, food ingredient and dietary fibre of low calorific value. The newly acquired status should facilitate the approval of other claims in the future.
Pharmaceuticals
In the pharmaceutical industry, gum arabic is employed to control viscosity, improve density, suspend insoluble drugs and prevent the precipitation of heavy metals from solutions. It is also used as an emulsifying agent, an adhesive or binder for pharmaceutical tablets, a masking agent for acrid tasting substances, and a demulcent in cough syrups. Gum arabic may be used in the preparation of calamine, kaolin, cod liver oil emulsions, antiseptic preparations, vitamin premixes and food supplements. In some countries, gum arabic may be found in capsule form at pharmacies and health food stores. Although it may help control obesity or aid weight loss, scientific evidence is inconclusive in this respect.
Cosmetics
Gum arabic is used in a variety of cosmetics, particularly in liquid makeup products. It functions as an emulsifying and stabilizing agent in lotions and creams, as a protective agent in hair care products, as a foam stabilizer in liquid soaps, as a thickener in lipsticks and mascara, as a binding agent in face powder cakes, as a film-forming agent in peel-off masks and as an adhesive in blusher and dental adhesives.
Printing
In the printing industry, gum arabic is used as a base for photosensitive chemicals, as a component of solutions used to increase hydrophilicity and impart

11CHAPTER II - USES
ink-repellency to metal plates, and as a protective coating to prevent plate oxidation.
Other industries
Although gum arabic is used in a multitude of other sectors, they account for a small share of total demand, especially when compared with the food and beverages sector. For example, gum arabic is used as a protective colloid and suspending agent in the production of inks, pigments and dyes (for which friable gum is preferred due to its lower cost). Gum arabic is also used as a plasticizer in concrete, a suspending agent in insecticides and pesticides, and a binder and adhesive in fireworks, explosives and cartridge powder.
In addition, gum arabic is used to size paper, strengthen clay in ceramics and control scent diffusion in incense cones and oil candles. It may also be found in shoe polish, pet foods, photograph developing solutions, carbonless copying papers and technical ceramic materials used in the electronics industry.
Gum arabic was once widely used as a sizing and finishing agent in textiles, but the cost is now prohibitively high compared with modern substitutes. Nonetheless, limited use is still found in finishing silk and rayon. Whereas gum arabic was formerly employed in the preparation of paints, adhesives and glues, application in these industries has been mostly supplanted by synthetics.


CHAPTER IIIVALUE CHAIN
Phot
o co
urte
sy o
f ALL
AND
& RO
BERT

14 COMMODITIES AT A GLANCE - Special issue on gum arabic
Table 1 Gum arabic products by ascending level of sophistication
Type or grade Description
Wet gum Freshly collected gum
Natural gum Semi-dried gum (about three weeks after collection)
Cleaned Whole or broken nodules (diameter: 10–20 mm)
Cleaned amber and sifted (CAS) Whole or broken nodules (diameter above 20 mm), pale to dark amber colour, dust and siftings removed
Handpicked selected (HPS) Whole nodules (diameter above 30 mm), lightest colour, dust and siftings removed by hand
Kibbled gum Mechanically broken and sieved CAS or HPS
Mechanical powder Mechanically powdered HPS or CAS
Spray-dried powder Spray-dry powdered HPS, CAS or kibbled gum
Instant soluble gum Granulated gum with improved solubility
Specialty gum Proprietary, customized gum
Source: UNCTAD secretariat.
Value chains describe the range of activities required to bring a commodity from the producer to the consumer, emphasizing the value added at each successive stage. In the case of gum arabic, it may include tree cultivation, harvesting, drying, cleaning, sorting, grading, transportation, storage, processing, marketing and industrial application. Some activities, such as sorting, transportation and processing, may occur several times, at different stages and locations, before the gum reaches the end consumer. Millions of stakeholders participate in the gum arabic value chain on a global scale. The majority are producers in developing countries, who may be collectors, tappers or harvesters. Other agents involved in the value chain include input providers, local merchants, traders, cleaners, sorters, graders, storage and transportation professionals, exporters, importers, processors, users in various industries and the Government.
Gum arabic may be sold through different channels. For example, while some producers may sell their output directly to local retailers or processors, most depend on intermediary agents, who clean, sort, grade, store, transport and export the gum for processing and use abroad. The distribution of returns among agents varies significantly across channels: the greater the number of intermediaries, the lower the return to producers. Gum arabic value chains may vary significantly across and within national boundaries in sub-Saharan Africa. Nonetheless, a number of common patterns are observed in all gum producing countries in the region, including the inequitable sharing of benefits among value chain participants, low value addition, export orientation, and gender segmentation. This chapter analyses the organization of the gum arabic sector,
with a focus on its main agents and the distribution of market returns along the value chain. It examines both the commonalities and idiosyncrasies across countries. A simplified schematic overview of the gum arabic global value chain is depicted in figure 1.
As gum arabic advances through successive stages in the value chain, it may undergo a number of transformations. Table 1 lists types and grades of gum arabic by ascending level of product sophistication. The gum collected by producers needs to be dried for at least three weeks before it can be packed and sold to merchants. It must also be cleaned, sorted and graded based on botanical origin and physical characteristics, such as nodule size and colour, before it is sold to processors or exporters. In the Sudan, Cleaned is the standard grade of hard gum. It is composed of whole and broken nodules with a diameter between 10 mm and 20 mm. Although free of dust, it contains siftings.12 Cleaned amber and sifted (CAS) is a step above Cleaned. It is composed of whole and broken nodules with a diameter above 20 mm, pale to dark amber in colour. It does not contain dust or siftings. The highest grade of hard gum is Handpicked select (HPS), which is composed of whole nodules with a diameter above 30 mm and light in colour. HPS is manually cleaned and does not contain fragments, siftings or dust. The siftings collected during the cleaning and sorting process are sold as a by-product. For friable gum, the common grades in the Sudan are Talha cleaned (diameter above 4 mm), Talha sifting (0.5–4 mm in diameter) and Talha dust (diameter below 0.5 mm).12 Siftings are a mixture of small particles of gum arabic (diameter
between 2.5 mm and 10 mm), sand, bark and other impurities.

15CHAPTER III - VALUE CHAIN
Figure 1 Gum arabic global value chain: Simplified scheme
Source: UNCTAD secretariat.
Note: This diagram provides a simplified graphical representation of the agents, activities and products involved in the gum arabic value chain. Actual flows may vary significantly across countries and over time. For example, some producers may sell natural gum directly to local consumers; some traders may resell natural gum in the informal market; some local processors may pro-cess the cleaned gum into kibbled or powdered gum prior to export; or some foreign processors may export specialty gums to industrial users in a third country.
Agent Activity Product
Industrial user
Processor
Exporter
Trader
Producer
Marketing
Industrial applicationConsumer good
Marketing
Processing
Customs clearance
Export
Customs clearance
Quality control
Transportation
Storage
Cleaning and sorting
Transportation
Gum drying
Gum harvesting
Gum tree tapping
Gum tree cultivation
financing
Activities performed in the Acacia senegal gum and Acacia seyal gum value chains. Activitites that may be performed in the Acacia senegal gum value chain.
Processed gum
Cleaned and sorted gum
Natural gum
Wet gum
Acacia tree

16 COMMODITIES AT A GLANCE - Special issue on gum arabic
In Nigeria, gums are graded into Grade 1 (hard gum, comparable to the Cleaned grade of the Sudan), Grade 2 (friable gum and gums from other Acacia species) and Grade 3 (mixes that may contain gums from Acacia, Combretum, Albizia and other genera, as well as siftings). In Chad, gums are also categorized into grades according to botanical source: Kitir (hard gum) and Talha (friable gum). However, in many other countries, the inexistence of grading systems implies that producers and traders fail to capture value from quality differentiation. As a result, high- and low-quality gums are sold in mixed batches at low unit values.
In order to achieve greater efficiency in industrial applications, crude gum arabic must be refined into more readily soluble forms. The appropriate level of refinement varies according to the desired application. There are two main ways of processing gum arabic: the dry channel, in which successive crushing, sieving, mechanical purification and calibration operations transform crude gum arabic into kibbled gum and powdered gum; and the wet channel, in which crude gum is dissolved in water, centrifuged, filtered and sterilized to obtain spray-dried gum. In addition, some processors produce specialty and customized high-grade gums tailored to specific industries and functionalities. Mechanically powdered gum offers slower solubility (two hours) when compared with spray-dried gum (20–30 minutes) or instant soluble gums (less than 5 minutes). Although there may be significant heterogeneity among processed gums in terms of their per unit value, their chemical composition remains the same. The transformation of crude gum arabic into higher value-added products improves solubility, but does not alter its chemical makeup. The following sections examine the main agents involved in the gum arabic global value chain and the value added in each of its consecutive stages.
A. PRODUCERS
Producers are the first agents in the gum arabic value chain. Their main functions are to collect, dry, pack and deliver the product to a point of sale. Depending on their skills, as well as on land tenure and the botanical source of the gum, producers may also cultivate gum gardens, tap trees, and clean and sort gum. Although some producers are members of farmer-based organizations that increase their bargaining
power vis-à-vis buyers,13 most are dispersed and lack access to market information, financing and adequate infrastructure. As a result, producers are poorly integrated into the global gum arabic value chain, accruing a minor share of the total value added.
Gum arabic producers are generally small, resource-poor, low-income subsistence farmers or pastoralists. Many engage in gum arabic production to enhance household income during the off-season of their primary economic activity, when cash flows fall and food insecurity tends to rise. There are also medium-sized and large producers. Families with large areas at their disposal may hire labour, lease land or enter into share-cropping arrangements with collectors.
Gum collection is an important livelihood activity for vulnerable groups, including women, ethnic minorities,14 seasonal labourers15 and the very poor. The gender division of labour varies significantly across countries and gum types. In many countries, low returns to labour discourage men and wealthier groups from engaging in gum production. For example, in Kenya, gum collection is dominated by women, as men are involved in pastoralist activities with higher returns to labour (Mujawamariya and Karimov, 2014). In Burkina Faso and the Niger, gum collection is carried out primarily by women and children, as adult men consider it an inferior and marginal activity with low remuneration (Duhem, 2004; Shackleton et al., 2011). In Cameroon, both men and women collect friable gum from forests, though women are the majority. On average, men travel longer distances to collection sites (15–20 kilometres, compared wtih 8–12 kilometres for women) and collect higher quantities of gum per work day (12.5–15 kilograms, compared with 7.5–10 kilograms for women). Conversely, Cameroonian women do not participate in the production of hard gum, which is harvested in plantations, due to their poor access to
13 For example, in the Sudan, there are 36 gum arabic producer cooperatives, with 2,338 members, organized under the Gum Arabic Producers Association (GAPA). GAPA administers credit activities (price negotiation, credit delivery and repay-ment collection), supervises the inputs delivery and distribu-tion systems (including drinking water) and participates in sev-eral village school development activities (El Tahir Vishwanath, 2015).
14 For example, 10 per cent of the surveyed gum collectors in the villages of Boundoré, Kollakoye and Tambond, in the Yagha province of Burkina Faso, belonged to marginalized minority ethnic groups (Shackleton et al., 2011).
15 Seasonal labourers, largely migrants from the poorest and dri-est regions of a particular country, face working conditions and pay that are less favourable than those faced by local workers subject to established norms.

17CHAPTER III - VALUE CHAIN
land ownership and to cultural norms that reserve this activity for men (Njomaha, 2008). In the Sudan, where Acacia senegal is the dominant species, gum arabic production is controlled by males. Since tapping and harvesting commonly take place in remote areas, local communities perceive these activities as unsuitable for women. Paradoxically, historical accounts of gum arabic production reveal that women collected gum in Sudanese forests alongside men and children in the nineteenth century (Pallme, 1844). Between 2009 and 2014, the International Fund for Agricultural Development (IFAD) and the Sudan Multi-Donor Trust Fund extended funding and training to 10 associations entirely comprised of female farmers in five Sudanese localities as a way of reviving the tradition of gum harvesting.
Production skills may vary significantly across and within countries in Africa. For instance, a large skill imbalance exists between the two main gum arabic producing regions of the Sudan: the western sandy soils (regions of Kordofan and Darfur) and the central and eastern clay soils (States of Gedaref, Kassala, Blue Nile and White Nile) (El Tahir and Vishwanath, 2015). Due to limited skills among local communities in Gedaref, gum tapping and harvesting are carried out by highly skilled males from the Kordofan region. Insufficient production and marketing skills are one of the prevalent causes for low productivity and output in a number of gum producing countries, including Burkina Faso, Kenya, the Niger, South Sudan and Uganda.
Due to limited skills among local communities in Gedaref, gum tapping and harvesting are carried out by highly skilled men from the Kordofan region. Insufficient production and marketing skills are one of the prevalent causes for low productivity and output in a number of gum producing countries, including Burkina Faso, Kenya, the Niger, South Sudan and Uganda.
Gum arabic production may vary in two key dimensions: cultivation status and production method. With respect to cultivation status, gum arabic may be produced from either uncultivated forests or cultivated plantations. Regarding production techniques, producers may collect gum that exudes spontaneously from trees (in which case they are known as collectors), or tap trees by means of incisions in their branches and harvest the gum some weeks later (in which case they are known as tappers and harvesters). The two production dimensions are
interconnected in the case of friable gum, as this type of gum arabic is collected from uncultivated Acacia seyal forests and without prior tapping. However, hard gum may be obtained from Acacia senegal forests or plantations, either with or without tapping.
Tapping followed by harvesting is a dominant production method in Senegal and the Sudan, and is also practiced in Nigeria. However, in many gum belt countries, including Burkina Faso, Kenya, the Niger, Uganda and the United Republic of Tanzania, Acacia senegal gum is normally collected without prior tapping. By way of illustration, in the Niger, a survey of 560 gum arabic producers revealed that only 5.1 per cent of them tapped trees prior to harvesting (Elhadji Seybou et al., 2016). In Cameroon, tapping was practiced by between 3 per cent and 18 per cent of producers during the 2006/07 harvest season (Peltier et al., 2010).
Although tapping may double or even triple the gum yield of Acacia senegal trees, many producers do not possess the skills and instruments required to perform it in an economically viable and environmentally sustainable manner.16 The decision to whether or not tap is also linked to land tenure. As gum harvesting occurs at least 14 days after tapping, a producer needs a reasonable degree of assurance that other producers will not harvest gum from the trees that he or she tapped. Thus, in communal or open access lands, producers lack incentives for tree management and tapping. Tapping is more likely to be adopted in jurisdictions with well-defined property rights. However, in many countries, formal and customary rules may diverge regarding the attribution of rights to forestry products.17 Private production units, generally associated with higher efficiency in terms of quantity and quality, are common in the Sudan and are becoming increasingly so in Senegal. According to Mujawamariya and Burger (2016), the transition from communal to private collection systems, at the village level in Senegal, has tended to occur “where labour for collection is available, competition for the resource is high, forests where gum is collected are located near the village or market prices are high enough to
16 If done incorrectly, tapping may harm the tree and reduce productivity. For example, non-judicious tapping almost led to the local extinction of acacia trees in Mauritania in the early twentieth century (ITC, 1978).
17 In general, property rights for land and forest products are formally defined in national forest legislation. However, indig-enous acquisitions through lineage and kinship, and tacit ap-propriations, may also be commonly found (Freudenberger, 1993; Mujawamariya, 2012).

18 COMMODITIES AT A GLANCE - Special issue on gum arabic
attract occasional collectors who reinforce the effect of competition”. Since these conditions are not found in many parts of the African gum belt, communal systems remain widely prevalent.
Transaction costs and the availability of market information are key determinants of where smallholders sell their products (UNCTAD, 2015). For example, in the Sudanese State of Gedaref, small producers are unable to sell at larger and more lucrative markets if their amounts of gum are less than four kantars, or approximately 180 kilograms (El Tahir and Vishwanath, 2015). With small quantities, poor logistical connections and limited access to market information, most gum producers sell to intermediary merchants at the farm gate or village markets, where profitability and growth potential are low. In addition, small producers commonly resort to moneylenders among village merchants, who advance loans on the condition of purchasing the producer’s forthcoming harvest at a price below the market rate. The limited exposure to markets among gum arabic producers finds parallels in other commodity sectors in developing countries. For example, Fafchamps and Hill (2005) show that 80 per cent of Ugandan coffee farmers sell their output at the farm gate, commonly to small traders that act as aggregators for either large independent traders or exporters and their agents. As in many gum-arabic-producing regions, producer access to price information is limited to interactions with itinerant traders.
B. TRADERS
Traders play an important role in linking agricultural producers with markets and creating economies of scale in developing countries (UNCTAD, 2015). Since gum arabic producers in sub-Saharan Africa are generally small and resource-poor, intermediary traders aggregate quantities from individual smallholders and sell in bulk to processors or exporters. They may also add value to the gum, by cleaning, sorting, grading, transporting and storing. Several layers of intermediaries may be found in a given country, including at the primary (local), secondary (regional) and terminal18 markets. Since all intermediaries must be compensated for their services, producers tend to receive a smaller share of total profits in markets with a higher number of stakeholders.
18 A terminal market is a central site, often in a metropolitan area near major transportation hubs, that serves as an assembly and trading place for commodities (CRS, 2005).
Local intermediaries, who are generally men, may be landowners, moneylenders, village merchants or experienced itinerant traders. They can work privately or as agents for regional traders and companies, in which case they receive commissions. Given the limited penetration of commercial banks and formal financing in rural areas, these local players with greater access to cash and market information may provide informal financing to small gum producers in exchange for their crops, often on unfavourable terms for the smallholders.
In a study of 422 gum arabic producers in Senegal, Mujawamariya and D’Haese (2012) found that interlocked contracts – a form of contract farming whereby inputs or necessity items are advanced to a producer in exchange of a promise to sell crops to the lender at a fixed price – stimulate producers to collect and market gum.19 Since gum collection requires almost no inputs in addition to labour and special tools that are used for several periods, interlocking involves mainly the supply of household necessities, such as water and food. Producers with interlocked contracts (45 per cent of the sample) not only collected larger quantities of gum arabic, but also obtained larger economic returns. Although interlocking was conducive to production under the prevailing conditions in Senegal at the time of this particular survey, it may also reduce incentives to production, depending on the implied interest rate on credit or inputs.
Local traders generally sell their products to regional traders, who in turn sell them to processors or exporters. In the Sudan, regional traders may acquire gum in well-structured auction markets, where they incur taxes and levies. Subsequently, they clean, sort, grade, store and transport the gum to terminal markets. While transportation and storage services are provided at various stages of the value chain, cleaning, sorting and grading are usually performed at regional and/or terminal markets. Customarily, regional traders hire women to clean and sort gum arabic. Cleaning involves removing sand, bark, dirt and other foreign materials from the product. It is done manually with the help of a knife. During and after the cleaning, the gum is sorted, based mainly on the size and colour of the granule or tear. In the Sudanese town of Gedaref,
19 Due to the absence of strong regulatory environments in many developing countries, interlocked contracts are enforced through trust and tend to rely on close personal relationships. In Senegal, the affiliation of gum-producing households to lo-cal intermediaries results from traditional collaborations and is based on ethnic affiliations, appreciation for support in difficult times and friendship.
19CHAPTER III - VALUE CHAIN
a privately owned company employs about 20 to 30 women cleaners and sorters on a temporary basis. For these women, who are generally poor and young, this is an important income-generating activity. Women are singled out for these activities because they are perceived as diligent, patient and more enduring (El Tahir and Vishwanath, 2015). By contrast, they are generally barred from more lucrative roles within the gum arabic value chain by both their lack of capital and social norms. For example, in Burkina Faso, local customs limit the opportunities available to women, as they are not allowed or encouraged to travel to markets or to negotiate with men (Shackleton et al., 2011).
Informal traders, or smugglers, are present throughout the African gum belt. They usually buy gum directly from producers and resell it across borders, such as in the informal market for Cameroonian friable gum, analysed in chapter III.F. Smuggling is generally attributed to domestic policies that cause local prices to be significantly lower than prices in neighbouring countries. Examples of smuggling-inducing policies include export monopolies, privileged State trading enterprises and high taxes and levies.20 When domestic prices fall below production costs, smuggling may be the only economically viable alternative to producers.
Because of the limited choice of buyers along the gum arabic value chain, producers may get lower prices for their products due to monopsonistic or oligopsonistic behaviour on the part of traders. Mujawamariya et al. (2012b) investigate market concentration and oligopsonistic tendencies in the gum arabic sector by analysing the determinants of market shares and marketing margins for individual traders in the primary, transport and wholesale markets for gum arabic in Senegal. Since concentration was too low to have any influence on margins, oligopsonistic powers could not be confirmed. As marketing margins were found to depend on costs, risk and uncertainty, the authors concluded that traders were not exploitative. Their power is derived from access to capital and market characteristics.
C. EXPORTERS
Exporters typically reside in large cities, far from gum arabic forests and plantations, though they may have agents in villages closer to production sites. In the Sudan, exporters are typically based in Port Sudan and Khartoum. In Burkina Faso, Chad and Senegal, they
20 For example, stronger government intervention in the gum arabic sector in Mauritania has been associated with reduced official exports and increased smuggling.
are based in their respective capital cities. While 136 exporters are found in the Sudan, numbers are more limited in other countries. For example, 10 exporters can be found in Chad, 2 in Senegal, 2 in Burkina Faso and 1 in Cameroon and Mauritania. In Cameroon, the Government has effectively created a private monopoly by providing export permits to a single marketing company, the Compagnie Commerciale pour l’Exportation des Produits (CEXPRO). In Mauritania, gum arabic is a monopoly of the State trading enterprise, the Société Nationale d’Importation et d’Exportation (SONIMEX). Until 2009, a monopoly also existed in the Sudan, where the Gum Arabic Company (GAC), partly State-owned, was the only entity allowed to export the commodity. In recent years, some exporters – such as Achats Service International (ASI) in the Niger, Asylia Gum in Senegal and CEXPRO in Cameroon – have integrated vertically by owning and managing their own plantations and cleaning and sorting facilities.
After acquiring gum from traders, exporters must refine the cleaning and grading of the product, to ensure that shipments meet international standards. Like traders, exporters hire women to perform these activities. In Burkina Faso, the two existing exporting companies employ women on a temporary basis. One of the two companies employs 13 women, who are paid a guaranteed minimum salary during the sorting season. Most are married (82 per cent) and have no formal education (91 per cent). Gum cleaning and sorting is their most important source of income. As it was observed among Sudanese traders, Burkinabe exporters prefer to hire women because the task requires both dexterity and patience. The women accept the minimum wage and temporary employment because there are limited alternatives available (Shackleton et al., 2011).
After the final cleaning and grading, the gum is increasingly crushed or atomized (depending on the availability of equipment), bagged and put into containers to be sent through customs (UNCTAD, 2016a). Exporters must ensure that shipments pass the required inspections and that certificates are obtained from the competent government authorities, which may include the ministries of finance, trade, forestry, agriculture and religious affairs (for collection of the zakat, or religious tax, in some countries).
Most purchases are negotiated on a free-on-board (FOB) basis, although there are also cases in which transactions are conducted on a cost, insurance-and-freight (CIF) basis, especially when intermediaries

20 COMMODITIES AT A GLANCE - Special issue on gum arabic
are involved. In landlocked countries, the mode of transport may be aerial or maritime via a neighbouring country. In the case of Chad, gum arabic is exported through the airport of N’Djamena or through the port of Douala, in Cameroon. In addition, until attacks by Boko Haram triggered the closing of the Nigerian border in 2014, Chadian gum was purchased informally by Nigerian merchants, transported to the Nigerian city of Maiduguri and then exported through the port of Lagos. Most of the gum arabic produced in the Niger, and over half of the gum produced in Cameroon, were also estimated to follow the same route.
While most exporters interact directly with foreign buyers, a few commissioned brokers may also operate at this stage. Their charges typically range from 1 to 2 per cent ad valorem. However, their importance has generally declined. In the 1980s, several buyers from the United States were known to use agents rather than buying directly from exporters.
Upon arrival in the importing country, the gum must once again undergo inspections and clear customs. Import duties on gum arabic are generally low. For example, 38 developed countries and 42 developing and transition economies offer duty-free and quota-free (DFQF) market access to gum arabic imports on a most-favoured-nation (MFN) basis.21 In most other developing and transition economies, MFN import duties are at or below 5 per cent ad valorem. Notable exceptions are China (15 per cent), Pakistan (16 per cent) and India (30 per cent). Nevertheless, China and India offer DFQF market access on a preferential basis to imports from certain least developed countries (LDCs). For example, as of July 2016, India extended DFQF treatment to imports originating in 10 LDCs in the African gum belt: Burkina Faso, Chad, Eritrea, Ethiopia, Mali, Senegal, Somalia, the Sudan, Uganda and the United Republic of Tanzania.22 Other developing and
21 Economies that extend DFQF access to gum arabic imports include the following: Antigua and Barbuda, Armenia, Aus-tralia, Botswana, Brunei Darussalam, Burundi, Cabo Verde, Cambodia, Canada, Costa Rica, Ecuador, Egypt, El Salvador, Georgia, Guatemala, Haiti, Honduras, Hong Kong (China), Ice-land, Israel, Jamaica, Japan, Jordan, Kenya, Lesotho, Liech-tenstein, Macao (China), Malaysia, Mauritius, Montenegro, Na-mibia, New Zealand, Nicaragua, Norway, Panama, Papua New Guinea, Peru, Rwanda, Saint Lucia, Seychelles, Singapore, South Africa, South Sudan, Sri Lanka, Swaziland, Switzerland, the former Yugoslav Republic of Macedonia, Turkey, Uganda, Ukraine, the United Republic of Tanzania, the United States, Zambia and the 28 member States of the European Union.
22 Despite being LDCs, Mauritania, the Niger and South Sudan were not included in the list of beneficiary countries because their Governments did not submit letters of intent and other required documentation. Cameroon, Kenya and Nigeria were ineligible to the DFQF scheme of India because they were not LDCs.
transition economies that offer DFQF market access to gum arabic from LDCs include Chile, Kazakhstan, Morocco, the Republic of Korea, the Russian Federation, Taiwan Province of China and Thailand.
D. PROCESSORS
The level of gum arabic processing in most countries in the African gum belt is minimal. The main exception is the Sudan, where the domestic processing sector has become increasingly important. In addition, Nigeria and Senegal also possess one high-grade processing facility each. In most other countries, processing is done only at a very basic (cleaning, sorting and grading) or basic (kibbling) level. The increase in the number of processing facilities in the Sudan has boosted competition for crude gum, which has translated into higher prices paid to local traders and producers. For example, after the Ministry of Investment of the Sudan granted licences to 12 gum processors in 2003, crude gum producers received prices that were four to five times the 1998–2002 average producer price (Couteaudier, 2007).
Despite the recent development of gum arabic processing in a few African countries, most high-grade processing still takes place outside the continent, especially in Western Europe and North America. Over 90 per cent of processed gum arabic exports in 2014–2016 originated in these two regions. At least two types of high-grade gum arabic processors can be identified: processors that produce standardized grades of spray-dried and granulated gums, and processors that formulate customized products according to client specifications.
Nexira, a family-owned and managed company based in Rouen, France, is the world’s largest producer of processed gum arabic, with a world market share of nearly 50 per cent in 2011. Founded in 1895, the company was previously known as Iranex and is sometimes identified as Colloïdes Naturels International (CNI), which is the name of its main subsidiary. After building its reputation as a global leader in gum arabic, the company expanded into the manufacturing of a wide range of natural ingredients and botanical extracts for food, nutrition and dietary supplements. In 2012, Nexira invested €7 million to expand the annual capacity of one of its plants from 25,000 tons to 30,000 tons. The company has subsidiaries in Brazil, China, Germany, India, Japan, Mexico, the Russian Federation and the United States, and exports about 90 per cent of its output. In 2015, its turnover was €113 million.
21CHAPTER III - VALUE CHAIN
Alland & Robert is another important family-owned French manufacturer of processed gum arabic. Founded in 1884, it manufactured more than 13,000 tons of gum arabic in 2015. The company has headquarters in Paris, two factories in Normandy and kibbling and sorting facilities in Chad, Mali and Senegal. For its line of organic gum arabic, Alland & Robert maintains a partnership with Ferlo Gommes, a company from the region of Ferlo, in northeastern Senegal. In 2014, Alland & Robert had a turnover of €32 million, 86 per cent of which were from exports.
Agrigum International is a British processor specialized in spray-dried and agglomerated gum arabic products. It is also involved in the production of other hydrocolloids and associated blends to specific customer requirements. Established in 2007, the company has its headquarters in Buckinghamshire, a partner company in the United States, a Bangkok-based commercial office for the Asian market, a laboratory affiliated with the Moscow State University and partnerships with African companies that handle the purchasing and shipping of crude gum.
Other important processors include AEP Colloids and TIC Gums (United States), Drytech Processes (India), Frutarom (Israel), GAC (Sudan), Kerry Group (Ireland), and Norevo and Willy Benecke Natural Gums (Germany). High-grade gum arabic processors maintain partnerships with a number of companies specialized in the sale, marketing and distribution of food ingredients, including Caldic and IMCD (Netherlands), Farbest (United States) and Hawkins Watts (New Zealand).
Some high-grade processors specialize in niche markets. For example, AGFA Graphics (Belgium) produces gum arabic products specifically designed for the printing industry, and Spindal (Italy) is the world leader in the production of gum arabic for oenological use. Spindal’s factory in Gretz-Armainvilliers, France, produces a range of gum arabic products that improve stabilization processes and wine quality. The company sources crude gum through the Société des Produits Tropicaux du Mali, its subsidiary in Bamako. Other gum arabic processors specialized in oenology include Laffort, from France, and Enartis, Enologica Vason and Ever, all three from Italy.
In addition to the high-grade processors described above, a number of other companies perform less sophisticated processes with low value addition. For example, Afritec Ingredients, a joint venture of Nexira and the Yagoub Group based in the
Sudan, produces and exports kibbled gum. In-house quality control laboratories ensure that their pre-processed gum meets the optical rotation, viscosity, colour, moisture, potential of hydrogen and emulsifying properties demanded by gum processors abroad. Another example is the Khartoum Gum Arabic Processing Company, a subsidiary of the Baghlaf Group from Saudi Arabia based in the Sudan, which produces kibbled and mechanically powdered gum.
E. USERS
As discussed earlier, gum arabic is consumed in its raw form by local groups in the African gum belt, including gum collectors, cap washers and traditional ink makers. However, the share of crude gum arabic consumption in total gum arabic consumption is believed to be minimal. Industrial users are the main end consumers in the gum arabic value chain (see chapter II.B). Many of these users manufacture consumer goods that are internationally well-known, including Coca-Cola, Colgate and M&M’s.
Industrial use of gum arabic is distributed across the globe. In 2014–2016, 47 per cent of all processed gum was imported by European countries, 35 per cent by emerging and developing countries and 15 per cent by the United States (see chapter IV.D). However, some industrial users may also purchase unprocessed or semi-processed gum arabic. This is often the case among larger manufacturers, who have the grinding, filtration and spray drying equipment necessary to do their own processing.
Since gum arabic is a minor component in the formulation of a large number of consumer products, it usually does not have a significant impact on their prices.23 Furthermore, the natural status, multifunctionality and superior performance of gum arabic relative to competing products make it difficult to find perfect substitutes. As a result, price is not the most important factor for most industrial consumers. Quality consistency and supply stability are the main concerns of most manufacturers that use gum arabic in their formulations. These concerns are heightened by the fact that raw material supplies are historically volatile and concentrated in a small number of countries, many of which are characterized by political, economic
23 Notable exceptions are found in the hard and soft candy seg-ments, where gum arabic is used in large concentration, as described in chapter II.B.

22 COMMODITIES AT A GLANCE - Special issue on gum arabic
Table 2 Value addition in the formal market for friable gum, Cameroon, 2006 (CFA francs per kilogram)
Agents Purchase price Selling price Price difference Expenses Value added
Producers - 100–150 125
Inputs 10–20
81–103Health care 12–24
Subtotal 22–44
Merchants 100–150 175–200 62.50
Transportation 21.90
14.50–17
Materials 2.70
Handling 1.70
Local tax 1.70
10% weight loss 17.50–20
Subtotal 45.50–48
Exporters
(Douala FOB) 175–200 455 255–280
Cleaning and sorting 12.50
108–133
Packaging 4
Transport 50
Customs and taxes 25
Handling and storage 10
10% weight loss 45.50
Subtotal 147
Total value added 203.50–253
Source: UNCTAD secretariat calculations, adapted from Njomaha (2008).Note: For the producer and the merchant, the price difference corresponds to the difference between the mean selling price and
the mean purchase price.
and environmental vulnerabilities. The confluence of these factors helps explain the relative price inelasticity of demand for gum arabic.
F. VALUE ADDITION
Value addition in the gum arabic sector may vary significantly across producing regions, between botanical sources, and depending on whether transactions occur in the formal or informal market. The value chains for friable gum from the Nord region of Cameroon and hard gum from the State of Gedaref, in the Sudan, examined below, illustrate the diversity of potential scenarios.
Cameroonian friable gum value chain
Cameroonian producers of Acacia seyal gum generally sell their output to local merchants, who in turn have two potential outlets for the purchased product: the formal market, which involves reselling the gum to CEXPRO, the country’s only authorized exporter; or the informal market, which entails smuggling the gum to Nigeria. Njomaha (2008) provides a detailed account of value addition in both markets.
Prices, costs and margins in the formal market for friable gum are summarized in table 2. In 2006, producers in northern Cameroon sold unsorted friable gum to local merchants for between CFAF 100 and CFAF 150 per
kilogram (mean price of CFAF 125 per kilogram). Since producers spent between CFAF 22 and CFAF 44 per kilogram on inputs (such as equipment, food and water) and health care, their typical margin was between CFAF 81 and CFAF 103 per kilogram.
Merchants resold friable gum to CEXPRO for a cost ranging between CFAF 175 and CFAF 200 per kilogram (mean price of CFAF 187.50 per kilogram). On average, traders spent CFAF 28 per kilogram on transportation, cleaning, sorting, handling, materials and local taxes. Moreover, the weight loss derived from cleaning out refuse was estimated at 10 per cent, which corresponded to an additional cost of between CFAF 17.50 and CFAF 20 per kilogram. As a result, the typical margin for merchants in the formal market was between CFAF 14.50 and CFAF 17 per kilogram.
After performing further cleaning and sorting, packaging, transporting and clearing customs, CEXPRO exported the final product from Douala at an average FOB price of CFAF 455 per kilogram. The company spent on average CFAF 101.50 per kilogram on cleaning, sorting, packaging, handling, transportation, materials and customs and other taxes. Assuming an additional weight loss of 10 per cent (CFAF 45.50 per kilogram), the typical margin for the exporter was between CFAF 108 and CFAF 133 per kilogram.

23CHAPTER III - VALUE CHAIN
Figure 2 Shares of total value added and FOB price, formal market for friable gum, Cameroon, 2006
Exporter26.5%
Producer20.2%
Transporters15.8%
Input providers
8.7%
Government5.9%
Sorters and handlers 5.3%
Merchants3.5%
Losses14.1%
Exporter52.8%
Producer40.2%
Merchants7.0%
Source: UNCTAD secretariat, based on Njomaha (2008).
Table 3 Value addition in the informal market for friable gum, Cameroon, 2006 (CFA francs per kilogram)
Agents Purchase price Selling price Price difference Expenses Value added
Producers - 100–150 125Inputs 10–20
81–103Health care 12–24Subtotal 22–44
Merchants (Nigerian border) 100–150 200–250 100
Transportation 16.40
50.90–55.90
Materials 2.70Handling 1.70Local tax 1.7010% weight loss 20–25Customs bribe 1.60Subtotal 44.10–49.10Total value added 131.90–158.90
Source: UNCTAD secretariat calculations, adapted from Njomaha (2008).Note: See note in table 2.
(A) Total value added (B) FOB price (Douala)
In 2006, total value added in the formal market was CFAF 203.50 to CFAF 253 per kilogram. Exporters accounted for the highest share of value added (52.8 per cent), followed by producers (40.2 per cent) and merchants (7 per cent) (figure 2A). In terms of shares of the Douala FOB price, exporters accounted for 26.5 per cent, producers for 20.2 per cent and merchants for 3.5 per cent (figure 2B). Losses resulting from cleaning and sorting are significant, at 14.1 per cent. Although producers could increase their remuneration by cleaning and sorting the gum, most lack the skills and resources required to undertake these tasks.
In the informal market (see table 3), the price Cameroonian merchants receive from Nigerian traders is higher than the price paid by CEXPRO (CFAF 200 to CFAF 250 per kilogram vs. CFAF 175 to CFAF 200 per kilogram). While expenses related to cleaning, sorting, handling, materials and local taxes are identical in the two markets (CFAF 6.10 per kilogram), transportation
costs are lower in the informal market, as the distance to the Nigerian border is shorter than the distance to the CEXPRO sorting facility in Maroua (CFAF 16.40 per kilogram vs. CFAF 21.90 per kilogram). Lower transportation costs are mostly counterbalanced by the higher implicit cost associated with the 10 per cent weight loss (CFAF 20 to CFAF 25 per kilogram vs. CFAF 17.50 to CFAF 20 per kilogram). In addition, merchants must pay an illegal commission to complicit customs agents (CFAF 1.60 per kilogram). Since merchants incur total expenses of CFAF 44.10 to CFAF 49.10 per kilogram, their margin in the informal market ranges between CFAF 50.90 and CFAF 55.90 per kilogram, which is at least three times higher than the corresponding margin in the formal market.24
24 By contrast, the producer margin remains unchanged, as pro-ducer prices and costs are not affected by the merchant’s posterior choice of whom to resell the gum. In the scenario described by Njomaha (2008), it is the local merchant who engages in the illegal transaction, not the producer.

24 COMMODITIES AT A GLANCE - Special issue on gum arabic
Figure 3 Margins in the formal and informal markets for friable gum, Cameroon, 2006 (CFA francs per kilogram)
Figure 4 Distribution of FOB export price by market type, Indian processed friable gum, 2006
121
92
72
40
27 2416
00
92
16
36
2 2
53
2
0
20
40
60
80
100
120
140
Exporter Producer Transporters Inputproviders
Government Sorters andhandlers
Trader Customsagents
Formal market (Douala FOB) Informal market (Nigerian border)
Source: UNCTAD secretariat, based on Njomaha (2008).
Source: UNCTAD secretariat calculations, based on Njomaha (2008).
Producers5%
Merchants 1%
Exporters 6%
Other agentsin Cameroon12%
Other agentsoutside Cameroon 76%
Producers5%
Merchants 3%
Other agents inCameroon 4%
Other agentsin Nigeria13%
Other agentsoutside Africa 75%
Producers5%
Merchants 1%
Exporters 6%
Other agentsin Cameroon12%
Other agentsoutside Cameroon 76%
Producers5%
Merchants 3%
Other agents inCameroon 4%
Other agentsin Nigeria13%
Other agentsoutside Africa 75%
(A) Formal market (Douala FOB) (B) Informal market (Nigeria border)
Total value added per kilogram within Cameroon in the informal market (CFAF 131.90 to CFAF 158.90) is 36 per cent lower than in the formal market. While the trader is better off in the informal market, the Cameroonian economy as a whole is worse off due to lower domestic value added, employment and Government revenue. In addition to the merchant, the only stakeholder to derive financial gains from the informal market is the customs agent (see
figure 3). While returns to producers in the informal are the same as in the formal market, returns to input providers are 10 per cent lower, returns to transporters, the Government, sorters and handlers are drastically lower, and returns to CEXPRO are nil.
Given the attractiveness of the informal market to merchants, it is estimated that between 40 and 60 per cent of all Cameroonian friable gum was smuggled
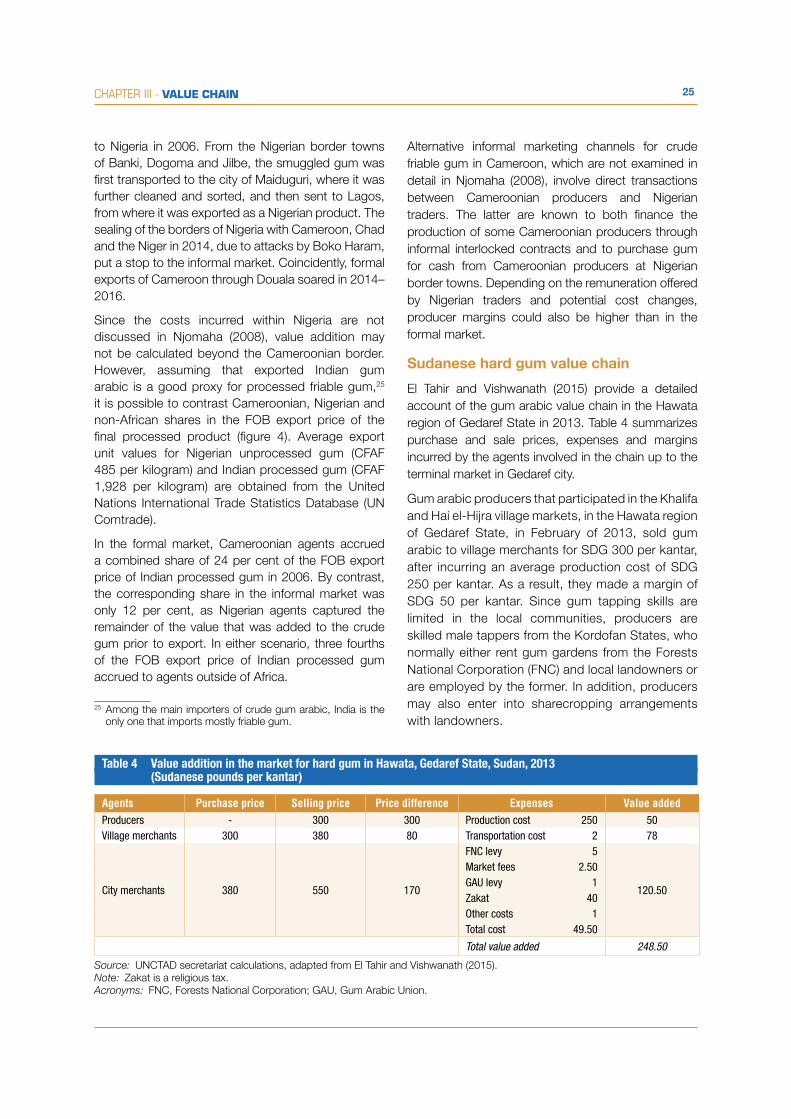
25CHAPTER III - VALUE CHAIN
Table 4 Value addition in the market for hard gum in Hawata, Gedaref State, Sudan, 2013 (Sudanese pounds per kantar)
Agents Purchase price Selling price Price difference Expenses Value addedProducers - 300 300 Production cost 250 50Village merchants 300 380 80 Transportation cost 2 78
City merchants 380 550 170
FNC levy 5
120.50
Market fees 2.50GAU levy 1Zakat 40Other costs 1Total cost 49.50
Total value added 248.50
Source: UNCTAD secretariat calculations, adapted from El Tahir and Vishwanath (2015).Note: Zakat is a religious tax.Acronyms: FNC, Forests National Corporation; GAU, Gum Arabic Union.
to Nigeria in 2006. From the Nigerian border towns of Banki, Dogoma and Jilbe, the smuggled gum was first transported to the city of Maiduguri, where it was further cleaned and sorted, and then sent to Lagos, from where it was exported as a Nigerian product. The sealing of the borders of Nigeria with Cameroon, Chad and the Niger in 2014, due to attacks by Boko Haram, put a stop to the informal market. Coincidently, formal exports of Cameroon through Douala soared in 2014–2016.
Since the costs incurred within Nigeria are not discussed in Njomaha (2008), value addition may not be calculated beyond the Cameroonian border. However, assuming that exported Indian gum arabic is a good proxy for processed friable gum,25 it is possible to contrast Cameroonian, Nigerian and non-African shares in the FOB export price of the final processed product (figure 4). Average export unit values for Nigerian unprocessed gum (CFAF 485 per kilogram) and Indian processed gum (CFAF 1,928 per kilogram) are obtained from the United Nations International Trade Statistics Database (UN Comtrade).
In the formal market, Cameroonian agents accrued a combined share of 24 per cent of the FOB export price of Indian processed gum in 2006. By contrast, the corresponding share in the informal market was only 12 per cent, as Nigerian agents captured the remainder of the value that was added to the crude gum prior to export. In either scenario, three fourths of the FOB export price of Indian processed gum accrued to agents outside of Africa.
25 Among the main importers of crude gum arabic, India is the only one that imports mostly friable gum.
Alternative informal marketing channels for crude friable gum in Cameroon, which are not examined in detail in Njomaha (2008), involve direct transactions between Cameroonian producers and Nigerian traders. The latter are known to both finance the production of some Cameroonian producers through informal interlocked contracts and to purchase gum for cash from Cameroonian producers at Nigerian border towns. Depending on the remuneration offered by Nigerian traders and potential cost changes, producer margins could also be higher than in the formal market.
Sudanese hard gum value chain
El Tahir and Vishwanath (2015) provide a detailed account of the gum arabic value chain in the Hawata region of Gedaref State in 2013. Table 4 summarizes purchase and sale prices, expenses and margins incurred by the agents involved in the chain up to the terminal market in Gedaref city.
Gum arabic producers that participated in the Khalifa and Hai el-Hijra village markets, in the Hawata region of Gedaref State, in February of 2013, sold gum arabic to village merchants for SDG 300 per kantar, after incurring an average production cost of SDG 250 per kantar. As a result, they made a margin of SDG 50 per kantar. Since gum tapping skills are limited in the local communities, producers are skilled male tappers from the Kordofan States, who normally either rent gum gardens from the Forests National Corporation (FNC) and local landowners or are employed by the former. In addition, producers may also enter into sharecropping arrangements with landowners.

26 COMMODITIES AT A GLANCE - Special issue on gum arabic
Village merchants transport the gum to the secondary market at Hawata, at a cost of SDG 2 per kantar, where they resell it to city merchants for SDG 380 per kantar, making a margin of SDG 78 per kantar. In turn, city merchants transport the gum to the terminal market in Gedaref city, where they resell the product for SDG 550 per kantar, not before incurring a combined cost of SDG 49.50 per kantar due to fees, levies, the zakat (religious tax), transportation and other expenses. As a result, the city merchant earns a margin SDG 120.50 per kantar.
There are six to eight traders in the Gedaref city market, of which only one is a wholesaler, who buys and sells in large quantities. He purchases gum from producers, village merchants, city merchants and intermediaries. In addition, this same wholesaler regularly purchases all gum traded in the Gedaref auction market. He resells gum arabic either to large local processing companies or to exporters based in other cities in the Sudan, as there are no exporters based in Gedaref.
The value added in the hard gum chain in Gedaref State, from the producer up to the city merchant, is SDG 248 per kantar. There is an upward-skewed benefit distribution among value chain agents, with producers accruing 20.1 per cent of total value added; village merchants, 31.4 per cent; and city merchants, 48.5 per cent. In addition, the commercialization margin is substantially higher than in the Cameroonian examples examined earlier. This is in part because production costs in the Acacia senegal plantations of Gedaref are higher than in the open access Acacia seyal forests of northern Cameroon. Since Gedaref producers that sell to informal traders (smugglers) obtain a margin that is five times higher than the one
observed in the formal market (SDG 250 vs. SDG 50 per kantar), a significant part of the local output is believed to be smuggled to neighbouring Eritrea and Ethiopia. On average, producer margins in the formal and informal markets in 2013 corresponded to 7.7 per cent and 39 per cent of the Sudanese reference export price, respectively.26 Increased returns to producers in the formal market could be achieved by organizing producers associations, which increase scale and market power, and by diminishing the number of marketing intermediaries.
In the gum arabic sector, value addition resides mostly at the processing and retail stages, which generally occur outside of Africa. El Tahir and Vishwanath (2015) do not examine the gum arabic value chain beyond Gedaref. The next stage of the value chain would involve local processing or export through Port Sudan. Key marketing costs to the export point consist of transportation, fees and port charges. In addition, insurance, international freight and handling fees bring the crude gum to the import point, after which processing and retail account for significant margins. Differentiating gum arabic into consumable and commercial products is a vital step in value addition. At the final stage of the gum arabic value chain, the margin made by Gedaref producers in the formal market corresponded to 4.5 per cent of the export unit value of British processed gum in 2013. The differentiation of gum arabic into consumable and functional products accounts for the lion’s share of value added in the sector.
26 Based on the annual average Kordofan FOB price of $3,028 per ton in 2013, the official annual average exchange rate of SDG 4.757 per $1 and a conversion factor of 44.9 kilo-grams per kantar.

CHAPTER IV SUPPLY AND DEMAND
Phot
o co
urte
sy o
f ALL
AND
& RO
BERT

28 COMMODITIES AT A GLANCE - Special issue on gum arabic
The world market for gum arabic is composed of two main segments: crude gum arabic and processed gum arabic. The crude gum arabic segment includes unprocessed gum and semi-processed gum that undergoes little value addition (such as cleaned or kibbled gum). Virtually all internationally traded crude gum arabic is produced in sub-Saharan Africa. Although crude gum arabic is also produced in parts of South Asia and the Arabian Peninsula, supplies from these regions are outside the scope of the present report due to their small volumes and the fact that they are not traded internationally.27
Processed gum arabic includes standard and customized gum powders for industrial applications, many of which are marketed under and protected by proprietary trade names. Processed gum is produced mostly in Europe and North America, either for domestic consumption or export. Paradoxically, African countries that export crude gum arabic at low unit values re-import processed gum at substantially higher unit values to meet local manufacturing demand. Since the 2000s, however, Nigeria, Senegal and the Sudan have produced high-grade gum arabic at local processing facilities.28
Analyses of the supply and demand forces shaping the crude and processed segments of the world gum arabic market tend to focus on international trade data, as official production and consumption data are not published by most countries (Muller and Okoro, 2004; ITC, 2008a; ITC, 2008b; ITC, 2009; UNCTAD, 2016a). This approach is also adopted in the current report for the same reasons. Data are obtained from UN Comtrade and from official national and regional sources. Given the strong export-orientation of the gum arabic industry, exports provide an approximate indication of the true levels of production, which may diverge due to domestic consumption, stock changes and smuggling. In importing countries, differences between imports and consumption are due mainly to stock changes and re-exports.
27 Estimates of crude gum arabic output in India vary consider-ably, from 5 tons to 800 tons per year, which are fully con-sumed at the local level (Arora and Ramawat, 2014; Prasad et al., 2015; Srivastava and Ray, 2015; Yogi et al., 2017). At any rate, domestic production in India is negligible when com-pared to the annual average of 36,000 tons the country im-ported from Africa in 2014–2016. In addition, the role of Aca-cia species in the rural economy of the Arabian Peninsula is difficult to assess because of their relative scarcity over much of the terrain (Wickens et al., 1995).
28 Although the first gum arabic spray drying facility in Africa was inaugurated in 1999, in Kano, Nigeria, operational difficulties delayed its full commercial utilization until 2003.
In the Harmonized Commodity Description and Coding System (HS), which is used to categorize internationally traded products, gum arabic is classified under the six-digit subheading HS 130120, irrespective of it being in crude or processed form. Although multilateral rules allow countries to categorize products in greater detail at the national level, by splitting a six-digit code into more specific eight-digit codes, only two countries have not done so in the case of gum arabic: Jordan and the Sudan. As a result, official international trade statistics for all but two countries do not distinguish between crude and processed gums. In order to identify the two segments of the gum arabic market, a few assumptions are necessary: first, trade flows originating in countries in the African gum belt are assumed to consist primarily of crude gum arabic; second, trade flows originating elsewhere are considered to consist primarily of processed gum arabic; third, adjustments are made to account for processed gum arabic exports originating in countries in the African gum belt; and fourth, adjustments are made to account for re-exports of crude gum arabic by countries outside the African gum belt.
A. CRUDE GUM ARABIC EXPORTS
Many gum arabic producing countries do not publish export data on a regular basis. For example, Chad and Somalia have not reported official export statistics to the United Nations Statistics Division in over 30 years. Other producing countries, like Eritrea and Mauritania, reported detailed export data for less than a handful of years between 1992 and 2016. There are also gaps in reported data among larger sub-Saharan African economies: Nigeria and the Sudan, for instance, did not report gum arabic exports for 10 and 8 years, respectively, in the 1992–2016 period. In order to overcome inconsistencies in data availability across countries and over time, exports are estimated from mirror import data reported by trading partners. Therefore, the export quantity from a reference country in a given year is defined to equal the sum of the quantities that trading partners reported to import from this country in the same year.
In addition to filling important data gaps, mirror import statistics may be more accurate than comparable export data for a number of reasons. First, whereas it is possible for compilers of import statistics to trace the country of origin of a shipment, it is sometimes impossible for compilers of export statistics to accurately predict the country of final destination of
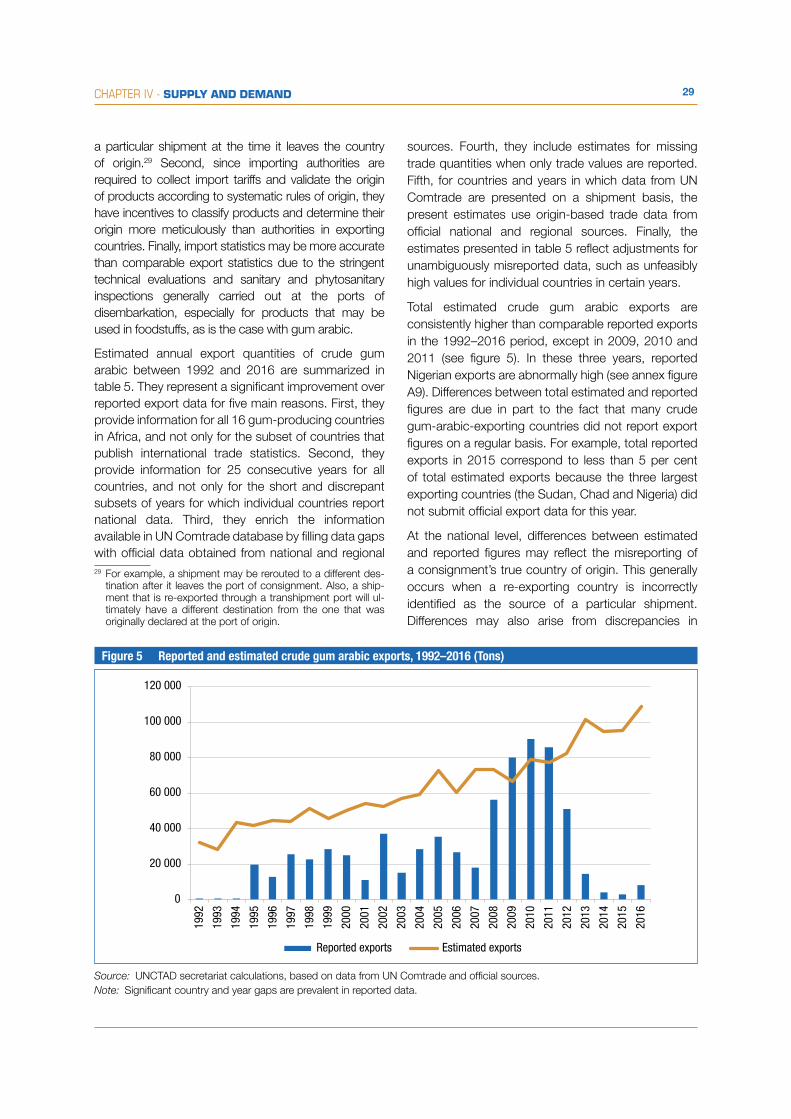
29CHAPTER IV - SUPPLY AND DEMAND
Figure 5 Reported and estimated crude gum arabic exports, 1992–2016 (Tons)
0
20 000
40 000
60 000
80 000
100 000
120 000
1992
1993
1994
1995
1996
1997
1998
1999
2000
2001
2002
2003
2004
2005
2006
2007
2008
2009
2010
2011
2012
2013
2014
2015
2016
Reported exports Estimated exports
Source: UNCTAD secretariat calculations, based on data from UN Comtrade and official sources.Note: Significant country and year gaps are prevalent in reported data.
a particular shipment at the time it leaves the country of origin.29 Second, since importing authorities are required to collect import tariffs and validate the origin of products according to systematic rules of origin, they have incentives to classify products and determine their origin more meticulously than authorities in exporting countries. Finally, import statistics may be more accurate than comparable export statistics due to the stringent technical evaluations and sanitary and phytosanitary inspections generally carried out at the ports of disembarkation, especially for products that may be used in foodstuffs, as is the case with gum arabic.
Estimated annual export quantities of crude gum arabic between 1992 and 2016 are summarized in table 5. They represent a significant improvement over reported export data for five main reasons. First, they provide information for all 16 gum-producing countries in Africa, and not only for the subset of countries that publish international trade statistics. Second, they provide information for 25 consecutive years for all countries, and not only for the short and discrepant subsets of years for which individual countries report national data. Third, they enrich the information available in UN Comtrade database by filling data gaps with official data obtained from national and regional 29 For example, a shipment may be rerouted to a different des-
tination after it leaves the port of consignment. Also, a ship-ment that is re-exported through a transhipment port will ul-timately have a different destination from the one that was originally declared at the port of origin.
sources. Fourth, they include estimates for missing trade quantities when only trade values are reported. Fifth, for countries and years in which data from UN Comtrade are presented on a shipment basis, the present estimates use origin-based trade data from official national and regional sources. Finally, the estimates presented in table 5 reflect adjustments for unambiguously misreported data, such as unfeasibly high values for individual countries in certain years.
Total estimated crude gum arabic exports are consistently higher than comparable reported exports in the 1992–2016 period, except in 2009, 2010 and 2011 (see figure 5). In these three years, reported Nigerian exports are abnormally high (see annex figure A9). Differences between total estimated and reported figures are due in part to the fact that many crude gum-arabic-exporting countries did not report export figures on a regular basis. For example, total reported exports in 2015 correspond to less than 5 per cent of total estimated exports because the three largest exporting countries (the Sudan, Chad and Nigeria) did not submit official export data for this year.
At the national level, differences between estimated and reported figures may reflect the misreporting of a consignment’s true country of origin. This generally occurs when a re-exporting country is incorrectly identified as the source of a particular shipment. Differences may also arise from discrepancies in

30 COMMODITIES AT A GLANCE - Special issue on gum arabicTa
ble
5 Es
timat
ed c
rude
gum
ara
bic
expo
rt q
uant
ities
, by
coun
try
of o
rigin
, 199
2–20
16 (T
ons)
Coun
try
1992
1993
1994
1995
1996
1997
1998
1999
2000
2001
2002
2003
2004
Suda
n18
491
14 0
2423
536
19 3
7518
045
18 4
1626
043
19 8
8821
793
26 0
5029
538
34 9
7528
798
Chad
2 45
13
695
4 66
76
842
7 39
78
529
12 9
8811
124
13 4
2512
896
10 9
619
670
12 0
43
Nige
ria9
014
7 92
111
352
12 1
6015
969
12 1
939
909
11 3
9910
497
12 2
999
174
9 53
215
282
Cam
eroo
n57
384
21
031
161
650
349
414
927
1 56
175
71
172
783
631
Mal
i32
7724
929
722
850
239
227
913
632
722
728
548
3
Sene
gal
261
460
399
833
369
583
9618
980
121
159
159
176
Ethi
opia
6069
263
129
8070
765
233
224
215
155
8720
2
Eritr
ea-
00
262
493
712
350
561
780
517
292
305
50
Unite
d Re
publ
ic o
f Tan
zani
a91
752
291
270
962
31
398
641
724
933
654
533
995
1 14
0
Keny
a13
318
428
421
013
819
4738
142
426
1346
Mau
ritan
ia48
5517
025
825
619
318
212
494
00
348
Som
alia
565
171
8074
4474
9135
206
372
Sout
h Su
dan
--
--
--
--
--
--
-
Burk
ina
Faso
00
00
01
1315
020
031
56
Nige
r15
522
824
111
622
017
210
098
8014
514
065
60
Ugan
da0
00
00
00
00
00
00
Prod
ucin
g co
untri
es (A
)32
191
28 0
8243
275
41 4
3244
541
43 8
1751
149
45 5
6649
808
54 1
1952
380
56 9
0459
385
Afric
an re
-exp
orts
(B)
9960
214
247
671
1 01
116
759
129
019
137
1027
4
Pers
ian
Gulf
re-e
xpor
ts (C
)0
02
242
30
749
336
4340
57
Tota
l (D
= A
+ B
+ C
)32
290
28 1
4243
490
41 9
2045
215
44 8
2851
323
46 2
0750
100
54 1
7352
560
56 9
5459
715

31CHAPTER IV - SUPPLY AND DEMANDTa
ble
5 (c
ont.)
Est
imat
ed c
rude
gum
ara
bic
expo
rt q
uant
ities
, by
coun
try
of o
rigin
, 199
2–20
16 (T
ons)
Coun
try
2005
2006
2007
2008
2009
2010
2011
2012
2013
2014
2015
2016
2014
–201
6 av
erag
e
Suda
n36
046
19 3
3040
103
37 2
3038
689
53 1
1649
481
50 2
0663
995
63 8
0964
589
72 8
7267
090
Chad
14 1
8817
810
11 8
5916
220
9 41
69
518
10 3
8816
067
14 8
3110
800
15 7
9313
682
13 4
25
Nige
ria19
075
21 0
5217
504
15 4
4714
639
13 6
4312
947
11 7
0416
388
12 2
225
854
7 83
08
635
Cam
eroo
n70
050
131
015
152
051
01
297
618
2 11
74
411
2 62
52
986
3 34
1
Mal
i29
870
343
758
470
229
725
964
740
258
12
364
5 76
02
902
Sene
gal
266
437
592
480
1 21
129
31
303
1 44
141
696
11
890
3 46
62
106
Ethi
opia
131
4222
187
364
590
146
911
857
956
058
226
546
9
Eritr
ea49
538
688
416
350
5112
219
920
895
661
639
465
Unite
d Re
publ
ic o
f Tan
zani
a60
237
046
554
214
530
540
916
187
034
749
417
333
8
Keny
a80
5010
411
770
1029
124
371
123
176
259
186
Mau
ritan
ia14
614
715
424
255
2217
421
6313
212
014
713
3
Som
alia
713
6948
851
350
6641
255
152
178
107
195
Sout
h Su
dan
--
--
--
00
3862
6515
092
Burk
ina
Faso
938
4220
2124
7814
036
6318
027
Nige
r60
117
9016
227
4422
3643
822
2023
22
Ugan
da0
00
00
00
00
41
22
Prod
ucin
g co
untri
es (A
)72
807
60 7
0573
056
72 9
9766
539
78 7
9977
017
81 7
3710
0 90
294
368
95 3
5710
8 25
499
326
Afric
an re
-exp
orts
(B)
329
141
059
022
6958
921
4978
689
816
1828
82
518
1 47
5
Pers
ian
Gulf
re-e
xpor
ts (C
)10
635
1166
2020
521
021
737
785
690
2 61
11
128
Tota
l (D
= A
+ B
+ C
)73
242
60 8
8173
068
73 6
5468
828
79 5
9379
376
82 7
3910
2 17
796
072
96 3
3411
3 38
210
1 92
9
Sou
rce:
UN
CTA
D s
ecre
taria
t cal
cula
tions
, bas
ed o
n da
ta fr
om U
N C
omtr
ade
and
offic
ial s
ourc
es (m
irror
dat
a).
Not
es:
Cou
ntrie
s ar
e ra
nked
acc
ordi
ng to
201
4–20
16 a
vera
ges.
Das
hes
indi
cate
yea
rs p
rior
to in
depe
nden
ce. F
or m
ore
info
rmat
ion
on re
-exp
orts
, see
spe
cific
sub
sect
ion
belo
w.

32 COMMODITIES AT A GLANCE - Special issue on gum arabic
Figure 7 Crude gum arabic export quantities, by main exporters, 1992–2016 (Tons)
Figure 8 Crude gum arabic export quantity market shares, by main exporters, 1992–2016 (Percentage)
0
20 000
40 000
60 000
80 000
100 000
120 000
Sudan Chad Nigeria Other Africa
1992
1994
1996
1998
2000
2002
2004
2006
2008
2010
2012
2014
2016
Sudan Chad Nigeria Other Africa
1992
1994
1996
1998
2000
2002
2004
2006
2008
2010
2012
2014
2016
0%
20%
40%
60%
80%
100%
Source: UNCTAD secretariat calculations, based on data from UN Comtrade and official sources.
Source: UNCTAD secretariat calculations, based on data from UN Comtrade and official sources.
product classifications: while an exporting country may classify a particular shipment as gum arabic, an importing country may classify it as a different product. Finally, time lags between exportation and importation may explain part of the difference between estimated and reported figures. For example, a shipment that leaves an exporting country in December may only arrive at its final destination in the following calendar year.
The fact that estimated exports closely approximate reported exports in countries that publish trade flow data on a more regular basis, such as Senegal and the Sudan, corroborates the advantages and utility of the estimation method for both research and policymaking (figure 6). A comparison of estimated and reported exports for each African crude gum arabic producing country is presented in the annex.
Estimated world crude gum arabic exports surpassed 113,000 tons in 2016, the highest level in recorded history. Between 1992 and 2016, export quantities
Figure 6 Reported and estimated crude gum arabic exports, Sudan and Senegal, 1992–2016 (Tons)
0
20 000
40 000
60 000
80 000
Reported exports Estimated exports
0
1 000
2 000
3 000
4 000
1992
1994
1996
1998
2000
2002
2004
2006
2008
2010
2012
2014
2016
1992
1994
1996
1998
2000
2002
2004
2006
2008
2010
2012
2014
2016
Reported exports Estimated exports
Source: UNCTAD secretariat calculations, based on data from UN Comtrade and official sources.
(A) Sudan (B) Senegal
expanded at an average annual growth rate (AAGR) of 6.3 per cent. Despite the positive growth trend, recurring shortfalls were caused by severe droughts, insecurity and political turmoil.30 The crude gum arabic sector was also marked by strong concentration, with three countries – the Sudan, Chad and Nigeria – accounting for over 90 per cent of exports. Figure 7 depicts export quantities in 1992–2016 for the three leading exporting countries, as well as combined exports for the other gum-producing African countries (“other Africa”). Figure 8 illustrates their corresponding market shares in the same period.
30 Since the 1970s, a significant fall in global crude gum arabic out-put and exports has been observed at least once every decade, including in 1973–1974, 1985, 1992–1993 and 2006. Prolonged droughts affect gum arabic production in a number of negative ways: first, they harm or wipe out acacia trees; second, they force producers to migrate in search of water and pastures; third, they lead people to cut acacia trees for sale or use as fuelwood; and fourth, potential gum producers may be dissuaded from col-lecting gum if Governments or aid organizations provide food relief as a result of the harsh climatic conditions.

33CHAPTER IV - SUPPLY AND DEMAND
The Sudan is the world’s leading crude gum arabic exporter, despite notable fluctuations in its market share between 1992 and 2016. Once accounting for over 80 per cent of world exports in the 1960s, the country saw its market share decline to 45 per cent in the second half of the 1990s and 50 per cent in the 2000s. Sustained improvement only occurred in the 2010s, when the country recovered the 65 per cent market share it enjoyed in the early 1970s. The export potential of the Sudan remained underexploited until the liberalization of gum arabic trade in 2009, which was followed by a rapid expansion in export quantities. In 2016, Sudanese exports of crude gum arabic reached a record level of nearly 73,000 tons, almost four times as high as the 18,500 tons recorded in the drought year of 1992.
Chad is the second most important exporter of crude gum arabic, having overtaken Nigeria for many years between 1998 and 2016. Despite its large acacia resources, Chad exported gum infrequently prior to 1990, in part due to political instability. Export quantities expanded from 1,000 tons in 1990 to 13,000 tons in 1998, and fluctuated between 10,000 tons and 18,000 tons in 1999–2016. The country’s export market share increased from 3 per cent in 1990 to 27 per cent in 2000, the most remarkable expansion for any exporting country in the period. Subsequently, as both the Sudan and smaller exporters picked up their market shares, the participation of Chad receded to 20 per cent in the 2001–2009 and 14 per cent in 2010–2016.
In Nigeria, crude gum arabic exports have been characterized by short spans of remarkable expansion interspersed with longer periods of negative or sluggish growth. The most recent peak occurred in 2006, partly as a response to a drought-related supply shortfall in the Sudan. Subsequently, Nigeria became a less important supplier, both in absolute and relative terms: exports declined from 21,000 tons in 2006 to 8,000 tons in 2016, with a concomitant fall in export market share from 35 per cent to 7 per cent. In 2014–2016, production and exports were disrupted by the high insecurity engendered by Boko Haram. Armed attacks and the perceived threat of violence displaced populations and deterred agricultural labour and the transport of agricultural goods to markets in Borno and Yobe, the two most important gum-arabic-producing States in Nigeria. Van den Hoek (2017) found a strong correlation between the frequency of Boko Haram attacks and the decline in agricultural market activity
and stability between November 2014 and December 2016. In addition, the sealing of Nigerian borders with Cameroon, Chad and the Niger, in order to better combat Boko Haram, disrupted cross-border trade, including the inflow of foreign gum arabic that used to be re-exported as a Nigerian product.
The other countries of the African gum belt, labelled “other Africa” in figures 7 and 8, have become more important exporters of crude gum arabic, especially since 2013. Combined exports from this group of countries fluctuated between 2,000 tons and 4,000 tons per year in 1992–2012, but expanded rapidly ever since, reaching 14,000 tons in 2016. For the first time in the last 25 years, combined export quantities from other Africa became greater than exports from Chad or Nigeria. Collectively, other Africa accounted for 13 per cent of the export market in 2016.
Crude gum arabic exports from other Africa are depicted in more detail in figure 9, where countries are categorized into two subgroups, according to average export volumes in 2014–2016. The first subgroup, labelled “medium exporters”, is composed of three countries with national average export volumes between 1,000 tons and 3,000 tons per year (Cameroon, Mali and Senegal). The second group, labelled “minor exporters”, is composed of 10 countries with national average export volumes below 500 tons per year (Burkina Faso, Eritrea, Ethiopia, Kenya, Mauritania, the Niger, Somalia, South Sudan, Uganda and the United Republic of Tanzania). The two subgroups followed comparable export trajectories between 1992 and 2013, but diverged significantly between 2014 and 2016: while combined exports from minor exporters remained under 2,000 tons per year, exports from medium exporters underwent rapid expansion, surpassing 12,000 tons in 2016. The recent increase in export quantities from other Africa, therefore, was due to the improved performance of Cameroon, Mali and Senegal, the three medium exporters. Export quantities for each of these countries in the period between 1992 and 2016 are depicted in figure 10.
Mali and Senegal have started to recover the important role they once played in the gum arabic market. Until the 1960s, the two countries used to be the second and third largest exporters of crude gum arabic after the Sudan, exporting more than 10,000 annual tons each. Unfavourable natural events, inadequate management of dryland ecosystems and distorting
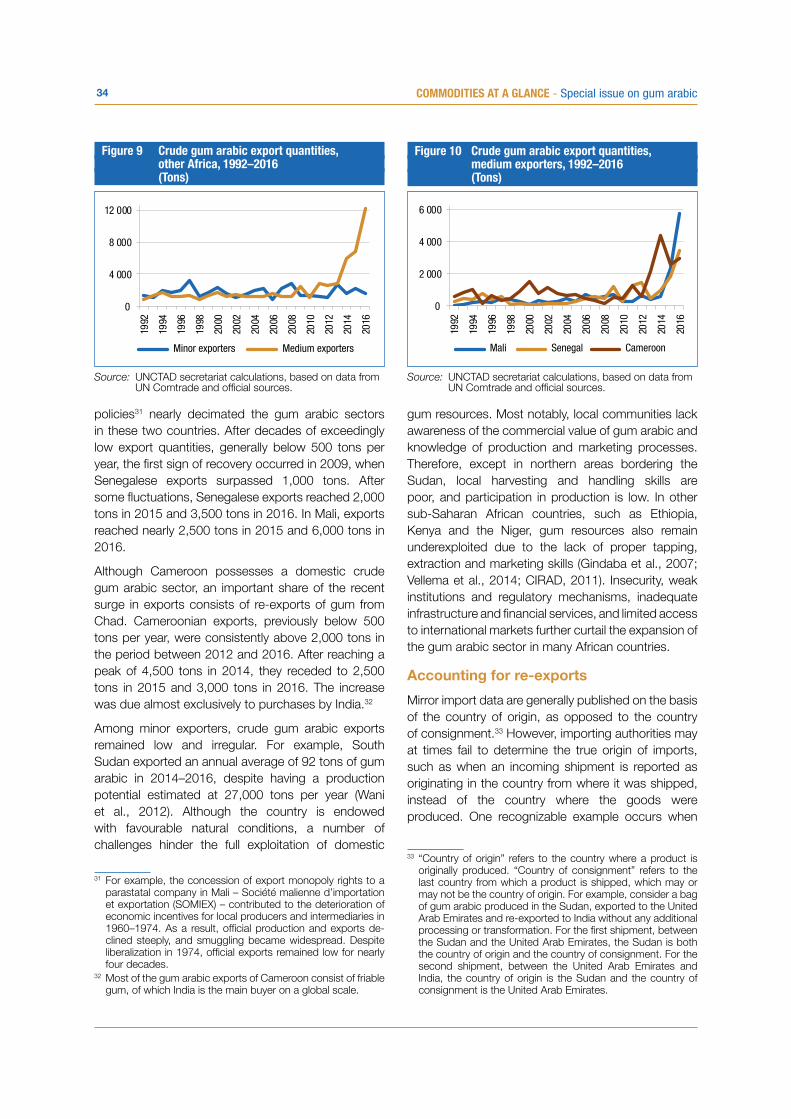
34 COMMODITIES AT A GLANCE - Special issue on gum arabic
Figure 9 Crude gum arabic export quantities, other Africa, 1992–2016 (Tons)
Figure 10 Crude gum arabic export quantities, medium exporters, 1992–2016 (Tons)
1992
1994
1996
1998
2000
2002
2004
2006
2008
2010
2012
2014
2016
1992
1994
1996
1998
2000
2002
2004
2006
2008
2010
2012
2014
2016
0
4 000
8 000
12 000
Minor exporters Medium exporters
0
2 000
4 000
6 000
Mali Senegal Cameroon
1992
1994
1996
1998
2000
2002
2004
2006
2008
2010
2012
2014
2016
1992
1994
1996
1998
2000
2002
2004
2006
2008
2010
2012
2014
2016
0
4 000
8 000
12 000
Minor exporters Medium exporters
0
2 000
4 000
6 000
Mali Senegal Cameroon
Source: UNCTAD secretariat calculations, based on data from UN Comtrade and official sources.
Source: UNCTAD secretariat calculations, based on data from UN Comtrade and official sources.
policies31 nearly decimated the gum arabic sectors in these two countries. After decades of exceedingly low export quantities, generally below 500 tons per year, the first sign of recovery occurred in 2009, when Senegalese exports surpassed 1,000 tons. After some fluctuations, Senegalese exports reached 2,000 tons in 2015 and 3,500 tons in 2016. In Mali, exports reached nearly 2,500 tons in 2015 and 6,000 tons in 2016.
Although Cameroon possesses a domestic crude gum arabic sector, an important share of the recent surge in exports consists of re-exports of gum from Chad. Cameroonian exports, previously below 500 tons per year, were consistently above 2,000 tons in the period between 2012 and 2016. After reaching a peak of 4,500 tons in 2014, they receded to 2,500 tons in 2015 and 3,000 tons in 2016. The increase was due almost exclusively to purchases by India.32
Among minor exporters, crude gum arabic exports remained low and irregular. For example, South Sudan exported an annual average of 92 tons of gum arabic in 2014–2016, despite having a production potential estimated at 27,000 tons per year (Wani et al., 2012). Although the country is endowed with favourable natural conditions, a number of challenges hinder the full exploitation of domestic
31 For example, the concession of export monopoly rights to a parastatal company in Mali – Société malienne d’importation et exportation (SOMIEX) – contributed to the deterioration of economic incentives for local producers and intermediaries in 1960–1974. As a result, official production and exports de-clined steeply, and smuggling became widespread. Despite liberalization in 1974, official exports remained low for nearly four decades.
32 Most of the gum arabic exports of Cameroon consist of friable gum, of which India is the main buyer on a global scale.
gum resources. Most notably, local communities lack awareness of the commercial value of gum arabic and knowledge of production and marketing processes. Therefore, except in northern areas bordering the Sudan, local harvesting and handling skills are poor, and participation in production is low. In other sub-Saharan African countries, such as Ethiopia, Kenya and the Niger, gum resources also remain underexploited due to the lack of proper tapping, extraction and marketing skills (Gindaba et al., 2007; Vellema et al., 2014; CIRAD, 2011). Insecurity, weak institutions and regulatory mechanisms, inadequate infrastructure and financial services, and limited access to international markets further curtail the expansion of the gum arabic sector in many African countries.
Accounting for re-exports
Mirror import data are generally published on the basis of the country of origin, as opposed to the country of consignment.33 However, importing authorities may at times fail to determine the true origin of imports, such as when an incoming shipment is reported as originating in the country from where it was shipped, instead of the country where the goods were produced. One recognizable example occurs when
33 “Country of origin” refers to the country where a product is originally produced. “Country of consignment” refers to the last country from which a product is shipped, which may or may not be the country of origin. For example, consider a bag of gum arabic produced in the Sudan, exported to the United Arab Emirates and re-exported to India without any additional processing or transformation. For the first shipment, between the Sudan and the United Arab Emirates, the Sudan is both the country of origin and the country of consignment. For the second shipment, between the United Arab Emirates and India, the country of origin is the Sudan and the country of consignment is the United Arab Emirates.

35CHAPTER IV - SUPPLY AND DEMAND
Figure 11 Crude gum arabic re-exports, by country group, 1992–2016 (Tons)
Figure 12 Crude gum arabic re-exports as a percentage of exports from the African gum belt, 1992–2016 (Percentage)
1992
1994
1996
1998
2000
2002
2004
2006
2008
2010
2012
2014
2016
1992
1994
1996
1998
2000
2002
2004
2006
2008
2010
2012
2014
2016
0
1 000
2 000
3 000
4 000
5 000
6 000
African re-exporters Persian Gulf re-exporters
0%
1%
2%
3%
4%
5%
6%
African re-exporters Persian Gulf re-exporters
1992
1994
1996
1998
2000
2002
2004
2006
2008
2010
2012
2014
2016
1992
1994
1996
1998
2000
2002
2004
2006
2008
2010
2012
2014
2016
0
1 000
2 000
3 000
4 000
5 000
6 000
African re-exporters Persian Gulf re-exporters
0%
1%
2%
3%
4%
5%
6%
African re-exporters Persian Gulf re-exporters
Source: UNCTAD secretariat calculations, based on data from UN Comtrade and official sources.
Source: UNCTAD secretariat calculations, based on data from UN Comtrade and official sources.
imports originate from countries that do not produce or process gum arabic on a commercial scale.
In order to account for this misreporting, mirror imports originating in two groups of countries outside the African gum belt are assumed to consist of re-exports of crude gum arabic.34 These countries do not produce crude gum arabic on a commercial scale, but occasionally serve as transhipment points. The first group is composed of nine sub-Saharan African countries in the vicinity of the gum belt: Benin, the Central African Republic, Côte d’Ivoire, Djibouti, the Gambia, Ghana, Guinea, Guinea-Bissau and Togo. The second group is composed of four Persian Gulf countries: Bahrain, Qatar, Saudi Arabia and the United Arab Emirates. Estimated re-exports from these two groups are depicted in figures 11 and 12.
Re-exports of crude gum arabic were generally low between 1992 and 2007, with the exception of the mid-1990s, when annual re-exports from the Central African Republic briefly surpassed 1,000 tons. They became more preponderant after 2008, due to re-exports from countries in the Gulf of Guinea (most notably, Benin, Ghana and Togo) and the Persian Gulf (most notably, the United Arab Emirates). As a percentage of the combined quantity exported by the African gum belt countries, re-exports were particularly important in 2009 (3.4 per cent), 2011 (3.1 per cent) and 2016 (4.7 per cent). While neighbouring African countries accounted for the majority of re-exports between 1992 and 2014, the United Arab Emirates was the most important re-exporter in 2015 and 2016.
34 In order to distinguish between crude and processed gums, only trade flows with unit values compatible with prevailing prices for crude gum arabic are included in the estimates.
The Central African Republic in the 1990s illustrates the important role that re-exporting countries can play in the gum arabic market. Although it does not produce gum arabic within its borders,35 the Central African Republic was the world’s fourth-largest exporter in the mid-1990s due to re-exports of gum smuggled from the Sudan, where producer prices were low due to the official export monopoly and export tax in force at the time. After importing crude gum arabic from the Sudan free of import tariffs and taxes, three companies – Cafe Star, SIEGF and Sympes Ayas – cleaned, sorted and packaged the product in Bangui and re-exported it through the port of Douala, in Cameroon (Bonannee, 1999). A comparison of trade data reported by Central African and foreign customs authorities suggests that most gum arabic shipments arriving abroad from the Central African Republic during the 1990s were correctly classified as originating in the Sudan. While Central African data indicate an average annual export volume of 1,500 tons in 1995–1999, mirror data from trading partners indicate an average annual import volume of 500 tons from the Central African Republic in the same period. Detailed annual trade statistics, as officially reported by exporting and importing authorities, are contrasted in figure 13.36
Re-exports from countries in the vicinity of the gum belt re-emerged as a significant phenomenon in
35 Although the subprefecture of Birao, in the extreme north of the Central African Republic, has a semi-arid climate propi-tious for acacia trees, gum arabic on a large commercial scale is not reported in the region.
36 After 2000, re-exports from the Central African Republic either ceased to occur or were consistently identified by importing authorities as originating in the true country of origin. Mirror import data indicate that imports from the Central African Re-public occurred in only three years in the 2001–2016 period and for very low amounts.

36 COMMODITIES AT A GLANCE - Special issue on gum arabic
2008–2016, particularly in the Gulf of Guinea. Figure 14 summarizes mirror imports originating from these countries in 2000–2016. Almost 2,000 tons of gum arabic imports were reported to originate from Ghana in 2009, making it the world’s fourth largest exporter that year, ahead of Mali and Senegal. Imports originating in Ghana remained high during most of the 2010–2016 period. Benin also became an important source of gum arabic imports in 2016, when almost 2,000 tons were imported from this country. Part of the shipments originating from countries in the Gulf of Guinea may consist of local gums from Acacia polyacantha or Acacia sieberana, which are sometimes incorrectly labelled “gum arabic”.
Measuring export value
Since import values for most countries are reported only on a CIF basis, they must be converted to the standard FOB basis applicable to exports. This is accomplished by discounting CIF values by a freight and insurance factor.37 Due to the lack of pairwise data on freight and insurance for all country combinations, and following the practice in the literature (UNCTAD, 2016b), the freight and insurance discount factor is assumed to be fixed across trading partners, but to vary over time and across product categories. Accordingly, annual average freight and insurance discount factors were calculated based on detailed official data from six countries that report imports on both CIF and FOB bases: Ecuador, New Zealand, Paraguay, the Philippines, the United States and the Bolivarian Republic of Venezuela. Estimated trade-weighted freight and insurance factors for crude and processed gum arabic for the period between
37 For countries that report imports on an FOB basis, reported FOB values are used instead.
1992 and 2016 are summarized in figure 15. For crude gum arabic, the trade-weighted insurance and freight factor followed an upward trend between 1992 and 2003, when it increased from 1.03 to 1.13. Subsequently, the factor receded to a lower and less volatile level (annual average of 1.075 in 2004–2016). For processed gum arabic, the increase in the trade-weighted freight and insurance factor in 1992–2003 was less pronounced (from 1.045 to 1.075), but the fall in 2004–2016 was also significant (annual average of 1.035 in 2004–2016).
Estimated annual crude gum arabic export values between 1992 and 2016 are summarized in table 6 and depicted in figure 16. In addition, figure 17 illustrates market shares based on export values (as opposed to figure 8, which depicts market shares based on export quantities). Export values were generally more erratic than export quantities due to significant price volatility,
Figure 13 Gum arabic exports and mirror imports, Central African Republic, 1994–2000 (Tons)
Figure 14 Gum arabic mirror imports from countries in the vicinity of producing countries, 2000–2016 (Tons)
0
500
1 000
1 500
2 000
2 500
1994 1995 1996 1997 1998 1999 2000
Central African export data Mirror import data
0
500
1 000
1 500
2 000
2 500
2000 2002 2004 2006 2008 2010 2012 2014 2016
Ghana Benin Togo Côte d’Ivoire Other
0
500
1 000
1 500
2 000
2 500
1994 1995 1996 1997 1998 1999 2000
Central African export data Mirror import data
0
500
1 000
1 500
2 000
2 500
2000 2002 2004 2006 2008 2010 2012 2014 2016
Ghana Benin Togo Côte d’Ivoire Other
Source: UNCTAD secretariat calculations, based on data from UN Comtrade and official sources.
Source: UNCTAD secretariat calculations, based on data from UN Comtrade and official sources.
Note: “Other” includes the Central African Republic, Djibouti, the Gambia, Guinea and Guinea-Bissau.
Figure 15 Freight and insurance factors for crude and processed gum arabic, 1992–2016
1.001.021.041.061.081.101.121.14
Crude gum arabic Processed gum arabic
1992
1994
1996
1998
2000
2002
2004
2006
2008
2010
2012
2014
2016
Source: UNCTAD secretariat calculations, based on data from UN Comtrade and official sources.

37CHAPTER IV - SUPPLY AND DEMANDTa
ble
6 Es
timat
ed c
rude
gum
ara
bic
expo
rt v
alue
s (F
OB),
by c
ount
ry o
f orig
in, 1
992–
2016
(Tho
usan
ds o
f dol
lars
)
Coun
try
1992
1993
1994
1995
1996
1997
1998
1999
2000
2001
2002
2003
2004
Suda
n48
519
44 9
5798
328
63 3
1540
267
24 8
7228
645
19 5
2523
143
27 1
4127
077
32
586
60
125
Chad
5 85
59
049
12 0
9118
932
13 1
118
453
11 7
4111
787
9 86
111
498
8 53
68
117
13 4
31
Nige
ria15
224
13 7
9115
337
12 4
0412
671
8 51
06
032
6 07
26
110
6 85
6 4
664
4 76
7 12
316
Mal
i10
012
642
751
324
032
024
417
590
201
126
419
367
Sene
gal
1 17
61
572
1 61
53
662
1 46
71
679
111
162
6312
526
330
539
6
Cam
eroo
n1
443
2 66
64
600
530
472
361
315
732
1 08
549
768
928
862
1
Eritr
ea–
00
759
988
1 05
742
756
270
351
824
227
019
1
Keny
a27
053
081
949
125
920
3523
125
543
315
51
Ethi
opia
156
308
906
506
164
807
6415
115
414
393
8516
6
Mau
ritan
ia11
217
570
889
048
927
022
213
710
90
01
467
Unite
d Re
publ
ic o
f Tan
zani
a39
338
066
552
248
467
434
037
448
734
826
047
756
6
Sout
h Su
dan
––
––
––
––
––
––
–
Som
alia
106
1147
598
140
8110
111
736
95
473
Burk
ina
Faso
00
00
11
1313
018
037
62
Nige
r39
582
253
418
842
811
476
7847
7698
6487
Ugan
da0
00
00
00
00
00
00
Prod
ucin
g co
untri
es (A
)73
749
74 3
8713
6 50
510
2 81
071
179
47 2
1948
164
39 7
7142
038
47 5
4442
485
47 4
3389
919
Afric
an re
-exp
orts
(B)
494
207
729
773
1 30
41
589
192
559
161
1110
36
94
Pers
ian
Gulf
re-e
xpor
ts (C
)0
02
160
51
628
1925
4721
53
Tota
l (D=
A +
B +
C)
74 2
4374
593
137
236
103
743
72 4
8848
809
48 3
6240
358
42 2
1847
580
42 6
3547
460
90 0
66

38 COMMODITIES AT A GLANCE - Special issue on gum arabic T
able
6 (c
ont.)
Est
imat
ed c
rude
gum
ara
bic
expo
rt v
alue
s (F
OB),
by c
ount
ry o
f orig
in, 1
992–
2016
(Tho
usan
ds o
f dol
lars
)
Coun
try
2005
2006
2007
2008
2009
2010
2011
2012
2013
2014
2015
2016
2014
–201
6 av
erag
e
Suda
n12
3 89
248
503
69 6
2770
064
63 0
9568
883
80 6
4782
586
102
841
95 6
1210
7 35
011
5 01
710
5 99
3
Chad
31 0
0137
551
18 4
1229
264
17 8
3113
176
17 2
9324
184
26 8
3921
269
28 0
1222
037
23 7
73
Nige
ria24
184
19 5
5214
890
12 5
6711
912
10 6
118
568
8 11
511
482
9 05
54
982
6 03
06
689
Mal
i25
389
248
064
595
126
034
773
157
692
21
903
6 69
23
173
Sene
gal
946
1 53
31
524
1 48
32
292
533
2 93
31
441
1 11
71
035
2 77
54
389
2 73
3
Cam
eroo
n1
125
402
248
172
881
618
2 33
562
41
764
2 90
62
077
2 18
72
390
Eritr
ea2
244
144
1 42
597
062
095
402
339
312
244
2 18
42
071
1 50
0
Keny
a66
7210
219
516
636
7016
936
617
561
693
357
4
Ethi
opia
222
6540
51
081
517
775
327
112
577
497
620
500
539
Mau
ritan
ia61
141
133
255
511
639
420
5817
834
935
839
636
8
Unite
d Re
publ
ic o
f Tan
zani
a37
222
828
040
220
218
624
310
161
923
641
916
627
3
Sout
h Su
dan
––
––
––
00
103
8916
237
420
8
Som
alia
381
138
309
278
5713
781
295
253
328
126
115
2
Burk
ina
Faso
2151
4423
3019
5294
715
241
065
Nige
r72
114
8329
625
5627
2724
860
3036
42
Ugan
da0
01
00
00
00
143
78
Prod
ucin
g co
untri
es (A
)18
5 39
310
9 65
810
8 16
211
7 99
498
694
95 4
2311
3 74
211
8 74
314
7 28
213
2 94
215
1 65
816
0 83
614
8 47
9
Afric
an re
-exp
orts
(B)
151
165
038
51
055
371
1 35
950
352
683
157
31
686
1 03
0
Pers
ian
Gulf
re-e
xpor
ts (C
)85
3134
8010
113
185
107
155
8547
31
899
819
Tota
l (D=
A +
B +
C)
185
629
109
853
108
196
118
458
99 7
5995
907
115
286
119
353
147
963
133
858
152
703
164
420
150
327
Sou
rce:
UN
CTA
D s
ecre
taria
t cal
cula
tions
, bas
ed o
n da
ta fr
om U
N C
omtr
ade
and
offic
ial s
ourc
es (m
irror
dat
a).
Not
es:
Cou
ntrie
s ar
e ra
nked
acc
ordi
ng to
201
4–20
16 a
vera
ges.
Das
hes
indi
cate
yea
rs p
rior
to in
depe
nden
ce.

39CHAPTER IV - SUPPLY AND DEMAND
Figure 16 Crude gum arabic export values (FOB), by main exporters, 1992–2016 (Thousands of dollars)
Figure 17 Crude gum arabic export value market shares, by main exporters, 1992–2016 (Percentage)
0
50 000
100 000
150 000
200 000
0%
20%
40%
60%
80%
100%
Sudan Chad Nigeria Other Africa Sudan Chad Nigeria Other Africa
1992
1994
1996
1998
2000
2002
2004
2006
2008
2010
2012
2014
2016
1992
1994
1996
1998
2000
2002
2004
2006
2008
2010
2012
2014
2016
0
50 000
100 000
150 000
200 000
0%
20%
40%
60%
80%
100%
Sudan Chad Nigeria Other Africa Sudan Chad Nigeria Other Africa
1992
1994
1996
1998
2000
2002
2004
2006
2008
2010
2012
2014
2016
1992
1994
1996
1998
2000
2002
2004
2006
2008
2010
2012
2014
2016
Source: UNCTAD secretariat calculations, based on data from UN Comtrade and official sources.
Source: UNCTAD secretariat calculations, based on data from UN Comtrade and official sources.
which is characteristic of commodity markets and poses substantial development hurdles to commodity-export-dependent developing countries (UNCTAD, 2017). World crude gum arabic export value peaked at $137 million in 1994 and $185.5 million in 2005, but remained under $50 million per year during most of the intervening period. By contrast, export value followed a generally upward trend after 2010, reaching $164 million in 2016, the second highest annual value in the 25 years under analysis.
The export market share of the Sudan in value terms is, in general, 10 percentage points higher than its corresponding export quantity market share. This is due not only to the large share of hard gum in total gum arabic exports, but also to the overall high quality of Sudanese gum, the standard against which gums from other countries are compared. Conversely, the export market share of Nigeria in value terms is, in general, 10 percentage points lower than its corresponding export quantity market share, since a large share of Nigerian exports are composed of lower-quality gums, siftings and rejects. In the case of Chad, export market shares in value terms are almost identical to export quantity market shares, as the country exports a mix of hard and friable gums.
While export market shares in value terms are higher than export quantity market shares in Senegal and Mauritania, the opposite is true in Mali and Cameroon. This reflects the different types of gum arabic primarily exported by these countries: hard gum in the case of Senegal and Mauritania, and friable gum in the case of Mali and Cameroon. Among other African producers, the United Republic of Tanzania stands out
for having the largest relative difference between export value and export quantity market shares, the former corresponding on average to less than half of the latter.
Bridging the gap between exports and supply
Gum arabic exports and production may diverge due to factors such as domestic consumption, stock changes and smuggling. With the exception of the Sudan, sub-Saharan African gum-arabic-producing countries do not hold stocks. Chad and Nigeria, the two largest producers after the Sudan, reportedly held no gum arabic stocks for at least 10 and 20 years, respectively (ITC, 2008a). GAC, which was the sole authorized exporter of gum arabic from the Sudan until 2009, maintained an average stock of 15,000 tons in the 1980s and early 1990s (Iqbal, 1993). In order to compensate for recurring production shortfalls, GAC accumulated large stocks over the 1990s and 2000s, a practice that jeopardised the company’s financial health. In 2007, GAC’s stocks were estimated at between 25,000 tons and 30,000 tons (Couteaudier, 2007). Following the depletion of GAC’s stocks due to a production shortage in 2014, Sudanese authorities attempted to establish a regional regulatory stock in conjunction with Chad and Nigeria. Nevertheless, the three countries were unable to amass the capital necessary to maintain such a stock.
Domestic consumption of crude gum arabic in sub-Saharan African producing countries is generally low, especially when compared with exports (Muller and Wata, 1998; Mallet et al., 2003; ITC, 2008a; ITC, 2010). Notable exceptions occur in Nigeria, Senegal and the Sudan, where local processors produce

40 COMMODITIES AT A GLANCE - Special issue on gum arabic
spray-dried gum arabic powder and final gum arabic products for local consumption and export.
In the Sudan, domestic consumption is reported to have increased from 500 tons in 2008 to 7,000 tons in 2011 and 10,000 tons in 2014, notably fuelled by industrial demand from the beverage and confectionary sectors (Panapress, 2012; Bloomberg, 2015; El Tahir and Vishwanath, 2015). In Nigeria, industrial demand for crude gum arabic arises from the sole high-grade processing facility in the country: the Dansa Food Processing Company Limited, located in Kano. In Senegal, Valdafrique’s processing facility, located in Dakar, is reported to buy on average 200 tons of crude gum arabic from local wholesalers per year (Mujawamariya, 2012).38
In addition to domestic consumption by industrial users, crude gum arabic is also consumed by gum-collecting households or sold in local markets. Despite the traditional uses discussed in chapter II, for most sub-Saharan African producers, gum arabic is principally an export crop, with limited use in native areas (Seif el Din and Zarroug, 1996). In Nigeria, producing households generally do not consume gum arabic, as the commodity is essentially produced for the market (Okafor et al., 1994). In the Niger, a survey of 560 gum collectors in three gum production regions revealed that only 7.6 per cent of the output was consumed by gum collecting households (Elhadji Seybou et al., 2016).
Official imports of crude gum arabic by African gum-producing countries are low or close to nil. With a few exceptions, most gum arabic imported by African 38 Fourteen years earlier, Muller and Wata (1998) reported that
approximately 200 tons of gum arabic were used in the Sen-egalese food and pharmaceutical industries.
countries in 1992–2016 corresponded to processed gum arabic from Europe or North America. As a result, it may be safe to assume that the crude gum arabic consumed by industrial users in Nigeria, Senegal and the Sudan was either produced domestically or smuggled from neighbouring countries.
Unofficial imports are believed to be prevalent throughout the African gum arabic belt. The cases of Sudanese gum smuggled through the Central African Republic and Cameroonian gum smuggled through Nigeria, both described in chapter III, are just two of many examples. Other alleged cases of smuggling abound: Burkinabe gum smuggled into Mali and the Niger; Chadian gum smuggled into Nigeria; Malian and Mauritanian gums smuggled into Senegal; and Sudanese gum smuggled into Chad, Eritrea and Ethiopia.
B. CRUDE GUM ARABIC IMPORTS
Crude gum arabic imports are characterized by a strong and rising level of concentration. The two largest importing countries, France and India, accounted for 75 per cent of world import quantities in 2014–2016, compared with 44 per cent in 1992–1994. The other traditional importers – the United States, Japan and the rest of Europe – saw their combined market share decline by more than half, from 54 per cent in 1992–1994 to 23 per cent in 2014–2016. Crude gum arabic import quantities for key importing countries and regions are summarized in table 7 and depicted in figure 18. In addition, figure 19 illustrates market shares based on import quantities.
The import quantity market share of India has been converging to that of France, the main importer. While
Figure 18 Crude gum arabic import quantities, by main importers, 1992–2016 (Tons)
Figure 19 Crude gum arabic import quantity market shares, by main importers, 1992–2016 (Percentage)
1992
1994
1996
1998
2000
2002
2004
2006
2008
2010
2012
2014
2016
1992
1994
1996
1998
2000
2002
2004
2006
2008
2010
2012
2014
2016
0
20 000
40 000
60 000
80 000
100 000
120 000
0%
20%
40%
60%
80%
100%
France India United States Other Europe Japan ROW France India United States Other Europe Japan ROW
1992
1994
1996
1998
2000
2002
2004
2006
2008
2010
2012
2014
2016
1992
1994
1996
1998
2000
2002
2004
2006
2008
2010
2012
2014
2016
0
20 000
40 000
60 000
80 000
100 000
120 000
0%
20%
40%
60%
80%
100%
France India United States Other Europe Japan ROW France India United States Other Europe Japan ROW
Source: UNCTAD secretariat calculations, based on data from UN Comtrade and official sources.
Source: UNCTAD secretariat calculations, based on data from UN Comtrade and official sources.
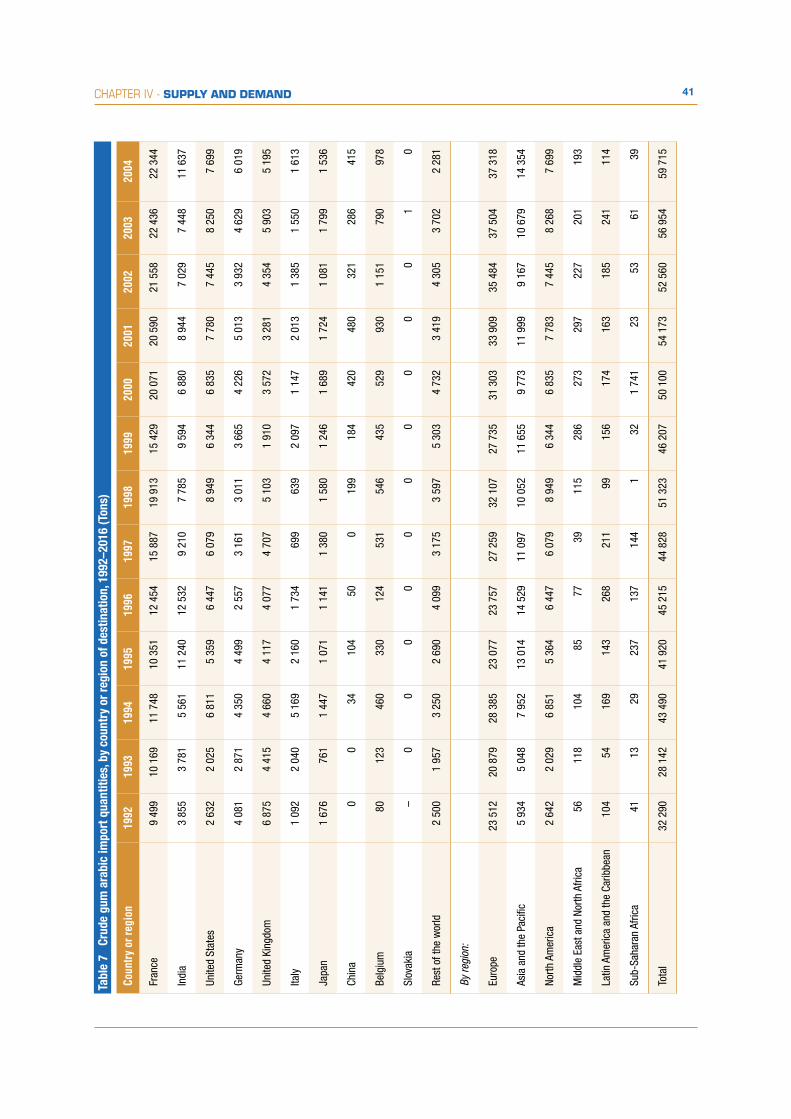
41CHAPTER IV - SUPPLY AND DEMAND T
able
7
Crud
e gu
m a
rabi
c im
port
qua
ntiti
es, b
y co
untr
y or
regi
on o
f des
tinat
ion,
199
2–20
16 (T
ons)
Coun
try
or re
gion
1992
1993
1994
1995
1996
1997
1998
1999
2000
2001
2002
2003
2004
Fran
ce9
499
10 1
69
11 7
48
10 3
51
12 4
54
15 8
87
19 9
13
15 4
29
20 0
71
20 5
90
21 5
58
22
436
22 3
44
Indi
a3
855
3 78
1 5
561
11 2
40
12 5
32
9 21
0 7
785
9 59
4 6
880
8 94
4 7
029
7 4
48
11 6
37
Unite
d St
ates
2 63
2 2
025
6 81
1 5
359
6 44
7 6
079
8 94
9 6
344
6 83
5 7
780
7 44
5 8
250
7
699
Germ
any
4 08
1 2
871
4 35
0 4
499
2 55
7 3
161
3 01
1 3
665
4 22
6 5
013
3 93
2 4
629
6 0
19
Unite
d Ki
ngdo
m6
875
4 41
5 4
660
4 11
7 4
077
4 70
7 5
103
1 91
0 3
572
3 28
1 4
354
5 9
035
195
Italy
1 09
2 2
040
5 16
9 2
160
1 73
4 69
9 63
9 2
097
1 14
7 2
013
1 38
5 1
550
1 61
3
Japa
n1
676
761
1 44
7 1
071
1 14
1 1
380
1 58
0 1
246
1 68
9 1
724
1 08
1 1
799
1 53
6
Chin
a0
034
10
4 50
0
199
184
420
480
321
286
415
Belg
ium
80
123
460
330
124
531
546
435
529
930
1 15
1 7
9097
8
Slov
akia
–0
00
00
00
00
01
0
Rest
of t
he w
orld
2 50
0 1
957
3 25
02
690
4 09
9 3
175
3 59
7 5
303
4 73
2 3
419
4 30
5 3
702
2 28
1
By re
gion
:
Euro
pe23
512
20
879
28
385
23
077
23
757
27
259
32
107
27 7
35
31 3
03
33 9
09
35 4
84
37
504
37 3
18
Asia
and
the
Paci
fic5
934
5 04
8 7
952
13 0
14
14 5
29
11 0
97
10 0
52
11 6
55
9 77
3 11
999
9
167
10
679
14 3
54
North
Am
eric
a2
642
2 02
9 6
851
5 36
4 6
447
6 07
9 8
949
6 34
4 6
835
7 78
3 7
445
8 2
687
699
Mid
dle
East
and
Nor
th A
frica
56
118
104
85
77
39
115
286
273
297
227
201
193
Latin
Am
eric
a an
d th
e Ca
ribbe
an10
4 54
16
9 14
3 26
8 21
1 99
15
6 17
4 16
3 18
5 2
4111
4
Sub-
Saha
ran
Afric
a41
13
29
23
7 13
7 14
4 1
32
1 74
1 23
53
6
139
Tota
l32
290
28 1
4243
490
41 9
2045
215
44 8
2851
323
46 2
0750
100
54 1
7352
560
56
954
59
715
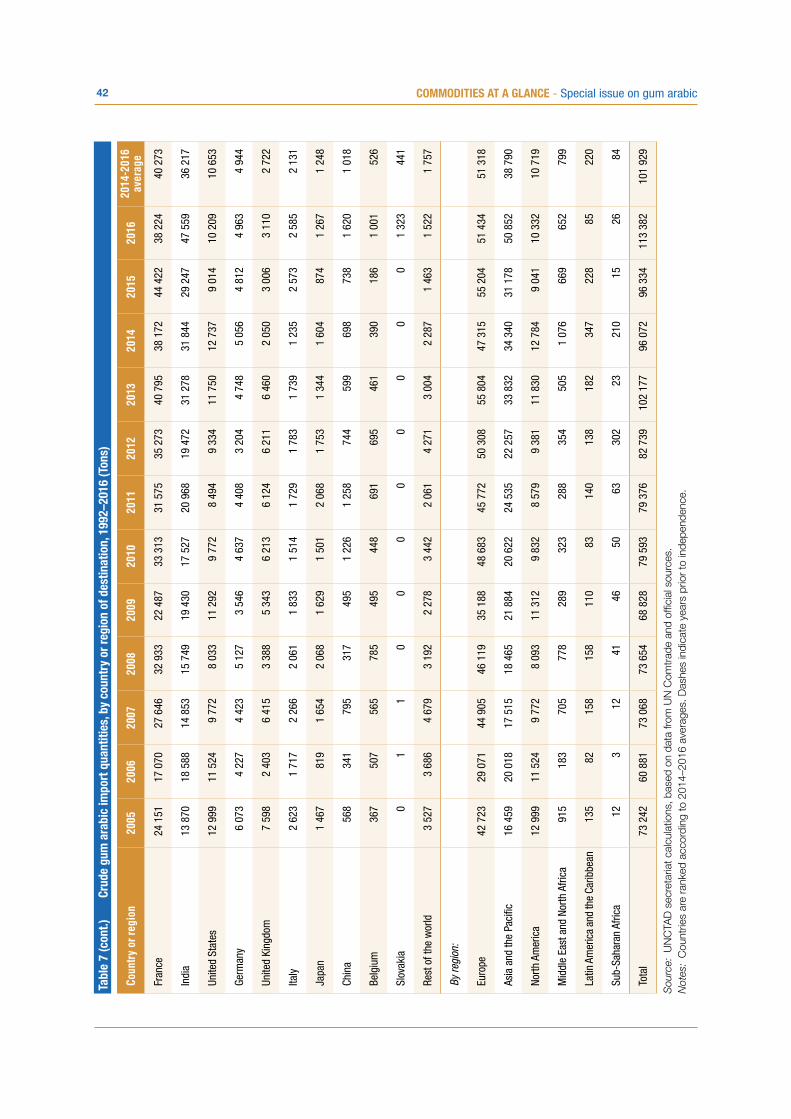
42 COMMODITIES AT A GLANCE - Special issue on gum arabic T
able
7 (c
ont.)
Cr
ude
gum
ara
bic
impo
rt q
uant
ities
, by
coun
try
or re
gion
of d
estin
atio
n, 1
992–
2016
(Ton
s)
Coun
try
or re
gion
2005
2006
2007
2008
2009
2010
2011
2012
2013
2014
2015
2016
2014
-201
6 av
erag
e
Fran
ce24
151
17 0
70
27 6
46
32 9
33
22 4
87
33 3
13
31 5
75
35 2
73
40 7
95
38 1
72
44 4
22
38 2
24
40 2
73
Indi
a13
870
18 5
88
14 8
53
15 7
49
19 4
30
17 5
27
20 9
68
19 4
72
31 2
78
31 8
44
29 2
47
47 5
59
36 2
17
Unite
d St
ates
12 9
9911
524
9
772
8 03
3 11
292
9
772
8 49
4 9
334
11 7
50
12 7
37
9 01
4 10
209
10
653
Germ
any
6 07
34
227
4 42
3 5
127
3 54
6 4
637
4
408
3
204
4
748
5 0
56
4 8
12
4 96
34
944
Unite
d Ki
ngdo
m7
598
2 4
03
6 4
15
3 3
88
5 3
43
6 2
13 6
124
6
211
6
460
2 0
50
3 0
06
3 11
0 2
722
Italy
2 6
23
1 7
17
2 2
66
2 0
61
1 8
33
1 5
14
1 7
29
1 7
83
1 73
9 1
235
2
573
2
585
2 13
1
Japa
n 1
467
81
9 1
654
2
068
1
629
1
501
2
068
1
753
1
344
1 6
04
874
1 26
7 1
248
Chin
a56
8 34
1 79
5 31
7 49
5 1
226
1
258
74
4 59
9 69
8 73
8 1
620
1 01
8
Belg
ium
367
507
565
785
495
448
691
695
461
390
186
1 00
1 52
6
Slov
akia
01
10
00
00
00
01
323
441
Rest
of t
he w
orld
3 5
27
3 6
86
4 6
79
3 1
92
2 2
78
3 4
42
2 0
61
4 2
71
3 00
4 2
287
1
463
1
522
1 75
7
By re
gion
:
Euro
pe42
723
29
071
44
905
46
119
35
188
48
683
45
772
50 3
08
55
804
47 3
15
55 2
04
51
434
51
318
Asia
and
the
Paci
fic16
459
20
018
17 5
15
18 4
65
21 8
84
20 6
22
24 5
35
22 2
57
33
832
34 3
40
31 1
78
50
852
38
790
North
Am
eric
a12
999
11
524
9
772
8
093
11 3
12
9 8
32 8
579
9 3
81
11
830
12 7
84
9 0
41
10
332
10
719
Mid
dle
East
and
Nor
th A
frica
915
183
705
778
289
323
288
354
505
1 0
76
669
652
799
Latin
Am
eric
a an
d th
e Ca
ribbe
an13
582
15
8 15
8 11
0 83
14
0 13
8 18
2 34
722
8 8
522
0
Sub-
Saha
ran
Afric
a12
3
12
41
46
50
63
30
2 2
3 21
0 15
2
6 84
Tota
l73
242
60
881
73
068
73
654
68
828
79
593
79
376
82
739
102
177
96 0
72
96 3
34
113
382
101
929
Sou
rce:
UN
CTA
D s
ecre
taria
t cal
cula
tions
, bas
ed o
n da
ta fr
om U
N C
omtr
ade
and
offic
ial s
ourc
es.
Not
es:
Cou
ntrie
s ar
e ra
nked
acc
ordi
ng to
201
4–20
16 a
vera
ges.
Das
hes
indi
cate
yea
rs p
rior
to in
depe
nden
ce.
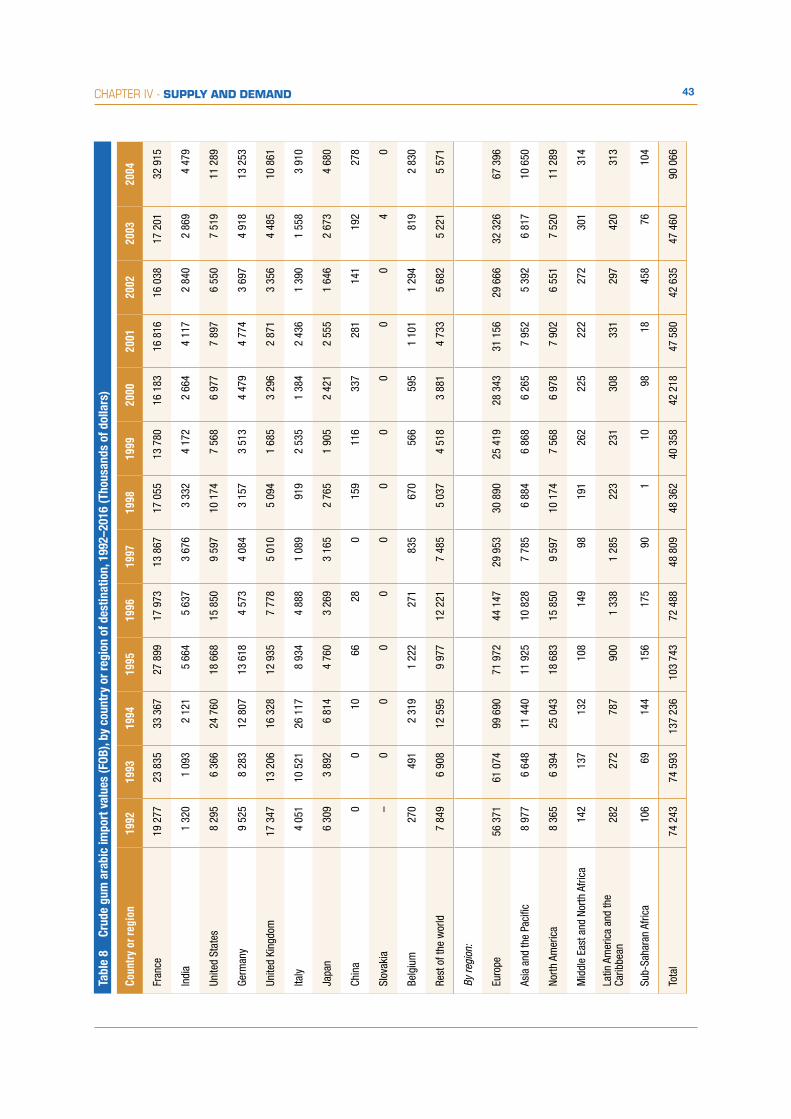
43CHAPTER IV - SUPPLY AND DEMANDTa
ble
8 Cr
ude
gum
ara
bic
impo
rt v
alue
s (F
OB),
by c
ount
ry o
r reg
ion
of d
estin
atio
n, 1
992–
2016
(Tho
usan
ds o
f dol
lars
)
Coun
try
or re
gion
1992
1993
1994
1995
1996
1997
1998
1999
2000
2001
2002
2003
2004
Fran
ce19
277
23 8
3533
367
27 8
9917
973
13 8
6717
055
13 7
8016
183
16 8
1616
038
17 2
0132
915
Indi
a1
320
1 09
32
121
5 66
45
637
3 67
63
332
4 17
22
664
4 11
72
840
2 86
94
479
Unite
d St
ates
8 29
56
366
24 7
6018
668
15 8
509
597
10 1
747
568
6 97
77
897
6 55
07
519
11 2
89
Germ
any
9 52
58
283
12 8
0713
618
4 57
34
084
3 15
73
513
4 47
94
774
3 69
74
918
13 2
53
Unite
d Ki
ngdo
m17
347
13 2
0616
328
12 9
357
778
5 01
05
094
1 68
53
296
2 87
13
356
4 48
510
861
Italy
4 05
110
521
26 1
178
934
4 88
81
089
919
2 53
51
384
2 43
61
390
1 55
83
910
Japa
n6
309
3 89
26
814
4 76
03
269
3 16
52
765
1 90
52
421
2 55
51
646
2 67
34
680
Chin
a0
010
6628
015
911
633
728
114
119
227
8
Slov
akia
–0
00
00
00
00
04
0
Belg
ium
270
491
2 31
91
222
271
835
670
566
595
1 10
11
294
819
2 83
0
Rest
of t
he w
orld
7 84
96
908
12 5
959
977
12 2
217
485
5 03
74
518
3 88
14
733
5 68
25
221
5 57
1
By re
gion
:
Euro
pe56
371
61 0
7499
690
71 9
7244
147
29 9
5330
890
25 4
1928
343
31 1
5629
666
32 3
2667
396
Asia
and
the
Paci
fic8
977
6 64
811
440
11 9
2510
828
7 78
56
884
6 86
86
265
7 95
25
392
6 81
710
650
North
Am
eric
a8
365
6 39
425
043
18 6
8315
850
9 59
710
174
7 56
86
978
7 90
26
551
7 52
011
289
Mid
dle
East
and
Nor
th A
frica
142
137
132
108
149
9819
126
222
522
227
230
131
4
Latin
Am
eric
a an
d th
e Ca
ribbe
an28
227
278
790
01
338
1 28
522
323
130
833
129
742
031
3
Sub-
Saha
ran
Afric
a10
669
144
156
175
901
1098
1845
876
104
Tota
l74
243
74 5
9313
7 23
610
3 74
372
488
48 8
0948
362
40 3
5842
218
47 5
8042
635
47 4
6090
066

44 COMMODITIES AT A GLANCE - Special issue on gum arabicTa
ble
8 (c
ont.)
Cru
de g
um a
rabi
c im
port
val
ues
(FOB
), by
cou
ntry
or r
egio
n of
des
tinat
ion,
199
2–20
16 (T
hous
ands
of d
olla
rs)
Coun
try
or re
gion
2005
2006
2007
2008
2009
2010
2011
2012
2013
2014
2015
2016
2014
-201
6 av
erag
e
Fran
ce61
591
29 9
4239
766
55 6
6836
697
41 1
0948
704
54 3
5563
264
59 0
8973
207
61 7
6264
686
Indi
a8
193
10 5
428
017
8 81
011
194
9 97
511
534
10 5
2418
230
18 6
0225
878
41 7
5828
746
Unite
d St
ates
32 9
6427
144
17 3
2615
786
19 7
3015
366
17 1
0115
078
22 4
9622
618
19 6
4619
951
20 7
38
Germ
any
24 6
1512
298
9 54
510
876
6 97
16
673
9 79
46
808
10 4
1312
250
11 6
2011
997
11 9
56
Unite
d Ki
ngdo
m26
845
4 43
810
535
6 59
49
539
8 05
310
538
8 89
513
317
4 80
36
923
6 93
56
221
Italy
11 6
105
679
4 83
44
311
3 72
42
340
3 23
83
912
4 53
92
949
6 21
06
367
5 17
5
Japa
n6
834
2 94
24
345
6 37
44
495
3 88
56
124
5 35
44
381
5 41
13
029
4 03
04
156
Chin
a78
743
958
445
881
21
409
1 42
373
686
31
067
1 80
91
304
1 39
4
Slov
akia
012
310
00
00
00
03
764
1 25
5
Belg
ium
933
1 63
81
342
1 70
491
366
31
450
1 70
51
097
929
313
2 30
91
184
Rest
of t
he w
orld
11 2
5614
778
11 8
717
878
5 68
46
435
5 38
211
986
9 36
26
141
4 06
84
244
4 81
7
By re
gion
:
Euro
pe13
4 15
966
857
76 0
3484
210
61 3
8063
399
77 0
8884
605
97 7
1681
460
99 0
2493
936
91 4
73
Asia
and
the
Paci
fic17
261
14 8
1913
529
16 5
9117
416
16 0
1219
697
17 8
5925
811
25 7
3531
730
48 1
8635
217
North
Am
eric
a32
966
27 1
4417
326
15 9
6219
802
15 5
5217
369
15 2
3322
721
22 7
8419
741
20 2
5820
928
Mid
dle
East
and
Nor
th A
frica
602
519
790
913
516
519
556
778
1 10
12
373
1 70
31
644
1 90
7
Latin
Am
eric
a an
d th
e Ca
ribbe
an61
851
050
676
160
835
148
156
557
690
448
131
956
8
Sub-
Saha
ran
Afric
a23
310
2137
7595
312
3860
224
7723
5
Tota
l18
5 62
910
9 85
310
8 19
611
8 45
899
759
95 9
0711
5 28
611
9 35
314
7 96
313
3 85
815
2 70
316
4 42
015
0 32
7
Sou
rce:
UN
CTA
D s
ecre
taria
t cal
cula
tions
, bas
ed o
n da
ta fr
om U
N C
omtr
ade
and
offic
ial s
ourc
es.
Not
es:
Cou
ntrie
s ar
e ra
nked
acc
ordi
ng to
201
4–20
16 a
vera
ges.
Das
hes
indi
cate
yea
rs p
rior
to in
depe
nden
ce.

45CHAPTER IV - SUPPLY AND DEMAND
Figure 20 Crude gum arabic import values (FOB), by main importers, 1992–2016 (Thousands of dollars)
Figure 21 Crude gum arabic import value market shares, by main importers, 1992–2016 (Percentage)
1992
1994
1996
1998
2000
2002
2004
2006
2008
2010
2012
2014
2016
1992
1994
1996
1998
2000
2002
2004
2006
2008
2010
2012
2014
2016
France India United StatesOther Europe United StatesOther EuropeJapan ROW France India Japan ROW
0
50 000
100 000
150 000
200 000
0%
20%
40%
60%
80%
100%
1992
1994
1996
1998
2000
2002
2004
2006
2008
2010
2012
2014
2016
1992
1994
1996
1998
2000
2002
2004
2006
2008
2010
2012
2014
2016
France India United StatesOther Europe United StatesOther EuropeJapan ROW France India Japan ROW
0
50 000
100 000
150 000
200 000
0%
20%
40%
60%
80%
100%
Source: UNCTAD secretariat calculations, based on data from UN Comtrade and official sources.
Source: UNCTAD secretariat calculations, based on data from UN Comtrade and official sources.
the share of India went from 13 per cent in 1992–1994 to 35 per cent in 2014–2016, that of France went 31 per cent to 40 per cent in the same period. The rapid expansion in the market share of India coincided with a substantial reduction in the relative importance of other traditional crude gum arabic importers. The United States, Japan and the rest of Europe saw their combined market share more than halve, from 54 per cent in 1992–1994 to 23 per cent in 2014–2016. The import market share held by the rest of the world (ROW) remained low. Most notable among the ROW was China, which saw average annual imports increase from 11 tons in 1992–1994 to 1,000 tons in 2014–2016.
Crude gum arabic imports are strongly segmented according to botanical source and quality. European countries, the United States and Japan generally import Acacia senegal gum, which is cleaned, sorted and graded in the country of origin prior to export. On the other hand, India imports mostly bulk, uncleaned and unsorted Acacia seyal gum, siftings and rejects, as well as gums from other species that are not officially recognized by JECFA as bearers of gum arabic. As prices for different types of crude gum arabic vary significantly (see chapter V), so do import values and import value market shares by country. Crude gum arabic import values for the 10 main importing countries and ROW in 1992–2016, as well as a breakdown by geographical region, are presented in table 8. In addition, figures 20 and 21 illustrate import values and import value market shares for leading importers and ROW. Data are presented on a FOB basis, according to the methodology described in the previous section.
The leadership of France in the crude gum arabic market becomes more discernible when the focus of the analysis shifts from import quantities to import values. French crude gum arabic imports increased from an annual average of $25.5 million in 1992–1994 to $64.5 million in 2014–2016. Concomitantly, the country’s import value market share expanded from 27 per cent to 43 per cent. While the average import quantities of France and India in 2012–2014 were relatively comparable, French import values were more than twice as high as those of India.
A leading processor and re-exporter of gum arabic since the Gum Wars of the eighteenth century, France solidified its market leadership between 1992 and 2016. French manufacturers accounted for 63 per cent of world processed gum arabic exports in 2014–2016, compared with 45 per cent in 1992–1996 (see chapter IV.C). Thus, French imports of crude gum arabic are intrinsically tied to the commercial success of its manufacturers.
Although a far contender, India is the second most important market for crude gum arabic. As Indian imports increased from $1.5 million per year in 1992–1994 to $28.5 million per year in 2014–2016, the country’s import value market share expanded from 2 per cent to 19 per cent. Since Indian consumers are more price sensitive than European or North American consumers, crude gum imported by India is often of lower quality.
The relative importance of other Europe in the crude gum arabic market declined remarkably between 1992 and 2016. The combined import value market share of all European countries with the exception

46 COMMODITIES AT A GLANCE - Special issue on gum arabic
of France dropped from 50 per cent in 1992–1994 to 18 per cent in 2014–2016. The decline was particularly strong in the United Kingdom (from 18 per cent to 4 per cent), Italy (from 13 per cent to 3 per cent) and Scandinavia (from 6 per cent to less than 0.1 per cent). Combined imports from Denmark, Finland, Norway and Sweden fell from an annual average of $5.6 million in 1992–1994 to $91,000 in 2014–2016. In particular, Denmark and Sweden, which used to import crude gum arabic for applications in the confectionary industry, did not record any imports in 2014–2016. Conversely, a dramatic increase in imports was observed in Slovakia: from virtually no imports in 1992–2015 to $3.75 million in 2016.
The United States is the third largest individual importer of crude gum arabic. Although average annual imports increased from $13 million in 1992–1994 to $21 million in 2014–2016, import value market share expanded only slightly, from 13 per cent to 14 per cent. Conversely, imports of Japan dropped from $5.7 million to $4.1 million in the same period, and the corresponding import value market share declined from 6 per cent to 3 per cent. Most other countries imported low values of crude gum arabic, as preference was given to imports of processed gum.
C. PROCESSED GUM ARABIC EXPORTS
Processed gum arabic export quantities and values between 1992 and 2016 are summarized in tables 9 and 10 and depicted in figures 22 and 24. In addition, figures 23 and 25 illustrate export market shares in the same period.
World processed gum arabic exports reached an annual average value of $192 million in 2014–2016, approximately 28 per cent higher than the corresponding value for crude gum arabic in the same period ($150 million). In terms of quantities, however, processed gum exports were nearly half as high as crude gum exports in this triennium (53,000 tons vs. 102,000 tons), which reflects the higher average unit value of processed gum ($3.62 per kilogram vs. $1.47 per kilogram).
Between 1992 and 2016, processed gum export values not only grew at a lower AAGR than crude gum exports (5.4 per cent vs. 8.4 per cent), but also experienced less volatility, as measured by the standard deviations of year-on-year export value
(0.15 vs. 0.36). The higher AAGR for crude gum was due in large part to the rapidly growing imports of India, which were processed and consumed chiefly in the domestic market, therefore re-entering the international market as processed gum in modest amounts.
The processed gum sector is marked by strong concentration in terms of supply, but greater dispersion in terms of demand. The largest exporter, France, accounted for 69 per cent of total exported quantities in 2014–2016. The five largest exporters of processed gum arabic – all of which are developed countries (France, the United Kingdom, Italy, the United States and Germany) – accounted for 92 per cent of export quantities in 2014–2016. The sixth largest exporter, the Sudan, accounted for an additional 4 per cent of export quantities (but only 2 per cent of the total export value).
The processed gum arabic market is also marked by high heterogeneity in terms of product sophistication, value addition and prices. While exports of the Sudan consist mostly of mechanically powdered gum, with relatively low value added,39 Europe and the United States export gum arabic with high and defined levels of functionality, often traded under proprietary brands, which accrue substantially higher prices. In 2014–2016, average export unit values were relatively high for the United Kingdom ($5.07 per kilogram), Germany ($4.43 per kilogram) and the United States ($4.36 per kilogram), moderate for France ($3.46 per kilogram), and relatively low for Italy ($2.27 per kilogram) and the Sudan ($1.95 per kilogram).
39 The Sudan has produced kibbled gum and mechanically powdered gum since the 1990s and spray-dried gum since 2003. Further development of processed gum arabic with high added value is limited by the low marketing capacity of domestic processors (Couteaudier, 2007). In addition, Nige-ria and Senegal each have one high-grade gum arabic pro-cessing facility: Dansa Food Processing Company Limited, in Kano, and Valdafrique, in Dakar. Established in 1999, Dansa operates the first spray-dried gum arabic production facility in Africa, which reached full commercial status in 2003. The majority of the gum powder produced by Dansa is exported. Founded in 1943, Valdafrique processes gum arabic into final products for the local and regional markets, such as sweets and medical tablets, and exports raw and spray-dried gum powder to Europe and Brazil. Value added processing and industrial uses remain undeveloped in most other countries in the African gum belt (Feleke and Melaku, 2011; Munyua and Muga, 2011).

47CHAPTER IV - SUPPLY AND DEMANDTa
ble
9 Pr
oces
sed
gum
ara
bic
expo
rt q
uant
ities
, by
coun
try
or re
gion
of o
rigin
, 199
2–20
16 (T
ons)
Coun
try
or re
gion
1992
1993
1994
1995
1996
1997
1998
1999
2000
2001
2002
2003
2004
Fran
ce7
337
8 24
1 9
380
9 16
8 9
298
11
935
13
389
14
544
15
544
16
714
17
729
17
663
18
887
Unite
d Ki
ngdo
m5
742
4 48
7 4
034
3 79
7 2
977
4 78
3 3
492
4 49
5 3
223
3 24
1 5
480
5 49
1 4
188
Italy
50
75
178
1
69
166
15
1 91
83
15
6 54
9 28
8 41
9 92
6
Unite
d St
ates
830
7
93
1 36
4 1
472
2 05
7 2
365
1 87
5 1
508
1 45
3 1
709
1 91
7 1
641
1 84
3
Germ
any
2 19
9 2
259
2 79
1 3
043
2 53
6 1
721
2 50
5 2
687
2 98
6 2
891
2 86
8 3
480
3 25
3
Suda
n ..
....
....
....
....
624
596
517
903
Indi
a80
83
8
235
62
27
77
49
22
1 23
6 75
11
6 16
7
Neth
erla
nds
35
109
91
73
59
11
2 84
11
3 11
6 14
0 20
2 46
5 69
4
Belg
ium
7576
143
8518
630
194
11
457
1 27
195
91
099
1 76
11
951
Swed
en3
131
44
43
151
446
651
Rest
of t
he w
orld
283
209
227
1’39
013
636
026
454
466
861
079
21
536
1 09
2
By re
gion
:
Euro
pe15
598
15 3
0916
709
16 5
3915
258
19 1
0420
609
23 4
6623
475
24 6
4127
894
29 9
7030
176
North
Am
eric
a83
080
01
375
1 47
22
058
2 36
51
875
1 50
91
453
1 70
91
917
1 64
11
844
Sub-
Saha
ran
Afric
a0
20
12
153
137
634
613
630
905
Asia
and
the
Paci
fic20
017
886
288
9318
717
342
833
964
641
060
745
9
Latin
Am
eric
a an
d th
e Ca
ribbe
an1
389
2410
613
5534
346
7874
120
Mid
dle
East
and
Nor
th A
frica
57
681
112
6181
4921
410
180
233
399
Tota
l 1
6 63
4 1
6 33
4 1
8 24
7 1
9 43
5 1
7 48
2 2
1 75
8 2
2 72
1 2
5 48
1 2
5 68
9 2
7 67
6 3
1 09
2 3
3 15
4 3
3 90
3

48 COMMODITIES AT A GLANCE - Special issue on gum arabicTa
ble
9 (c
ont.)
Pro
cess
ed g
um a
rabi
c ex
port
qua
ntiti
es, b
y co
untr
y or
regi
on o
f orig
in, 1
992–
2016
(Ton
s)
Coun
try
2005
2006
2007
2008
2009
2010
2011
2012
2013
2014
2015
2016
2014
-201
6 av
erag
e
Fran
ce 1
7 74
5 1
9 68
9 2
2 76
4 2
3 43
9 2
2 94
0 2
7 75
8 2
8 18
8 3
1 37
5 3
3 13
1 3
5 26
9 3
9 06
9 3
5 18
1 3
6 50
6
Unite
d Ki
ngdo
m5
532
5 96
3 5
625
5 58
7 4
916
5 94
8 5
981
6 21
0 5
508
4 24
3 4
324
4 00
6 4
191
Italy
778
677
755
1 13
9 1
388
1 40
9 1
589
1 93
2 2
385
2 49
0 2
949
3 17
7 2
872
Unite
d St
ates
2 64
7 3
159
2 93
1 3
333
3 60
4 3
982
4 38
9 3
926
3 37
5 2
956
2 93
9 2
416
2 77
0
Germ
any
3 03
3 3
450
3 23
9 2
904
2 45
3 2
848
2 81
0 2
179
2 27
8 2
732
2 59
5 2
440
2 58
9
Suda
n61
3 79
5 1
229
1 14
1 1
185
1 57
8 1
883
1 53
8 1
961
1 95
5 1
979
2 23
2 2
055
Indi
a69
51
98
1
346
765
880
653
414
472
492
467
218
393
Neth
erla
nds
239
624
519
542
735
1 07
1 77
6 33
2 33
0 13
6 52
6 28
1 31
4
Belg
ium
2 31
054
960
057
852
774
91
045
961
468
244
161
358
254
Swed
en1
36
10
42
01
663
02
222
Rest
of t
he w
orld
1 78
872
382
977
91
216
1 36
11
959
833
1 12
694
480
41
024
924
By re
gion
:
Euro
pe29
787
31 1
5333
814
34 4
7133
249
40 3
3841
467
43 2
6144
389
46 0
1449
991
45 7
5047
252
North
Am
eric
a2
647
3 15
92
934
3 40
23
638
4 02
94
421
3 96
33
401
2 95
82
943
2 41
72
773
Sub-
Saha
ran
Afric
a68
283
01
234
1 14
91
198
1 60
42
232
1 62
52
105
2 19
51
994
2 44
52
212
Asia
and
the
Paci
fic1
120
216
302
1 54
01
062
1 30
71
066
707
1 02
980
767
537
461
9
Latin
Am
eric
a an
d th
e Ca
ribbe
an15
750
104
8810
468
6712
386
9012
627
416
3
Mid
dle
East
and
Nor
th A
frica
363
274
207
141
478
242
2322
2458
8281
74
Tota
l 3
4 75
5 3
5 68
3 3
8 59
5 4
0 79
0 3
9 72
8 4
7 58
8 4
9 27
5 4
9 70
2 5
1 03
4 5
2 12
4 5
5 81
2 5
1 33
6 5
3 09
2
Sou
rce:
UN
CTA
D s
ecre
taria
t cal
cula
tions
, bas
ed o
n da
ta fr
om U
N C
omtr
ade
and
offic
ial s
ourc
es.
Not
es:
Cou
ntrie
s ar
e ra
nked
acc
ordi
ng to
201
4–20
16 a
vera
ges.
Fig
ures
for
the
Sud
an a
re e
stim
ates
.

49CHAPTER IV - SUPPLY AND DEMANDTa
ble
10 P
roce
ssed
gum
ara
bic
expo
rt v
alue
s (F
OB),
by c
ount
ry o
r reg
ion
of o
rigin
, 199
2–20
16 (T
hous
ands
of d
olla
rs)
Coun
try
or re
gion
1992
1993
1994
1995
1996
1997
1998
1999
2000
2001
2002
2003
2004
Fran
ce 2
5 89
5 3
3 13
8 4
5 62
9 4
4 08
6 3
4 69
6 3
3 73
3 3
5 42
3 3
6 98
3 3
7 11
7 3
8 71
3 3
8 32
5 4
1 77
3 60
090
Unite
d Ki
ngdo
m 2
3 84
1 2
2 09
1 1
8 60
7 1
5 74
7 1
2 17
7 1
2 46
5 7
859
10
076
6 87
8 6
763
11
146
12
872
17 5
25
Unite
d St
ates
3 77
0 3
629
7 49
4 8
244
9 95
1 8
530
5 50
0 5
427
4 76
2 4
310
5 15
4 4
871
5 68
2
Germ
any
8 96
0 1
0 48
9 1
2 31
9 1
2 96
8 8
937
4 80
6 6
467
6 80
7 6
407
6 66
7 6
584
8 89
8 12
894
Italy
204
322
728
482
467
415
230
150
284
812
428
879
1 66
5
Suda
n..
....
....
....
....
1 00
7 90
4 62
0 1
584
Neth
erla
nds
124
512
350
563
476
569
616
724
613
658
817
1 65
4 2
269
Indi
a18
1 21
3 14
25
8 11
9 50
96
94
41
8 1
000
315
348
834
Swed
en4
2213
829
2926
132
131
1686
134
2
Belg
ium
308
319
697
340
928
703
1 58
32
225
1 65
61
428
1 65
32
179
4 07
4
Rest
of t
he w
orld
1 05
31
153
1 07
51
814
847
1 02
378
51
006
1 24
81
186
2 05
42
645
3 12
6
By re
gion
:
Euro
pe59
980
67 2
8478
869
74 9
6157
995
53 2
5652
604
57 2
8653
632
55 3
8559
977
69 5
4499
514
North
Am
eric
a3
771
3 66
47
571
8 24
49
962
8 53
05
500
5 43
24
762
4 31
05
154
4 87
15
687
Sub-
Saha
ran
Afric
a1
75
98
437
520
1 02
792
965
61
596
Asia
and
the
Paci
fic58
163
237
157
929
533
229
047
762
31
689
963
1 28
01
912
Latin
Am
eric
a an
d th
e Ca
ribbe
an4
274
4692
4812
5925
540
814
727
627
244
9
Mid
dle
East
and
Nor
th A
frica
128
189
646
319
148
113
3870
117
025
058
6
Tota
l64
339
71 8
8987
051
84 5
3268
627
62 3
2158
573
63 4
9359
514
62 5
5967
468
76 8
7310
9 74
5

50 COMMODITIES AT A GLANCE - Special issue on gum arabicTa
ble
10 (c
ont.)
Pro
cess
ed g
um a
rabi
c ex
port
val
ues
(FOB
), by
cou
ntry
or r
egio
n of
orig
in, 1
992–
2016
(Tho
usan
ds o
f dol
lars
)
Coun
try
or re
gion
2005
2006
2007
2008
2009
2010
2011
2012
2013
2014
2015
2016
2014
-201
6 av
erag
e
Fran
ce88
126
83
680
87
033
92
143
87
964
95
900
1
04 5
59
114
902
1
21 3
85
128
848
1
28 9
74
120
861
1
26 2
28
Unite
d Ki
ngdo
m26
354
32
778
27
495
23
628
21
858
26
663
26
704
31
752
28
821
23
378
21
483
18
876
21
246
Unite
d St
ates
11 5
74
16 4
60
11 9
20
13 3
65
15 0
97
14 9
30
17 4
95
17 7
24
14 8
17
12 4
52
12 8
17
10 9
82
12 0
83
Germ
any
17 5
97
18 0
26
15 0
89
13 1
68
11 2
47
11 8
44
13 0
67
10 7
14
10 2
89
12 3
37
11 1
27
10 9
54
11 4
73
Italy
2 45
5 1
712
1 89
2 3
197
3 35
7 3
526
4 52
7 4
619
5 47
3 5
681
6 68
6 7
171
6 51
3
Suda
n2
654
2 69
1 2
636
2 65
3 2
389
3 21
1 1
369
3 12
7 3
894
3 62
0 4
064
4355
4 01
3
Neth
erla
nds
1 34
6 2
199
2 10
5 2
274
2 51
2 3
930
2 93
5 1
425
1 55
0 97
6 4
440
2 49
4 2
637
Indi
a24
4 18
9 26
5 4
638
2 20
1 3
173
3 57
9 1
546
2 44
3 2
810
2 49
4 1
030
2 11
1
Swed
en4
1313
230
7110
112
2 17
50
2673
4
Belg
ium
8 75
72
333
2 63
72
063
1 46
71
982
2 92
05
087
1 41
668
641
21
025
708
Rest
of t
he w
orld
3 08
12
635
3 82
63
727
4 31
53
939
3 67
64
195
4 80
74
369
4 10
74
086
4 18
7
By re
gion
:
Euro
pe14
5 44
414
1 80
313
7 60
513
8 38
412
9 79
114
4 94
115
5 87
417
0 02
217
0 50
617
5 46
717
4 74
216
2 81
917
1 00
9
North
Am
eric
a11
574
16 4
6211
935
13 6
7515
259
15 1
7617
601
17 8
6014
936
12 4
5912
833
10 9
8712
093
Sub-
Saha
ran
Afric
a2
727
2 73
32
654
2 67
12
469
3 31
91
473
3 61
34
554
4 81
04
143
5 33
04
761
Asia
and
the
Paci
fic1
403
828
1 16
15
613
3 79
94
856
5 55
93
079
4 47
63
978
3 98
01
858
3 27
2
Latin
Am
eric
a an
d th
e Ca
ribbe
an37
924
935
432
546
323
521
537
435
845
162
367
058
1
Mid
dle
East
and
Nor
th A
frica
665
641
1 20
221
162
764
211
914
676
166
282
273
240
Tota
l16
2 19
216
2 71
615
4 91
016
0 87
915
2 40
716
9 17
018
0 84
219
5 09
319
4 90
519
7 33
119
6 60
418
1 93
719
1 95
7
Sou
rce:
UN
CTA
D s
ecre
taria
t cal
cula
tions
, bas
ed o
n da
ta fr
om U
N C
omtr
ade
and
offic
ial s
ourc
es.
Not
es:
Cou
ntrie
s ar
e ra
nked
acc
ordi
ng to
201
4–20
16 a
vera
ges.
Fig
ures
for
the
Sud
an a
re e
stim
ates
.

51CHAPTER IV - SUPPLY AND DEMAND
Figure 22 Processed gum arabic export quantities, by main exporters, 1992–2016 (Tons)
Figure 24 Processed gum arabic export values, by main exporters, 1992–2016 (Thousands of dollars)
Figure 23 Processed gum arabic export quantity market shares, by main exporters, 1992–2016 (Percentage)
Figure 25 Processed gum arabic export value market shares, by main exporters, 1992–2016 (Percentage)
1992
1994
1996
1998
2000
2002
2004
2006
2008
2010
2012
2014
2016
1992
1994
1996
1998
2000
2002
2004
2006
2008
2010
2012
2014
2016
0
10 000
20 000
30 000
40 000
50 000
60 000
0%
20%
40%
60%
80%
100%
France Other Europe United States Sudan ROW France Other Europe United States Sudan ROW
1992
1994
1996
1998
2000
2002
2004
2006
2008
2010
2012
2014
2016
1992
1994
1996
1998
2000
2002
2004
2006
2008
2010
2012
2014
2016
France Other Europe United States Sudan ROW France Other Europe United States Sudan ROW
0
50 000
100 000
150 000
200 000
0%
20%
40%
60%
80%
100%
1992
1994
1996
1998
2000
2002
2004
2006
2008
2010
2012
2014
2016
1992
1994
1996
1998
2000
2002
2004
2006
2008
2010
2012
2014
2016
0
10 000
20 000
30 000
40 000
50 000
60 000
0%
20%
40%
60%
80%
100%
France Other Europe United States Sudan ROW France Other Europe United States Sudan ROW
1992
1994
1996
1998
2000
2002
2004
2006
2008
2010
2012
2014
2016
1992
1994
1996
1998
2000
2002
2004
2006
2008
2010
2012
2014
2016
France Other Europe United States Sudan ROW France Other Europe United States Sudan ROW
0
50 000
100 000
150 000
200 000
0%
20%
40%
60%
80%
100%
Source: UNCTAD secretariat calculations, based on data from UN Comtrade and official sources.
Source: UNCTAD secretariat calculations, based on data from UN Comtrade and official sources.
Source: UNCTAD secretariat calculations, based on data from UN Comtrade and official sources.
Source: UNCTAD secretariat calculations, based on data from UN Comtrade and official sources.
World supply of processed gum arabic is composed not only of exports, but also of gum that is processed and consumed domestically. For example, in France, large gum arabic manufacturers normally derive between 10 and 15 per cent of their turnover from domestic sales. Consequently, estimates of domestic sales of French processed gum arabic are between $14 million and $22 million per year in 2014–2016. While European manufacturers tend to export a large share of their
output, processors in the United States and India sell mostly to their respective domestic markets.
D. PROCESSED GUM ARABIC IMPORTS
Processed gum arabic import quantities and values between 1992 and 2016 are summarized in tables 11 and 12 and depicted in figures 26 and 28. In addition, figures 27 and 29 illustrate corresponding market shares in the same period.

52 COMMODITIES AT A GLANCE - Special issue on gum arabicTa
ble
11 P
roce
ssed
gum
ara
bic
mirr
or im
port
qua
ntiti
es, b
y co
untr
y or
regi
on o
f des
tinat
ion,
199
2–20
16 (T
ons)
Coun
try
or re
gion
1992
1993
1994
1995
1996
1997
1998
1999
2000
2001
2002
2003
2004
Unite
d St
ates
3 28
0 3
535
3 63
3 3
542
3 78
2 5
146
5 65
4 6
028
5 51
9 6
163
7 04
4 6
776
7 00
9
Unite
d Ki
ngdo
m2
041
2 13
32
383
2 41
41
822
2 06
62
691
2 78
82
395
2 22
12
335
2 47
92
346
Germ
any
756
624
649
629
564
753
853
967
1 50
11
606
1 47
61
458
1 70
2
Braz
il15
717
633
735
837
834
140
154
969
971
295
494
21
024
Chin
a20
811
421
913
219
830
630
920
852
440
11
051
708
Fran
ce1
256
1 03
81
058
1 70
656
71
114
902
1 39
871
364
91
119
1 91
22
045
Italy
650
1 17
584
075
571
41
455
1 54
11
681
2 05
12
433
1 88
02
209
2 04
8
Irela
nd49
641
71
071
792
1 37
91
276
665
529
689
424
298
380
316
Switz
erla
nd1
041
1 05
289
31
041
858
724
1 07
695
21
043
935
1 49
31
156
1 17
1
Neth
erla
nds
491
357
464
447
327
479
606
1 22
21
195
1 12
41
518
1 44
91
413
Rest
of t
he w
orld
6 44
65
819
6 80
67
531
6 96
08
207
8 02
69
056
9 67
710
885
12 5
7413
343
14 1
21
By re
gion
:
Euro
pe9
461
9 04
810
101
10 6
708
777
11 3
0111
673
13 4
9713
593
13 6
2216
246
16 2
6016
192
Asia
and
the
Paci
fic1
938
1 90
02
243
2 68
12
240
2 46
72
422
2 70
12
605
3 60
33
345
4 70
64
696
North
Am
eric
a3
548
3 76
43
790
3 62
73
879
5 22
65
699
6 08
55
593
6 23
37
208
6 83
37
195
Latin
Am
eric
a an
d th
e Ca
ribbe
an1
131
1 10
31
334
1 61
81
595
1 61
11
755
2 05
62
638
2 53
62
911
3 28
73
948
Mid
dle
East
and
Nor
th A
frica
229
295
456
435
628
559
629
740
731
927
819
1 29
21
059
Sub-
Saha
ran
Afric
a32
822
432
340
436
359
354
440
152
875
656
477
681
3
Tota
l16
634
16 3
3418
247
19 4
3517
482
21 7
5822
721
25 4
8125
689
27 6
7631
092
33 1
5433
903

53CHAPTER IV - SUPPLY AND DEMANDTa
ble
11 (c
ont.)
Pro
cess
ed g
um a
rabi
c m
irror
impo
rt q
uant
ities
, by
coun
try
or re
gion
of d
estin
atio
n, 1
992–
2016
(Ton
s)
Coun
try
or re
gion
2005
2006
2007
2008
2009
2010
2011
2012
2013
2014
2015
2016
2014
-201
6 av
erag
e
Unite
d St
ates
4 75
5 6
208
6 28
3 5
306
5 48
4 6
171
6 29
1 7
149
7 79
4 7
673
7 91
7 7
800
7 79
7
Unite
d Ki
ngdo
m2
974
2 59
8 2
410
2 42
5 2
755
3 26
8 3
953
3 62
8 3
318
3 42
1 3
724
3 58
3 3
576
Germ
any
2 35
9 2
132
1 82
2 2
054
1 75
8 2
530
2 45
5 2
304
2 31
3 2
510
2 92
1 2
849
2 76
0
Braz
il1
020
1 27
1 1
068
1 38
2 1
371
1 60
1 1
351
1 82
2 1
970
1 67
7 5
146
1 42
6 2
750
Chin
a1
104
1 12
6 1
550
1 76
9 2
233
2 47
8 3
196
3 35
3 3
346
3 32
1 2
780
1 63
2 2
577
Fran
ce1
790
1 13
9 1
553
1 45
4 1
064
1 19
2 1
366
1 79
8 2
431
2 44
1 2
328
2 32
9 2
366
Italy
1 87
1 1
952
2 01
3 1
927
1 73
3 2
491
2 52
2 2
238
2 64
0 2
485
2 49
1 2
037
2 33
8
Irela
nd1
195
2 02
7 1
611
2 18
9 1
619
2 43
9 2
151
2 16
2 2
276
2 57
9 2
152
2 22
2 2
318
Switz
erla
nd1
290
1 66
62
208
2 01
71
348
1 6
571
819
1 62
11
638
1 77
21
879
1 74
71
799
Neth
erla
nds
1 57
71
587
1 72
21
749
1 83
82
004
1 94
61
821
1 90
11
845
1 80
91
701
1 78
5
Rest
of t
he w
orld
14 8
2113
975
16 3
5518
518
18 5
2521
757
22 2
2521
804
21 4
0722
398
22 6
6624
015
23 0
26
By re
gion
:
Euro
pe18
654
19 1
9420
134
21 5
1319
725
23 5
8624
002
23 6
1723
916
25 5
8626
165
25 7
0325
818
Asia
and
the
Paci
fic5
608
4 78
15
759
7 51
97
361
8 38
110
004
9 71
79
924
9 98
69
478
8 96
89
478
North
Am
eric
a5
005
6 44
36
515
5 61
25
928
6 61
26
867
7 61
88
306
8 15
18
458
8 40
28
337
Latin
Am
eric
a an
d th
e Ca
ribbe
an3
456
3 68
34
033
4 11
34
235
5 31
44
968
5 55
85
365
5 02
48
751
4 84
86
208
Mid
dle
East
and
Nor
th A
frica
1 19
01
047
1 51
51
616
1 72
52
848
2 44
82
284
2 50
52
562
2 19
92
254
2 33
8
Sub-
Saha
ran
Afric
a84
253
563
941
875
484
698
590
710
1881
376
111
6791
3
Tota
l34
755
35
683
38
595
40
790
39
728
47
588
49
275
49
702
51
034
52
124
55
812
51
336
53
092
Sou
rce:
UN
CTA
D s
ecre
taria
t cal
cula
tions
, bas
ed o
n da
ta fr
om U
N C
omtr
ade
and
offic
ial s
ourc
es (m
irror
dat
a).
Not
e: C
ount
ries
are
rank
ed a
ccor
ding
to d
esce
ndin
g 20
14–2
016
aver
ages
.

54 COMMODITIES AT A GLANCE - Special issue on gum arabicTa
ble
12 P
roce
ssed
gum
ara
bic
mirr
or im
port
val
ues
(FOB
), by
cou
ntry
or r
egio
n of
des
tinat
ion,
199
2–20
16 (T
hous
ands
of d
olla
rs)
Coun
try
or re
gion
1992
1993
1994
1995
1996
1997
1998
1999
2000
2001
2002
2003
2004
Unite
d St
ates
10 6
08
10 3
15
14 2
97
12 0
87
10 8
91
12 3
34
12 7
76
13 8
57
12 4
16
12 7
41
14 4
17
14 5
17
20 8
13
Irela
nd1
849
1 95
0 6
478
4 63
8 8
117
3 69
2 2
264
1 75
5 2
323
1 29
0 88
3 1
130
1 00
9
Unite
d Ki
ngdo
m7
767
8 35
1 10
492
11
104
6
713
5 65
7 5
715
6 92
5 5
179
4 14
2 4
698
4 60
2 7
189
Germ
any
2 98
5 3
227
2 93
6 3
126
2 15
7 2
102
2 14
7 2
258
2 89
8 3
205
3 01
0 3
449
6 21
7
Chin
a13
6 57
39
3 48
2 52
5 55
1 85
2 94
5 59
1 1
229
1 07
3 3
135
2 34
3
Braz
il64
9 70
9 1
563
1 53
5 1
484
1 11
7 1
114
1 55
2 1
912
1 64
0 2
206
2 28
9 3
100
Switz
erla
nd3
718
5 50
3 5
162
5 87
4 3
445
2 44
2 3
123
2 94
4 2
557
2 25
3 3
551
3 07
3 5
223
Italy
3 01
3 6
732
4 22
6 3
319
2 69
6 3
086
3 04
1 3
028
3 48
7 4
133
3 41
3 4
677
7 60
9
Neth
erla
nds
2 01
92
051
2 06
32
336
1 26
11
421
1 47
42
673
2 43
12
207
2 85
53
095
4 61
6
Japa
n4
888
4 93
73
032
2 0
322
236
1 96
31
954
1 02
01
817
1 88
21
817
2 77
14
646
Rest
of t
he w
orld
26 7
0728
056
36 4
1038
000
29 1
0427
955
24 1
1526
537
23 9
0327
882
29 5
4534
298
47 1
56
By re
gion
:
Euro
pe36
544
43 3
3749
985
47 9
4636
317
30 4
9528
464
32 2
9629
562
28 1
3632
581
34 3
7652
683
Asia
and
the
Paci
fic8
916
9 64
310
669
11 0
189
714
9 29
07
349
7 44
57
048
9 78
88
719
13 1
7116
864
North
Am
eric
a12
071
11 5
1315
282
12 5
6511
342
12 6
4412
933
13 9
9812
663
12 9
8214
948
14 7
1521
378
Latin
Am
eric
a an
d th
e Ca
ribbe
an4
447
5 16
37
177
8 39
46
581
5 79
85
724
6 19
86
778
6 61
87
365
8 79
112
242
Mid
dle
East
and
Nor
th A
frica
872
1 12
92
045
2 24
23
103
2 10
32
324
2 23
82
333
2 92
42
493
4 00
34
104
Sub-
Saha
ran
Afric
a1
489
1 10
41
892
2 36
71
570
1 99
11
780
1 31
81
129
2 11
11
360
1 85
42
473
Tota
l64
339
71
889
87
051
84
532
68
627
62
321
58
573
63
493
59
514
62
558
67
467
76
873
10
9 74
5
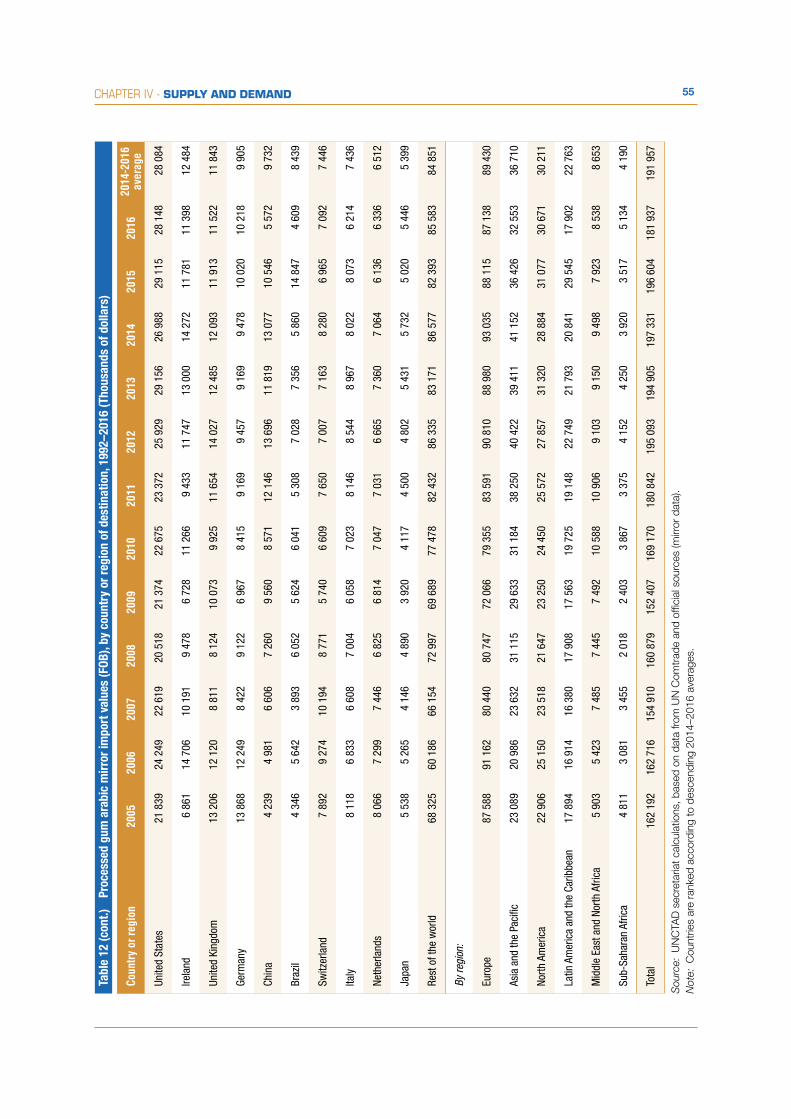
55CHAPTER IV - SUPPLY AND DEMANDTa
ble
12 (c
ont.)
Pr
oces
sed
gum
ara
bic
mirr
or im
port
val
ues
(FOB
), by
cou
ntry
or r
egio
n of
des
tinat
ion,
199
2–20
16 (T
hous
ands
of d
olla
rs)
Coun
try
or re
gion
2005
2006
2007
2008
2009
2010
2011
2012
2013
2014
2015
2016
2014
-201
6 av
erag
e
Unite
d St
ates
21 8
39
24 2
49
22 6
19
20 5
18
21 3
74
22 6
75
23 3
72
25 9
29
29 1
56
26 9
88
29 1
15
28 1
48
28 0
84
Irela
nd6
861
14 7
06
10 1
91
9 47
8 6
728
11 2
66
9 43
3 11
747
13
000
14
272
11
781
11
398
12
484
Unite
d Ki
ngdo
m13
206
12
120
8
811
8 12
4 10
073
9
925
11 6
54
14 0
27
12 4
85
12 0
93
11 9
13
11 5
22
11 8
43
Germ
any
13 8
68
12 2
49
8 42
2 9
122
6 96
7 8
415
9 16
9 9
457
9 16
9 9
478
10 0
20
10 2
18
9 90
5
Chin
a4
239
4 98
1 6
606
7 26
0 9
560
8 57
1 12
146
13
696
11
819
13
077
10
546
5
572
9 73
2
Braz
il4
346
5 64
2 3
893
6 05
2 5
624
6 04
1 5
308
7 02
8 7
356
5 86
0 14
847
4
609
8 43
9
Switz
erla
nd7
892
9 27
4 10
194
8
771
5 74
0 6
609
7 65
0 7
007
7 16
3 8
280
6 96
5 7
092
7 44
6
Italy
8 11
8 6
833
6 60
8 7
004
6 05
8 7
023
8 14
6 8
544
8 96
7 8
022
8 07
3 6
214
7 43
6
Neth
erla
nds
8 06
67
299
7 44
66
825
6 81
47
047
7 03
16
665
7 36
07
064
6 13
66
336
6 51
2
Japa
n5
538
5 26
54
146
4 89
03
920
4 11
74
500
4 80
25
431
5 73
25
020
5 44
65
399
Rest
of t
he w
orld
68 3
2560
186
66 1
5472
997
69 6
8977
478
82 4
3286
335
83 1
7186
577
82 3
9385
583
84 8
51
By re
gion
:
Euro
pe87
588
91 1
6280
440
80 7
4772
066
79 3
5583
591
90 8
1088
980
93 0
3588
115
87 1
3889
430
Asia
and
the
Paci
fic23
089
20 9
8623
632
31 1
1529
633
31 1
8438
250
40 4
2239
411
41 1
5236
426
32 5
5336
710
North
Am
eric
a22
906
25 1
5023
518
21 6
4723
250
24 4
5025
572
27 8
5731
320
28 8
8431
077
30 6
7130
211
Latin
Am
eric
a an
d th
e Ca
ribbe
an17
894
16 9
1416
380
17 9
0817
563
19 7
2519
148
22 7
4921
793
20 8
4129
545
17 9
0222
763
Mid
dle
East
and
Nor
th A
frica
5 90
35
423
7 48
57
445
7 49
210
588
10 9
069
103
9 15
09
498
7 92
38
538
8 65
3
Sub-
Saha
ran
Afric
a4
811
3 08
13
455
2 01
82
403
3 86
73
375
4 15
24
250
3 92
03
517
5 13
44
190
Tota
l16
2 19
2 16
2 71
6 15
4 91
0 16
0 87
9 15
2 40
7 16
9 17
0 18
0 84
2 19
5 09
3 19
4 90
5 19
7 33
1 19
6 60
4 18
1 93
7 19
1 95
7
Sou
rce:
UN
CTA
D s
ecre
taria
t cal
cula
tions
, bas
ed o
n da
ta fr
om U
N C
omtr
ade
and
offic
ial s
ourc
es (m
irror
dat
a).
Not
e: C
ount
ries
are
rank
ed a
ccor
ding
to d
esce
ndin
g 20
14–2
016
aver
ages
.

56 COMMODITIES AT A GLANCE - Special issue on gum arabic
Figure 26 Processed gum arabic import quantities, by main importers, 1992–2016 (Tons)
Figure 28 Processed gum arabic import values, by main importers, 1992–2016 (Thousands of dollars)
Figure 27 Processed gum arabic import quantity market shares, by main importers, 1992–2016 (Percentage)
Figure 29 Processed gum arabic import value market shares, by main importers, 1992–2016 (Percentage)
1992
1994
1996
1998
2000
2002
2004
2006
2008
2010
2012
2014
2016
1992
1994
1996
1998
2000
2002
2004
2006
2008
2010
2012
2014
2016
0
20 000
40 000
60 000
United States United Kingdom Germany BrazilChina Rest of Europe ROW
United States United Kingdom Germany BrazilChina Rest of Europe ROW
0%
20%
40%
60%
80%
100%
1992
1994
1996
1998
2000
2002
2004
2006
2008
2010
2012
2014
2016
1992
1994
1996
1998
2000
2002
2004
2006
2008
2010
2012
2014
2016
0
50 000
100 000
150 000
200 000
United States Ireland United Kingdom GermanyChina Rest of Europe ROW
United States Ireland United Kingdom GermanyChina Rest of Europe ROW
0%
20%
40%
60%
80%
100%
1992
1994
1996
1998
2000
2002
2004
2006
2008
2010
2012
2014
2016
1992
1994
1996
1998
2000
2002
2004
2006
2008
2010
2012
2014
2016
0
20 000
40 000
60 000
United States United Kingdom Germany BrazilChina Rest of Europe ROW
United States United Kingdom Germany BrazilChina Rest of Europe ROW
0%
20%
40%
60%
80%
100%
1992
1994
1996
1998
2000
2002
2004
2006
2008
2010
2012
2014
2016
1992
1994
1996
1998
2000
2002
2004
2006
2008
2010
2012
2014
2016
0
50 000
100 000
150 000
200 000
United States Ireland United Kingdom GermanyChina Rest of Europe ROW
United States Ireland United Kingdom GermanyChina Rest of Europe ROW
0%
20%
40%
60%
80%
100%
Source: UNCTAD secretariat calculations, based on data from UN Comtrade and official sources.
Source: UNCTAD secretariat calculations, based on data from UN Comtrade and official sources.
Source: UNCTAD secretariat calculations, based on data from UN Comtrade and official sources.
Source: UNCTAD secretariat calculations, based on data from UN Comtrade and official sources.
Imports of processed gum arabic are substantially less concentrated than exports. While France alone accounted for 69 per cent of total exports in 2014–2016, the largest importer, the United States, was responsible for 15 per cent of total imports. The same discrepancy is observed in terms of the five largest exporters (combined market share of 92 per cent) and the five largest importers (37 per cent market share). Processed gum arabic imports are also considerably less concentrated than crude gum arabic exports or imports, which are dominated by African and European countries, respectively. The more balanced distribution of processed gum imports reflects the wide applications of gum arabic in industries that are diversified at a global level.
Although imports by the United States more than doubled in both quantity and value terms in the last quarter century, they increased at a slower rate than imports elsewhere. As a result, the market share
of the leading player decreased after 2000. This is in marked contrast with the trend of increasing concentration for both crude gum imports and processed gum exports, where the market shares of France grew significantly over time (the same is true for the share of India in crude gum arabic imports).
Processed gum arabic imports by developing countries have increased significantly in recent decades. Their combined import value market share increased from 17 per cent in 1992–1994 to 35 per cent in 2014–2016. Chinese imports surged from $195,000 in 1992–1994 to nearly $10 million in 2014–2016. In Brazil, imports increased from $1 million to $8.5 million in the same period. Five other emerging economies imported between $3 million and $5 million per year in 2014–2016: Mexico, Argentina, the Russian Federation, the Republic of Korea and Turkey (in descending order).

57CHAPTER IV - SUPPLY AND DEMAND
Despite the increase in the import market shares of emerging and developing countries, Europe remained the largest importer of processed gum arabic throughout the 1992–2016 period. Nevertheless, the combined market share for all European countries declined from 58 per cent in 1992–1994 to 47 per cent in 2014–2016. Ireland and the United Kingdom were the leading European importers, each importing
$12–$12.5 million per year in 2014–2016. They were followed by Germany ($10 million) and Switzerland ($7.5 million). The average annual imports of processed gum arabic in 2014–2016 of France ($5 million) were outshined by its average annual exports ($125 million) and the domestic sales by French gum arabic manufacturers ($14 million–$22 million) in the same period.


CHAPTER VPRICES
Phot
o cr
edit:
© F
otol
ia

60 COMMODITIES AT A GLANCE - Special issue on gum arabic
Figure 30 Kordofan hashab, FOB Port Sudan, 2006–2016 (Dollars per ton)
Figure 31 Nigeria Grades 1 and 2, CIF NW Europe, 1997–2009 (Euros per ton)
0 500
1 0001 5002 0002 5003 0003 5004 0004 500
0 500
1 0001 5002 0002 5003 0003 5004 0004 500
Grade 2
Grade 1
29.0
6.20
06
29.0
6.20
07
29.0
6.20
08
29.0
6.20
09
29.0
6.20
10
29.0
6.20
11
29.0
6.20
12
29.0
6.20
13
29.0
6.20
14
29.0
6.20
15
29.0
6.20
16
01.0
7.19
97
01.0
7.19
98
01.0
7.19
99
01.0
7.20
00
01.0
7.20
01
01.0
7.20
02
01.0
7.20
03
01.0
7.20
04
01.0
7.20
05
01.0
7.20
06
01.0
7.20
07
01.0
7.20
08
0 500
1 0001 5002 0002 5003 0003 5004 0004 500
0 500
1 0001 5002 0002 5003 0003 5004 0004 500
Grade 2
Grade 1
29.0
6.20
06
29.0
6.20
07
29.0
6.20
08
29.0
6.20
09
29.0
6.20
10
29.0
6.20
11
29.0
6.20
12
29.0
6.20
13
29.0
6.20
14
29.0
6.20
15
29.0
6.20
16
01.0
7.19
97
01.0
7.19
98
01.0
7.19
99
01.0
7.20
00
01.0
7.20
01
01.0
7.20
02
01.0
7.20
03
01.0
7.20
04
01.0
7.20
05
01.0
7.20
06
01.0
7.20
07
01.0
7.20
08
Source: UNCTAD secretariat calculations, based on data from the Public Ledger.
Source: UNCTAD secretariat calculations, based on data from the Public Ledger.
Gum arabic prices vary on the basis of several factors, including botanical source, geographical origin, grade and level of processing. Historically, prices for Acacia senegal gum are substantially higher than prices for Acacia seyal gum. However, relative prices between the two gums fluctuate according to prevailing supply and demand forces. Gum arabic prices also vary significantly from country to country, and even from region to region within a given country. For example, in the Sudan, the Kordofan region is well known for producing the highest quality gum arabic. In Senegal, the same is true of the Ferlo region. As a result, gums from these regions command higher prices than gums produced elsewhere within the respective countries. Moreover, crude gum arabic prices vary by grade. For instance, in the Sudan, HPS commands the highest prices, followed by CAS, cleaned gum, siftings and dust.
Given its exceptional reputation, Kordofan Hashab has long been the standard against which all other gums are judged. Thus, it provides the main reference price in the international market. Other reference prices for hard gum are Grade 1 (Nigeria) and Kitir (Chad). Talha (the Sudan), Grade 2 (Nigeria) and Talha (Chad) are the main reference prices for friable gum. While prices in the Sudan and Chad are expressed in an FOB basis (at Port Sudan and Douala, respectively), Nigerian prices are expressed on a CIF basis at northwestern European ports. Unlike many agricultural and mineral commodities, gum arabic is not traded through futures contracts on exchanges that standardize the quantity and minimum quality of the products traded. Figures 30 and 31 illustrate gum arabic export prices in the Sudan and Nigeria during different time periods (2006–2016 for the former; 1997–2009 for the latter).
The Kordofan FOB price peaked at $4,200 per ton in mid-2006, fell to $3,200 in late 2006 and reached a low of $1,800 per ton in early 2010. A renewed peak of $4,200 per ton in 2011 coincided with the peak of the latest commodities price boom, as measured by the UNCTAD price indices for food and agricultural raw materials. Subsequently, the Kordofan FOB price fluctuated between $2,800 and $3,400 per ton in 2012–2015 and followed a largely downward trend in 2016.
Nigerian Grade 1 and Grade 2 prices are highly correlated, as indicated by a coefficient of correlation of 0.80 between 1997 and 2006. Nonetheless, the price ratio of the two grades varied significantly over time, from as high as 3.33 in November and December of 2006, during a major hard gum supply shortfall in the Sudan, to as low as 1.21 in January 2009, after demand for friable gum received a boost from the decision by the European Union to grant official food ingredient status to gum arabic.
As opposed to reference prices, which refer to a specific type of gum, national export unit values (EUV) reflect the actual composition of a country’s exports, which may include gums of different botanical sources, grades and processing levels. For example, while the annual average Kordofan FOB price was $2,852 per ton in 2016, the Sudanese EUV for crude gum arabic was $1,570 per ton. On average, the Sudanese EUV corresponded to 66 per cent of the Kordofan FOB price in 2006–2010 and 52 per cent in 2011–2016 (figure 32). This is because not all gum exported by the Sudan was hard gum of Kordofan origin. An important and increasing share of Sudanese gum arabic exports is composed of friable gum, which commands a lower price. For example, in December 2016, the FOB price

61CHAPTER IV - SUPPLY AND DEMAND
Figure 32 Reference price and export unit value, Sudan, 2006–2016 (Dollars per ton)
Figure 33 Reference prices and export unit value, Nigeria, 1998–2006 (Dollars per ton)
Figure 34 Export unit values, Sudan, Chad and Nigeria, 1992–2016 (Dollars per ton)
2006
*
2007
2008
2009
2010
2011
2012
2013
2014
2015
2016
0
0.2
0.4
0.6
0.8
1
0
1 000
2 000
3 000
4 000
5 000
Kordofan FOB Export unit value (EUV)
EUV/Kordofan FOB
0%
20%
40%
60%
80%
100%
0
1 000
2 000
3 000
4 000
5 000
1998 1999 2000 2001 2002 2003 2004 2005 2006
Grade 1 Grade 2
Export unit value (EUV) EUV/Grade 1
1992
1994
1996
1998
2000
2002
2004
2006
2008
2010
2012
2014
2016
0
1 000
2 000
3 000
4 000
5 000
Sudan Chad Nigeria
Source: UNCTAD secretariat calculations, based on data from the Public Ledger, UN Comtrade and official sources.
Note: Kordofan FOB data for 2006 cover only the second semester.
Source: UNCTAD secretariat calculations, based on data from the Public Ledger, UN Comtrade and official sources.
Note: Reference prices were converted from euros per ton into United States dollars per ton.
Source: UNCTAD secretariat calculations, based on data from UN Comtrade and official sources.
for Sudanese friable gum was $700 per ton, just over a quarter of the Kordofan FOB price of $2,650 per ton.
In Nigeria, EUVs corresponded on average to 35 per cent of the Grade 1 reference price in 1998–2006 (figure 33). The Nigerian EUV was also consistently below the Grade 2 reference price, which suggests that a large share of Nigerian exports were composed of shiftings and low quality gums (Grade 3).
Nigerian EUVs were consistently lower than Sudanese EUVs in 1992–2016 (see figure 34), due to the large share of friable gum in total Nigerian gum exports and the inferior reputation of Nigerian gums in terms of quality and consistency.40 On the other hand, EUVs of Chad are closer to those of the Sudan, especially after 2009. While Mauritanian and Senegalese EUVs tend to follow Sudanese and Chadian EUVs, Cameroonian and Malian EUVs are closer to those of Nigeria.
Export prices are transmitted through value chains by consecutive agents. First, exporters fix prices in domestic terminal markets by deducting commercialization expenses (such as transportation, storage, cleaning, sorting and packaging) from the FOB price. Subsequently, other agents in the value chain apply the same cascading rule, thus fixing prices based on incurred costs. At the opposite end of the chain, local merchants fix the price received by producers.
As observed in the Cameroonian and Sudanese value chains examined in chapter III, the price received by 40 Gum shipments from Nigeria are more likely to consist of a mix of
gums from different botanical sources, such as Acacia senegal, Acacia seyal or even the Combretum genus. Such mixes tend to produce dark-coloured solutions with insoluble particles, which are unsuitable for a number of industrial applications.
producers in the formal market can differ significantly from the export price. This discrepancy encourages producers and local merchants to participate in more remunerative informal markets. In the absence of time series data for producer prices, it is not possible to examine the extent to which gum arabic producers are integrated into the international markets. However, anecdotal information from the Sudan indicates that since the liberalization of the sector, in 2009, the correlation between producer prices and international prices has become stronger. As a result, shocks to international prices are generally transmitted to the domestic price. While this implies higher profits for producers during price booms, it also increases risk, as GAC is no longer required to purchase gum at guaranteed minimum prices. As smallholders have little access to risk management tools to hedge against price swings, they are especially vulnerable to price volatility (UNCTAD, 2015).


CHAPTER VICONCLUSION
Phot
o co
urte
sy o
f ALL
AND
& RO
BERT
64 COMMODITIES AT A GLANCE - Special issue on gum arabic
Gum arabic is an auspicious commodity for a number of sub-Saharan African countries due to its potential to generate foreign exchange reserves, promote sustainable agriculture and forestry, ensure food security and combat desertification and climate change. Moreover, given its superior properties, natural origin and safety record, gum arabic finds commercially valuable applications in many industries. In this context, gum arabic could play a critical role in efforts to achieve the Sustainable Development Goals set forth in the 2030 Agenda for Sustainable Development.
Despite the significant expansion in production in the last decade, the gum arabic sectors in producing countries continue to be characterized by low domestic value addition, export orientation, gender segmentation and an inequitable sharing of benefits among stakeholders. Producers are hampered by a number of challenges, including low production and marketing skills, insufficient market information, inadequate infrastructure and financial services, high insecurity and limited direct access to international markets.
There are important discrepancies across producing countries, with the Sudan playing a leadership role both in terms of the quantities produced and quality. While Chad has made significant progress in recent decades, Nigeria has been hindered by quality inconsistency, poor market organization and production disruptions due to the Boko Haram insurgency. In Cameroon, Mali and Senegal, exports have started to rebound after decades of decline and stagnation. In most other countries in the African gum belt, production remains low and irregular. Although these countries are endowed with favourable natural conditions, domestic gum resources remain underexploited. For example, in parts of Ethiopia, Kenya and South Sudan, local communities lack awareness of the commercial value of gum arabic.
On a global scale, the sector is marked by a high level of concentration, with two countries accounting for three-quarters of all crude gum arabic imports and one country accounting for two thirds of all processed gum arabic exports. More notably, a single European
manufacturer – Nexira – is believed to hold a 50 per cent global market share. As a result, the gum arabic global value chain is characterized by important asymmetries. In some African countries, producers are estimated to capture only 4.5–5 per cent of the unit value of processed gum exported by European and Asian manufacturers.
To ensure that all stakeholders capture a fair share of the total value generated along the gum arabic global value chain, a combination of micro, meso and macro reforms are required. At the micro level, policies designed to support gum producers should promote: (i) improved production skills and equipment adoption, through targeted training on optimal tapping and harvesting techniques; (ii) increased product differentiation and value addition, through investment in post-harvest activities such cleaning, sorting, grading and marketing; (iii) stronger market power, through the formation of commercially-oriented producers’ associations and cooperatives; (iv) increased profitability, through the provision of finance and risk-management instruments, which would allow producers to procure sufficient inputs without having to enter into interlocked contracts and to sell output at more favourable prices; and (v) gender equality, through initiatives that combat gender segmentation and provide women with equal opportunities.
At the meso level, fostering local processing and consumption would increase domestic competition and value addition, with expected benefits to producers. In addition, improved access to information on price trends, quality requirements and market access would result in better integration into markets and the potential elimination of intermediaries. Finally, at the macro level, greater security, better institutions and overall macroeconomic stability would also benefit stakeholders throughout the gum arabic sector. Ultimately, the transformation of gum arabic production into a more remunerative activity has the potential to not only promote economic development through higher incomes, but also secure rural livelihoods, empower vulnerable groups and promote synergies with natural resource management and climate change mitigation.
65
REFERENCES
Arora J and Ramawat KG (2014). Biology and biotechnology of gum yielding Indian trees. In: Ramawat KG, Méril-lon JM and Ahuja MR, eds. Tree biotechnology. CRC Press. Boca Raton: 125–150.
Badreldin HA, Amal Z and Gerald B (2009). Biological effects of gum arabic: A review of some recent research. Food and Chemical Toxicology. 47(1): 1–8.
Bloomberg (2015). Sudan Sees Gum-Arabic Exports Up on U.S. Rule, China Demand. June 15.
Bonannee M (1999). Données statistiques sur les produits forestiers non ligneux en République Centrafricaine. Report for EC-FAO programme GCP/INT/679/EC. Bangui.
Chikamai B (1998). Production, markets and quality control of gum arabic in Africa: Findings and recommenda-tions from an FAO project. In: Mugah JO, Chikamai BN, Mbiru SS and Casadei E, eds. Conservation, man-agement and utilization of plant gums, resins and essential oils. FAO. Rome: 67–74.
CIRAD (2011). Amélioration des techniques de production de la gomme arabique. Antananarivo.
Codex Alimentarius Commission (2016). Comments of Burkina Faso, Chad, Eritrea, Ethiopia, Niger, Nigeria, Guinea, Senegal, South Sudan, Sudan, the African Union and AIPG. Joint FAO/WHO Food Standards Pro-gramme, Codex Committee on Food Additives, Forty-eighth Session, Xi’an, China, 14–18 March, Agenda item 7a, CRD 21.
Coppen JJW (1995). Gums, resins and latexes of plant origin. Non-Wood Forest Products No. 6, FAO, Rome.
Couteaudier TY (2007). Export marketing of Sudanese gum arabic. Multi-Donor Trust Fund Sector Policy Note. World Bank, Washington, D.C.
CRS (2005). Agriculture: A Glossary of Terms, Programs, and Laws, 2005 Edition. CRS Report for Congress, Order No. 97-905. Washington, D.C.
Dauqan E and Abduallah A (2013). Utilization of gum arabic for industries and human health. American Journal of Applied Sciences. 10(10): 1270–1279.
Djibo ES, Sitou L, Aïchatou A, Bil-assanou IH, Abdou M and Zoubeirou AM (2016). Local perceptions of climate change and adaptation strategies in the management of Acacia senegal parks in Niger. Journal of Biodiver-sity and Environmental Sciences. 9(1): 319–328.
Duhem C (2004). Etude des filières gomme dans les départements de Diffa et Maine Soroa: Méthodologie d’enquêtes et guides d’entretiens et questionnaires. PAFN, Niamey.
Egadu SP, Mucunguzi P and Obua J (2007). Uses of tree species producing gum arabic in Karamoja, Uganda. African Journal of Ecology. 41(1): 17–21.
Elhadji Seybou D, Assoumane A, Alzouma Mayaki Z, Abdou MM and Maisharou A (2016). Gomme arabique: Une source de revenus pour les ménages ruraux vulnérables. International Journal of Innovation and Applied Studies. 18(2): 358–370.
Eltahir MES, Elsayed MEO and Hamad MAA (2013). Assessment of local knowledge and traditional uses of Aca-cia senegal in rural areas of North Kordofan, Sudan. University of Hohenheim, Stuttgart.
El Tahir BA and VIshwanath A (2013). Market and value chain analyses of marketable natural products from agro-forestry systems in eastern Sudan. Journal of Geoscience and Environment Protection. 3: 57–73.
Fafchamps M and Hill RV (2005). Selling at the farm-gate or travelling to market. American Journal of Agricultural Economics. 87(3): 717–734.
Feleke S and Melaku S (2011). Value added processing and marketing of gums and resins. In: Lemenih M and Kassa H, eds. Opportunities and challenges for sustainable production and marketing of gums and resins in Ethiopia. CIFOR, Bogor.
REFERENCES

66 COMMODITIES AT A GLANCE - Special issue on gum arabic
Flowerman PM (1985). Marketing Sudanese gum arabic in the United States: Facts and options. Report submit-ted to USAID. Khartoum.
Fratkin E, Roth E and Nathan M (2004). Pastoral sedentarization and its effects on children’s diet, health and growth among Rendille of northern Kenya. Human Ecology. 32(5): 531–559.
Freudenberger MS (1993). Regenerating the gum arabic economy: Local level resource management in northern Senegal. In: Friedman J and Rangen H, eds. In defense of livelihood: Comparative studies on environmental action. Kumarian Press. West Hartford: 52–78.
Gachathi FN and Eriksen S (2011). Gums and resins: The potential for supporting sustainable adaptation in Kenya’s drylands. Climate and Development. 3(1): 59–70.
Gindaba J, Nigatu L and Gebrekidan H (2007). Potential, distribution, ethno-botany and tapping procedures of gum-producing Acacia species in the Somali Region, southeastern Ethiopia. East African Journal of Sciences. 1(1): 69–78.
Iniesta Ortiz JA and Ramírez Carrera E (2995). La goma arábiga en el vino. Viticultura/Enología Profesional. 100: 54–58.
Iqbal M (1993). International trade in non-wood forest products: An overview. FAO, Rome.
ITC (1978). The marketing of gum arabic: Production, marketing, uses. Geneva.
ITC (2008a). Gum arabic: Market news service – September. Geneva.
ITC (2008b). Gum arabic: Market news service – December. Geneva.
ITC (2009). Gum arabic: Market news service – September. Geneva.
ITC (2010). Stratégie sectorielle pour la promotion et la valorisation de la gomme arabique au Burkina Faso 2011–2016. Geneva.
Jurasek P, Phillips GO, Varga S, Chikamai BN and Banks WB (1993). The classification of natural gums – Part VI: Gum arabic derived from Acacia senegal var. Kerensis from Kenya. Food Hydrocolloids. 8(6): 567–588.
Khalifa AESO, Sanjak E, Ibrahim AH, Mirghani OA and Asmamaw AA (2016). Adaptation Strategies to Climate Change in the Gum Arabic Belt of North Kordofan, Sudan. IJRDO-Journal of Biological Science. 2(10): 16–29.
Kull CA and Rangan H (2012). Science, sentiment and territorial chauvinism in the acacia name change debate. In: Haberle SG and David B, eds. Peopled landscapes: Archaeological and biogeographic approaches to landscapes. ANU E Press. Canberra: 197–219
Liogier AH and Martorell LF (2000). Flora of Puerto Rico and adjacent islands: A systematic synopsis. Second edition. Editorial de la Universidad de Puerto Rico, San Juan.
Magid TDA, Eltayb MT and Dirar AMA (2014). Equalizing gum codal term (a code E414), of Acacia senegal (L.) with Acacia seyal (Del.), and its impact on gum production and exportation. Journal of Applied and Industrial Sciences. 2(3): 144–151.
Mallet B, Besse F, Gautier D, Muller D, Bouba N and Njiti C (2003). Quelles perspectives pour les gommiers en zone de savanes d’Afrique centrale? In: Jamin JY, Seiny Boukar L and Floret C, eds. Savanes africaines: Des espaces en mutation, des acteurs face à de nouveaux défis – Actes du colloque, mai 2002, Garoua, Cameroun. Centre International de Coopération Agronomique pour le Développement and Pôle Régional de Recherche Appliquée au Développement des Systèmes Agricoles d’Afrique Centrale, Montpellier and N’Djamena.
Mokwunye MUB and Aghughu O (2010). Restoring Nigeria’s lead in gum arabic production: Prospects and challenges. Report and Opinion. 2(4): 7–13.
Mujawamariya G (2012). Economics of the gum arabic value chain in Senegal. PhD Thesis. Wageningen University, Wageningen.

67
Mujawamariya G, D’Haesea M and Burger K (2010). Influence of interlocked transactions on gum arabic production and marketing in Senegal. Paper No. 96826, Third Conference of the AAAE and Forty-eighth Conference of AEASA, Cape Town, South Africa, 20–23 September.
Mujawamariya G, D’Haese M and Burger K (2012a). Gum collection and collectors’ choice of selling outlet in Senegal. In: Kennedy JF, Phillips GO and Williams PA, eds. Gum arabic: Proceedings of the World Conference on New Developments in Acacia Gums Research and Products. Royal Society of Chemistry. Cambridge: 89–98.
Mujawamariya G, Burger K and D’Haese MFC (2012b). Behaviour and performance of traders in the gum arabic supply chain in Senegal: Investigating oligopsonistic myths. Selected Paper, IAAE Triennial Conference, Foz do Iguaçu, Brazil, 18–24 August.
Mujawamariya G and Karimov AA (2014). Importance of socioeconomic factors in the collection of NTFPs: The case of gum arabic in Kenya. Forest Policy and Economics. 42: 24–29.
Mujawamariya G and Burger K (2016). Private versus communal tenure systems in gum arabic collection. In: Purabi B and van Dijk H, eds. Dryland forests: Management and social diversity in Africa and Asia. Springer. Heidelberg: 53–72.
Muller D and Okoro C (2004). Production and marketing of gum arabic. NGARA Publication Series No. 2. Net-work for Natural Gums and Resins in Africa, Nairobi.
Muller D and Wata I (1998). Production and markets for gum arabic from French-speaking West African coun-tries. In: Mugah JO, Chikamai BN, Mbiru SS and Casadei E, eds. Conservation, management and utilization of plant gums, resins and essential oils. FAO. Rome: 15–17.
Munyua SM and Muga M (2011). Report on formulating a strategy for production, value addition and marketing of products form arid and semi-arid lands (ASAL) in the IGAD region: The case of Kenya. Intergovernmental Authority on Development, Nairobi.
Njomaha C (2008). Etude socio-économique de la filière gomme arabique dans le Nord et l’Extrême-Nord Came-roun. IRAD/CEDC-SNV, Maroua.
Obua J, Agea JG, Namirembe S and Egadu SP (2006). The potential of Acacia senegal for dryland agroforestry and gum arabic production in Uganda. Journal of the Drylands. 1(2): 186–193.
Okafor JC, Omoradion FI and Amaja L (1994). Non-timber forest products: Nigeria. TFAP, FORMECU and FDF, Abuja.
Okoro C (2000). The status of gum arabic in Nigeria. In: Chikmai BN, Mbiru SS and Casadei E, eds. Report of the meeting of the Network of Natural Gums and Resins in Africa (NGARA). Kenya Forestry Research Institute. Nairobi: 38–42.
Pallme I (1844). Travels in Kordofan: Embracing a description of that province of Egypt, and of some of the bor-dering countries, with a review of the present state of the commerce in those countries, of the habits and customs of the inhabitants, as also an account of the slave-hunts taking place under the government of Mehmed Ali. J. Madden & Co., London.
Panapress (2011). Malaysia to help Sudan in gum arabic production. 2 November.
Peltier R, Palou Madi O and Balarabe O (2010). Les filières gomme arabique au Nord-Cameroun: Impacts du fonctionnement des filières gomme sur l’organisation des producteurs, la gestion des forêts naturelles et l’encouragement des plantations d’acacias. In : Seiny-Boukar L and Boumard P, eds. Savannes africaines et développement: innover pour durer. Prasac and CIRAD, N’Djamena and Montpellier.
Prasad R, Tripathi VD, Dhyani SK, Handa AK, Alam B and Singh R (2015). Performance of Acacia senegal L.: Untapped wealth of gum arabic in rangelands and grasslands in arid and semi-arid regions of India. International Grassland Congress Paper No. 1285, Lexington, Kentucky.
Ruffo CK, Birnie A and Tengnäs B (2002). Edible wild plants of Tanzania. RELMA Technical Handbook No. 27. RELMA and SIDA, Nairobi.
REFERENCES
68 COMMODITIES AT A GLANCE - Special issue on gum arabic
Seif el Din AG and Zarroug M (1996). Production and commercialization of gum arabic in Sudan. In: Leakey RRB, Temu AB, Melnyk M and Vantomme P, eds. Domestication and commercialization of non-timber forest prod-ucts in agroforestry systems. FAO. Rome: 176–182.
Shackleton S, Paumgarten F, Kassa H, Husselman M and Zida M (2011). Opportunities for enhancing poor women’s socioeconomic empowerment in the value chains of three African non-timber forest products. International Forestry Review. 13(2): 136–151.
Srivastava S and Ray DP (2015). Natural gum resources in India and their commercial importance. International Journal of Bioresource Science. 2(2): 151–155.
Teissedre PL (2012). Gum arabic in oenology. In: Kennedy JF, Phillips GO and Williams PA, eds. Gum arabic: Proceedings of the World Conference on New Developments in Acacia Gums Research and Products. The Royal Society of Chemistry. Cambridge: 311–314.
UNCTAD (2015). Commodities and Development Report 2015: Smallholder farmers and sustainable commodity development. United Nations publication, New York and Geneva.
UNCTAD (2016a). Gum arabic: An INFOCOMM Commodity Profile. United Nations publication, New York and Geneva.
UNCTAD (2016b). Trade misinvoicing in primary commodities in developing countries: The cases of Chile, Côte d’Ivoire, Nigeria, South Africa and Zambia. United Nations publication, New York and Geneva.
UNCTAD (2017). Commodities and development report 2017: Commodity markets, economic growth and development. United Nations publication, sales No. E.17.II.D.1, New York and Geneva.
van den Hoek J (2017). Agricultural market activity and Boko Haram attacks in northeastern Nigeria. West African Papers No. 9. OECD, Paris.
Vellema W, Mujawamariya G and D’Haese M (2014). Gum arabic collection in northern Kenya: Unexploited resources, underdeveloped markets. Afrika Focus. 27(1): 69–86.
Wani JTE, Yor TTO, Owino F and Jiji B (2012). Creating and enabling environment for sustainable production and marketing of gum acacia: The case of Southern Sudan. In: Kennedy JF, Phillips GO and Williams PA, eds. Gum arabic: Proceedings of the World Conference on New Developments in Acacia Gums Research and Products. The Royal Society of Chemistry. Cambridge: 61–72.
Wickens GE, Seif el Din AG, Sita G and Nahal I (1995). Role of Acacia species in the rural economy of dry Africa and the Near East. FAO Conservation Guide No. 27. FAO, Rome.
Williams PA and Phillips GO (2001). Gum arabic: Production, safety and physiological effects, physiochemical characterization, functional properties and food applications. In: Cho SS and Dreher ML, eds. Handbook of dietary fiber. Marcel Dekker, Inc. New York: 675–694.
Yogi RK, Kumar A and Jaiswal AK (2017). Lac, plant resins and gums statistics 2015: At a glance. Bulletin (Technical) Report No. 17. Indian Institute of Natural Resins and Gums, Ranchi.

69
0
200
400
600
800
1992
1994
1996
1998
2000
2002
2004
2006
2008
2010
2012
2014
2016
Reported exports Estimated exports
0
1 000
2 000
3 000
4 000
5 000
1992
1994
1996
1998
2000
2002
2004
2006
2008
2010
2012
2014
2016
Reported exports Estimated exports
0
250
500
750
1 000
1992
1994
1996
1998
2000
2002
2004
2006
2008
2010
2012
2014
2016
Reported exports Estimated exports
0
250
500
750
1 000
1992
1994
1996
1998
2000
2002
2004
2006
2008
2010
2012
2014
2016
Reported exports Estimated exports
0
250
500
750
1 000
1992
1994
1996
1998
2000
2002
2004
2006
2008
2010
2012
2014
2016
Reported exports Estimated exports
0
250
500
750
1 000
1992
1994
1996
1998
2000
2002
2004
2006
2008
2010
2012
2014
2016
Reported exports Estimated exports
0
200
400
600
1992
1994
1996
1998
2000
2002
2004
2006
2008
2010
2012
2014
2016
0
2 000
4 000
6 000
1992
1994
1996
1998
2000
2002
2004
2006
2008
2010
2012
2014
2016
Reported exports Estimated exportsReported exports Estimated exports
Figure A1 Burkina Faso
Figure A3 Eritrea
Figure A5 Kenya
Figure A2 Cameroon
Figure A4 Ethiopia
Figure A6 Mali
ANNEX
REPORTED AND ESTIMATED EXPORTS OF CRUDE GUM ARABIC, BY EXPORTING COUNTRY, 1992–2016 (TONS)
ANNEX

70 COMMODITIES AT A GLANCE - Special issue on gum arabic
Reported exports Estimated exports Reported exports Estimated exports
0
10 000
20 000
30 000
40 000
1992
1994
1996
1998
2000
2002
2004
2006
2008
2010
2012
2014
2016
0
1 000
2 000
3 000
4 000
1992
1994
1996
1998
2000
2002
2004
2006
2008
2010
2012
2014
2016
Reported exports Estimated exports Reported exports Estimated exports
0
10 000
20 000
30 000
40 000
1992
1994
1996
1998
2000
2002
2004
2006
2008
2010
2012
2014
2016
0
1 000
2 000
3 000
4 000
1992
1994
1996
1998
2000
2002
2004
2006
2008
2010
2012
2014
2016
Reported exports Estimated exportsReported exports Estimated exports
0
100
200
300
400
500
1992
1994
1996
1998
2000
2002
2004
2006
2008
2010
2012
2014
2016
0
100
200
300
400
500
1992
1994
1996
1998
2000
2002
2004
2006
2008
2010
2012
2014
2016
Reported exports Estimated exports Reported exports Estimated exports
0
20 000
40 000
60 000
80 000
1992
1994
1996
1998
2000
2002
2004
2006
2008
2010
2012
2014
2016
0
100
200
300
400
1992
1994
1996
1998
2000
2002
2004
2006
2008
2010
2012
2014
2016
Reported exports Estimated exports Reported exports Estimated exports
0
20 000
40 000
60 000
80 000
1992
1994
1996
1998
2000
2002
2004
2006
2008
2010
2012
2014
2016
0
100
200
300
400
1992
1994
1996
1998
2000
2002
2004
2006
2008
2010
2012
2014
2016
Figure A7 Mauritania
Figure A9 Nigeria
Figure A11 Sudan
Figure A8 Niger
Figure A10 Senegal
Figure A12 Uganda
Figure A13 United Republic of Tanzania
Reported exports Estimated exports
0
500
1 000
1 500
2 000
1992
1994
1996
1998
2000
2002
2004
2006
2008
2010
2012
2014
2016
Source: UNCTAD secretariat calculations, based on data from UN Comtrade and official sources.Note: Chad, Somalia and South Sudan did not report exports between 1992 and 2016.

71
COMMODITIES AT A GLANCE
PREVIOUS ISSUES
- No. 1: An historical perspective
- No. 2: Special issue on cotton in Africa
- No. 3: Special issue on energy
- No. 4: Special issue on food security
- No. 5: Special issue on rare earths
- No. 6: Special issue on gold
- No. 7: Coup d’œil sur les produits de base – Edition spéciale sur l’or
FORTHCOMING ISSUES
- No. 9: Special issue on shale gas
- No. 10: Coup d’œil sur les produits de base – Edition spéciale sur le gaz de schiste
Available at http://unctad.org/en/Pages/SUC/Commodities/SUC-Commodities-at-a-Glance.aspx (accessed 12 March 2018).

U N I T E D N AT I O N S C O N F E R E N C E O N T R A D E A N D D E V E L O P M E N T
No. 8
COMMODITIES AT A GLANCESpecial issue on gum arabic
Phot
o co
urte
sy o
f ALL
AND
& RO
BERT
Phot
o co
urte
sy o
f ALL
AND
& RO
BERT
Layout and Printing at United Nations, Geneva – 1807384 (E) – April 2018 – 1,057 – UNCTAD/SUC/2017/4