Special Education and the Milwaukee Parental Choice Program · Special Education and the Milwaukee...
32
Patrick J. Wolf University of Arkansas John F. Witte University of Wisconsin David J. Fleming Furman University SCDP Milwaukee Evaluation Report #35 February 2012 Special Education and the Milwaukee Parental Choice Program
Transcript of Special Education and the Milwaukee Parental Choice Program · Special Education and the Milwaukee...

Patrick J. Wolf University of Arkansas
John F. Witte University of Wisconsin
David J. Fleming Furman University
SCDP Milwaukee Evaluation Report #35
February 2012
Special Education and the Milwaukee Parental Choice Program

The University of Arkansas was founded in 1871 as the flagship institution of higher education for the state of Arkansas. Established as a
land grant university, its mandate was threefold: to teach students, conduct research, and perform service and outreach.
The College of Education and Health Professions established the Department of Education Reform in 2005. The department’s mission is to advance education and economic development by focusing on the improvement of academic achievement in elementary and secondary schools. It conducts research and demonstration projects in five primary areas of reform: teacher quality, leadership, policy, accountability, and school choice.
The School Choice Demonstration Project (SCDP), based within the Department of Education Reform, is an education research center devoted to the non-partisan study of the effects of school choice policy and is staffed by leading school choice researchers and scholars. Led by Dr. Patrick J. Wolf, Professor of Education Reform and Endowed 21st Century Chair in School Choice, SCDP’s national team of researchers, institutional research partners and staff are devoted to the rigorous evaluation of school choice programs and other school improvement efforts across the country. The SCDP is committed to raising and advancing the public’s understanding of the strengths and limitations of school choice policies and programs by conducting comprehensive research on what happens to students, families, schools and communities when more parents are allowed to choose their child’s school.

Special Education and the Milwaukee Parental Choice Program
Patrick J. Wolf University of Arkansas
John F. Witte University of Wisconsin
David J. Fleming Furman University
SCDP Milwaukee Evaluation Report #35 February 2012
School Choice Demonstration Project Department of Education Reform
University of Arkansas 201 Graduate Education Building
Fayetteville, AR 72701
479-575-6345
http://www.uark.edu/ua/der/SCDP/Research.html

Special Education and the Milwaukee Parental Choice Program
i
Executive SummarySpecial education and parental school choice are two of the most controversial issues in K-12 education in the United States. Those policies converge on an important question in an evaluation of the Milwaukee Parental Choice Program, what proportion of students have education-related disabilities? This debate, in Wisconsin, has provoked a lawsuit against the state’s Department of Public Instruction (DPI), which implements the Milwaukee Parental Choice Program (MPCP). MPCP is the oldest and largest urban private school voucher program in the United States.
We might expect MPCP to serve fewer students with disabilities than Milwaukee Public Schools (MPS), since most federal disability laws do not apply to private schools and the MPCP schools do not receive any extra government funds to serve students with disabilities. Still, if only a small portion of all MPCP students have disabilities, that finding would raise questions regarding the extent to which the program is fulfilling its original mission to serve disadvantaged students in Milwaukee. What proportion of students served by MPCP has disabilities? As policy researchers interested in both school choice and special education, we think this question merits a careful examination.
Based on evidence we have collected over five years of studying the MPCP program, we are able to estimate that between 7.5 and 14.6 percent of Choice students have disabilities that likely would qualify them for special education services in MPS. We have access to three different sources of statistical evidence regarding the percentage of MPCP students who have disabilities. We find that:
• 14.6 percent of the MPCP students we observed in both the private and public school sectors from 2006 through 2010 were classified as participating in special education while in MPS;
• 7.5 percent of all MPCP students were classified as having disabilities when we used MPS administrator designations for students who spent any time in MPS and MPCP administrator designations for students who always remained in MPCP;
• 11.4 percent of MPCP students were described by their parents as having disabilities, based on responses to our parent surveys administered from 2007 through 2009.
Although each of these data sources has limitations that we discuss below, collectively they establish a range of 7.5 to 14.6 percent within which we think the actual percentage of MPCP students with disabilities likely falls. Our estimated rate of student disability in the MPCP is between 23 and 61 percent lower than the rate of student disability of 19 percent reported for MPS. Our estimates, however, are more than four times higher than the disability rate of 1.6 percent for the MPCP announced by DPI based merely upon the percentage of MPCP students who were given accommodations during the most recent round of accountability testing.
Additionally, we conducted site visits of 13 MPCP schools in part to learn about how they serve students with disabilities. What we observed during those visits confirmed claims in the research and policy literature that most private schools lack the incentives, personnel, protocols, and organizational culture that lead public school systems to label students with disabilities as requiring special education services. In many cases, private school personnel hesitate to count a student as having a disability, even if public school personnel would recognize the

Special Education and the Milwaukee Parental Choice Program
ii
student as such. However, that does not mean that private schools do not enroll students who would be formally designated as students with special needs if they were in the public schools.
In sum, our five years of research on the MPCP suggests that students with disabilities are classified and served differently in the private and public education sectors in Milwaukee, and that the MPCP serves students with disabilities at about two-fifths to three-quarters the rate of MPS.
This project has been funded by a diverse set of philanthropies including the Annie E. Casey, Joyce, Kern Family, Lynde and Harry Bradley, Robertson, and Walton Family foundations. We thank them for their generous support and acknowledge that the actual content of this report is solely the responsibility of the authors and does not necessarily reflect any official positions of the various funding organizations or the universities that employ us. We also express our gratitude to officials at MPS and the Wisconsin Department of Public Instruction for their willing cooperation, advice, and assistance throughout this project. A preliminary draft of this report was greatly improved based on comments from the School Choice Demonstration Project Research Advisory Board, especially Paul Peterson and Andy Rotherham. All remaining errors are the responsibility of the authors alone.


Special Education and the Milwaukee Parental Choice Program
February 2012 1
Special Education and the Milwaukee Parental Choice ProgramSpecial education and parental school choice are two of the most controversial issues in K-12 education in the United States. In certain places, especially Milwaukee, Wisconsin, those two sensitive education concerns intersect in ways that prompt regular interest on the part of policy makers, advocates, the media, and the public at large. In this report we examine evidence regarding the extent to which the Milwaukee Parental Choice Program (MPCP) serves students with special physical or educational needs. At issue is the difference between students being formally (and legally) identified as “in special education” and students who likely would be so identified if they were in public rather than private schools.
The extent to which school choice initiatives such as public charter schools and private voucher or scholarship programs are accessible to students with disabilities is a major policy concern. For example, a public charter school in Washington, DC, is being investigated due to the complete absence of any special education students within its walls (Turque 2012). In Milwaukee, the public charter schools that are independent of Milwaukee Public Schools (MPS) have a total special education enrollment of 8.4 percent, less than half the 19 percent rate for MPS (Witte et al. 2010a, p. 12).
Our specific concern here is with the participation rates of students with disabilities in Milwaukee’s means-tested school voucher program. Voucher programs permit parents to enroll their child in a participating private school, of their choosing, with the support of government funds that often are accepted as the full cost of educating the child. Tax-credit scholarship programs are similar to voucher programs except that they are funded indirectly by providing individuals and corporations with a dollar-for-dollar reduction in their tax liability in exchange for charitable contributions to nonprofit organizations that issue voucher-type scholarships.
Fifteen voucher and 11 tax-credit scholarship programs currently operate in the U.S. (Exhibit 1). We have organized them into two types. Traditional voucher or tax-credit scholarship programs usually are limited to families below a certain income level or students attending public schools deemed in need of improvement. Seventeen such programs exist in the U.S., including in Milwaukee and Racine, Wisconsin. Type A private school choice programs collectively enroll 181,224 students, with the majority of them in the large statewide tax-credit scholarship programs in Pennsylvania and Florida or the established urban voucher programs in Milwaukee and Cleveland. Type A programs account for 86 percent of all private school choice students in the U.S.
Type B programs provide vouchers or tax-credit scholarships to students with disabilities, regardless of their family income or the performance of their neighborhood public school. Nine such programs operate in the U.S., enrolling 30,158 students who comprise 14 percent of all private school choice enrollments. Most of the students using special needs vouchers are in Florida, as the McKay Scholarship for Students with Disabilities Program enrolls 22,861 students, making it approximately the same size as the MPCP.
Our research here most clearly applies to Type A private school choice programs. After all, the percentage of students with disabilities in the 9 special needs programs is obvious: it is 100 percent. Thus, although we think that some of the issues that we discuss in this report, such as the different ways that students with disabilities are labeled and served in the public and private sectors, apply to all private school choice programs, we acknowledge

Special Education and the Milwaukee Parental Choice Program
February 20122
that the empirical results of our study apply most clearly to the 17 voucher or tax-credit programs that primarily serve students who are low-income or leaving low-performing public schools (or both).
We draw upon three sources of statistical data for our analysis of special education in MPCP. First, we draw on administrative data associated with students in our longitudinal study who attended both MPCP and MPS schools during our five-year research project to inform a statistical estimation of the extent to which the same student’s probability of being classified as having a disability changes when that student moves between the MPCP and the MPS sectors. Second, we compile five years worth of information on the disability status of all the MPCP students in our study, drawn from MPCP school personnel. Our third source of information is the results of a survey we administered to the parents of a representative sample of students in the Choice program and the parents of similar MPS students over a three-year period. In addition to these quantitative measures of student disability in MPCP and MPS, we also draw from interviews of teachers and administrators at private schools participating in the MPCP regarding their organizational norms and practices in relation to such students.
Although each of these data sources has limitations that we discuss below, collectively they establish a range of 7.5 to 14.6 percent within which we think the actual percentage of MPCP students with education-related disabilities likely falls. Our estimated rate of student disability
Exhibit 1: Types of Private School Choice Programs in the U.S., 2011-12
TAX CREDIT PROGRAMS VOUCHER PROGRAMS
Type A. Traditional Voucher or Tax-Credit Scholarship Programs (17)
Arizona Individual School Tuition Organization Tax CreditArizona Corporate School Tuition Organization Tax CreditCleveland Scholarship and Tutoring ProgramDistrict of Columbia Opportunity Scholarship ProgramDouglas County, Colorado, Choice Scholarship ProgramFlorida Tax Credit ScholarshipGeorgia Scholarship Tax Credit ProgramIndiana Corporate and Individual Scholarship Tax Credit ProgramIndiana Choice Scholarship ProgramIowa Individual and Corporate School Tuition Organization Tax CreditMilwaukee Parental Choice ProgramNew Orleans Student Scholarships for Educational Excellence Program Ohio Educational Choice Scholarship ProgramOklahoma Equal Opportunity Education Scholarships (has a provision for special needs students)Pennsylvania Educational Improvement Tax CreditRacine Parental Choice ProgramRhode Island Corporate Scholarship Tax Credit
Total Enrollments: 181,224
Percent of All Voucher/Tax-Credit Enrollments: 86%
Type B. Special Needs Voucher/Tax-Credit Programs (9)
Arizona Empowerment Scholarship Accounts ProgramArizona Lexie’s LawFlorida McKay Scholarship ProgramGeorgia Special Needs Scholarship ProgramLouisiana School Choice Pilot Program for Certain Students with ExceptionalitiesOhio Autism Scholarship ProgramOhio Jon Peterson Special Needs Scholarship ProgramOklahoma Lindsey Nicole Henry Scholarship for Students with Disabilities Utah Carson Smith Special Needs Scholarship
Total Enrollments: 30,158
Percent of All Voucher/Tax-Credit Enrollments: 14%
Source: Compiled from Glenn and Gininger 2012, pp. 12-13.

Special Education and the Milwaukee Parental Choice Program
February 2012 3
in the MPCP is between 23 and 61 percent lower than the rate of student disability of 19 percent reported for MPS in 2011. Our estimates, however, are more than four times higher than the disability rate of 1.6 percent for the MPCP announced by the Wisconsin Department of Public Instruction (DPI) based merely upon the percentage of MPCP students who were given accommodations during the most recent round of accountability testing (Wisconsin DPI 2011a).
This report is structured as follows. Next we discuss the legal and procedural structure of special education in the public and private educational sectors. After that we paint a picture of the operational reality of special education in MPCP through material from school visits. We then present our three statistical estimates of the disability rate in MPCP. Finally, we discuss why our statistical estimates differ both from DPI’s announced disability rate for the MPCP and the official rate of disability reported in MPS.
Structure of Special EducationSpecial education refers to educational supports and programs targeted to school-age children with exceptional education needs due to physical, cognitive, or behavioral disabilities. Receiving a special education designation brings with it certain legal rights for special services or accommodations in the public educational sphere. Such rights originated with the federal Rehabilitation Act of 1973 and were further codified and extended through the All Handicapped Children Act of 1975, which has since been renamed the Individuals with Disabilities Education Act or IDEA (Palmaffy 2001).
Students with qualified official diagnoses of a disability that affects their learning, and most disabilities do, are covered by special education laws and programs in Wisconsin and throughout the country. The most commonly recognized qualified diagnoses include autism, visual impairment, speech or hearing impairment, mobility impairment, other health impairment, mental retardation, emotional disturbance, and specific learning disability (Horn and Tynan 2001, p. 29).
Public school students who are diagnosed with a qualifying condition are entitled by federal law to receive a Free and Appropriate Public Education (FAPE) to include special education services in the least restrictive environment possible and according to an Individualized Education Program (IEP) (Wolf and Hassel 2001). A student’s IEP is drawn up by a committee of interested parties including the student’s parents or guardians, local public school officials, and relevant medical or psychological diagnosticians and care providers. The extra services provided to students in special education are funded through a combination of federal, state, and local monies based on formulas established in law. In Wisconsin, the federal government pays about 11 percent of the extra cost of educating each student in special education, with the state paying 26 percent of those costs and the local public school district covering the remaining 63 percent. In some cases districts across the country contract with private schools to enroll and educate students with disabilities who they cannot accommodate within their own schools (McGroarty 2001).
The legal and funding structure surrounding special education in the private school sector differs greatly from the situation in the public school sector. Except for the case of public school contracts with private schools, the IEP and additional funding associated with a student with a disability in the public sector does not transfer with

Special Education and the Milwaukee Parental Choice Program
February 20124
the student if the child enrolls in a private school. The point is made clearly in a recent memo on the subject from the Wisconsin DPI (2011b, p. 6):
…[S]tudents with disabilities attending voucher schools as part of the MPCP are considered parentally placed private school students and as such, DPI treats them in the same fashion as students attending private non-voucher schools. Under 34 CFR § 300.137 parentally placed private school students are eligible to participate in equitable services and are not entitled to a Free and Appropriate Public Education (FAPE). How, where, and by whom equitable services will be provided for parentally placed private school students is determined through a consultative process between representatives of MPS and representatives of private school officials and representatives of parentally placed private school students.
If a parent, as opposed to local school officials, enrolls a student with special needs in a private school, that student must surrender his or her legal rights to the special educational services and funding included in her IEP. Private schools are not required by federal law to enroll students with disabilities (Wisconsin DPI 2011b, p. 3).
Private schools are not entitled to any additional resources from the state if they do enroll a student with special needs. They can either accommodate the student themselves, using whatever resources they have, or seek to engage in a negotiation with public school officials regarding the provision of special services to the student by the public school system with additional public funds. The latter option, called “equitable services”, does not appear to be popular with private school officials and parents. One MPCP principal we interviewed stated that private school parents “know that an extended process to qualify for a [equitable] services plan usually results in their child being assigned a waiting list for services and often will not receive any services.” Public school officials, quite understandably, are most interested in serving their own special needs students first.
This does not mean that private schools do not enroll or serve students with special needs. Many of them do so. In fact, some private schools, in Wisconsin and throughout the nation, exclusively serve students with severe disabilities that cannot be adequately accommodated elsewhere (McCroarty 2001; Wolf and Hassel 2001, pp. 60-62). Wisconsin state law prohibits private schools participating in MPCP from discriminating against student applicants based on disability. The Wisconsin DPI (2011b, p. 6) states:
A private school may not discriminate against a child with special educational needs in the admission process for the MPCP. However, as a private school, a MPCP school is required to offer only those services to assist students with special needs that it can provide with minor adjustments.
In reality most private schools, including many of the schools in MPCP, are only equipped to serve students with mild-to-moderate special needs. As Superintendent of Public Instruction Tony Evers stated in a memo on the MPCP to the Wisconsin Joint Committee on Finance (Wisconsin DPI 2011c, p. 6), “as a practical matter, public schools offer a greater range of services and better economies of scale [than private schools] when providing special education services.”

Special Education and the Milwaukee Parental Choice Program
February 2012 5
What is important here is not the fine legal distinctions between the rights of students and the responsibilities of schools and school districts in the public and private sectors so much as the more general distinction in form and style regarding how students with disabilities are identified and served in the two sectors. In the public sector, special education is largely driven by legal rights and formal procedures (Wolf and Hassel 2001). Official diagnoses must be made and, once made, an elaborate multi-step process must be followed that results in some change in how or where a student is educated that is expected to serve the child’s special needs. Students are officially designated as “special education” on forms and in school records to ensure that they receive the extra services to which they are entitled by law. Once a student receives a special education designation, that label tends to stick until the child drops out of school or graduates (Finn, Rotherham and Hokanson 2001, p. 338). The procedures and services that result are supported by additional federal, state, and local funds.
In the private sector, in contrast, special education tends to be handled much less formally. Most elements of the IDEA law do not apply to private schools, so such schools are not required to follow formal procedures in diagnosing or serving students with special educational needs. Student IEPs have no legal force in the private sector and bring no additional public funds to the private school. The formal structure of special education, including explicitly labeled students, exists primarily and almost exclusively in the public sector. When and if parents choose to enroll their student with special needs in a private school, for example through participating in a Type A voucher program such as the MPCP, they leave all of that formal policy structure -- including the child’s IEP, special education label, special supports, and extra funding -- behind.
Given the reality that special education is implemented with great formality in the public sector and great informality in the private sector, we might expect the same student with special educational needs to be less likely to be diagnosed and labeled as “special education” if that child is enrolled in the private school sector, through the MPCP, as opposed to the public sector. There are at least three reasons to expect an under-designation of special education students in the private school sector:
1. Private schools are far less likely to employ school psychologists and counselors than are public schools, meaning a given student with special education needs is less likely to be diagnosed as such if in a private school;
2. Many private schools resist conferring formal labels on their students, so even if a private school realizes that a student has a disability it is unlikely to formally designate him or her as a special education student;
3. Private schools need to educate a given special needs student, to the best of their ability and for the same amount of resources, regardless of whether they go through the time and trouble to formally designate him or her as a special education student, so, not surprisingly, most private schools do not bother to do so (Peterson and Llaudet 2006, p. 14).
Under such circumstances, we expect two empirical realities to hold. First, the percentage of MPCP students who actually have disabilities that presumably would qualify them for special education will be smaller than the percentage of MPS special education students. This is because the public sector receives more resources and can provide more special services to special education students, naturally attracting such students to their school system and away from the private sector. Second, the percentage of MPCP students classified as having

Special Education and the Milwaukee Parental Choice Program
February 20126
a disability will be substantially lower than the percentage of MPCP students who actually have the sorts of special educational needs that would qualify them as special education students were they to be educated in MPS. Before we test these expectations empirically we provide additional information about how students with disabilities are treated in MPCP schools.
Special Education in the MPCP: The Reality on the GroundIn the final year of our longitudinal evaluation of the MPCP we examined with our own eyes how education was delivered to students in Milwaukee schools (Stewart, Jacob, and Jensen 2012). We requested permission from a broad assortment of MPCP and MPS schools to conduct site visits and interview school personnel. We received permission to conduct the site visits from most of the MPCP schools we approached, and several MPS principals invited us to visit their schools, but we were denied access to any MPS schools by the central administration.
One goal of our 2011 site visits was to learn more about the number of students with disabilities who attend MPCP schools and how those special needs students are served. We visited six high schools and seven elementary/middle schools that participate in MPCP. Our research protocols require that we keep the names of the schools and school personnel confidential. The schools were selected to represent the diversity of MPCP regarding school-level performance and other distinctive characteristics of schools. We interviewed teachers, administrators, board members, and parents. When interviewing principals and school counselors, we asked them how they serve students with disabilities. In general we learned that:
• These schools enroll students with special needs, even some with severe disabilities. We observed children with Down’s Syndrome, autism, and emotional disturbance. One MPCP elementary school we visited only serves students with disabilities.
• Few schools in the MPCP formally classify any of their students as in special education. Several principals stated that parents of students with disabilities switch their children to the private school from MPS specifically to escape the special education label.
• Most of the schools in the MPCP that we visited said that they serve students with disabilities in the same way they serve all their economically and educationally disadvantaged students -- by providing a challenging educational program but also extra time and individualized attention from teachers and Title I tutors to learn the material.
• Most of the MPCP school personnel we interviewed said that their school lacks the resources and programs to serve the needs of students with severe physical, emotional, or learning disabilities. Almost all of their enrollees who would be classified as special education if in MPS have disabilities within the range of mild-to-moderate in severity, with the exceptions noted above. The fact that the voucher amount of $6,442 per student must cover all of the costs of educating each MPCP student was cited by principals as the main reason why students with severe disabilities do not seek enrollment in their schools and could not be served effectively if they did so.

Special Education and the Milwaukee Parental Choice Program
February 2012 7
While these were our general findings regarding how MPCP schools deal with the issue of special education, some specific quotes from our interviews help to make the approach more concrete. A high school principal (High School Site 6) who estimated that 8-9 percent of the school’s MPCP students would qualify as special education students said:
Initially we tried mainstreaming them but it did not work and we started our modified tracking system. We call it College Readiness Continuum and any student who is 1-2 years behind in math or reading we try to catch them up. Right now it is only a 1-hour-a-day program. The goal of the program is to have them prepared for college.
One of the MPCP elementary schools we visited had a student population that was 18-20 percent students with special needs, according to the principal (Elementary Site 7). As she characterized it, “We have the range of abilities a school can have, from gifted and talented to a Down’s Syndrome child and everything in between.” The school has a full-time staff person to help struggling students, called a Learning Support Specialist. The Learning Support Specialist described why she enjoys her work:
…Because of the incredible freedom that I have to meet the needs of the children as I see best, in collaboration with the teachers and the parents. I can really build a program to meet the needs. And my program changes every year. … And that is magnificent... I don’t have external parameters dictating what I have to do.
One would rarely find such flexibility in a special education program in the public sector given the “external parameters” that govern special education in public schools (Wolf and Hassel 2001). It is not surprising that some parents would choose the more flexible private-sector environment for the education of their special needs child.
The MPCP schools we visited regularly emphasized that they resist labeling students with special needs. As one teacher put it, “There’s not a test and there’s not a form” (Elementary Site 7). She proceeded to describe in detail how students with cognitive challenges in her class are fully integrated into the educational experience and also receive special assistance, with the example of a field trip:
The students with strong cognitive abilities remember a lot of details and communicate that in their essays.…They are participating in the assignment and they are doing the utmost that they can do that matches their ability. [Children with cognitive impairments] will have trouble even remembering…it was just a vague memory. Then the children, as a social exercise -- this is a reading and science assignment but it is also a social assignment -- are asked to help the other students with gentleness [and partner up with the struggling students to remind them of what happened] and then they can start to write.…Maybe their spelling is very intuitive and phonetic but that’s where they are. If they are matching letters to sounds that make sense then they are making progress.…Then we can talk about the spelling rules and they can correct or a peer can help them to correct and then they have a reason to take pride in their work and

Special Education and the Milwaukee Parental Choice Program
February 20128
they work real hard and they don’t get an F or a D. Then there is the artistic part. If a student doesn’t do so well on the cognitive side they can excel on the artistic side.
Finally, the MPCP school we visited that exclusively serves students with disabilities (Elementary Site 5) merits some consideration. It is one of two such schools we know of in the MPCP. It has 9 full-time employees and currently enrolls 55 students in grades 1-8, all suffering from emotional disturbance. Most of the students enrolled in the school participate in the MPCP. The annual cost per pupil at the school is about $12,000. Since the MPCP voucher provides a maximum of $6,442/year per student, even if they have a disability, the school has to rely on charitable donations to fill the gap.
The primary educational strategy of the school is to “accept kids where they are”. School personnel, including a full-time social worker, try to place the focus on what students can do, rather than what they struggle at doing. The school has a program in which students meet with a full-time art therapist for about an hour per week and engage in unstructured “art therapy”. The activity is used as an opportunity for informal counseling, as the art therapist said that students often reveal important information in the one-on-one setting. The teachers use this information to understand what troubles the students may be having at home that might be affecting their academics.
The school leadership defines student success as growth in the academic, emotional, and spiritual realms. The school has a sectarian religious affiliation and many of its students are referred there from other similarly affiliated religious schools in the area. School personnel say that they de-emphasize traditional measures of student success such as test scores. Their theory of action is that if they address the emotional and behavioral problems of the students first, academic progress will then follow. They also try various ways to get parents involved, such as traditional parent-teacher conferences and home meetings.
Our qualitative research on the MPCP provides additional insight into special education in the nation’s oldest and largest urban school voucher program. The Choice schools we visited all served students with disabilities, most commonly those in the mild-to-moderate range of severity. The principals repeatedly said that it is difficult for them to specify how many special education students they have in their schools because they resist labeling the children.
Quantitative Estimates of the Student Disability rate in the MPCPIf we wanted to compare the percentage of MPCP students in special education with the percentage of MPS students in special education, ideally we would insist that the private schools in the Choice program classify and handle students with disabilities in exactly the same way that public schools do. If that were the case, we would be confident that student disabilities are being recognized and measured similarly in the two sectors and therefore direct cross-sector comparisons of disability rates would be valid. It is neither possible nor arguably desirable to require that private schools measure and manage special education in the same way that public schools do. Private schools participating in voucher programs are subject to different laws and follow different norms and practices than public schools. Special education is “special” in the private sector, and we have been advised that some parents specifically choose to place their special needs child in a private school for that very reason.

Special Education and the Milwaukee Parental Choice Program
February 2012 9
Under these circumstances, how are we to know or at least estimate what proportion of students in the MPCP have special educational needs? First of all, there is little sense in using the term “special education” for such a comparison, because the phrase has very different meanings in the public and private school sectors. What we can do is ask school administrators and parents whether a child has a disability, particularly one that affects their learning, since the term “disability” and the phrase “disability that affects learning” have a more consistent meaning across school sectors than does the phrase “special education”. That is what we did in surveys of private school administrators and MPCP and MPS parents. Three different ways to analyze the data lead us to estimate that the proportion of MPCP students with disabilities that likely would qualify them for special education services if they were in MPS is between 7.5 and 14.6 percent.
Exceptional Education Rates in the MPCP According to a Rigorous Statistical Analysis
First, we consider what the administrative data regarding the disability classifications of students in our study say about whether a child’s school sector affects the likelihood that he or she will be formally classified as a special education student. To do so we apply a statistical methodology called individual level fixed-effects analysis to the students in our five-year longitudinal study.
The 2005 Wisconsin Act 125 directed our research organization to conduct a longitudinal evaluation of the MPCP starting in 2006 and report our results annually. We selected a random sample of all MPCP students in grades 3-8, plus the entire population of MPCP 9th graders, and carefully matched them to MPS students in the same grades and neighborhoods, with similar test scores and other important characteristics (Witte et al. 2008). In 2007 and 2008, we added additional MPCP and MPS third grade students to the sample using the same matching strategy. In total, our samples have 3,669 students in MPCP and the same number in MPS. This approach provided us with two panels of students, one representative of all students attending the MPCP (at least in the specified grades) and a very similar group attending MPS. We then tracked these two panels of students over five years, from 2006-07 through 2010-11, to produce reports about the test score achievement and educational attainment of the Choice students compared to their public school peers (Witte et al. 2009; 2010b; 2011; 2012; Cowen et al. 2011; 2012).
To help track the students in our study panels, every year from 2006 through 2010 we sent an enrollment verification form to each MPCP school. The form listed the students in our study who we confirmed were attending that specific private school in the previous year and asked the school staff to indicate if the student still was enrolled and, if not, where they were (if known). The form also asked the school staff to: “Indicate whether each student has a physical or learning disability” (Appendix A). Thus we have administrative data from the private schools in the MPCP regarding the disability status of the 3,669 students in our MPCP panel. Annually we also received the accountability testing file from MPS which included information on the special education status of the 3,669 students in our MPS panel as well as any of our MPCP panelists who had subsequently switched to MPS.
We readily acknowledge that our measures of student disability are not identical across the private and public sectors. Our private school measure is whether or not the student has a disability, in the opinion of private school administrators. Our public school measure is the official MPS indicator for whether or not a child

Special Education and the Milwaukee Parental Choice Program
February 201210
is in special education. In the public sector, having a disability is likely closely aligned with being in special education. The diagnosis of a disability results in the special education classification. That is how the public sector is required and expected to accommodate students with disabilities. Having a disability is likely poorly aligned with any formal classification of special education in the private sector because many private schools do not make special education classifications and do not have formal special education programs. The statistical comparisons we make below are of private school classifications of student disability compared with public school classifications of special education status.1 When we say “disability classification” we mean administrator opinion in the case of MPCP and formal special education designation in the case of MPS. The fact that they are likely two different things is, in a sense, the whole point of this exercise.
Through the course of our five-year study, 1,475 of the 7,338 students in our MPCP and MPS study panels (20.1%) switched school sectors, in some cases multiple times. A total of 1,045 students originally in our MPCP panel subsequently switched to MPS and remained there. An additional 104 students originally in our MPS panel switched to MPCP and stayed there. Ninety-six students in our MPCP panel switched to MPS and back again, while 57 students in our MPS panel switched to MPCP and then returned to MPS.2
The students in our longitudinal study who switched sectors provide us with a unique opportunity to determine the extent to which private schools in the Choice program recognize student disabilities at different rates than MPS. This is informative because these sector-switchers had the opportunity to be classified as having a disability in the public sector, the private sector, both, or neither. In research parlance, the students are observed in both the private school and public school conditions, and we know from administrative records if their disability status changed or stayed the same when their school sector changed.
Individual level fixed-effects analysis is the ideal methodology for analyzing these data. The fixed effects in the statistical regression model control for the unique characteristics of each student while determining whether general factors, such as the student’s school sector, influences student disability classifications over time. The method systematically compares the disability classifications of students in MPCP to the disability classifications of themselves when they are observed in MPS, and vice-versa. Each student is his or her own control group.
Before we get to the statistical regression results, we can get a hint of what the data will tell us by simply examining a cross-tabulation of the disability classification rates for the sector-switchers in our study. Table 1 provides us with initial evidence that Milwaukee students have a greater likelihood of being classified as having a disability in MPS compared to MPCP. If disability classification practices were identical across the two sectors, all of the student observations would appear in the upper left quadrant of the results table (YES/YES)
1 Because we seek to determine the rate at which students are affirmatively classified as having a disability, we treat missing data for any student in any year as equivalent to a 0 for the variable “classified as having a disability.” Although imputing zeroes for missing data is inappropriate when determining such things as student proficiency rates and test scores (Jacob and Wolf 2012), it makes sense in this case because we are interested in differences in disability classification practices and rates across the school sectors. Not answering the disability question, as administrators did during nearly 16 percent of the student-years in our analysis, is literally not classifying the student as having a disability.
2 The remaining 173 sector switchers had more complicated switching patterns and/or incomplete data.

Special Education and the Milwaukee Parental Choice Program
February 2012 11
or the lower right quadrant (NO/NO). In other words, every student classified as having a disability in one sector would be similarly classified in the other sector and every student classified as not having a disability in one sector would be similarly classified in the other sector.
Table 1: Disability Status for Sector Switchers Observed in Each Sector, 2006-2010
Disability in MPS?YES No Total
Disability in MPCP?
YES33 35 68
(2.2) (2.4) (4.6)
NO161 1,246 1,407
(10.9) (84.5) (95.4)
Total194 1,281 1,475
(13.2) (86.9) (100.0)
Note: Numbers in parentheses are cell percentages based on the total sample of 1,475. Student counted as “yes” if classified as having a disability in any year in that sector.
Sources: MPCP enrollment verification lists 2006-2010; DPI MPCP accountability testing database 2010; MPS accountability testing files 2006-2010.
Although most observations do fall along what researchers call the “primary diagonal” from upper left to lower right, enough observations deviate from that pattern to indicate that disability classifications are not consistent across sectors. A total of 2.4 percent of the sector-switchers in our study were assigned a disability classification when in MPCP but not while in MPS. This small proportion is dwarfed by the 10.9 percent of our sector-switchers who were not given a disability classification when in MPCP but were so classified when in MPS. Overall, of the sector switchers in our study, 4.6 percent of them were ever classified in MPCP as having a disability while 13.2 percent of them received such a classification when in MPS. These descriptive statistics suggest that the same students are almost three times more likely to be classified as having a disability when in MPS than when in MPCP.
Are these differential rates of disability classification solely a function of unclassified special needs students “washing out” of MPCP and reverting to MPS? By examining the differential rates of disability classification among different groups of sector-switchers we see that is not the case (Table 2). The overwhelming majority of sector-switchers (80%) went from MPCP to MPS. That group was classified with disabilities at a rate of 4.4 percent when in MPCP but 12.7 percent when in MPS. Students in our study who switched from MPS to MPCP, on the other hand, were classified with disabilities at a rate of 10.6 percent in MPS but at a rate of 0.0 percent in MPCP. In other words, students who started in MPS and then entered the MPCP shed their official disability label if they had one, and 10.6 percent of them did. Students who started in MPCP, switched to MPS, then switched back to MPCP were classified with disabilities at approximately similar rates of 9.4 percent when they were in MPCP and 8.3 percent when they were in MPS. Note that this group of students was welcomed back into MPCP, after leaving it, even though nearly 10 percent of the students had disabilities. Finally, students who started in MPS, switched to MPCP, and then returned to MPS were classified with disabilities at

Special Education and the Milwaukee Parental Choice Program
February 201212
a rate of 15.8 percent while in MPS but at a rate of 0.0 percent while in MPCP. Remember, these are the same students observed in both sectors.
Table 2: Disability Status for Sector Switchers By Switching Pattern
Item MPCP to MPS MPS to MPCP MPCP to MPS to MPCP
MPS to MPCP to MPS
Disability in MPCP 4.4% 0.0% 9.4% 0.0%
Disability in MPS 12.7% 10.6% 8.3% 15.8%
Total Number of Switchers (N) 1,045 104 96 57
Sources: MPCP enrollment verification lists 2006-2010; DPI MPCP accountability testing database 2010; MPS accountability testing files 2006-2010
Finally, to further test the extent to which a student’s disability designation is influenced by the sector in which they are enrolled we estimate a statistical model with individual level fixed-effects that estimates each student’s likelihood of being given a disability classification across the five years in which they appear in our data. The variable of interest in the model is an indicator for whether or not the student was in MPS during a particular year. By using individual students as their own comparison group, this analytic method tells us if disability classification rates vary systematically depending upon school sector, and by how much, controlling for everything that is unique about each student. Our simplest model only includes the indicator variable for school sector while a second model simultaneously controls for other general characteristics of the data that can affect classifications such as year and student grade level.3
The results of the fixed-effects analysis are presented in Table 3. In our simplest model the effect of a given student being in MPS is to increase their likelihood of being classified with a disability by 12.4 percentage points, from 4.1 percent if in MPCP to 16.5 percent if in MPS. Our second model controls for certain general trends in the data. The disability classifications of the students tend to increase in frequency across the years of our study. However, controlling for that trend, designations tend to decrease somewhat once the student is in high school.
Because our Model 2 controls for variables that never take the value 0, such as year and grade, the interpretation of the regression coefficients is not as straightforward as for Model 1. Once the effects of year and grade are controlled for, and the proper calculations are made using the “predict” command in STATA, the effect of being in MPS on the likelihood of a student being classified with a disability is an increase of 5.5 percentage points, from 9.1 percent to 14.6 percent, a difference that is both large and statistically significant beyond the 99 percent confidence level. If we suspect that the MPS classification rate is correct and the MPCP rate is biased
3 We estimate these models as linear probability models to facilitate ease of interpretation, though the results are similar if the models are run as logit or probit estimations. Disability designation is the dependent indicator variable (1=YES; 0=NO). We estimate the model over the five years of our study for each student in our sample.

Special Education and the Milwaukee Parental Choice Program
February 2012 13
to the low side, which we do, then students in the MPCP who ever were educated in MPS have special educational needs due to disabilities at the rate of 14.6 percent.
Disability Rate in MPCP for All Students Using Best Classification Available
The 14.6 percent disability rate among MPCP students generated by our statistical analysis only applies to the students in our study who switched sectors. Although sector-switchers comprised 20 percent of our total sample of MPCP and MPS students, they represented 35 percent of the students who started off in our MPCP panel, since MPCP students switch sectors at a higher rate than MPS students (Cowen et al. 2010). MPCP sector-switchers probably have a higher rate of disability than MPCP non-sector-switchers. Therefore, readers must understand that the 14.6 percent disability rate is only definitely valid for the subgroup of Choice students who switch between the private and public sectors. For an estimate of the student disability classification rate across the entire MPCP, including students who never attend a public school, we need to look elsewhere.
Our administrative data on MPCP student disability classifications is helpful here. Although the evidence above indicates that MPCP administrators under-classify students with disabilities compared to their MPS counterparts, the enrollment verification form information from MPCP schools is the best administrative data we have on the disability status of the 65 percent of MPCP students in our study who never attended MPS. If we average the MPCP disability classification rate of 3.75 percent for MPCP non-switchers with the MPS disability classification rate of 14.6 percent for MPCP switchers, we get an estimate of the overall disability rate in MPCP of 7.5 percent.
Table 3: Predicting Disability Designations in Milwaukee
VARIABLESModel 1
Beta CoefficientModel 2
Beta Coefficient
In MPS 0.124***(0.006)
0.061***(0.008)
2007 0.018*** (0.006)
2008 0.026** (0.012)
2009 0.047***(0.017)
2010 0.066***(0.023)
Grade 4 0.008(0.007)
Grade 5 -0.000(0.013)
Grade 6 -0.013(0.019)
Grade 7 -0.023(0.024)
Grade 8 -0.033(0.030)
Grade 9 -0.054(0.036)
Grade 10 -0.061(0.042)
Grade 11 -0.084*(0.047)
Grade 12 -0.096*(0.525)
Constant 0.041***(0.002)
0.086***(0.015)
N 7,338 7,332F-Stat 398.99*** 10.77***
Notes: *** p < .01, ** p < .05, * p < .10. Beta coefficients are linear probability estimates of being classified as having a disability or being in special education. Student fixed-effects included. Standard errors clustered by student are in parentheses.
Sources: MPCP enrollment verification lists 2006-2010; DPI MPCP accountability testing database 2010; MPS accountability testing files 2006-2010.
Special Education and the Milwaukee Parental Choice Program
February 201214
We think that this 7.5 percent rate for the MPCP might under-estimate the actual disability rate across MPCP, because MPCP school personnel appear to under-classify students with disabilities. Therefore, we think the best estimate of the student disability rate in MPCP lays in the range between the lower bound of 7.5 percent established from our administrative data and the upper bound of 14.6 percent established by our statistical analysis.
Disability Rates in the MPCP According to Our SCDP Parent Survey
Fortunately we have additional data that we can use to estimate the disability rate in MPCP. This third source of information on student disabilities comes from parent surveys implemented as part of our longitudinal study.
In the springs of 2007, 2008, and 2009 we surveyed parents in both our MPCP and MPS matched panels by telephone. In that survey, we asked parents three questions about their child’s special educational needs:
• “Does [the child] have any physical disabilities?” (yes/no)
• “Does [the child] have any learning disabilities?” (yes/no)
• If a parent answered yes to the learning disabilities question, we further asked: “How well do the facilities at [the child’s] school attend to his/her particular needs?” (very well, adequately, poorly, other/refused/don’t know)
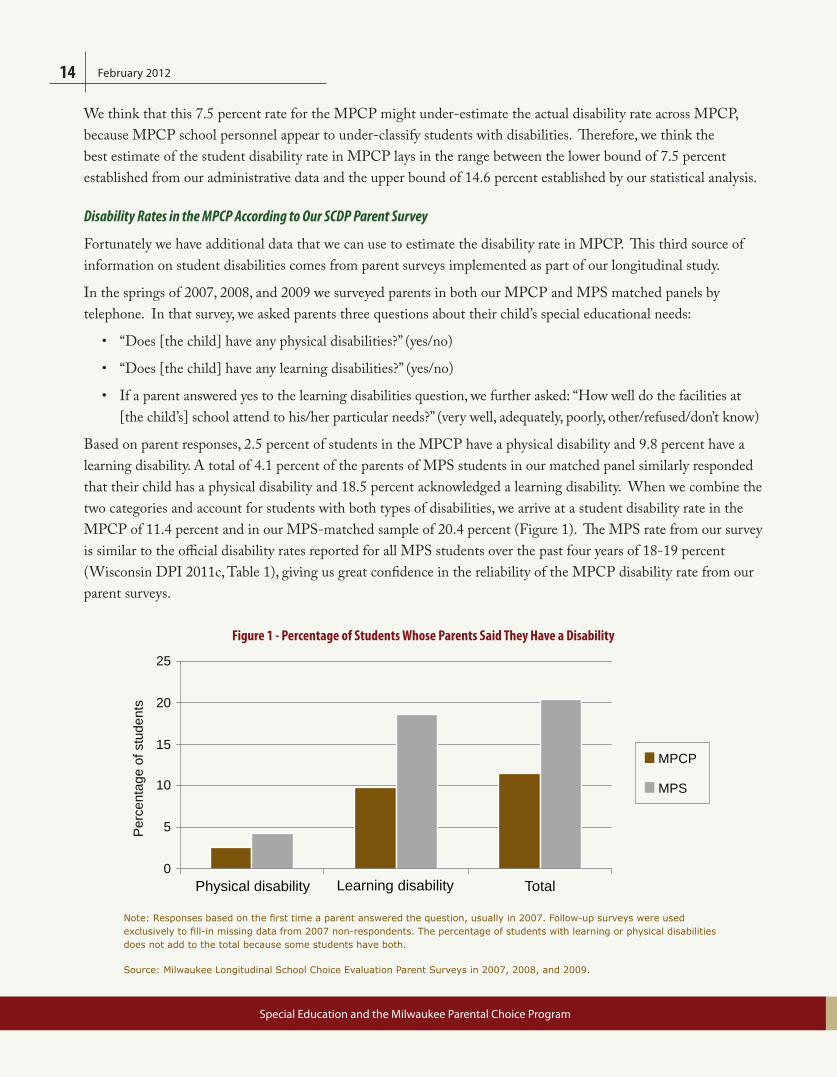
Based on parent responses, 2.5 percent of students in the MPCP have a physical disability and 9.8 percent have a learning disability. A total of 4.1 percent of the parents of MPS students in our matched panel similarly responded that their child has a physical disability and 18.5 percent acknowledged a learning disability. When we combine the two categories and account for students with both types of disabilities, we arrive at a student disability rate in the MPCP of 11.4 percent and in our MPS-matched sample of 20.4 percent (Figure 1). The MPS rate from our survey is similar to the official disability rates reported for all MPS students over the past four years of 18-19 percent (Wisconsin DPI 2011c, Table 1), giving us great confidence in the reliability of the MPCP disability rate from our parent surveys.
Figure 1 - Percentage of Students Whose Parents Said They Have a Disability
MPCP
MPS
0
5
10
15
20
25
Physical disability
Per
cent
age
of s
tude
nts
Learning disability Total
Note: Responses based on the first time a parent answered the question, usually in 2007. Follow-up surveys were used exclusively to fill-in missing data from 2007 non-respondents. The percentage of students with learning or physical disabilities does not add to the total because some students have both.
Source: Milwaukee Longitudinal School Choice Evaluation Parent Surveys in 2007, 2008, and 2009.

Special Education and the Milwaukee Parental Choice Program
February 2012 15
We think this comparison of the student disability rates in MPCP and MPS is reliable because parental standards regarding whether or not a child has a disability are likely similar regardless of whether the child is in private or public schools. Our survey evidence indicates that the MPCP student disability rate is more than half of the MPS rate, and is almost exactly in the middle of the range of 7.5 to 14.6 percent established by our analysis of administrative data.
Figure 2 - Parental Responses Regarding How Well the School Addresses the Child’s LearningDisability
MPCP
MPS
0
10
20
40
30
50
60
Very well
Per
cent
age
of p
aren
ts
Adequately Poorly Other
Note: Responses based on the first time a parent answered the question, usually in 2007. Follow-up surveys were used exclusively to fill-in missing data from 2007 non-respondents.
Source: Milwaukee Longitudinal School Choice Evaluation Parent Surveys in 2007, 2008, and 2009.
Parents of students with learning disabilities further report similar levels of satisfaction with the educational services provided to their child whether the student was in MPCP or MPS (Figure 2). For both groups, approximately half the parents said the school did “very well” at serving their child’s special needs, about 30 percent of parents in both groups said the school served their child “adequately” and about 19 percent said “poorly.” These survey findings might seem surprising, since few students in MPCP schools receive extra government funding for services when they have a disability. Still, according to the parents in our survey, nearly 10 percent of the students in the MPCP have a learning disability and parents tend to be as satisfied with the educational services that those students are receiving in the private sector as are parents of students with learning disabilities in the public sector. Moreover, a legal memo pertaining to the civil rights case (Wisconsin DPI 2011b, p. 4) states:
…DPI is required to accept due process complaints and state complaints related to the equitable services provisions of IDEA. DPI has not received any due process or state complaints related to the participation of children with disabilities in the MPCP.

Special Education and the Milwaukee Parental Choice Program
February 201216
In the 21 years that the Wisconsin Department of Public Instruction has administered the Milwaukee Parental Choice Program, it has not received a single formal complaint regarding the Choice program’s treatment of students with disabilities.
The Disability Rate in MPCP According to DPI
The 2010-11 school year was the first one for which private schools in MPCP were required to test all of their voucher students in grades 3-8 and 10 using the state government test, the Wisconsin Knowledge and Concepts Exam (WKCE). In a press release (DPI 2011a, p. 2) the Wisconsin DPI stated that “the private schools reported about 1.6 percent of choice students have a disability”. The press release then contrasted that figure with the MPS special education rate of 19 percent.
This DPI claim that 1.6 percent (or “less than 2 percent”) of MPCP test-takers had disabilities was presented in several news reports as evidence that the MPCP serves very few students with disabilities (e.g., Richards 2011; Hetzner and Richards 2011; Miner 2011). The release of the figure also led disability rights groups to file a lawsuit against the MPCP and DPI, claiming that the MPCP program and schools discriminate against students with disabilities.
How did DPI arrive at their 1.6 percent disability rate in MPCP? They did not ask MPCP administrators to indicate which students have disabilities, as we were able to do, because they lack legal authority to do so. DPI provided the following response to a question from the petitioners in the civil rights lawsuit (Wisconsin DPI 2011b, p. 4):
9. Please describe whether and how DPI tracks data regarding application, enrollment, retention, outreach, disenrollment, transfer, and suspension or expulsion, of children with disabilities in MPCP schools.
[DPI response:] Private schools are only required to provide to the department the information set forth on the MPCP Student Application. Wisconsin Stat. § 119.23, the statute governing the MPCP, neither authorizes DPI to request nor requires schools participating in the MPCP to provide the other data to which question 9 refers. Therefore it is not collected.
The MPCP Student Application does not include a question regarding student disability, since it is illegal for MPCP schools to discriminate against students in admission based on disability. DPI had neither the authority nor the means to collect such data from MPCP administrators.
If DPI’s disability rate is not based on classifications by MPCP administrators, on what is it based? Beginning in the fall of 2010, DPI did have legal authority to receive copies of the state test that the MPCP schools administered to their voucher students in certain grades. It is only from those test forms that DPI received any information about MPCP students with disabilities. The only disability measure on the test forms was an indicator of whether or not a student was provided a test accommodation due to a disability, not whether or not the student had a disability (Appendix B; Wolf 2012).

Special Education and the Milwaukee Parental Choice Program
February 2012 17
Students with disabilities are not automatically provided testing accommodations, especially in the private sector, which is not bound by most federal disability laws. In fact, the training instructions for administering the WKCE state clearly that students only should be provided with testing accommodations if specified in their Individualized Education Program (IEP). Since few private schools develop or maintain IEPs for their students with disabilities, few MPCP students with disabilities could be provided with testing accommodations. This is a clear example of how the coding and classification system regarding students with disabilities and the WKCE was aligned to the procedures and practices of the public school system and in direct opposition to the procedures and practices common to the private schools participating in the MPCP.
Our MPCP administrative data from the past five years indicates that MPCP officials flagged 5.6 percent of 2010 WKCE test-takers as having a disability but only 1.6 percent of test-takers (less than a third) were actually given any testing accommodations. Since most MPCP students with disabilities were not provided with testing accommodations, the testing accommodation question that DPI used to measure the disability rate in MPCP clearly is negatively biased, by a lot.
The error in reporting a flawed measure of disability in the MPCP was magnified by the fact that DPI then compared that rate to the special education rate in MPS and characterized the comparison as “apples-to-apples” (Wisconsin DPI, 2011c, p.1). Since the MPS data with which the MPCP rate was compared were collected using very different procedures, sources, and standards than DPI used to arrive at the MPCP rate, we strongly advise readers to instead focus upon our more reliable estimates of the disability rate in MPCP which are much more comparable to the official special education rate reported for MPS.
DiscussionThe wealth of quantitative and qualitative evidence from our state-mandated longitudinal study indicates that the student disability rate in the MPCP likely is between 7.5 and 14.6 percent, with perhaps our best estimate based on parent responses that 11.4 percent of MPCP students have disabilities. The MPCP appears to attract and enroll fewer students with special educational needs than does MPS, where the official student special education rate is 19 percent and around 20 percent of the parents of students in our matched MPS sample say their child has a disability. Still, the difference in disability enrollment rates across the two sectors appears to be dramatically smaller than previously supposed.
Eleven percent is significantly lower than 20 percent. If 11 percent is a reliable estimate of the percentage of students in MPCP with disabilities, why is it 9 percentage points lower than the rate in MPS which is also based on parent reports? The MPCP is likely to be less appealing of an option than the public school system for many parents of students with disabilities. As discussed throughout this report, the MPCP voucher is limited to $6,442/year, less than half the per-pupil expenditure in MPS, regardless of whether or not a student has a disability. Prior to the fall of 2011, MPCP could not require any participating families to supplement the voucher amount. Thus, MPCP schools have little choice but to deliver a highly efficient educational program.
As we discussed in the section regarding our school visits, every MPCP school we visited said that they provide special support for struggling students, but most of them lack the full complement of educational programs that students with disabilities are entitled to if they receive their education in the public sector. Eleven percent of

Special Education and the Milwaukee Parental Choice Program
February 201218
MPCP parents acknowledge that their child has a disability and have chosen to have the student’s educational needs addressed in a private school, through participation in the MPCP. Twenty percent of MPS parents in our comparison sample similarly acknowledge that their child has a disability and have decided to use the very different public school system of special education supports to serve the student’s needs. Given the greater resources and legal entitlements available to students with disabilities in the public sector compared to the private sector, we would have been shocked if our data had suggested that the disability rates in the two sectors are similar. They are not, in all likelihood simply due to the different educational choices that parents have made and the different incentives that surround those choices.
If policy makers remain concerned that only 7.5-14.6 percent of the students in the MPCP have disabilities, one option for increasing that percentage would be to add a “special needs” voucher program to the school choices available to parents. Over 30,000 students bearing special educational needs participate in one of the nine school voucher or tax-credit scholarship programs in the U.S. limited exclusively to students with disabilities. Special needs voucher programs bring with them two advantages over the MPCP for parents of students with disabilities. First, the maximum value of the voucher is on a sliding scale based on the severity of the student’s disability, so high-needs students can bring more resources to the private schools to address those needs. Second, special needs vouchers reduce some of the monetary disincentive that private schools face to avoid classifying students as having a disability. We take no position on the desirability of special-needs vouchers here except to point out that they are an option for increasing access to private schools for students with disabilities.
Our findings have implications for how we think about, talk about, and analyze student disabilities and special education in the context of a school choice program like the MPCP. The MPCP does enroll a lower percentage of students with special educational needs than does the MPS. The MPCP does, however, enroll a much higher percentage of special education students than is commonly reported -- 7.5-14.6 percent instead of less than 2 percent. Comparisons between the rates of officially diagnosed special education students in the MPCP and MPS are not really reliable simply because student disability is perceived, measured, and handled differently in the two education sectors.
Importantly, because student disability is measured very differently in MPCP compared to MPS, comparisons between the performance of MPCP and MPS students should never separate out or “control for” special education status in modeling achievement gains or comparing achievement levels. Any attempt to control for special education in comparing student performance in MPCP to that in MPS is likely to generate a severe bias against the MPCP schools because it only controls for the underperformance of students formally designated as special education students. Most if not all of the students with special educational needs in MPS have that formal designation, so their educational struggles are thereby removed from the equation. But most MPCP students with special educational needs are not formally designated as special education or even of having a disability, so their educational struggles remain in the equation and pull down the average overall performance level of students in the MPCP.
The only perfect way to correct that bias would be to force the private schools in the MPCP to classify special needs students in exactly the same way as MPS, something that neither the schools nor the parents they serve would likely support. The next best approach is to control for student baseline test-scores in any MPCP-MPS

Special Education and the Milwaukee Parental Choice Program
February 2012 19
comparisons of student performance, as we do in our longitudinal evaluation (Witte et al. 2012), with the expectation that much of the disadvantage that a special education student faces in learning is already reflected in their prior test scores, an expectation that has been confirmed by research (National Research Council, 1997). A final alternative is to compare student performance between the MPCP and MPS straight up, as we do in our Annual School Testing Summary Report ( Jacob and Wolf 2012), discarding the illusion that we can effectively know and control for exactly which students are and are not special education students in the two sectors, because we know that we cannot. Although our two studies of comparative MPCP achievement growth and achievement levels have limitations that we openly acknowledge in the reports, they do not suffer from the severe bias that comes from comparisons “controlling for” special education because they do not employ a control variable that is measured dramatically differently in the two sectors.
Just like the children with special needs (either classified or not) served by schools in Milwaukee, special needs classifications need to be handled with care. Through our longitudinal study we can estimate reliably that at least 7.5 percent and perhaps as many as 14.6 percent of the students in the Milwaukee Parental Choice Program have the kinds of exceptional educational needs that would qualify them for the special education label and legal entitlements if they were in Milwaukee Public Schools. We have also learned that many private schools handle students with disabilities very differently from public schools, generally by fully including challenged students in the regular educational program of the school with modest personal or programmatic supports. When parents and school officials think that such an approach is not effectively serving the needs of the child, then the student might transfer to MPS where there is a much greater likelihood that he or she will be officially labeled as a special education student.
Many people are making choices in the educational environment of Milwaukee. For some parents and educators, those choices involve eschewing the formal special education label for students with disabilities. The sooner everyone accepts this important reality the sooner we can focus more effectively on unbiased evaluations and reasoned discussions of educational interventions such as parental school choice.

Special Education and the Milwaukee Parental Choice Program
February 201220
Cowen, Joshua M., David J. Fleming, John F. Witte, and Patrick J. Wolf. 2010. School and Sector Switching in Milwaukee, Milwaukee Evaluation Report #16, School Choice Demonstration Project, University of Arkansas, Fayetteville, AR, http://www.uark.edu/ua/der/SCDP/Milwaukee_Eval/Report_16.pdf
Cowen, Joshua M., David J. Fleming, John F. Witte, and Patrick J. Wolf. 2011. School Vouchers and Student Attainment: Initial Results from an Evaluation of the Milwaukee Parental Choice Program, Milwaukee Evaluation Report #24, School Choice Demonstration Project, University of Arkansas, Fayetteville, AR, http://www.uark.edu/ua/der/SCDP/Milwaukee_Eval/Report_24.pdf
Cowen, Joshua M., David J. Fleming, John F. Witte, Patrick J. Wolf, and Brian Kisida. 2012. Student Attainment and the Milwaukee Parental Choice Program: Final Follow-up Analysis, Milwaukee Evaluation Report #30, School Choice Demonstration Project, University of Arkansas, Fayetteville, AR, http://www.uaedreform.org/SCDP/Milwaukee_Eval/Report_30.pdf
Finn, Chester E. Jr., Andrew J. Rotherham, and Charles R. Hokanson. 2001. “Conclusions and Principles for Reform,” in Chester E. Finn, Jr., Andrew J. Rotherham, and Charles R. Hokanson (eds.), Rethinking Special Education for a New Century (Washington, DC: Progressive Policy Institute & Thomas B. Fordham Foundation).
Glenn, Malcom, and Michelle Gininger. 2012. School Choice Now: The Year of School Choice, School Choice Yearbook 2011-12, Washington, DC: Alliance for School Choice, http://www.allianceforschoolchoice.org/yearbook
Hetzner, Amy, and Erin Richards. 2011. “Test Results Spark Debate Over Best Way to Measure Achievement,” Milwaukee Journal-Sentinel, April 7.
Horn, Wade F., and Douglas Tynan. 2001. “Time to Make Special Education ‘Special’ Again,” in Chester E. Finn, Jr., Andrew J. Rotherham, and Charles R. Hokanson (eds.), Rethinking Special Education for a New Century (Washington, DC: Progressive Policy Institute & Thomas B. Fordham Foundation).
McCroarty, Daniel. 2001. “The Little-Known Case of America’s Largest School Choice Program,” in Chester E. Finn, Jr., Andrew J. Rotherham, and Charles R. Hokanson (eds.), Rethinking Special Education for a New Century (Washington, DC: Progressive Policy Institute & Thomas B. Fordham Foundation).
Miner, Barbara. 2011. “Take a Stand Against School Vouchers,” Milwaukee Journal-Sentinel, November 19.
National Research Council. 1997. Educating One and All: Students with Disabilities and Standards-Based Reform (Washington, D.C.).
Palmaffy, Tyce. 2001. “The Evolution of the Federal Role,” in Chester E. Finn, Jr., Andrew J. Rotherham, and Charles R. Hokanson (eds.), Rethinking Special Education for a New Century (Washington, DC: Progressive Policy Institute & Thomas B. Fordham Foundation).
Peterson, Paul E., and Elena Llaudet. 2006. “On the Public-Private School Achievement Debate,” Paper prepared for the annual meetings of the American Political Science Association, Philadelphia, PA, August.
Richards, Erin. 2011. “Voucher Testing Data Takes a New Twist,” Milwaukee Journal-Sentinel, March 30.
Stewart, Thomas, Anna M. Jacob and Laura I. Jensen. 2012. School Site Visits: What Can We Learn From Choice Schools in Milwaukee? Milwaukee Evaluation Report #34, School Choice Demonstration Project, University of Arkansas, Fayetteville, AR, http://www.uaedreform.org/SCDP/Milwaukee_Eval/Report_34.pdf
References

Special Education and the Milwaukee Parental Choice Program
February 2012 21
Turque, Bill. 2012. “D.C. Charter School Under Scrutiny for Lack of Special-Ed Students,” Washington Post, February 2.
Wisconsin Department of Public Instruction, 2011a. “Overall MPS Results Higher Than Choice Schools on Statewide Exams,” News Release DPI-NR 2011-30 B, March 29.
Wisconsin Department of Public Instruction. 2011b. “Responses of State Superintendent Tony Evers and the Wisconsin Department of Public Instruction to U.S. DOJ Civil Rights Division Letter of August 17, 2011.”
Wisconsin Department of Public Instruction. 2011c. “Analysis of MPCP Data and Implications for Program Expansion,” memo submitted by State Superintendent Tony Evers to the Joint Committee on Finance, May 23.
Witte, John F., Patrick J. Wolf, Joshua M. Cowen, David J. Fleming, and Juanita Lucas-McLean. 2008. MPCP Longitudinal Educational Growth Study Baseline Report, Milwaukee Evaluation Report #5, School Choice Demonstration Project, University of Arkansas, Fayetteville, AR, http://www.uaedreform.org/SCDP/Milwaukee_Eval/Report_5.pdf
Witte, John F., Patrick J. Wolf, Joshua M. Cowen, David J. Fleming, and Juanita Lucas-McLean. 2009. MPCP Longitudinal Educational Growth Study Second Year Report, Milwaukee Evaluation Report #10, School Choice Demonstration Project, University of Arkansas, Fayetteville, AR, http://www.uark.edu/ua/der/SCDP/Milwaukee_Eval/Report_10.pdf
Witte, John F., Joshua M. Cowen, David J. Fleming, Patrick J. Wolf, Meghan R. Condon, and Juanita Lucas-McLean. 2010b. The MPCP Longitudinal Educational Growth Study Third Year Report, Milwaukee Evaluation Report #15, School Choice Demonstration Project, University of Arkansas, Fayetteville, AR, http://www.uark.edu/ua/der/SCDP/Milwaukee_Eval/Report_15.pdf
Witte, John F., Deven Carlson, Joshua M. Cowen, David J. Fleming, and Patrick J. Wolf. 2011. The MPCP Longitudinal Educational Growth Study Fourth Year Report, Milwaukee Evaluation Report #23, School Choice Demonstration Project, University of Arkansas, Fayetteville, AR, http://www.uark.edu/ua/der/SCDP/Milwaukee_Eval/Report_23.pdf
Witte, John F., Deven Carlson, Joshua M. Cowen, David J. Fleming, and Patrick J. Wolf. 2012. The MPCP Longitudinal Educational Growth Study Final Year Report, Milwaukee Evaluation Report #29, School Choice Demonstration Project, University of Arkansas, Fayetteville, AR, http://www.uark.edu/ua/der/SCDP/Milwaukee_Eval/Report_29.pdf
Witte, John F., Patrick J. Wolf, Alicia Dean, and Deven Carlson. 2010a. Milwaukee Independent Charter Schools Study: Report on One Year of Student Growth, Milwaukee Evaluation Report #21, School Choice Demonstration Project, University of Arkansas, Fayetteville, AR, http://www.uark.edu/ua/der/SCDP/Milwaukee_Eval/Report_21.pdf
Wolf, Patrick J. 2012. E-mail correspondence with Duane Dorn, Office of Educational Accountability, Wisconsin Department of Public Instruction, January 19 (available by request).
Wolf, Patrick J., and Bryan C. Hassel. 2001. “Effectiveness and Accountability (Part 1): The Compliance Model,” in Chester E. Finn, Jr., Andrew J. Rotherham, and Charles R. Hokanson (eds.), Rethinking Special Education for a New Century (Washington, DC: Progressive Policy Institute & Thomas B. Fordham Foundation).

Special Education and the Milwaukee Parental Choice Program
Appendix A:
Directions for Completing the Student Enrollment Verification FormEvaluation of the Milwaukee Parental Choice ProgramBefore completing the Student Enrollment Verification Form, please review these instructions and column explanations. If you have any questions email us.
RETURN THIS COMPLETED FORM IN THEENCLOSED PRE-PAID ENVELOPE –OR- BY FAX
BY OCTOBER 14, 2010.
For each MPCP panel student:
1. Confirm if he/she is CURRENTLY ENROLLED at your school for the 2010-11 school year.2. Update any information that has changed.3. Fill in any missing information.
Column Explanations:
§Enrollment – if a student is no longer enrolled at your school, please indicate why in the “Reason Left School” column. If the reason is not specified on the form or if you do not know why a student left the school, check the “Other” box and write in the actual reason or “DK” (I don’t know) on the blank line. If you know the new school name, write it in the “New School Name” column. If you do not know the name of the new school, write “DK.”
§Race – check all that apply
§ELL (English Language Learners) – All ELL students are required to test. However, students who have been in the U.S. for less than 12 months are only required to take the math portion.
§Disabilities – Indicate whether each student has a physical or learning disability. If he/she has a disability that makes it impossible for him/her to take the test, mark “no” in the “Able to Test” column. If a student does not have a disability or has a disability that does not hinder him/her from testing, indicate “yes” in the “Able to Test” column. For students with disabilities who are able to test, list any accommodations that must be met during testing. Check all that apply. If you do not see the proper accommodation, check the “Other box” and write it in on the blank line.
22

Special Education and the Milwaukee Parental Choice Program
Appendix B -- WKCE Test Forms Pertaining to Student Disability
Below are the only portions of the WKCE student test score reports that pertain to special educational needs. Although the second form contains a “Student Performance Level Survey,” that section is limited only to students judged by IEP teams (which most private schools lack) to require the alternative test to the WKCE. The first form simply describes any testing accommodations provided to a student with a disability. Nowhere in the WKCE student report are school officials asked if a student has a disability or participates in special education.
23
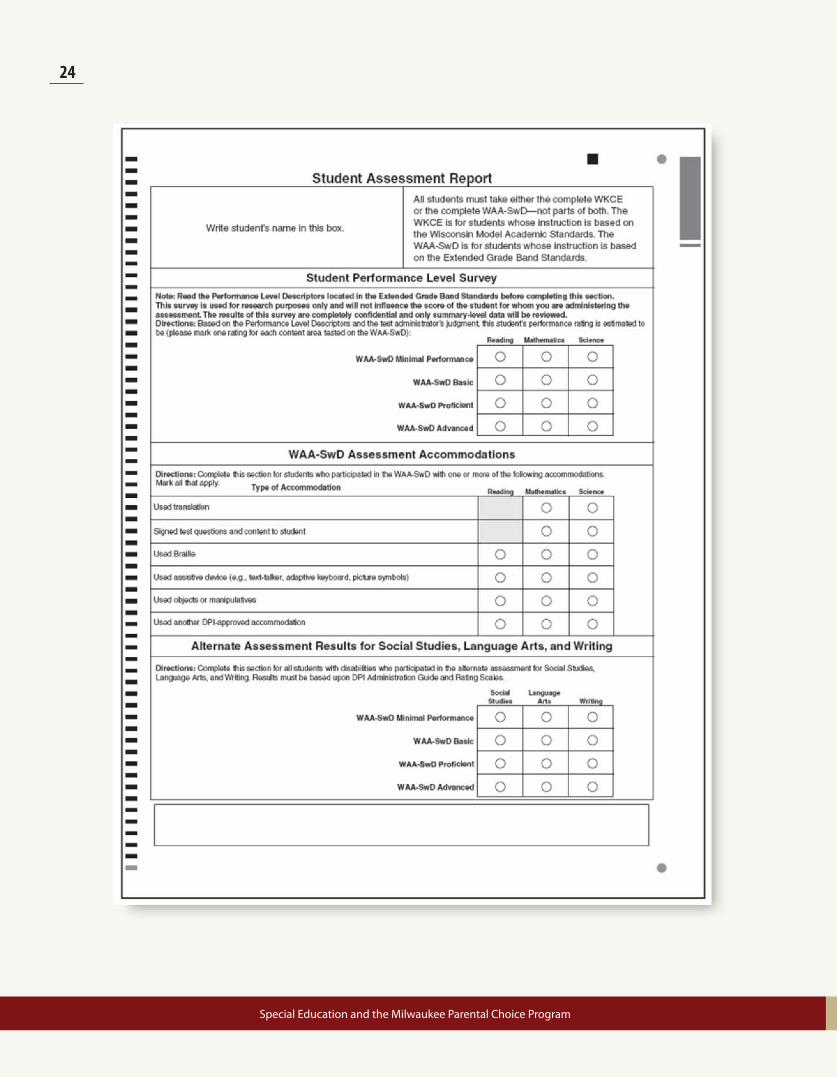
Special Education and the Milwaukee Parental Choice Program
24

Special Education and the Milwaukee Parental Choice Program
Special Education and the Milwaukee Parental Choice Program
About the Authors
Patrick J. Wolf is Professor of Education Reform and 21st Century Endowed Chair in School Choice at the University of Arkansas in Fayetteville. He also is principal investigator of the School Choice Demonstration Project. Wolf has authored, co-authored, or co-edited three books and more than 30 articles and book chapters on school choice, special education, and public management. A 1987 summa cum laude graduate of the University of St. Thomas (St. Paul, MN), he received his Ph.D. in Political Science from Harvard University in 1995.
John F. Witte is a Professor in the Department of Political Science and the Robert M. La Follette School of Public Affairs at the University of Wisconsin - Madison. He received his Ph.D. in political science from Yale University. He has been a fellow at the Russell Sage Foundation and at the Center for Advanced Study in the Behavioral Sciences. His latest book from Princeton University Press is The Market Approach to Education: An Analysis of America’s First Voucher Program.
David J. Fleming is an Assistant Professor of Political Science at Furman University. He received his B.A. from the University of Notre Dame in 2003 and his Ph.D. from the University of Wisconsin-Madison in 2009. He was a fellow in the interdisciplinary training program in education sciences at the University of Wisconsin. His current research project examines how education policies affect parents’ political and social engagement. He teaches classes in American politics, research methods, and public policy.

School Choice Demonstration ProjectDepartment of Education Reform
University of Arkansas201 Graduate Education Building
Fayetteville, AR 72701479-575-6345
http://www.uark.edu/ua/der/SCDP/Research.html