Special Committee on Intermodal Transportation and Economic Expansion Workshop October 23, 2009...
19
Special Committee on Special Committee on Intermodal Transportation and Intermodal Transportation and Economic Expansion Workshop Economic Expansion Workshop October 23, 2009 October 23, 2009 Patrick E. Quinn Patrick E. Quinn Co-Chairman & President Co-Chairman & President U.S. Xpress Enterprises U.S. Xpress Enterprises
-
Upload
virgil-chambers -
Category
Documents
-
view
213 -
download
0
Transcript of Special Committee on Intermodal Transportation and Economic Expansion Workshop October 23, 2009...

Special Committee on Special Committee on Intermodal Transportation and Intermodal Transportation and Economic Expansion WorkshopEconomic Expansion Workshop
October 23, 2009October 23, 2009
Patrick E. QuinnPatrick E. QuinnCo-Chairman & PresidentCo-Chairman & PresidentU.S. Xpress EnterprisesU.S. Xpress Enterprises

Industry FactsIndustry Facts
• Represents roughly 5% of the nation’s gross domestic product (GDP)
• $660 billion industry, hauling 10.2 billion tons of freight annually
•8.9 million people throughout the economy employed in trucking jobs
• 3.5 million truck drivers, including local & over-the-road

Industry FactsIndustry Facts
• Operates 2.0 million truck-tractors and 7.0 million total heavy duty commercial trucks
• Class 8 trucks log 139 billion miles annually
•Consumes 39 billion gallons of diesel annually
• Exclusively serves over 80% of communities in the U.S.

Truck 68.8%
Pipeline9.9%
Rail Intermodal
1.1%Air
0.1%
Water6.3%
Rail Carload13.8%
Distribution of Tonnage by Mode: Distribution of Tonnage by Mode: 2008 vs 20202008 vs 2020
Source: U.S. Freight Transportation Forecast to…2020
Truck 70.9%
Pipeline8.5%
Rail Intermodal
1.5%Air
0.1%
Water5.7%
Rail Carload13.3%
2008 2020

Sources: Department of Labor and ATA
1,000
1,100
1,200
1,300
1,400
1,500
1990 1992 1994 1996 1998 2000 2002 2004 2006 2008
U.S. For-Hire Trucking U.S. For-Hire Trucking EmploymentEmployment Through September 2009
Thousands
Lowest level since 1995

Sources: S&P/Case-Shiller National Index and ATA
50
75
100
125
150
175
200
1987 1989 1991 1993 1995 1997 1999 2001 2003 2005 2007 2009
Housing Price Index Housing Price Index
Average Annual Growth Rate: 4.4%
1987-1999
Ave
rage
Ann
ual G
rowth
Rat
e: 1
5.0%
2000
- 20
05
Average Annual Growth Rate: -9.4%2006 – 2009:Q2

Sources: Federal Reserve Board and ATA
90.0
95.0
100.0
105.0
110.0
115.0
1998 2000 2002 2004 2006 2008
U.S. Manufacturing ProductionU.S. Manufacturing Production Through August 2009; 2000 = 100
6.7% drop peak-to-trough
17.3% drop peak-to-trough

Sources: Department of Commerce and ATA
1.2
1.3
1.4
1.5
1.6
1992 1994 1996 1998 2000 2002 2004 2006 2008
Total Business Inventories-to-Total Business Inventories-to-Sales RatioSales Ratio
(Includes retail, wholesale, and manufacturing; Through August 2009)
Significant progress has been made to clear out bloated inventories.
Source: ATA
95
100
105
110
115
120
125
1999 2000 2001 2002 2003 2004 2005 2006 2007 2008 2009
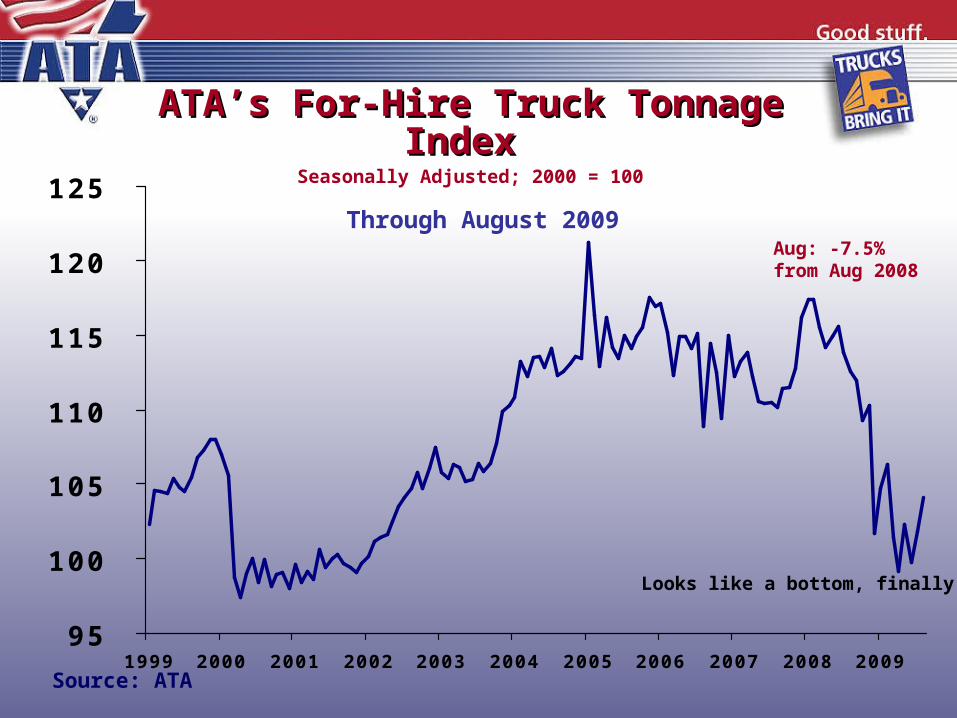
ATA’s For-Hire Truck Tonnage ATA’s For-Hire Truck Tonnage Index Index
Seasonally Adjusted; 2000 = 100
Through August 2009Aug: -7.5% from Aug 2008
Looks like a bottom, finally.

Source: ATA
80
90
100
110
120
130
140
150
2001 2002 2003 2004 2005 2006 2007 2008 2009
ATA’s For-Hire Truck Revenue ATA’s For-Hire Truck Revenue Index Index
2000=100; Through August 2009
Aug: -24.9% from Aug 2008

Source: Avondale Partners, LLC
200
400
600
800
1,000
1,200
1,400
Q1
00
Q1
01
Q1
02
Q1
03
Q1
04
Q1
05
Q1
06
Q1
07
Q1
08
Q1
09
Trucking FailuresTrucking Failures
Failures only includes fleets Failures only includes fleets with at least five truckswith at least five trucks
Failures are surprisingly low, but truck counts are more important than the number of carriers that fail.

Source: ATA’s Trucking Activity Report
-10%-9%-8%-7%-6%-5%-4%-3%-2%-1%0%1%
Last 9 Quarters Year Earlier
Fleets Continue to Downsize
! This slide shows the change in the fleet size for those TL carriers that are surviving. It is not total industry capacity, which has fallen significantly more.
Cumulative Decrease Aug 2009 vs Aug 2008

Source: Wards
0
5,000
10,000
15,000
20,000
25,000
30,000
2005 2006 2007 2008 2009
U.S. Class 8 Truck SalesU.S. Class 8 Truck Sales
No Pre-buy Here
Monthly Retail Sales; Through August 2009
Truck sales are running well below
historical replacement rates.

Source: Energy Information Administration
$0.90
$1.40
$1.90
$2.40
$2.90
$3.40
$3.90
$4.40
$4.90
J an-94 Jan-96 Jan-98 Jan-00 Jan-02 Jan-04 Jan-06 Jan-08
On-Highway Diesel PricesOn-Highway Diesel PricesPrice Per GallonPrice Per Gallon
Record: $4.76(07/14/08)
$2.58(10/5/09)

Top Industry Issues 2009Top Industry Issues 2009
1. Economy2. Government Regulation3. Fuel Issues4. Congestion/Highway Infrastructure5. Hours of Service6. Commercial Driver Issues7. Environmental Issues8. Tolls/Highway Funding9. Truck Size and Weight10.Onboard Truck Technology

Congestion/Highway InfrastructureCongestion/Highway Infrastructure
FHWA report on top highway bottlenecks
226 Million Hours Lost Annually Cost $19 Billion/year (ATRI) Physical bottlenecks account for 40% of congestion
ATA supports diesel tax increase provided funds dedicated to addressing bottlenecks

Tolls/Highway FundingTolls/Highway Funding
Fuel tax fairest, most efficient source of funding for highwaysOppose tolls on existing highways
High administrative costs Cause diversion to local roads
Oppose privatization of existing highwaysWould consider supporting shipper fees provided truck driver/carrier is not tax collector and no serious administrative/collection issues
Revenue should go to freight infrastructure projects proportionate to modal contribution

Truck Size and WeightTruck Size and Weight
Reforms can produce safety, energy & emissions, economic benefits
ATA supports a process under which states can petition the federal government for regulatory relief
Support state option – no mandates

Commission Freight RecommendationsCommission Freight Recommendations
Create and fund a national freight transportation program in conjunction with States and metropolitan areas and consistent with a National Freight Transportation Plan, that eliminates chokepoints and increases throughputFederal grants for meritorious projectsEstablish dedicated freight fund