SPECED Reform Presentation - March 2013
13
PHASE ONE DATA (2011-12) PRELIMINARY DATA FOR CITYWIDE EXPANSION 2012-13 1
-
Upload
gothamschoolsorg -
Category
Documents
-
view
214 -
download
0
Transcript of SPECED Reform Presentation - March 2013

7/29/2019 SPECED Reform Presentation - March 2013
http://slidepdf.com/reader/full/speced-reform-presentation-march-2013 1/13
PHASE ONE DATA(2011-12)
PRELIMINARY DATA FOR
CITYWIDE EXPANSION 2012-13
1
7/29/2019 SPECED Reform Presentation - March 2013
http://slidepdf.com/reader/full/speced-reform-presentation-march-2013 2/13
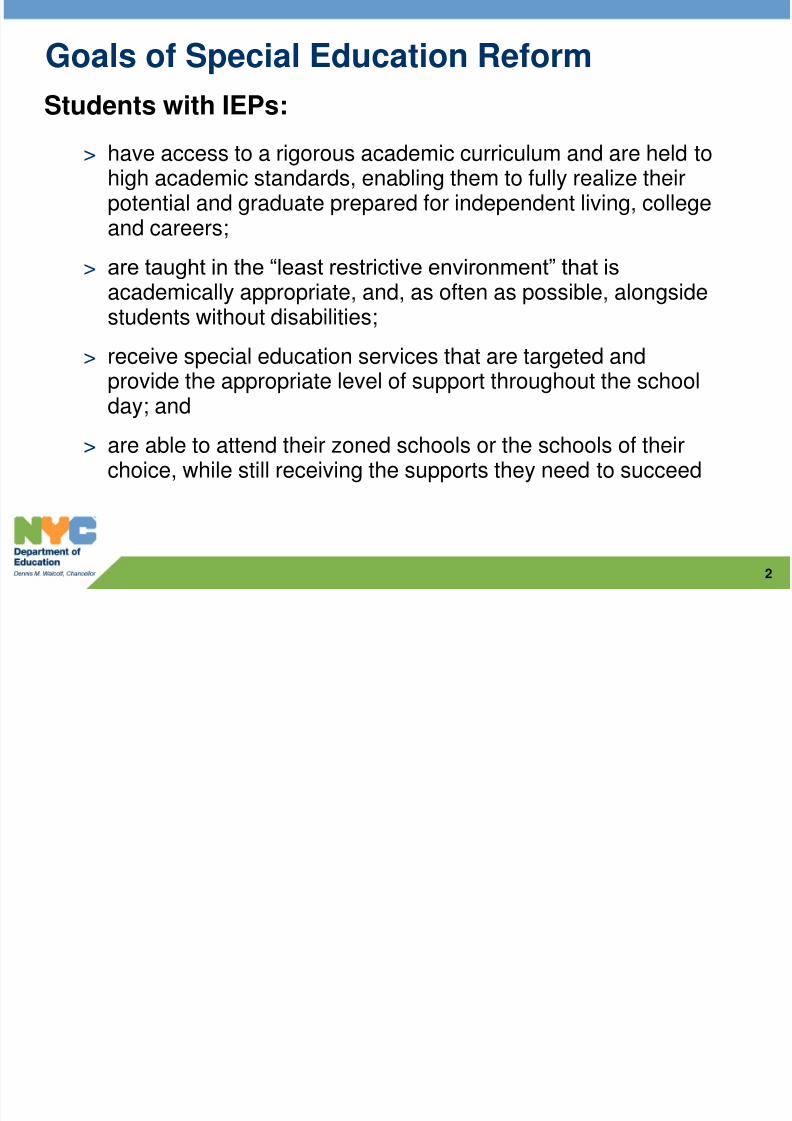
Goals of Special Education Reform
Students with IEPs:
> have access to a rigorous academic curriculum and are held tohigh academic standards, enabling them to fully realize theirpotential and graduate prepared for independent living, collegeand careers;
> are taught in the “least restrictive environment” that isacademically appropriate, and, as often as possible, alongsidestudents without disabilities;
> receive special education services that are targeted andprovide the appropriate level of support throughout the school
day; and> are able to attend their zoned schools or the schools of their
choice, while still receiving the supports they need to succeed
2

7/29/2019 SPECED Reform Presentation - March 2013
http://slidepdf.com/reader/full/speced-reform-presentation-march-2013 3/13
Phase One of the Reform in NYC
> Who was included in Phase One of the Reform?Phase 1 Schools had diverse student populations
• 260 total schools; 100 Elementary Schools, 60 Middle Schools, 100 HighSchools
• Across all 5 boroughs
• Focus has been on articulating grades: kindergarten, 6th grade, and 9th grade
> How did we evaluate Phase One of the Reform?
• Since random assignment was not used to assign Phase 1 status, a
viable comparison group had to be developed to evaluate theperformance of Phase 1 schools
• Key indicators in Phase1 schools were compared to the same indicatorsin comparison group schools
3
Phase One of NYC’s special education reform occurred over SY 2010-11 to 2011-12.

7/29/2019 SPECED Reform Presentation - March 2013
http://slidepdf.com/reader/full/speced-reform-presentation-march-2013 4/13
4
IN THE FALL OF 2010, 260 SCHOOLS WERESELECTED TO PARTICIPATE IN PHASE 1
Student Demographics in Phase 1 Schools compared to Citywide Averages *
Phase 1 Citywide
•Demographic data are based on the Audited Register as of 10.31.2010.
Phase 1 schools serve higher proportions of Hispanic students, English Language Learners,and Students with Disabilities and nearly half of Phase 1 schools are located in the Bronx

7/29/2019 SPECED Reform Presentation - March 2013
http://slidepdf.com/reader/full/speced-reform-presentation-march-2013 5/13
Creation of a Comparison Group: Methodology
Identifying a Comparison Group
> Using a statistical procedure called Propensity Score Matching, wematched each Phase 1 school to a comparable school based on eachschool’s demographics, baseline achievement in New York State Math
and English assessments, and location in 2009-10 (the year beforePhase 1 began)
• Therefore, Phase 1schools and the comparison groups of schools do notdiffer in terms of borough, total enrollment, new school, status anddemographics including free/reduced lunch, ethnicity, % English LanguageLearners, % students with disabilities, and Math and ELA proficiency forstudents with disabilities
> Separate models were examined for schools with grades 3-8, grades 9-12, grades PK-2 only, and for new schools that opened in 2010-2011
> The result was an overall sample of 270 Comparison schools that wouldbe compared to the 260 Phase 1 schools for all subsequent analyses
5

7/29/2019 SPECED Reform Presentation - March 2013
http://slidepdf.com/reader/full/speced-reform-presentation-march-2013 6/13
Related Services OnlyN = 2,731 N = 2,736
SETSS*N = 5,171 N = 5,621
Integrated Co-TeachingN = 8,234 N = 8,673
Self-ContainedN = 6,764 N = 7,971
6
Least Restrictive Environment Placement Continuum
PERCENT OF STUDENTS WITH IEPs IN EACH PROGRAMSETTING IN PHASE 1 AND COMPARISON SCHOOLS
10.7
24.5
33.131.6
11.9
22.6
36.0
29.5
9.9
24.8
33.132.2
10.9
22.5
34.7
31.9
2011 2012
6
Phase 1
Comparison2011 2012
Phase 1 schools exhibited larger increases in Integrated Co-teaching and larger
decreases in Self-contained program settings relative to Comparison schools
Total Number of Students with IEPs in 2012 is 22,900 at Phase 1 Schools and 25,001 at Comparison Schools
Source: June CAP. All Ns reported are for 2012. * Special EducationTeacher Support Services
7/29/2019 SPECED Reform Presentation - March 2013
http://slidepdf.com/reader/full/speced-reform-presentation-march-2013 7/13
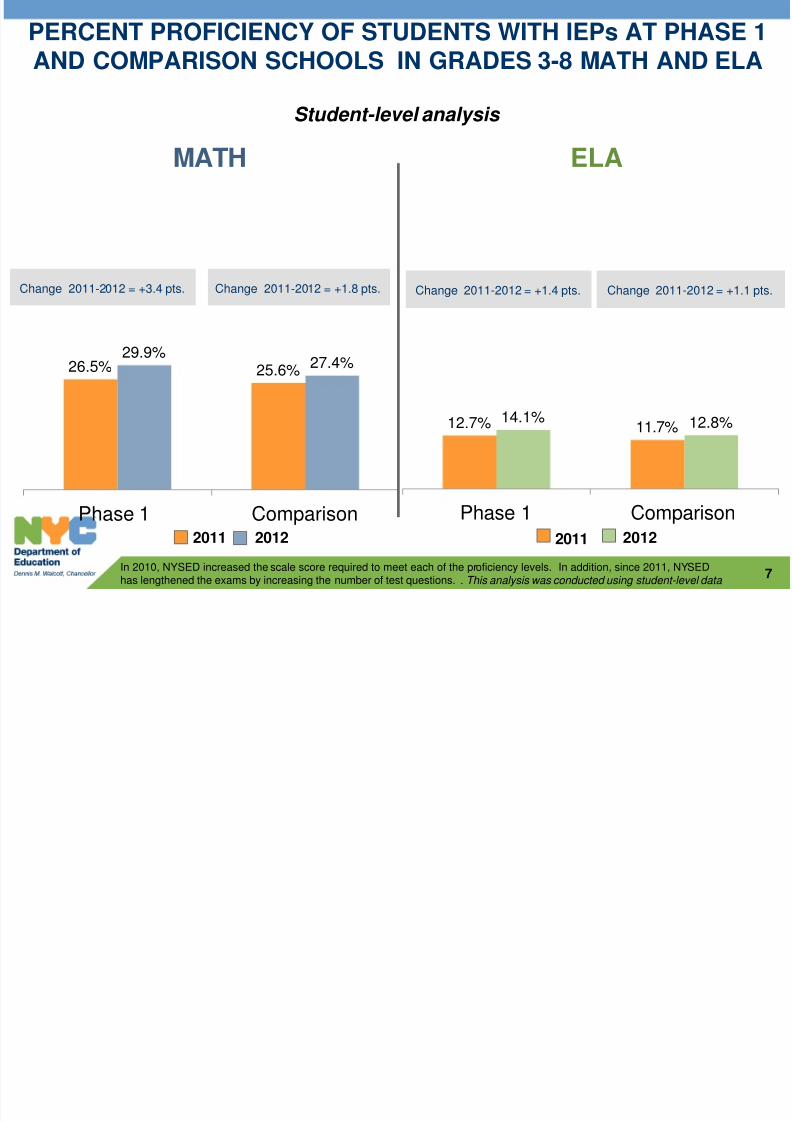
26.5% 25.6%29.9%
27.4%
Phase 1 Comparison
12.7% 11.7%14.1% 12.8%
Phase 1 Comparison
7
MATH ELA
Student-level analysis
In 2010, NYSED increased the scale score required to meet each of the proficiency levels. In addition, since 2011, NYSED
has lengthened the exams by increasing the number of test questions. . This analysis was conducted using student-level data
PERCENT PROFICIENCY OF STUDENTS WITH IEPs AT PHASE 1AND COMPARISON SCHOOLS IN GRADES 3-8 MATH AND ELA
2011 2012 2011 2012
Change 2011-2012 = +3.4 pts. Change 2011-2012 = +1.8 pts. Change 2011-2012 = +1.4 pts. Change 2011-2012 = +1.1 pts.

7/29/2019 SPECED Reform Presentation - March 2013
http://slidepdf.com/reader/full/speced-reform-presentation-march-2013 8/13
ATTENDANCE RATES ARE COMPARABLE AT PHASE 1AND COMPARISON SCHOOLS
87.7% 87.8%88.4% 88.7%
Phase 1 Comparison
8
2011 2012
Students with IEPs
Change 2011-2012 = +0.7 pts. Change 2011-2012 = +0.9 pts.

7/29/2019 SPECED Reform Presentation - March 2013
http://slidepdf.com/reader/full/speced-reform-presentation-march-2013 9/13
PERCENTAGE OF STUDENTS WITH IEPs WITH ONE OR MORESUSPENSIONS AT PHASE 1 AND COMPARISON SCHOOLS
8.5%9.3%
8.2%9.1%
9Data reflect the number of students who received at least one principal or superintendent suspension during that school year. Data does not include summersuspensions. Source for numerator: Suspension data from Office of Safety and Youth Development Source for denominator; June Register.
Phase 1 Comparison
2011 2012
Students with IEPs
Change 2011-2012 = -0.3 pts. Change 2011-2012 = -0.2 pts.

7/29/2019 SPECED Reform Presentation - March 2013
http://slidepdf.com/reader/full/speced-reform-presentation-march-2013 10/13
Citywide Expansion of the Reform
> Reform implemented citywide in September 2012 in all 1700+ NYCpublic schools
> Students in articulating grades are now able to attend the same
schools they would attend if they were not recommended for specialeducation services
> Except in rare circumstances, students with disabilities will no longerbe required to transfer schools because of changes to their IEPs
• Now all schools are expected to meet the needs of the majority of their
students with disabilities> Schools have been supported with an expanded framework of
professional development
10
Citywide expansion of NYC’s special education reform began In Fall 2012

7/29/2019 SPECED Reform Presentation - March 2013
http://slidepdf.com/reader/full/speced-reform-presentation-march-2013 11/13
As 5th graders w/ IEPS As 6th graders w/ IEPS
10% = 1,291 10% = 1,258
2% = 252 2% = 240
31% = 3,97828% = 3,593
27% = 3,512 31% = 4,039
22% = 2,803 18% = 2,378
8% = 1,071 11% = 1,399
Articulated SY13 6th Graders withIEPs n=12,907
11Source: ATS-CAP register data June, Sept., Oct., and Nov. 2012
Students with IEPs articulating into sixth grade this past fall moved to less restrictive environments
LRE
MRE
ENROLLMENT CHANGES FOR SIXTH GRADERS
When these 12,907 studentsmoved from 5th to 6th grade:
• ICT recommendations amongthese students increased by4 percentage points
• Self-containedrecommendations amongthese students decreased by3 percentage points
• Related services onlyrecommendations amongthese students increased by3 percentage points
June 2012 Nov. 2012
RELATED SERVICES ONLY
SETSS (Special Education TeacherSupport Services)
ICT (Integrated Co-Teaching)
SELF CONTAINED
DUAL RECOMMENDATION*
DISTRICT 75 PROGRAMS
• Students with “Dual Rec.”
are those recommendedfor more than one of theprograms listed above
7/29/2019 SPECED Reform Presentation - March 2013
http://slidepdf.com/reader/full/speced-reform-presentation-march-2013 12/13
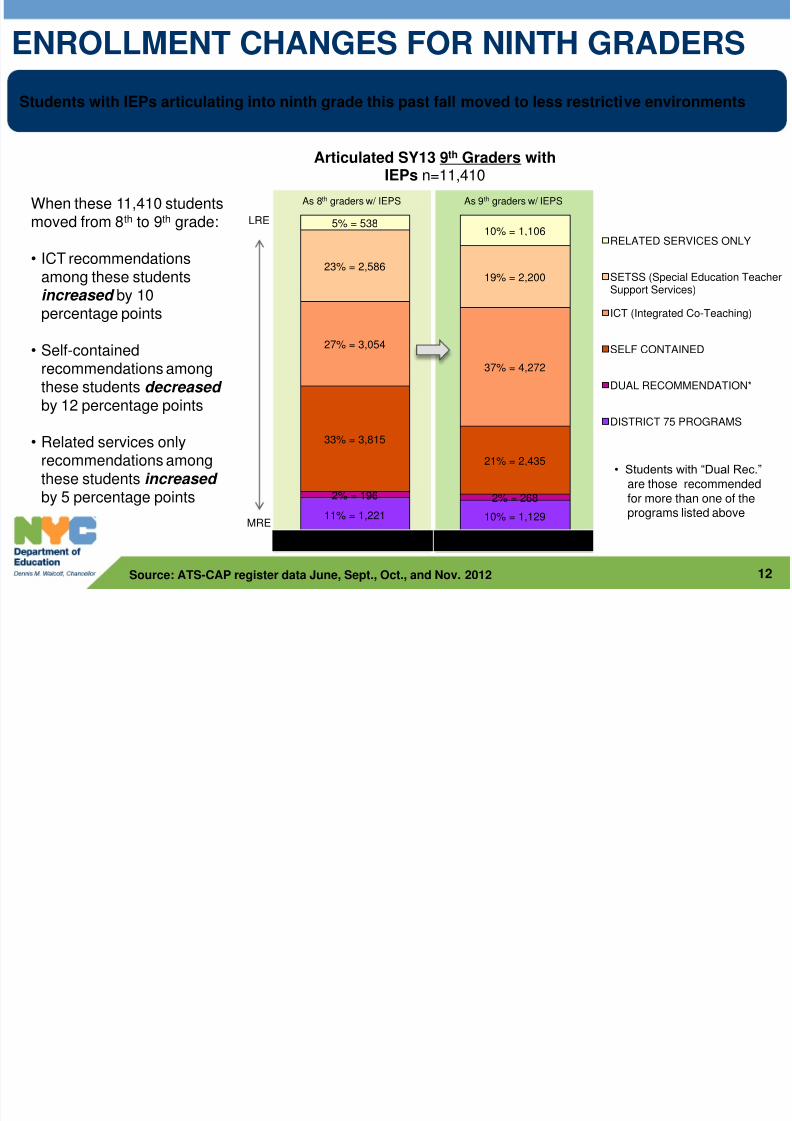
As 8th graders w/ IEPS As 9th graders w/ IEPS
11% = 1,221 10% = 1,129
2% = 196 2% = 268
33% = 3,815
21% = 2,435
27% = 3,054
37% = 4,272
23% = 2,586
19% = 2,200
5% = 53810% = 1,106
Articulated SY13 9th Graders withIEPs n=11,410
12Source: ATS-CAP register data June, Sept., Oct., and Nov. 2012
LRE
MRE
ENROLLMENT CHANGES FOR NINTH GRADERS
When these 11,410 studentsmoved from 8th to 9th grade:
• ICT recommendations
among these studentsincreased by 10percentage points
• Self-containedrecommendations amongthese students decreased by 12 percentage points
• Related services onlyrecommendations amongthese students increased by 5 percentage points
June 2012 Nov. 2012
RELATED SERVICES ONLY
SETSS (Special Education TeacherSupport Services)
ICT (Integrated Co-Teaching)
SELF CONTAINED
DUAL RECOMMENDATION*
DISTRICT 75 PROGRAMS
Students with IEPs articulating into ninth grade this past fall moved to less restrictive environments
• Students with “Dual Rec.”
are those recommendedfor more than one of theprograms listed above

7/29/2019 SPECED Reform Presentation - March 2013
http://slidepdf.com/reader/full/speced-reform-presentation-march-2013 13/13
Professional Development
> From September until now, we’ve given professional development to over
12,000 school-level staff (including paraprofessionals, general and specialeducators, and school leaders) through 970 workshops
> Workshop topics have included
• Specially Designed Instruction (e.g. ICT, SETSS)
• Developing IEPs aligned to the Common Core Standards
• Elementary and Secondary Literacy• Universal Design for Learning
• Accessible Instructional Materials
• Response to Intervention (RTI)
> We’ve developed partnerships with key organizations and educational
institutions, such as• Teachers’ College Inclusive Classrooms Project
• New York University
• Goldmansour and Rutherford
13