SPE 79716 - Numerical Simulation With Input Consistency Between Pc and Krel - Kewen Li STANFORD
9
Copyright 2003, Society of Petroleum Engineers Inc. This paper was prepared for presentation at the SPE Reservoir Simulation Symposium held in Houston, Texas, U.S.A., 3–5 February 2003. This paper was selected for presentation by an SPE Program Committee following review of information contained in an abstract submitted by the author(s). Contents of the paper, as presented, have not been reviewed by the Society of Petroleum Engineers and are subject to correction by the author(s). The material, as presented, does not necessarily reflect any position of the Society of Petroleum Engineers, its officers, or members. Papers presented at SPE meetings are subject to publication review by Editorial Committees of the Society of Petroleum Engineers. Electronic reproduction, distribution, or storage of any part of this paper for commercial purposes without the written consent of the Society of Petroleum Engineers is prohibited. Permission to reproduce in print is restricted to an abstract of not more than 300 words; illustrations may not be copied. The abstract must contain conspicuous acknowledgment of where and by whom the paper was presented. Write Librarian, SPE, P.O. Box 833836, Richardson, TX 75083-3836, U.S.A., fax 01-972-952-943 5. Abstract This study proposes a numerical simulation approach without direct specification of relative permeability functions. Using this approach, it is not necessary to impose relative permeability functions as input to the simulator in order to conduct the numerical simulations of two-phase fluid flow. Instead only capillary pressure data need to be imposed and the relative permeabilities can be calculated consistently using specific models. Example numerical simulations at both core and reservoir scales were conducted to test the technique without the direct input of relative permeability functions from experimental data. The results showed that the production performance calculating from the numerical simulations without the input of relative permeability functions was almost the same as the experimental data. Using the method proposed in this study, the effects of pore size distribution index and entry capillary pressure on oil recovery by gravity drainage were investigated at both core scale and reservoir scale. The technique may be especially suitable for reservoirs in which it is difficult to measure relative permeability curves. Such reservoirs include gas-condensate reservoirs, extremely low permeability reservoirs, and geothermal reservoirs. The proposed technique may also be useful to upscaling, n umerical simulation while drilling, and other areas. Introduction Reducing uncertainty 1-3 has been a challenge for the past decade or so in numerical simulation and reservoir engineering. One source of prediction uncertainty is that the input to numerical simulators is uncertain and inaccurate. For example, relative permeability data variation may introduce significant uncertainty. Pickup et al. 4 reported recently that variation in relative permeability due to small-scale heterogeneities, such as cross-bedding, could have a significant impact on reservoir performance. On the other hand, experimental data of relative permeability may also have significant error or uncertainty. McPhee and Arthur 5 reported a comparison study in which homogeneous core samples were provided to five different laboratories and specific procedures were specified. It was found that residual oil saturation could vary by 20% and there was a great difference between the highest and lowest end point water relative permeability values. If the laboratories applied their own standard analysis procedures, the discrepancies in residual oil saturation increased to about 34% and the discrepancies in relative permeability might be unacceptable. Due to the great uncertainty from experimental data, relative permeability is often a parameter set to tune or obtain by automatic history match. However, tuning the relative permeability parameters independently may result in curves that are unphysical and/or inconsistent with other flow properties. Uncertainty may be reduced if the number of input parameters is decreased, especially if the parameters with greatest uncertainty are avoided. This may be realized by imposing only capillary pressure data as input to numerical simulators. Relative permeability can be inferred because relative permeability and capillary pressure are correlated. There are many papers 6-18 in this field. Purcell 6 developed a method to calculate the permeability using pore size distribution derived from mercury-injection capillary pressure curves. This method established the relationship between permeability and capillary pressure. Later the relationship was extended to multiphase fluid flow in porous media and was used to calculate relative permeabilities, as reported by Gates and Leits 7 . After that, Burdine 8 introduced a tortuosity factor in the model. Corey 9 and Brooks and Corey 10 summarized the previous works 6-8 and modified the method by representing capillary pressure curve as a power law function of the wetting phase saturation. Honarpour et al . 11 reviewed the literature on the correlation between relative permeability and capillary pressure in drainage cases in this field. Land 12-13 established the relationship between relative permeability and capillary pressure in imbi bition cases. Papatzacos and Skjæveland 14 reported a theory for single- component, two-phase flow in porous media. The theory includes wettability and capillary pressure as integral parts of the thermodynamic description and does not make use of the relative permeability concept. However, by providing a capillary pressure correlation, it is possible to infer relative permeabilities . SPE 79716 Numerical Simulation with Input Consistency between Capillary Pressure and Relative Permeability Kewen Li, SPE, and Roland N. Horne, SPE, Stanford University
-
Upload
tsarphilip2010 -
Category
Documents
-
view
217 -
download
0
Transcript of SPE 79716 - Numerical Simulation With Input Consistency Between Pc and Krel - Kewen Li STANFORD
8/12/2019 SPE 79716 - Numerical Simulation With Input Consistency Between Pc and Krel - Kewen Li STANFORD
http://slidepdf.com/reader/full/spe-79716-numerical-simulation-with-input-consistency-between-pc-and-krel 1/9
Copyright 2003, Society of Petroleum Engineers Inc.
This paper was prepared for presentation at the SPE Reservoir Simulation Symposium held inHouston, Texas, U.S.A., 3–5 February 2003.
This paper was selected for presentation by an SPE Program Committee following review ofinformation contained in an abstract submitted by the author(s). Contents of the paper, aspresented, have not been reviewed by the Society of Petroleum Engineers and are subject tocorrection by the author(s). The material, as presented, does not necessarily reflect anyposition of the Society of Petroleum Engineers, its officers, or members. Papers presented atSPE meetings are subject to publication review by Editorial Committees of the Society ofPetroleum Engineers. Electronic reproduction, distribution, or storage of any part of this paper
for commercial purposes without the written consent of the Society of Petroleum Engineers isprohibited. Permission to reproduce in print is restricted to an abstract of not more than 300words; illustrations may not be copied. The abstract must contain conspicuousacknowledgment of where and by whom the paper was presented. Write Librarian, SPE, P.O.Box 833836, Richardson, TX 75083-3836, U.S.A., fax 01-972-952-9435.
AbstractThis study proposes a numerical simulation approach withoutdirect specification of relative permeability functions. Using
this approach, it is not necessary to impose relative
permeability functions as input to the simulator in order to
conduct the numerical simulations of two-phase fluid flow.Instead only capillary pressure data need to be imposed and
the relative permeabilities can be calculated consistently usingspecific models. Example numerical simulations at both core
and reservoir scales were conducted to test the techniquewithout the direct input of relative permeability functions from
experimental data. The results showed that the production performance calculating from the numerical simulations
without the input of relative permeability functions was almost
the same as the experimental data. Using the method proposedin this study, the effects of pore size distribution index and
entry capillary pressure on oil recovery by gravity drainage
were investigated at both core scale and reservoir scale. Thetechnique may be especially suitable for reservoirs in which it
is difficult to measure relative permeability curves. Such
reservoirs include gas-condensate reservoirs, extremely low permeability reservoirs, and geothermal reservoirs. The
proposed technique may also be useful to upscaling, numericalsimulation while drilling, and other areas.
IntroductionReducing uncertainty1-3 has been a challenge for the pastdecade or so in numerical simulation and reservoir
engineering. One source of prediction uncertainty is that the
input to numerical simulators is uncertain and inaccurate. For
example, relative permeability data variation may introducesignificant uncertainty. Pickup et al.4 reported recently that
variation in relative permeability due to small-scale
heterogeneities, such as cross-bedding, could have asignificant impact on reservoir performance. On the other
hand, experimental data of relative permeability may also havesignificant error or uncertainty. McPhee and Arthur 5 reported
a comparison study in which homogeneous core samples were
provided to five different laboratories and specific procedures
were specified. It was found that residual oil saturation could
vary by 20% and there was a great difference between thehighest and lowest end point water relative permeability
values. If the laboratories applied their own standard analysis procedures, the discrepancies in residual oil saturationincreased to about 34% and the discrepancies in relative
permeability might be unacceptable. Due to the grea
uncertainty from experimental data, relative permeability is
often a parameter set to tune or obtain by automatic historymatch. However, tuning the relative permeability parameters
independently may result in curves that are unphysical and/or
inconsistent with other flow properties.
Uncertainty may be reduced if the number of input parameters is decreased, especially if the parameters with
greatest uncertainty are avoided. This may be realized byimposing only capillary pressure data as input to numerica
simulators. Relative permeability can be inferred becauserelative permeability and capillary pressure are correlated
There are many papers6-18 in this field. Purcell6 developed amethod to calculate the permeability using pore size
distribution derived from mercury-injection capillary pressurecurves. This method established the relationship between
permeability and capillary pressure. Later the relationship wa
extended to multiphase fluid flow in porous media and was
used to calculate relative permeabilities, as reported by Gatesand Leits7. After that, Burdine8 introduced a tortuosity factor
in the model. Corey9 and Brooks and Corey10 summarized the
previous works6-8
and modified the method by representingcapillary pressure curve as a power law function of the wetting
phase saturation. Honarpour et al .11 reviewed the literature on
the correlation between relative permeability and capillary pressure in drainage cases in this field. Land12-13 establishedthe relationship between relative permeability and capillary
pressure in imbibition cases.
Papatzacos and Skjæveland14 reported a theory for single-component, two-phase flow in porous media. The theory
includes wettability and capillary pressure as integral parts o
the thermodynamic description and does not make use of the
relative permeability concept. However, by providing acapillary pressure correlation, it is possible to infer
relative permeabilities.
SPE 79716
Numerical Simulation with Input Consistency between Capillary Pressureand Relative PermeabilityKewen Li, SPE, and Roland N. Horne, SPE, Stanford University
8/12/2019 SPE 79716 - Numerical Simulation With Input Consistency Between Pc and Krel - Kewen Li STANFORD
http://slidepdf.com/reader/full/spe-79716-numerical-simulation-with-input-consistency-between-pc-and-krel 2/9
2 SPE 79716
Capillary pressure and relative permeability are important
input to numerical simulation. Even though it was found long
ago that both are correlated, the experimental data of capillary pressure and relative permeability are usually still imposed as
two separate inputs to numerical simulators.Recently we demonstrated that relative permeabilities in
many two-phase fluid flow systems could be calculated
satisfactorily using specific models once reliable capillary pressure data are available19. According to this finding, it maynot be necessary to impose relative permeability functions as
separate input to the simulator in order to conduct thenumerical simulations of two-phase fluid flow. Instead only
capillary pressure data need to be imposed and the relative
permeabilities can be calculated using the models that we
specified in a previous paper 19. There are many advantages todoing so. Measurements of relative permeabilities over the full
range of saturation are usually time-consuming, expensive,and inaccurate in many cases while the measurements of
capillary pressure curves are faster, cheaper, and more
accurate. Reservoir engineering computations may be more
efficient, more economical, more consistent, and more reliable by using the capillary pressure methods to obtain relative
permeabilities instead of using separate specification in thesimulator input.
On the other hand, the correlation between capillary
pressure and rock properties has been established
experimentally much better than that between relative permeability and rock properties. Unlike the common method
(tuning relative permeability curves), one can match production history by tuning capillary pressure curves with
physical significance based on the well-established correlation
between capillary pressure and rock properties ( J -function).
One more advantage is that uncertainty may be reduced because the number of input parameters is decreased.
In this study we conducted example numerical simulationsfor oil production by gravity drainage using the approach
proposed. The results demonstrated that the oil production
calculated by imposing only the capillary pressure data is
consistent with the experimental data. The relative permeabilities required for numerical simulation were
calculated from the capillary pressure data. We also showed
that the proposed numerical simulation approach would beuseful to conduct theoretical study or sensitivity analysis by
numerical simulation. For example, the effects of entry
capillary pressure and pore size distribution index on oilrecovery by gravity drainage were investigated at both core
and reservoir scales.
MathematicsIn a previous paper 19, we demonstrated that relative
permeability of two-phase fluid flow could be calculated
satisfactorily using reliable capillary pressure data in a seriesof specific cases. The Brooks and Corey model10 has been
accepted widely to calculate relative permeability using
capillary pressure data. However the Purcell model6 was found
to be the best fit to the experimental data of the wetting phase
relative permeability in many cases19. The differences between
the experimental and the Purcell model data for the wetting phase were almost negligible. We concluded in the previous
paper 19 that the wetting phase relative permeability could be
calculated using the Purcell model6 and the nonwetting phase
relative permeability could be calculated using the Brooks-
Corey model10
. According to this finding, the wetting phaserelative permeability can be calculated accurately using the
following equation:
λ
λ +
=
2
* )( wrw S k (1)
where k rw and *wS are the relative permeability and the
normalized saturation of the wetting phase; λ is the pore size
distribution index.
Eq. 1 was derived by substituting the following capillary
pressure model10 into the Purcell model6:
λ /1*)(
−= wec S p P (2)
where pe is the entry capillary pressure. The normalizedsaturation of the wetting phase in drainage cases is calculated
as follows:
wr
wr ww
S
S S S
−
−=
1
* (3)
where S w and S wr are the specific saturation and the residua
saturation of the wetting phase.For the nonwetting phase, relative permeability can be
calculated accurately using the Brooks-Corey model1
as follows:
])(1[)1(
2
*2* λ
λ +
−−= wwrnw S S k (4)
where k rnw is the relative permeability of the nonwetting phase
Eq. 4 was obtained by substituting Eq. 2 into theBurdine model8.
Li and Horne19 developed a physical model to explain the
reasons to calculate the relative permeability of the wetting
and the nonwetting phases in specific cases using Eqs. 1 and 4 Note that different relative permeability models may need to
use in different cases. An example is discussed as follows.
Gas-oil flow in rock with initial water saturation is a three phase system but may be considered as a special two-phase
fluid flow system in which the water phase is immobile
Assuming water is the strongly wetting phase, both oil and gasare nonwetting phases. In this case, the relative permeability
of the gas phase can be calculated using Eq. 4. However the
relative permeability of the oil phase may not be calculatedusing Eq. 1 because oil is also a nonwetting phase. This may
be different from the gas-oil two-phase flow without immobile
water in which the relative permeability of the oil phase may be calculated using Eq. 1. Based on the physical mode
developed by Li and Horne19, it may be necessary to consider
the effect of tortuosity on the oil phase relative permeability in

8/12/2019 SPE 79716 - Numerical Simulation With Input Consistency Between Pc and Krel - Kewen Li STANFORD
http://slidepdf.com/reader/full/spe-79716-numerical-simulation-with-input-consistency-between-pc-and-krel 3/9
SPE 79716 3
the case in which immobile water exists. Accordingly, it is
proposed to calculate the oil phase (nonwetting phase) relative
permeability in such a fluid-rock system using thefollowing equation:
λ
λ 32
*)(+
= oro S k (5)
where k ro and*
oS are the oil phase relative permeability and
the normalized oil saturation, which is defined in this case
as follows:
wior
or oo
S S
S S S
−−
−=
1
* (6)
where S o and S or are the specific saturation and the residualsaturation of the oil phase; S wi is the initial water saturation.
ResultsExample numerical simulations for oil production by gravity
drainage were conducted using the proposed approach. Onlycapillary pressure data were imposed as input to simulators.
Relative permeability data required for numerical simulations
were calculated from the capillary pressure data. The resultsare discussed in this section.
Comparison of simulation to experimental results. To
demonstrate the application of the numerical simulationapproach without specifying relative permeability functions
from experimental data, the oil production data by gravity
drainage from Pedrera et al .20
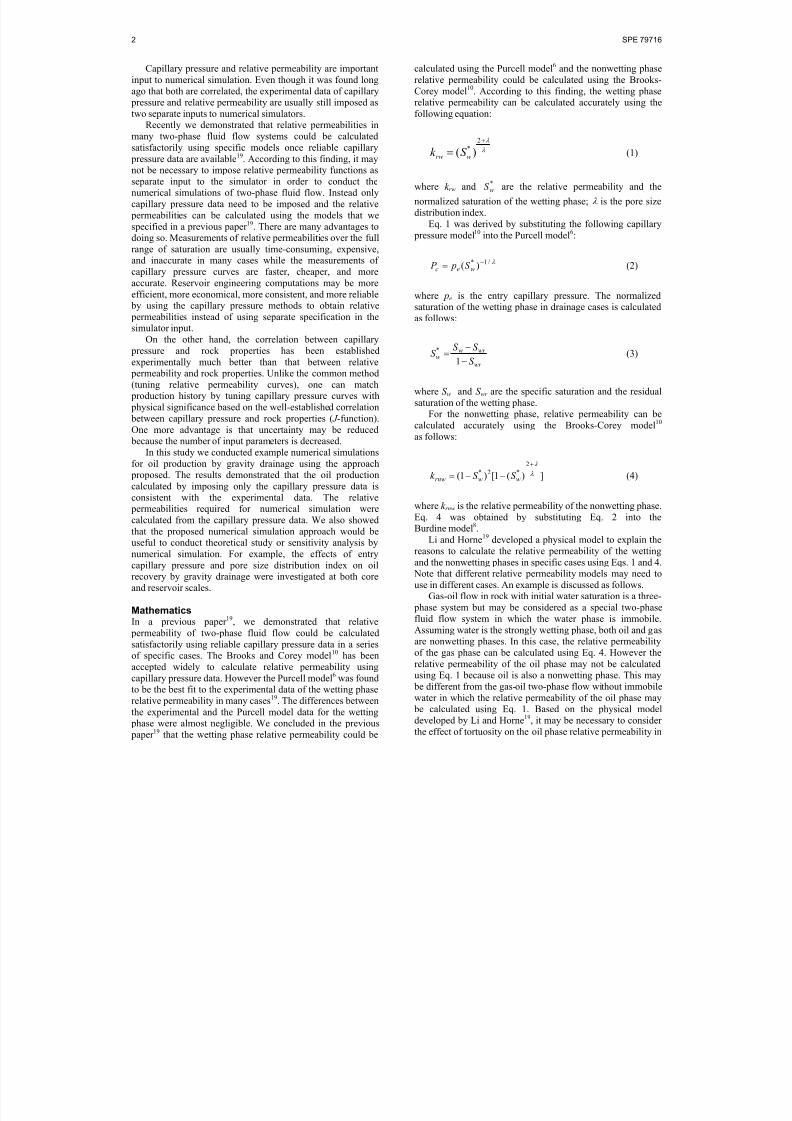
were used. Fig. 1 shows theexperimental data of oil recovery, in the units of oil originally
in place (OOIP), by gravity drainage in a core sample
positioned vertically. The 1m long core had a permeability of7000 md and a porosity of 41%. Pedrera et al .20 conducted
gravity drainage experiments in the gas-oil-water-rock
systems with different wettability. The water phase wasimmobile. The case studied in this paper was the strongly
water-wet system with a wettability index of 1.0 and an initial
water saturation of 21%.The capillary pressure data obtained from the
measurements of oil saturation versus the height in the core
are plotted in Fig. 2. In order to calculate relative permeability
using capillary pressure data, the Brooks-Corey model (Eq. 2)was used to fit the experimental data shown in Fig. 2. The
match between the model and the experimental data is fairly
good as shown in Fig. 2. The value of entry capillary pressure,
pem , obtained by fitting was 0.0259 at and λ was around 7.36.
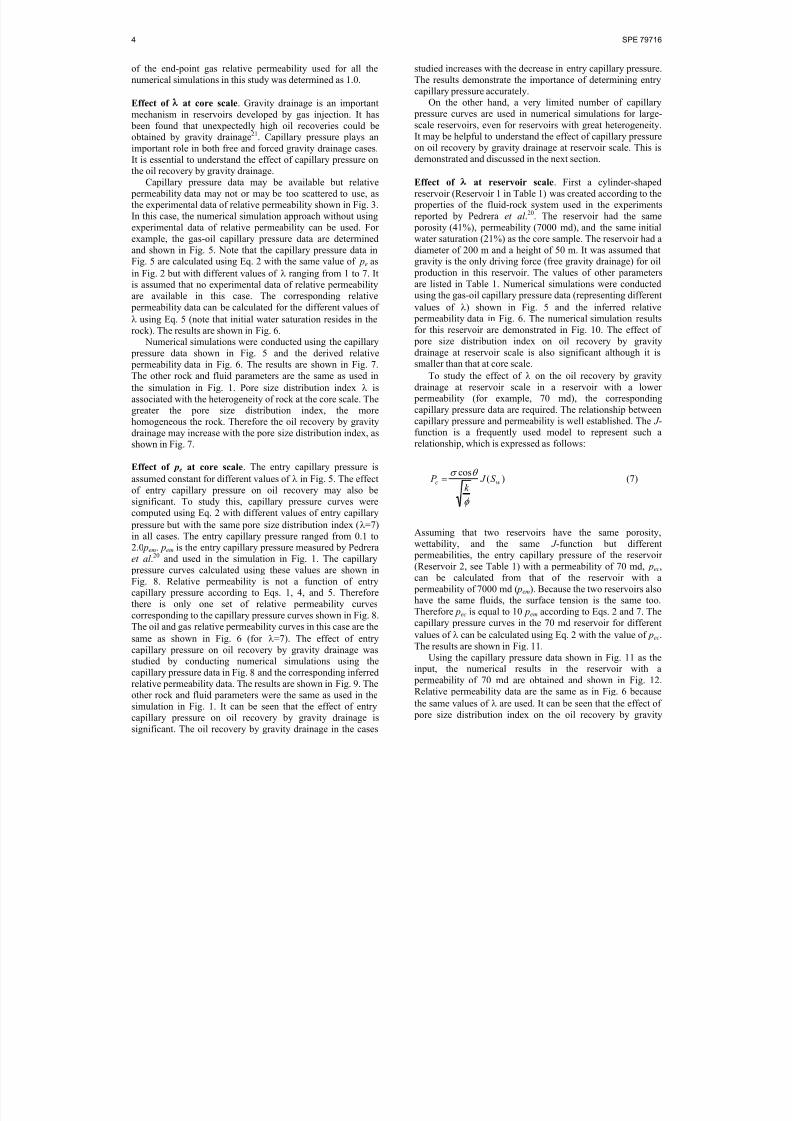
Gas and oil relative permeabilities were then calculated
using Eqs. 4 and 5 with the values of pe and λ from modeling
match. The results are shown in Fig. 3. The reason of using
Eq. 5 instead of Eq 1 to calculate the oil phase relative permeability is discussed in the previous section. The
experimental data of the oil relative permeability data obtained
by Pedrera et al .20 are also plotted in Fig. 3. Note that the
experimental data of the oil phase relative permeability are
very scattered and no gas phase relative permeability are
available. It can be seen in Fig. 3 that the oil phase relative
permeabilities calculated from the experimental capillary pressure data are approximately an average representation of
the experimental data.
The gas and oil relative permeabilities calculated from the
capillary pressure data using Eqs. 4 and 5 were used as the
input data for numerical simulation. The oil recovery obtainedfrom the numerical simulation using the model data of relative
permeability instead of experimental data, represented by theopen triangle symbols, is shown in Fig. 1. The numerica
simulator used in this study was Eclipse 100. The core sample
was subdivided into 100 grid blocks in the vertical direction
for this one dimension problem. Fig. 1 shows that the oirecovery obtained from the numerical simulation using the
model relative permeability data is almost the same as the
experimental data (represented by the solid circles). The
results in Fig. 1 demonstrate that it is possible to conduct
numerical simulation to match oil production data correctlywithout using the experimental data of relative permeability
instead, using the model data calculated from capillary pressure. Using this approach, the effect of the inaccuracy and
the uncertainty in the experimental data of relative
permeability on the numerical simulation results may be
reduced as discussed previously. For example, the
experimental data of relative permeability reported by Pedreraet al .20 were very scattered as shown in Fig. 3. When these
relative permeability data are used, the oil recovery by
numerical simulation is significantly different from the
experimental data. This is demonstrated in Fig. 1. The oilrecovery by numerical simulation using measured relative
permeability data (scattered) is represented by the open
diamond symbols. Actually it is impossible to put this kind ofrelative permeability data in the simulator without any data
processing because the simulator requires that oil phaserelative permeability should increase with the oil phase
saturation singularly. However the experimental data do not
behave this way. It is then necessary to fit the experimentadata using some models, which may introduce
further uncertainty.
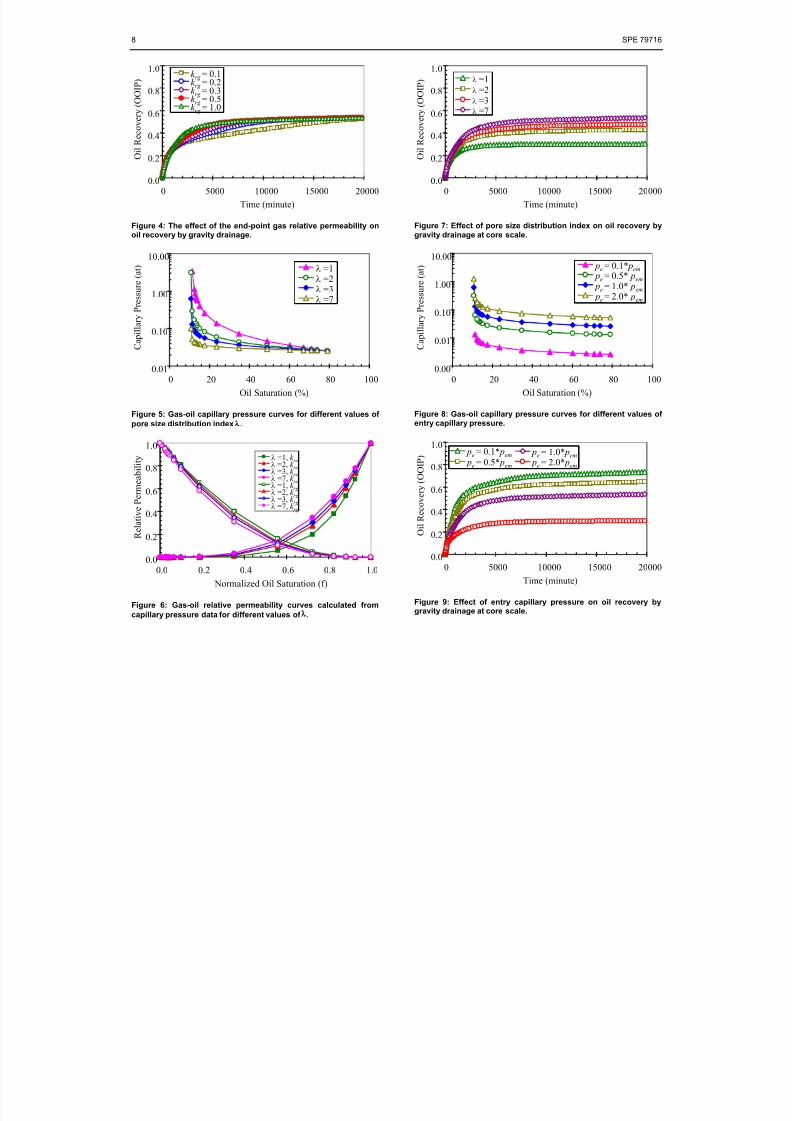
Effect of end-point k rg at core scale. The end-point gas phase
relative permeability was assumed to be 1.0 in conducting the
numerical simulation for the oil production by gravitydrainage, which may not be true. However the gas phase
mobility is usually much greater than the oil phase mobility
So the effect of the end-point gas relative permeability on the
numerical simulation results may be small in some cases. Toidentify the effect, numerical simulations were run usingdifferent values of end-point gas relative permeability ranging
from 0.1 to 1.0. The results are shown in Fig. 4. In this figure
k rg represents the end-point gas relative permeability. It can be
seen that the effect of the end-point gas relative permeabilityon the numerical simulation results is not significant when the
end-point gas relative permeability is greater than 0.5. It is
estimated that the end-point gas relative permeability in thecore with a permeability of 7000 md was greater than 0.5
according to the results by Gates and Leitz7 who reported tha
the end-point gas relative permeability in a core with a
permeability of 1370 md was around 0.68. Therefore the value
8/12/2019 SPE 79716 - Numerical Simulation With Input Consistency Between Pc and Krel - Kewen Li STANFORD
http://slidepdf.com/reader/full/spe-79716-numerical-simulation-with-input-consistency-between-pc-and-krel 4/9
4 SPE 79716
of the end-point gas relative permeability used for all the
numerical simulations in this study was determined as 1.0.
Effect of at core scale. Gravity drainage is an important
mechanism in reservoirs developed by gas injection. It has
been found that unexpectedly high oil recoveries could beobtained by gravity drainage21. Capillary pressure plays an
important role in both free and forced gravity drainage cases.It is essential to understand the effect of capillary pressure onthe oil recovery by gravity drainage.
Capillary pressure data may be available but relative
permeability data may not or may be too scattered to use, asthe experimental data of relative permeability shown in Fig. 3.
In this case, the numerical simulation approach without using
experimental data of relative permeability can be used. For
example, the gas-oil capillary pressure data are determined
and shown in Fig. 5. Note that the capillary pressure data inFig. 5 are calculated using Eq. 2 with the same value of pe as
in Fig. 2 but with different values of λ ranging from 1 to 7. Itis assumed that no experimental data of relative permeability
are available in this case. The corresponding relative permeability data can be calculated for the different values of
λ using Eq. 5 (note that initial water saturation resides in the
rock). The results are shown in Fig. 6. Numerical simulations were conducted using the capillary
pressure data shown in Fig. 5 and the derived relative
permeability data in Fig. 6. The results are shown in Fig. 7.
The other rock and fluid parameters are the same as used in
the simulation in Fig. 1. Pore size distribution index λ is
associated with the heterogeneity of rock at the core scale. Thegreater the pore size distribution index, the more
homogeneous the rock. Therefore the oil recovery by gravity
drainage may increase with the pore size distribution index, asshown in Fig. 7.
Effect of pe at core scale. The entry capillary pressure is
assumed constant for different values of λ in Fig. 5. The effect
of entry capillary pressure on oil recovery may also be
significant. To study this, capillary pressure curves were
computed using Eq. 2 with different values of entry capillary
pressure but with the same pore size distribution index (λ=7)
in all cases. The entry capillary pressure ranged from 0.1 to2.0 pem. pem is the entry capillary pressure measured by Pedrera
et al .20 and used in the simulation in Fig. 1. The capillary
pressure curves calculated using these values are shown in
Fig. 8. Relative permeability is not a function of entrycapillary pressure according to Eqs. 1, 4, and 5. Therefore
there is only one set of relative permeability curvescorresponding to the capillary pressure curves shown in Fig. 8.
The oil and gas relative permeability curves in this case are the
same as shown in Fig. 6 (for λ=7). The effect of entry
capillary pressure on oil recovery by gravity drainage wasstudied by conducting numerical simulations using the
capillary pressure data in Fig. 8 and the corresponding inferred
relative permeability data. The results are shown in Fig. 9. Theother rock and fluid parameters were the same as used in the
simulation in Fig. 1. It can be seen that the effect of entry
capillary pressure on oil recovery by gravity drainage is
significant. The oil recovery by gravity drainage in the cases
studied increases with the decrease in entry capillary pressure
The results demonstrate the importance of determining entry
capillary pressure accurately.On the other hand, a very limited number of capillary
pressure curves are used in numerical simulations for large
scale reservoirs, even for reservoirs with great heterogeneity
It may be helpful to understand the effect of capillary pressure
on oil recovery by gravity drainage at reservoir scale. This isdemonstrated and discussed in the next section.
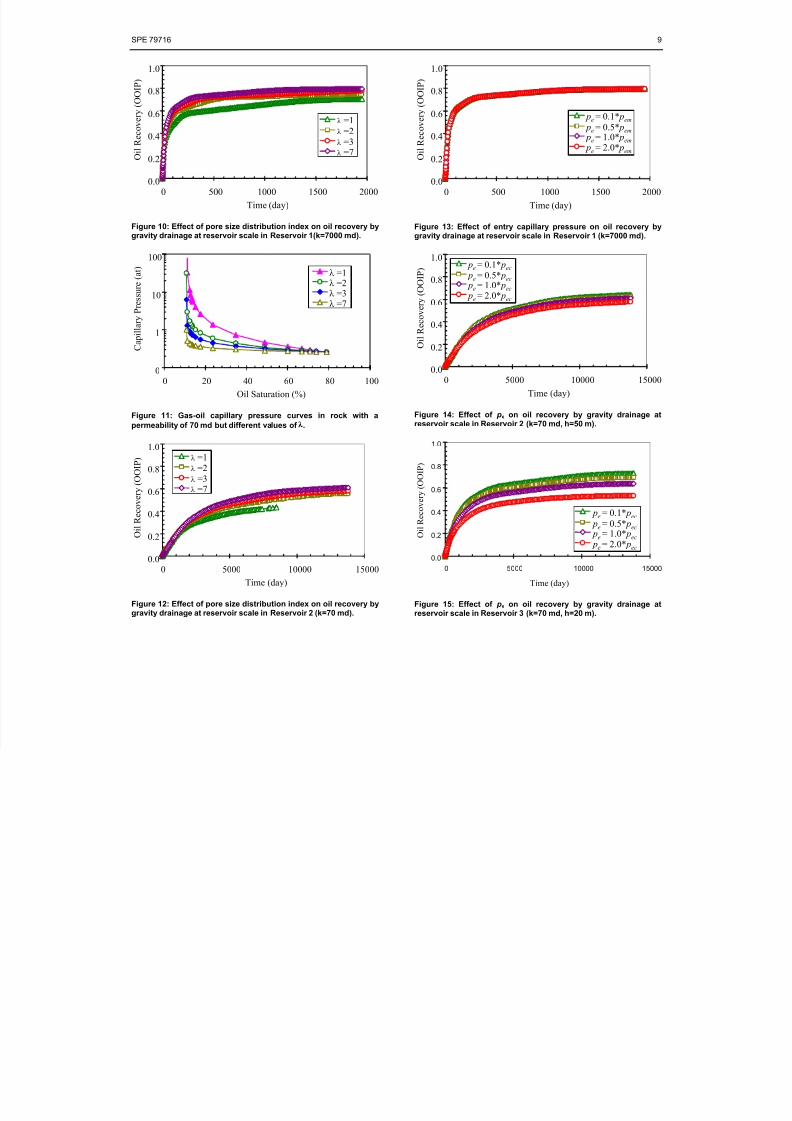
Effect of at reservoir scale. First a cylinder-shaped
reservoir (Reservoir 1 in Table 1) was created according to the properties of the fluid-rock system used in the experiment
reported by Pedrera et al .20. The reservoir had the same
porosity (41%), permeability (7000 md), and the same initia
water saturation (21%) as the core sample. The reservoir had a
diameter of 200 m and a height of 50 m. It was assumed thatgravity is the only driving force (free gravity drainage) for oil
production in this reservoir. The values of other parameter
are listed in Table 1. Numerical simulations were conducted
using the gas-oil capillary pressure data (representing differenvalues of λ) shown in Fig. 5 and the inferred relative permeability data in Fig. 6. The numerical simulation result
for this reservoir are demonstrated in Fig. 10. The effect of
pore size distribution index on oil recovery by gravity
drainage at reservoir scale is also significant although it issmaller than that at core scale.
To study the effect of λ on the oil recovery by gravity
drainage at reservoir scale in a reservoir with a lower permeability (for example, 70 md), the corresponding
capillary pressure data are required. The relationship between
capillary pressure and permeability is well established. The J function is a frequently used model to represent such a
relationship, which is expressed as follows:
)(cos
wc S J k
P
φ
θ σ = (7)
Assuming that two reservoirs have the same porosity
wettability, and the same J -function but differen permeabilities, the entry capillary pressure of the reservoi
(Reservoir 2, see Table 1) with a permeability of 70 md, pec
can be calculated from that of the reservoir with a
permeability of 7000 md ( pem). Because the two reservoirs also
have the same fluids, the surface tension is the same tooTherefore pec is equal to 10 pem according to Eqs. 2 and 7. The
capillary pressure curves in the 70 md reservoir for differen
values of λ can be calculated using Eq. 2 with the value of pec
The results are shown in Fig. 11.
Using the capillary pressure data shown in Fig. 11 as theinput, the numerical results in the reservoir with a
permeability of 70 md are obtained and shown in Fig. 12
Relative permeability data are the same as in Fig. 6 because
the same values of λ are used. It can be seen that the effect of
pore size distribution index on the oil recovery by gravity

8/12/2019 SPE 79716 - Numerical Simulation With Input Consistency Between Pc and Krel - Kewen Li STANFORD
http://slidepdf.com/reader/full/spe-79716-numerical-simulation-with-input-consistency-between-pc-and-krel 5/9
SPE 79716 5
drainage in low permeability reservoirs is also significant after
a period of production time.
Effect of pe at reservoir scale. The entry capillary pressure
used to conduct the numerical simulations shown in Figs. 10
and 12 is assumed constant. To study the effect of entry
capillary pressure on oil recovery by gravity drainage at
reservoir scale, numerical simulations were conducted inReservoir 1 using the capillary pressure data in Fig. 8. The
results are shown in Fig. 13. There is almost no effect of entrycapillary pressure on oil recovery by gravity drainage for the
reservoir with a permeability of 7000 md and a height of 50 m.
When the reservoir permeability decreases from 7000 to
70 md, the entry capillary pressure increases 10 timesaccording to Eq. 7 (assuming that other parameters are
unchanged). In this case (Reservoir 2), the effect of entry
capillary pressure on oil recovery by gravity drainage is
greater than that in Reservoir 1, as shown in Fig. 14.
The effect of entry capillary pressure on oil recovery bygravity drainage also depends on reservoir height. Fig. 15
shows the numerical simulation results for the same reservoiras in Fig. 14 but with a height of 20 m (Reservoir 3), instead
of 50 m. Comparing the results in Fig. 15 to those in Fig. 14, it
can be seen that the effect of entry capillary pressure on oil
recovery by gravity drainage is significant and greater in thin
reservoirs than that in thick reservoirs.
DiscussionSince the cost of measuring relative permeability is high, the
number of core samples chosen to measure relative permeability is an important consideration in the design of
special core analysis. Due to this, the question of how manyrelative permeability measurements are required is raised. It is
difficult to determine the number of relative permeability
measurements technically and economically althoughMohammed and Corbett22 proposed a method to do so.Because relative permeabilities in many two-phase fluid flow
systems can be calculated satisfactorily using capillary
pressure data with specific models and the approach proposedin this paper, the answer to the question of how many relative
permeability measurements are required may be zero
theoretically. However, in cases in which it is technically andfinancially possible to measure relative permeability, we
propose a few experimental measurements. The utilization of
the experimental relative permeability data is to prove thevalidity of the specific models (for specific reservoirs) to
calculate relative permeability from capillary pressure.
In conducting numerical simulations for sensitivityanalysis, upscaling, and other calculations, capillary pressure
and relative permeability data are often determined
heuristically using empirical equations without coupling4.However, relative permeability data can be calculated using
coupled equations as discussed by Li and Horne19. In doing so,
the data set may be more representative of actual fluid flowmechanisms in reservoirs.
The numerical simulation approach proposed in this article
may be useful in many cases in which it is difficult to measure
relative permeability, for example, reservoirs with extremelylow permeability, geothermal reservoirs, and gas-condensate
reservoirs. If the core permeability is extremely low, it takes
long time to measure relative permeability and the cost will be
high. In geothermal reservoirs, because of the significant mass
transfer and phase transformation between two phases (steamand water) as pressure changes, it is very difficult to measure
steam-water relative permeability24-25. It is also very difficultto measure gas-condensate relative permeability curves
because of the similar mass transfer and phase transformation
problem26-28
in gas-condensate systems.This approach may also be suitable in cases in which there
is no time and no sample to conduct relative permeability
measurements. Numerical simulation while drilling is sucha case.
Single-phase upscaling is well understood29, even in the
near-well region30-31. However this is not the case for
multiphase upscaling, which is still a challenge32-33. In manycases, reservoir permeability is upscaled but saturation
dependent properties (capillary pressure and relative
permeability functions) may not be. The coupling between
capillary pressure and relative permeability functions and theresults presented in this paper suggest that it may only be
necessary to upscale the capillary pressure functions. Relative
permeability functions at larger scale may be calculated fromthe upscaled capillary pressure functions. However, capillary
pressure is often neglected in many studies regarding
numerical simulation and upscaling, even for reservoirs with
low permeability and great heterogeneity. If capillary pressureis neglected or assumed to be zero, relative permeability
would be a linear function of fluid saturation physically. Thisis not the case though. It may be more representative of fluid
flow mechanisms in reservoirs with low permeability and
great heterogeneity to include capillary pressure in studies.
On the other hand, upscaling capillary pressure functionsmay be easier than upscaling relative permeability functions
because of the well-established relationship between capillary
pressure and rock-fluid properties. In doing so, computationcost for multiphase upscaling and uncertainty may be reduced
significantly. The peculiar shapes of relative permeability
curves obtained using some existing upscaling techniques
might also be avoided. It is necessary yet to verifythis speculation.
Three-phase relative permeability data play a significanrole in many cases of numerical simulation. Because of the
difficulty in conducting three-phase fluid flow experiments
three-phase relative permeability data are often obtained from
two-phase relative permeability data by using specific modelsThe results have more uncertainty than two-phase relative
permeabilities due to the limitation of the models used. Tamim
et al .23
reviewed the uncertainty involved in three-phaserelative permeability data related to thermal simulation. I
three-phase relative permeability can be calculated from three
phase capillary pressure data, uncertainty due to three-phaserelative permeability may be reduced. This is stil
under investigation.
It seems that the numerical simulation technique proposedin this article would not be applicable in cases in which
capillary pressure is negligible. However, note that relative
permeability may be represented as a linear function of fluidsaturation if capillary pressure is negligible. In this case, the
numerical simulation approach may still be applied.

8/12/2019 SPE 79716 - Numerical Simulation With Input Consistency Between Pc and Krel - Kewen Li STANFORD
http://slidepdf.com/reader/full/spe-79716-numerical-simulation-with-input-consistency-between-pc-and-krel 6/9
6 SPE 79716
ConclusionsBased on the present study, the following conclusions may
be drawn:1. Using only the experimental capillary pressure data, the
oil production calculated from numerical simulation is
almost the same as the measured experimental data. Therelative permeabilities required for numerical simulation
can be calculated from the capillary pressure data.2. A numerical simulation approach was proposed without
specifying relative permeability functions separately. This
approach allows numerical simulations once reliable
capillary pressure data are available, without the need ofexperimental data of relative permeability.
3. Using the approach proposed in this study, the effect of
pore size distribution index on oil recovery by gravitydrainage was investigated at both core and reservoir
scales. Significant effect was observed at both scales. The
oil recovery by gravity drainage increases with the pore
size distribution index as expected.4. The effect of entry capillary pressure on oil recovery by
gravity drainage was also investigated. The oil recovery
by gravity drainage increases with the decrease in entrycapillary pressure, which depends on permeability,
reservoir height, and other parameters.
AcknowledgementsThis research was conducted with financial support to theStanford Geothermal Program from the Geothermal and Wind
division of the US Department of Energy under grant DE-
FG07-99ID13763, the contribution of which is
gratefully acknowledged.
Nomenclaturek = permeability
k rg =relative permeability of gas phase k rnw =relative permeability of nonwetting phase
k ro =relative permeability of oil phase
k rw = relative permeability of wetting phase
P c =capillary pressure pe =entry capillary pressure
pec = entry capillary pressure calculated for rock with a
permeability of 70 md pem = experimental entry capillary pressure
S o = oil phase saturation
S or =residual oil saturation *oS = normalized oil phase saturation
S w = wetting phase saturation
S wi = initial water saturation *wS = normalized wetting phase saturation
S wr = residual wetting phase saturation
σ = interfacial tension
λ= pore size distribution index
φ = porosity
References1. Zhang, D., Li, L., and Tchelepi, H.A.: “Stochastic Formulation
for Uncertainty Analysis of Two-Phase Flow in HeterogeneousReservoirs”, SPEJ (March 2000) 5, 60.
2. Hastings, J.J., Muggeridge, A.H., and Blunt, M.J.: “A NewStreamline Method for Evaluating Uncertainty in Small-ScaleTwo-Phase Flow Properties”, SPE 66349, presented at the SPEReservoir Simulation Symposium, Houston, Texas, February
11–14, 2001.
3. Caldwell, R.H. and Heather, D.I.: “Characterizing UncertaintyIn Oil and Gas Evaluations”, SPE 68592, presented at the SPE
Hydrocarbon Economics and Evaluation Symposium, Dallas
Texas, April 2-3, 2001. 4. Pickup, G., Ringrose, P.S. and Sharif, A.: “Steady-State
Upscaling: From Lamina-Scale to Full-Field Model”, SPEJ
(June 2000) 5, 208.
5. McPhee, C.A. and Arthur, K.G.: “Relative PermeabilityMeasurements: An Inter-Laboratory Comparison”, SPE 28826
presented at the 1994 SPE European Petroleum ConferenceLondon, Oct 25-27, 1994.
6. Purcell, W.R.: "Capillary Pressures-Their Measurement UsingMercury and the Calculation of Permeability", Trans. AIME(1949), 186, 39.
7. Gates, J. I. and Leitz, W. J.: "Relative Permeabilities oCalifornia Cores by the Capillary Pressure Method", presentedat the API meeting, Los Angeles, California, May 11, 1950, 286
8. Burdine, N. T.: "Relative Permeability Calculations from PorSize Distribution Data", Trans. AIME , (1953), 198, 71.
9. Corey, A. T.: "The Interrelation between Gas and Oil RelativePermeabilities", Prod . Mon., (1954), 19, 38.
10. Brooks, R. H. and Corey, A. T.: "Properties of Porous MediaAffecting Fluid Flow", J. Irrig. Drain. Div., (1966), 6, 61.
11. Honarpour, M. M., Koederitz, L., and Harvey, A. H.: Relative Permeability of Petroleum Reservoirs, CRC press, Boca Raton
Florida, USA, 1986, ISBN 0-8493-5739-X, 19.12. Land, C. S.: "Calculation of Imbibition Relative Permeability fo
Two- and Three-Phase Flow from Rock Properties", SPEJ(June 1968), 149.
13. Land, C. S.: "Comparison of Calculated with Experimenta
Imbibition Relative Permeability", Trans. AIME , (1971)251, 419.
14. Papatzacos, P. and Skjæveland, S.M.: “Relative Permeabilityfrom Capillary Pressure,” SPE 77540, presented at the 2002 SPEAnnual Technical Conference and Exhibition, San Antonio, TXUSA, September 29 to October 02, 2002.
15. Fatt, I. and Dykstra, H.: "Relative Permeability Studies", Trans AIME , (1951), 192, 249.
16. Rapoport, L. A. and Leas, W. J.: "Relative Permeability to
Liquid in Liquid-Gas System", Trans. AIME , (1951), 192, 83.17. Wyllie, M. R. and Gardner, G. H. F.: "The Generalized Kozeny
Carman Equation, Its Application to Problems of MultiphaseFlow in Porous Media", World Oil , (1958), 146, 121.
18. Huang, D. D., Honarpour, M. M., Al-Hussainy, R.: "AnImproved Model for Relative Permeability and CapillaryPressure Incorporating Wettability", SCA 9718, Proceedings oInternational Symposium of the Society of Core Analysts
Calgary, Canada, September 7-10, 1997.19. Li, K. and Horne, R.N.: “Experimental Verification of Method
to Calculate Relative Permeability Using Capillary PressureData,” SPE 76757, presented at the SPE Western Region
Meeting/AAPG Pacific Section Joint Meeting held inAnchorage, Alaska, May 20-22, 2002.
20. Pedrera, B., Betin, H., Hamon, G., and Augustin, A."Wettability Effect on Oil Relative Permeability during a
Gravity Drainage," SPE 77542, presented at the SPE AnnuaTechnical Conference and Exhibition, San Antonio, TX, USASeptember 29 to October 02, 2002.
21. Dumor é, J.M. and Schols, R.S.: “Drainage Capillary PressureFunction and the Influence of Connate Water”, SPEJ (Octobe1974), 437.
8/12/2019 SPE 79716 - Numerical Simulation With Input Consistency Between Pc and Krel - Kewen Li STANFORD
http://slidepdf.com/reader/full/spe-79716-numerical-simulation-with-input-consistency-between-pc-and-krel 7/9
SPE 79716 7
22. Mohammed, K. and Corbett, P.: “How Many RelativePermeability Measurements Do You Need?” proceedings of the2002 International Symposium of the Society of Core Analysts,California, USA, September 22-25, 2002.
23. Tamim, M., Abou-Kassem, J.H., and Farouq, S.M.: "RecentDevelopments in Numerical Simulation Techniques of Thermal
Recovery Processes," SPE 54096, presented at the 1999 SPEInternational Thermal Operations and Heavy Oil Symposium
held in Bakersfield, California, 17–19 March 1999.24. Sanchez, J.M. and Schechter, R.S.: “Comparison of Two-Phase
Flow of Steam/Water through an Unconsolidated PermeableMedium, ” SPERE , (Aug. 1990), 293-300.
25. Horne, R.N., Satik, C., Mahiya, G., Li, K., Ambusso, W., Tovar,R., Wang, C., and Nassori, H.: “Steam-Water Relative
Permeability,” Proceedings of the World Geothermal Congress,Kyushu-Tohoku, Japan, May 28-June 10, 2000.
26. Gravier, J. F., Lemouzy, P., Barroux, C., and Abed, A. F.:“Determination of Gas-Condensate Relative Permeability on
Whole Cores Under Reservoir Conditions,” SPEFE (February1986) 9.
27. Chen, H. L., Wilson, S. D., and Monger-McClure, T. G.:“Determination of Relative Permeability and Recovery for
North Sea Gas-Condensate Reservoirs,” paper SPE 30769
presented at the 1995 SPE Annual Technical Conference &Exhibition, Dallas, TX, 22-25 October.
28. Henderson, G.D., Danesh, A., Tehrani, D.H., Al-Shaidi, S., and
Peden, J.M.: “Measurement and Correlation of Gas-CondensateRelative Permeability by the Steady-State Method,” paper SPE30770 presented at the 1995 Annual Technical Conference and
Exhibition, Dallas, Texas, 22-25 October.
29. Renard, P. and de Marsily, G.: “Calculating EquivalentPermeability: A Review,” Adv. in Water Resour. (1997) 20, 253.
30. Durlofsky, L.J., Milliken, W.J., and Bernath, A.: “Scaleup in the Near-Well Region”, SPEJ (March 2000) 5, 110.
31. Ding, Y.: ‘‘Scaling Up in the Vicinity of Wells in
Heterogeneous Field,’’ SPE 29137 presented at the 1995 SPESymposium on Reservoir Simulation, San Antonio, Texas,
February12-15.32. Coll, C., Muggeridge, A.H., and Jing, X.D.: “Regional
Upscaling: A New Method to Upscale Waterflooding inHeterogeneous Reservoirs for a Range of Capillary and Gravity
Effects”, SPEJ (September 2001) 6, 299.
33. Abtahi, M. and Torsaeter, O.: “Experimental and NumericalUpscaling of Two-Phase Flow in Homogeneous andHeterogeneous Porous Media”, SPE 50572, presented at the1998 SPE European Petroleum Conf., The Hague, Oct. 20-22.
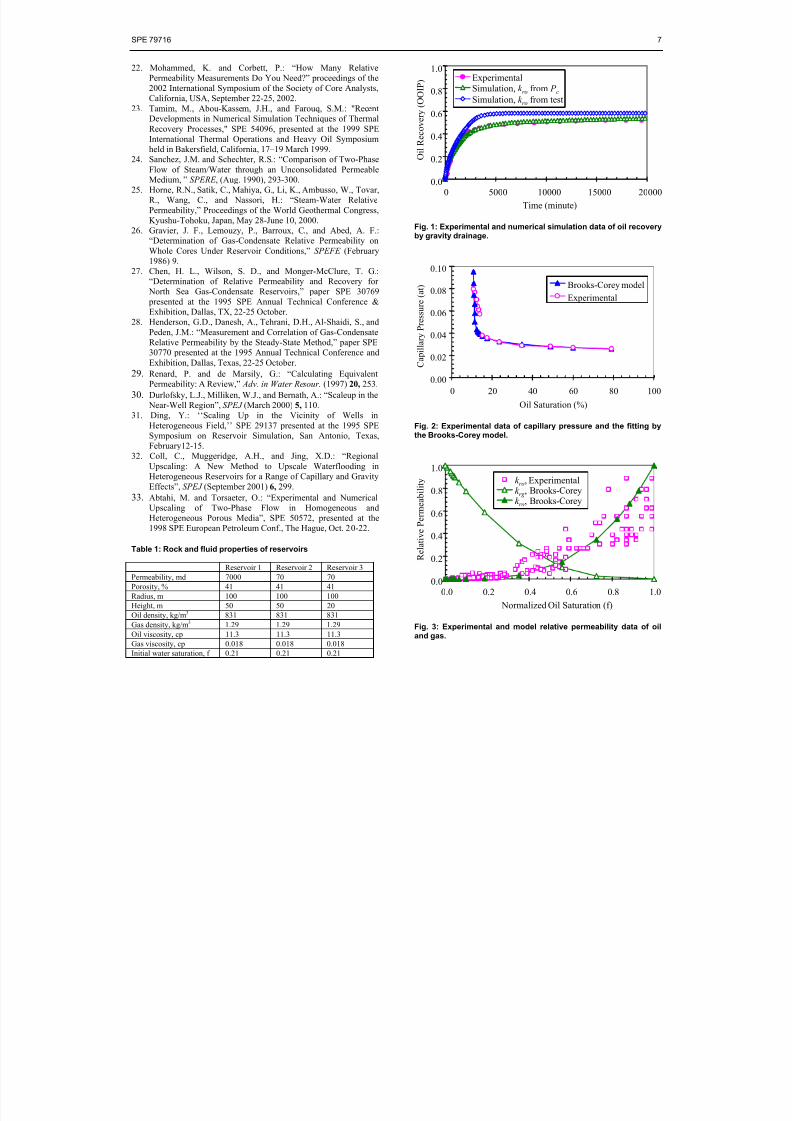
Table 1: Rock and fluid properties of reservoirs
Reservoir 1 Reservoir 2 Reservoir 3
Permeability, md 7000 70 70
Porosity, % 41 41 41
Radius, m 100 100 100Height, m 50 50 20
Oil density, kg/m3 831 831 831
Gas density, kg/m3 1.29 1.29 1.29
Oil viscosity, cp 11.3 11.3 11.3
Gas viscosity, cp 0.018 0.018 0.018
Initial water saturation, f 0.21 0.21 0.21
0.0
0.2
0.4
0.6
0.8
1.0
0 5000 10000 15000 20000
Time (minute)
O i l
R e c o v e r y ( O O I P ) Experimental
Simulation, k ro from P cSimulation, k ro from test
Fig. 1: Experimental and numerical simulation data of oil recoveryby gravity drainage.
0.00
0.02
0.04
0.06
0.08
0.10
0 20 40 60 80 100
Oil Saturation (%)
C a p i l l a r y P r e s s u r e
( a t ) Brooks-Corey model
Experimental
Fig. 2: Experimental data of capillary pressure and the fitting bythe Brooks-Corey model.
0.0
0.2
0.4
0.6
0.8
1.0
0.0 0.2 0.4 0.6 0.8 1.0
Normalized Oil Saturation (f)
R e l a t i v e P e r m e a b i l i t y k ro, Experimental
k rg , Brooks-Coreyk ro, Brooks-Corey
Fig. 3: Experimental and model relative permeability data of oiand gas.
8/12/2019 SPE 79716 - Numerical Simulation With Input Consistency Between Pc and Krel - Kewen Li STANFORD
http://slidepdf.com/reader/full/spe-79716-numerical-simulation-with-input-consistency-between-pc-and-krel 8/9
8 SPE 79716
0.0
0.2
0.4
0.6
0.8
1.0
0 5000 10000 15000 20000
Time (minute)
O i l
R e c o v e r y ( O O I P )
k rg = 0.1k rg = 0.2k rg = 0.3k rg = 0.5k rg = 1.0
Figure 4: The effect of the end-point gas relative permeability onoil recovery by gravity drainage.
0.01
0.10
1.00
10.00
0 20 40 60 80 100
Oil Saturation (%)
C a p i l l a r y P r e s s u r e ( a t ) λ =1
λ =2λ =3
λ =7
Figure 5: Gas-oil capillary pressure curves for different values of
pore size distribution index .
0.0
0.2
0.4
0.6
0.8
1.0
0.0 0.2 0.4 0.6 0.8 1.0
Normalized Oil Saturation (f)
R e l a t i v e P e r m e a b i l i t y λ =1, k ro
λ =2, k roλ =3, k roλ =7, k roλ =1, k rg λ =2, k rg λ =3, k rg λ =7, k rg
Figure 6: Gas-oil relative permeability curves calculated from
capillary pressure data for different values of .
0.0
0.2
0.4
0.6
0.8
1.0
0 5000 10000 15000 20000
Time (minute)
O i l
R e c o v e r y ( O O I P ) λ =1
λ =2
λ =3λ =7
Figure 7: Effect of pore size distribution index on oil recovery bygravity drainage at core scale.
0.00
0.01
0.10
1.00
10.00
0 20 40 60 80 100
Oil Saturation (%)
C a p i l l a r y P r e s s u r e ( a t ) pe = 0.1* pem
pe = 0.5* pem
pe = 1.0* pem
pe = 2.0* pem
Figure 8: Gas-oil capillary pressure curves for different values oentry capillary pressure.
0.0
0.2
0.4
0.6
0.8
1.0
0 5000 10000 15000 20000
Time (minute)
O i l R e c o v e r y ( O O I P ) pe = 0.1* pem
pe = 0.5* pem
pe = 1.0* pem
pe = 2.0* pem
Figure 9: Effect of entry capillary pressure on oil recovery bygravity drainage at core scale.
8/12/2019 SPE 79716 - Numerical Simulation With Input Consistency Between Pc and Krel - Kewen Li STANFORD
http://slidepdf.com/reader/full/spe-79716-numerical-simulation-with-input-consistency-between-pc-and-krel 9/9
SPE 79716 9
0.0
0.2
0.4
0.6
0.8
1.0
0 500 1000 1500 2000
Time (day)
O i l
R e c o v e r y ( O O I P )
λ =1λ =2λ =3λ =7
Figure 10: Effect of pore size distribution index on oil recovery bygravity drainage at reservoir scale in Reservoir 1(k=7000 md).
0
1
10
100
0 20 40 60 80 100
Oil Saturation (%)
C a p i l l a r y P r e s
s u r e ( a t )
λ =1λ =2λ =3λ =7
Figure 11: Gas-oil capillary pressure curves in rock with a
permeability of 70 md but different values of .
0.0
0.2
0.4
0.6
0.8
1.0
0 5000 10000 15000
Time (day)
O i l R e c o v e r y ( O O I P ) λ =1
λ =2
λ =3λ =7
Figure 12: Effect of pore size distribution index on oil recovery bygravity drainage at reservoir scale in Reservoir 2 (k=70 md).
0.0
0.2
0.4
0.6
0.8
1.0
0 500 1000 1500 2000
Time (day)
O i l
R e c o v e r y ( O O I P )
pe = 0.1* pem
pe = 0.5* pem
pe = 1.0* pem
pe = 2.0* pem
Figure 13: Effect of entry capillary pressure on oil recovery bygravity drainage at reservoir scale in Reservoir 1 (k=7000 md).
0.0
0.2
0.4
0.6
0.8
1.0
0 5000 10000 15000
Time (day)
O i l R e c o v e r y
( O O I P ) pe = 0.1* pec
pe = 0.5* pec
pe = 1.0* pec
pe = 2.0* pec
Figure 14: Effect of pe on oil recovery by gravity drainage atreservoir scale in Reservoir 2 (k=70 md, h=50 m).
0.0
0.2
0.4
0.6
0.8
1.0
0 5000 10000 15000
Time (day)
O i l R e c o v e r y ( O O I P )
pe = 0.1* pec
pe = 0.5* pec
pe = 1.0* pec
pe = 2.0* pec
Figure 15: Effect of pe on oil recovery by gravity drainage atreservoir scale in Reservoir 3 (k=70 md, h=20 m).