CO2 Huff-n-Puff Process in a Light Oil Shallow Shelf Carbonate Reservoir, 2/98, 2834222

SPE-195223-MS
Mechanisms for Huff-n-Puff Cyclic Gas Injection into UnconventionalReservoirs
B. Todd Hoffman, Montana Tech; Jeffrey M. Rutledge, QPlus Energy LLC
Copyright 2019, Society of Petroleum Engineers
This paper was prepared for presentation at the SPE Oklahoma City Oil and Gas Symposium held in Oklahoma City, Oklahoma, USA, 9-10 April 2019.
This paper was selected for presentation by an SPE program committee following review of information contained in an abstract submitted by the author(s). Contentsof the paper have not been reviewed by the Society of Petroleum Engineers and are subject to correction by the author(s). The material does not necessarily reflectany position of the Society of Petroleum Engineers, its officers, or members. Electronic reproduction, distribution, or storage of any part of this paper without the writtenconsent of the Society of Petroleum Engineers is prohibited. Permission to reproduce in print is restricted to an abstract of not more than 300 words; illustrations maynot be copied. The abstract must contain conspicuous acknowledgment of SPE copyright.
AbstractUnconventional oil reservoirs such as the Eagle Ford have had tremendous success over the last decade,but challenges remain as flow rates drop quickly and recovery factors are low; thus, enhanced oil recoverymethods are needed to increase recovery. Interest in cyclic gas injection has risen as a number ofsuccessful pilots have been reported; however, little information is available on recovery mechanisms forthe process. This paper evaluates oil swelling caused by diffusion and advection processes for gas injectionin unconventional reservoirs.
To accurately evaluate gas penetration into the matrix, the surface area of the hydraulic fractures needsto be known, and in this work, three different methods are used to estimate the area: volumetrics, well flowrates and linear fluid flow equations. Fick's law is used to determine the gas penetration depth caused bydiffusion, and the linear form of Darcy's law is used to find the amount from advection. Then, with the useof swelling test information from lab tests, we are able to approximate the amount of oil recovery expectedfrom cyclic gas injection operations.
During the gas injection phase, gas from the fractures can enter the matrix by both advection (Darcydriven flow) and diffusion. We estimate that over 200 million scf of gas can enter the matrix during a 100 dayinjection/soak period. Using typical reservoir and fluid parameters, it appears that 40% is due to diffusionand 60% is due to advection. Sensitivity analysis shows that these numbers vary considerable based on theparameters used. Analytical models also show that during a 100 day production timeframe, over 14,000stock tank barrels (STB) of oil can be produced due to huff-n-puff gas injection.
Both gas injection and oil recovery amounts are compared to recent Eagle Ford gas injection pilot data,and the model results are consistent with the field pilot data.
By determining the relative importance of the different recovery mechanisms, this paper provides a betterunderstanding of what is happening in unconventional reservoirs during cyclic gas injection. This will allowmore efficient injection schemes to be designed in the future.
IntroductionUnconventional reservoirs have been an overwhelming success for domestic oil production; the Bakken,Eagle Ford, Niobrara and formations in the Permian have dramatically increased production over the last

2 SPE-195223-MS
decade. Figure 1 shows the U.S. oil production since 1920, and there is clearly a significant increase thelast 10 years. While some of this increase is from conventional reservoirs, over 6 million barrels per dayis from unconventional oil reservoirs (EIA, 2019),
Figure 1—U.S. domestic oil production from 1920-2018 (EIA, 2019).
Improvements in two important areas of the petroleum industry have been the main cause of this explosionin unconventional oil production: long horizontal wells and multi-stage hydraulic fracturing. Horizontalsections now are typically around 10,000 feet long, and it is common to have 20 to 40+ hydraulic fracturesper well. These improvements in technology have allowed wells in these types of reservoirs to initiallyproduce at high rates.
Possibly even more important than the technology is the volumes of in-place oil for these unconventionalreservoirs. In each formation, there are hundreds of billions barrels of oil in place (Downey, et al., 2011;Gherabati, et al., 2018), which exceeds even the largest conventional reservoirs. These unconventionalreservoirs served as the source rocks for many conventional reservoirs, and while much oil migrated out tofill higher permeability reservoirs, even more has remained at the source.
Although the oil in place volumes are vast and the technology improvements are remarkable, there aremany issues with these types of reservoirs. The rock properties in unconventional reservoirs are poorerquality than in conventional reservoirs. Source rocks are mostly deposited in deep marine or lacustrinedeposits, so the grain sizes tend to be much smaller. This also causes the pore sizes to be smaller and thepermeability to be much lower, typically in the microDarcy ( d) and nanoDarcy (nd) range. For examplein the Eagle Ford formation, the average matrix permeability tends to be 1 to 1000 nd (Bhandari, et al.,2018). In addition, due to the organic material deposited, unconventional reservoirs tend to be less water-wet than conventional reservoirs.
Wells start producing at high rates; however, they also decline very quickly. Figure 2 shows the averageoil rate for Eagle Ford wells that came online each year from 2008 through 2015 (Mobilia, et al., 2016).These wells were time-shifted so that they all started at time zero on the plot. Production begins at 300-400barrels per day, but within 2 years, it is less than a quarter of that. Most wells in unconventional oil reservoirsare less than 10 years old; however, using production forecasts, the recovery factor from these reservoirs isexpected to be quite low, likely less than 10% (King, 2014). Consequently, enhanced oil recovery (EOR)techniques need to be developed for these types of reservoirs, so more remaining oil can be accessed.

SPE-195223-MS 3
Figure 2—Average oil production per well in the Eagle Ford (Mobilia et al., 2016).
Gas Injection for Unconventional ReservoirsWhen fluids are injected into a reservoir, they will naturally take the path of least resistance. In reservoirswith fractures (either natural or hydraulically induced), the fluid preferentially will go into these fractures.If the fractures create a strong connection between an injection well and a production well, then the injectedfluid will break through to the producer very quickly. In this case, the reservoir matrix will have littlecontact with the injected fluid and the additional recovery will be small. This behavior has been observedin conventional naturally fractured reservoirs. In hydraulically fractured unconventional reservoirs, therehave been pilot tests with injection/production pairs, and for the most part, these cases have had similarproblems (Hoffman & Evans, 2016).
This fracture to matrix permeability contrast and lack of mobility control has lead companies to lookfor other options, and one possible solution has come out of the thermal recovery part of the industry. Inheavy oil reservoirs, steam is often injected to heat the oil and increase recovery. Sometimes the steam isinjected in a continuous fashion like a waterflood, but other times a single well is both the injector andproducer. Steam is injected into a well; the well is shut in (soak period) while heat is transferred from thesteam to the oil and surrounding rock. Then the well is put on production and produces the heated oil andcondensed water. This process is repeated multiple times to increase recovery and is called cyclic steamor huff-n-puff (Prats, 1982).
Cyclic injection processes have been adopted for unconventional reservoirs, but instead of using steam,some form of miscible gas (either CO2 or hydrocarbon gas) is used (Chen et al., 2014). The mechanism forrecovery is slightly different. There is no heat transfer, but the gas will move from the fractures into theliquid hydrocarbons in the matrix due to advection and diffusion. The gas will dissolve into the oil causingit to expand and expel the oil back into the fractures. Other mechanisms such as viscosity reduction andvaporization may also be present, but they are expected to be less important for the liquid rich portions ofunconventional reservoirs. Then. when the well is turned back on, additional oil is recovered. This strategyhas been evaluated in a handful of tests in the Eagle Ford formation of south Texas (Thomas, et al., 2016;Hoffman, 2018), and the results have been positive. However, the process for gas entering the matrix andcausing additional oil recovery has not been well studied.
This paper describes a way to determine the amount of recovery for a huff-n-puff gas injection processin an unconventional reservoir with a simple analytical model. Before going into the details of the model;however, first we will explain the conceptual model and the assumptions of the analytical model.
Conceptual Reservoir ModelDuring hydraulic fracturing, a system of permeable fractures is created. These fractures are either proppedopen with sand or self-propped, so that they are orders of magnitude more permeable than the matrix

4 SPE-195223-MS
permeability. We will assume that these fractures have infinite conductivity relative to the matrix, whichindicates that they are 5-6 orders of magnitude more permeable (Horne, 1995). This means that the limitingfactor for the production rate to the wells is how much fluid can be delivered to the fractures from the matrix,which will depend on the matrix permeability and the surface area available to flow into the fractures. Thus,the actual layout of the fractures is less important for this work, and the surface area (height x length) ofthe fractures is the most important aspect.
Figure 3 shows two ways to represent the fracture system; (a) has a more realistic description withfractures branching, splitting and creating complexity due to variations in rock fabric, while (b) is a simplerrepresentation with a series of parallel, equal-distance fractures where L is half of the fracture spacing. Aslong as the surface area of the two systems is the same, their behavior will be similar in the analytical model.Early in the life of the well, the systems will be in a transient flow regime, but once the pressures hits theno-flow boundary (e.g. Figure 3b), the systems will move to a pseudo-steady state (PSS) flow regime. Forboth situations (a) and (b), PSS will be reached, the only difference is that (a) also has a transition flowregime (between transient and PSS) that is a function of the different sizes and shapes of the matrix blocks.
Figure 3—Representation of a hydraulic fracture system (a) complex, and (b) simplified.
For this model, we will assume that the matrix permeability is constant. During the hydraulic fracturing,there may be some inflated natural fractures that extend out into the reservoir. As the well is flowed backand the pressure drops, if these fractures are not self-propped, they will close and provide no additionalcontribution above matrix permeability.
During the huff-n-puff process, gas is injected into the well, fills the infinite conductivity fractures andgoes into the matrix either by diffusion or advection. If the injection rates or volumes exceed the ability ofthe matrix to take up all of the gas, then the gas will continue to migrate through the fracture network withthe potential to reinflate closed fractures. This has been verified in field pilot tests, where the injected gas hasbeen observed long distances (1000 ft - 5000+ ft) away from the injection well (Hoffman and Evans, 2016).
This is similar to what is observed during stimulation where pressure (and sometimes fluid and proppant)is observed at the offset wells, but afterward, the wells do not necessarily behave like they are incommunication. These are essentially unpropped fractures that heal up over time. The injected gas may openfractures, and gas and/or pressure may be seen at the offset wells, but as long as the gas stays in the lease,little is wasted, as improved recovery can be observed for these offset wells, too. Only if the gas leaves thezone or pattern will a loss in efficiency occur. For this model, we will assume that all gas stays in the pattern.
When the well is put back on production, it mobilizes the oil by swelling, viscosity reduction,vaporization, secondary solution gas drive, surface tension reduction, and other mechanisms to increaserecovery. For this work, however, we will assume that oil swelling is the primary mechanism, and the other

SPE-195223-MS 5
ones are secondary in importance. To build analytical models for the process, we need to be able to calculate(1) fracture surface area (2) gas penetration volumes into the matrix, and (3) the expulsion of oil from thematrix to the fractures. The following sections of the paper describe in detail how these items are determinedfor this analytical model.
Fracture Surface AreaKnowing the surface area of the fracture system that is available for gas to penetrate the matrix is vital tounderstanding the amount of expected recovery and the mechanisms of recovery from gas injection EOR inunconventional reservoirs. This number, however, is difficult to determine. While we cannot know the areaexactly, there are a couple of ways to estimate it: (1) a volumetric calculation using the hydraulic fracturingdata, or (2) combine the production rate data with Darcy's law for linear flow into the fractures.
As of 2018, typical wells in unconventional reservoirs tend to have 20 to 40+ stages of hydraulic fracturesand 2-5 clusters per stage, so each well may have 50 to 100 fractures per well. If we assume 200 ft halflengths and 60 ft heights for 30 stages with 2 ½ fractures per stage, that is over to 3.5 million ft2 of surfacearea for fractures to contact matrix in a well. The assumptions used here can vary significantly for differentwells in a basin, and there is even greater variability across basins, so a range of fracture area sizes is likelybetween 350,000 to 35,000,000 ft2. In some unconventional reservoirs, this number may be even larger.These numbers and geometry of induced fractures seems qualitatively comparable to the fracture systemobserved in a cored SRV from the Eagle Ford (Raterman, et al., 2018).
Another way to estimate the fracture area is to calculate it from the flow rate coming from a well. In theseunconventional reservoirs with horizontal wells and multi-stage hydraulic fractures, the flow is assumedto be linear from the matrix to the fractures. We will also assume that the fractures are propped and haveinfinite conductivity compared to the matrix, so that the pressure drop within the fractures is negligible.Early in the life of the wells, flow will come into the fractures from the matrix under transient (unsteadystate) linear flow conditions. The equation to describe this flow is given in Equation 1, which was rearrangedfrom Lee (1982) to solve for Af the fracture surface area available for flow (ft2).
(1)
The other terms are defined: q is flow rate (STB/day), B is the formation volume factor (rb/STB), Pr isthe reservoir pressure (psi), Pwf is the wellbore flowing pressure (psi), k is the permeability (md), ϕ is theporosity (−), μ is the viscosity (cp), ct is the total compressibility (1/psi), and t is time in hours. The constant16.26 accounts for unit conversions.
In this example, as discussed in the Conceptual Model section, we will assume the hydraulic fractureshave infinite acting conductivity. Early in the life of wells, the pressure drawdowns are typically 2000-4000psi. With modern completions, these wells usually produce around 1000 STB/day initially. Table 1 hastypical parameters for unconventional oil reservoirs such as the Eagle Ford.
Table 1—Unconventional reservoir/well parameters for analytical models based on Eagle Ford data.
q 1000 STB/day k 0.00001 md
B 1.5 rb/STB (10 nd)
Pr 8000 psi ϕ 6%
Pwfinit 5000 psi μ 0.3 cp
t 24 hrs (1 day) ct 1×10⁻⁵ psi−1

6 SPE-195223-MS
Using Equation 1 with the information from Table 1, the surface area of the fractures from a single wellwould be 8.9 million ft2. Incorporating a reasonable range of parameters, this number could fluctuate from1 to 50 million ft2, but 10 million ft2 provides an order of magnitude that appears reasonable.
Later in the life of a well, the pressure responses will move away from the fractures and intersect eachother (Figure 3b). Once this happens, the reservoir pressure will drop in a constant manner. This is asimplified version, but regardless of the complexity of the fractures (Figure 3a), once all pressure responseshave intersected or hit a boundary, then the flow regime changes to linear PSS. Equations 2-4 show the linearPSS flow equation for oil (El-Banbi, 1998) starting with the dimensionless flow rate, qDL. The dimensionlesstime, tDAc, and dimensional flow rate, q, are also presented.
(2)
where L is the distance to the boundary, in this case that is half the distance between fracture, and
(3)
where the parameters are same as Equation 1, but time, t, is now in days instead of hours, and
(4)
While these equations are more difficult than Equation 1, they still can be solved for the fracture surfacearea, Af. After 2 years of production (730 days), wells are often producing around 50 STB/day. Wellsare being pumped with some form of artificial lift, so the bottom hole pressures (BHP) are much lowerand constant - often around 500 to 1000 psi. The reservoir pressure has also dropped so that the pressuredifference between the reservoir and the well may still be around 3000 psi. While the values of viscosityand formation volume factor change as the pressure changes, the values in Table 1 are still reasonable evenat these lower pressures. Using the other parameters from Table 1 and Equations 2-4, the area equals 19million ft2. This is more than the area calculated from the other methods but still within an acceptable range.
We have used three different ways to determine the fracture surface area, and while there is somevariability between them, they are all within a reasonable range of uncertainty. For simplicity, we will usean average value of 10 million ft2 where it is needed for calculations, but we will also use 1 million ft2 and50 million ft2 as ranges to account for uncertainty analysis.
Gas Penetration Volumes into the MatrixWe will assume that gas can enter the matrix through two processes: advection (i.e. Darcy driven flow)and diffusion. In conventional reservoirs, diffusion is so small compared to advection that it can be safelyignore, but in unconventional reservoirs with nanoDarcy (nd) permeability, diffusion may be as importantor more important than advection.
Diffusion - Fick's LawIn this paper, the diffusion behavior is described with a simple analytical model based upon Fick's SecondLaw in one dimension:

SPE-195223-MS 7
(5)
Where C is the concentration of the solute (injected gas in this case) and D is the diffusion coefficient,which is a function of the solute, the in-situ fluid and, in this case, the porous media. Fick's Law has beensolved for numerous boundary conditions. For the situation currently under consideration, we will assumethe following conditions (Figure 4):
Figure 4—Boundary conditions for diffusion from gas filled fracture into matrix.
For these conditions, we are assuming that the injection gas can enter the matrix for the entire time of theinjection and the soak period. The solution for the conditions given above is provided by Crank (1975).
(6)
where erfc() is the complementary error function. x is the distance from the fracture and t is time; thus, wecan solve for the concentration of the solute at any given location and time.
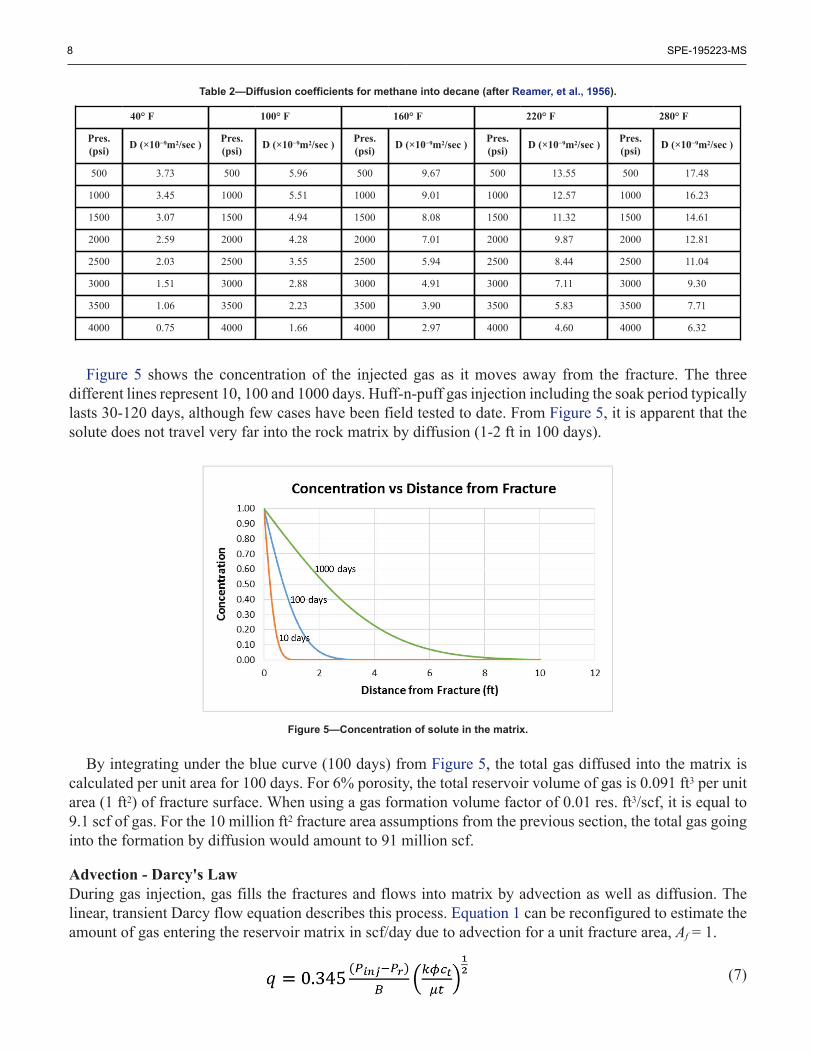
The diffusion coefficient, D, is the remaining variable to be defined for the system. Experimental results(Vega, et al., 2010; Hawthorne, et al., 2013; Tovar, et al., 2014) have shown that diffusion of injected gas intounconventional oil reservoirs is possible, but it is difficult to estimate the diffusion coefficients. Therefore,we will use traditional fluid-into-fluid diffusion experiments to determine the diffusion coefficients. Gas-into-liquid diffusion is much slower than gas-into-gas diffusion. For example, typical gas/gas diffusioncoefficients are around 1x10⁻⁴ m2/sec, while air into water or CO2 into heptane at atmospheric conditionsare 2.05x10⁻⁹ m2/sec and 6.03x10⁻⁹ m2/sec, respectively (Mostinsky, 2011). The experimental data closest toreservoir conditions that was found was a methane into decane diffusion experiment (Reamer, et al., 1956).Results of that work are shown in Table 2.
At 220° F and a pressure difference of 3000 psi (expected reservoir values), the diffusion coefficient is7.11x10−9 m2/sec.
Perkins and Johnston (1963) discuss how porous media impacts diffusion, and they provide a rule ofthumb based on rock tortuosity of Dϕ = 0.7D where Dϕ is the diffusion coefficient that accounts for porousmedia. Finally, the units of Dϕ can be converted from m2/sec to ft2/day by multiplying 86400 sec/day and10.76 ft2/m2 to get a value of Dϕ equal to 4.63x10⁻³ ft2/day. This value can be plugged into Eq. 6, and it canbe solved for the concentration of the injected gas as a function of time and distance from the fracture.
8 SPE-195223-MS
Table 2—Diffusion coefficients for methane into decane (after Reamer, et al., 1956).
40° F 100° F 160° F 220° F 280° F
Pres.(psi) D (×10−9m2/sec ) Pres.
(psi) D (×10−9m2/sec ) Pres.(psi) D (×10−9m2/sec ) Pres.
(psi) D (×10−9m2/sec ) Pres.(psi) D (×10−9m2/sec )
500 3.73 500 5.96 500 9.67 500 13.55 500 17.48
1000 3.45 1000 5.51 1000 9.01 1000 12.57 1000 16.23
1500 3.07 1500 4.94 1500 8.08 1500 11.32 1500 14.61
2000 2.59 2000 4.28 2000 7.01 2000 9.87 2000 12.81
2500 2.03 2500 3.55 2500 5.94 2500 8.44 2500 11.04
3000 1.51 3000 2.88 3000 4.91 3000 7.11 3000 9.30
3500 1.06 3500 2.23 3500 3.90 3500 5.83 3500 7.71
4000 0.75 4000 1.66 4000 2.97 4000 4.60 4000 6.32
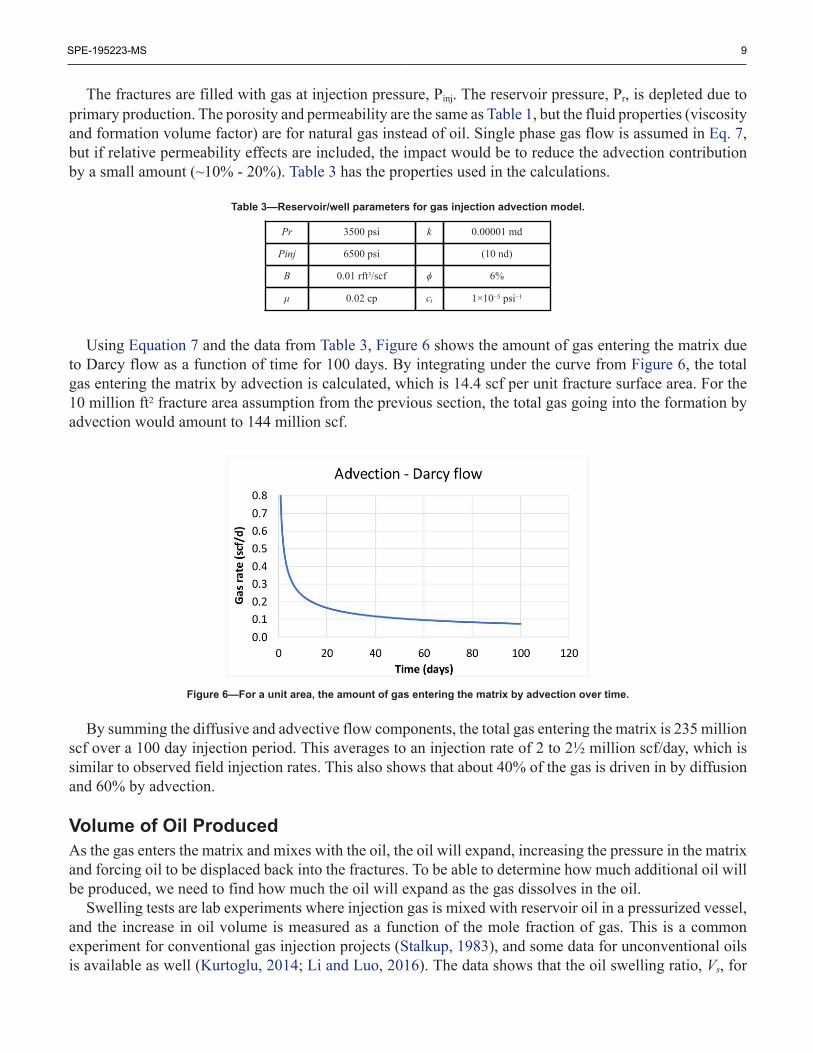
Figure 5 shows the concentration of the injected gas as it moves away from the fracture. The threedifferent lines represent 10, 100 and 1000 days. Huff-n-puff gas injection including the soak period typicallylasts 30-120 days, although few cases have been field tested to date. From Figure 5, it is apparent that thesolute does not travel very far into the rock matrix by diffusion (1-2 ft in 100 days).
Figure 5—Concentration of solute in the matrix.
By integrating under the blue curve (100 days) from Figure 5, the total gas diffused into the matrix iscalculated per unit area for 100 days. For 6% porosity, the total reservoir volume of gas is 0.091 ft3 per unitarea (1 ft2) of fracture surface. When using a gas formation volume factor of 0.01 res. ft3/scf, it is equal to9.1 scf of gas. For the 10 million ft2 fracture area assumptions from the previous section, the total gas goinginto the formation by diffusion would amount to 91 million scf.
Advection - Darcy's LawDuring gas injection, gas fills the fractures and flows into matrix by advection as well as diffusion. Thelinear, transient Darcy flow equation describes this process. Equation 1 can be reconfigured to estimate theamount of gas entering the reservoir matrix in scf/day due to advection for a unit fracture area, Af = 1.
(7)
SPE-195223-MS 9
The fractures are filled with gas at injection pressure, Pinj. The reservoir pressure, Pr, is depleted due toprimary production. The porosity and permeability are the same as Table 1, but the fluid properties (viscosityand formation volume factor) are for natural gas instead of oil. Single phase gas flow is assumed in Eq. 7,but if relative permeability effects are included, the impact would be to reduce the advection contributionby a small amount (~10% - 20%). Table 3 has the properties used in the calculations.
Table 3—Reservoir/well parameters for gas injection advection model.
Pr 3500 psi k 0.00001 md
Pinj 6500 psi (10 nd)
B 0.01 rft3/scf ϕ 6%
μ 0.02 cp ct 1×10⁻⁵ psi−1
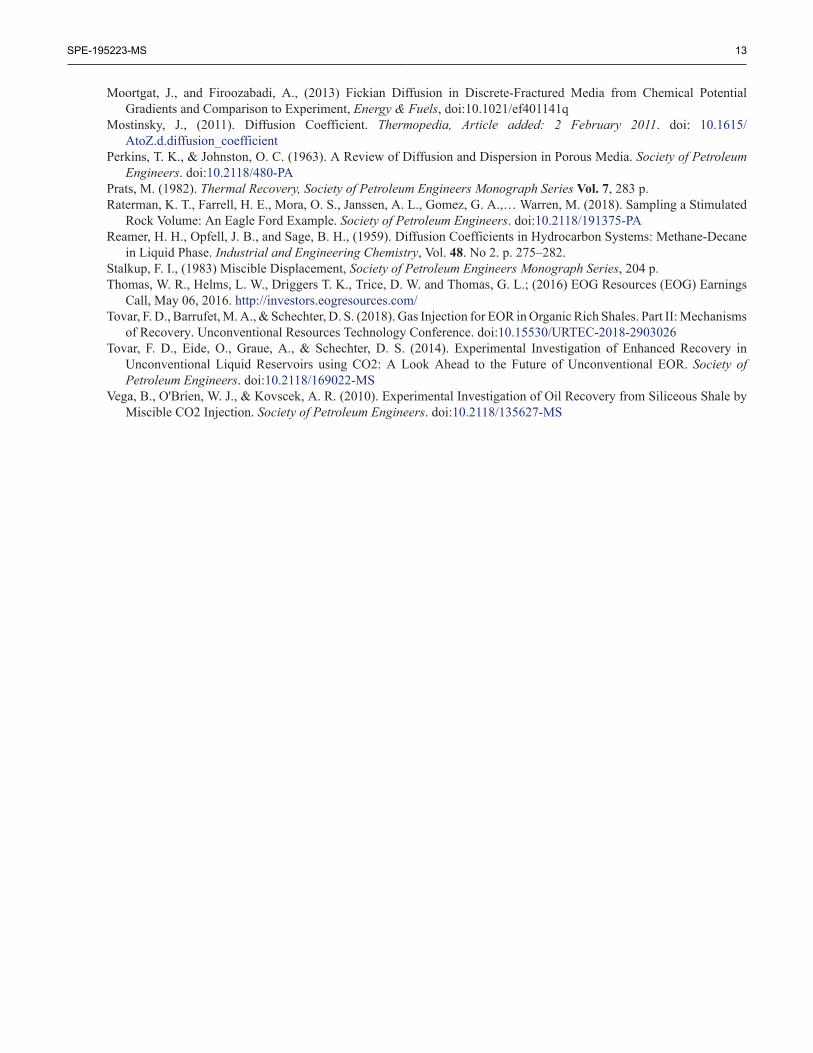
Using Equation 7 and the data from Table 3, Figure 6 shows the amount of gas entering the matrix dueto Darcy flow as a function of time for 100 days. By integrating under the curve from Figure 6, the totalgas entering the matrix by advection is calculated, which is 14.4 scf per unit fracture surface area. For the10 million ft2 fracture area assumption from the previous section, the total gas going into the formation byadvection would amount to 144 million scf.
Figure 6—For a unit area, the amount of gas entering the matrix by advection over time.
By summing the diffusive and advective flow components, the total gas entering the matrix is 235 millionscf over a 100 day injection period. This averages to an injection rate of 2 to 2½ million scf/day, which issimilar to observed field injection rates. This also shows that about 40% of the gas is driven in by diffusionand 60% by advection.
Volume of Oil ProducedAs the gas enters the matrix and mixes with the oil, the oil will expand, increasing the pressure in the matrixand forcing oil to be displaced back into the fractures. To be able to determine how much additional oil willbe produced, we need to find how much the oil will expand as the gas dissolves in the oil.
Swelling tests are lab experiments where injection gas is mixed with reservoir oil in a pressurized vessel,and the increase in oil volume is measured as a function of the mole fraction of gas. This is a commonexperiment for conventional gas injection projects (Stalkup, 1983), and some data for unconventional oilsis available as well (Kurtoglu, 2014; Li and Luo, 2016). The data shows that the oil swelling ratio, Vs, for

10 SPE-195223-MS
natural gas injection varies from 1.05 to 1.46 depending on the amount of gas mixed with the oil. For a gasmole fraction of 30%, the swelling factor, Vs, is equal to 1.2.
Using this data with the fracture surface area and gas infiltration volumes, we can determine the expectedadditional oil recovery due to the gas injection huff-n-puff process. A volumetric method is used todetermine the amount of oil impacted by the injected gas.
(8)
where Q is the cumulative oil production (STB) and d is the distance (ft) into the reservoir that the gascauses the oil to swell. Based on Figure 5, it appears that this distance is 1-2 feet. If we use a d of 1 ft, and Af
of 10 million ft2, porosity of 6%, B of 1.5 rb/STB, and Vs of 1.2, the additional production from one cycleof injection would equal 14,200 STB.
If that production is averaged over a 100 day production cycle, it would amount to 142 STB/day. Ofcourse, the rates start out higher and drop off quickly, but that provides a middle value. By using the same40/60 split between diffusion and advection from the previous section, about 5,700 STB of recovery wouldbe due to diffusion and around 8,500 STB would be due to advection.
When using the range of fracture surface areas discussed in the previous section (1 to 50 million ft2), thetotal gas entering the matrix will range from 23.5 million scf to 1.7 billion scf, and the oil recovery wouldrange from 1,420 STB to 71,000 STB.
Comparison to Field DataFigure 8 shows the oil rate from a successful gas injection huff-n-puff pilot in the Eagle Ford (Hoffman,2018). While the production data was reported per lease, here it has been normalized to a single well.Seven cycles were completed over 2 ½ years, and all cycles produced significantly more oil than primaryproduction. The cumulative oil produced from each cycle ranges from 6,000 STB to over 17,000 STB.
Figure 7—Field pilot data from Eagle Ford cyclic gas injection project.
The amount of oil recovery from this pilot is in the same range as the estimates presented from theanalytical model. While there are some simplifications in the analytical model, the favorable comparisonwith the field data provides some confidence that the results are reasonable, at least to a first orderapproximation. Furthermore, the volume of gas injected has been reported in the range of 2 to 5 million scf/day per well. This is consistent with the amount of gas going into the matrix in our calculations. We may beon the lower end of this number, but as mentioned before, if the gas injection is exceeding the uptake abilityof the matrix, that gas may be extending the fracture network to other wells, depending on the presence ofoffset wells and leak off potential to them.

SPE-195223-MS 11
DiscussionThe analytical mode proposed in this paper helps describe the process of huff-n-puff gas injection inunconventional reservoirs. The model is an obvious oversimplification of the process, but its usefulnessstems from finding numbers for the important aspects of the process, including how much and how far gasgoes into the matrix and how much additional oil recovery is expected. There are four main parts to thismodel: (1) fracture surface area, (2) gas injection by diffusion, (3) gas injection by advection and (4) oilproduction due to swelling. The issues and concerns for each one are subsequently discussed.
The fracture surface area has a huge impact on this model, and one might argue in real life too. Themore fracture surface area, the better the primary recovery (and EOR recovery), which is why companiesare designing hydraulic fracture treatments to create as much surface area as possible. Nevertheless, it is anuncertain parameter, as well, because there is no direct way to measure it, and with proppant embedment,fines migration and gas injection, it may be changing throughout time. Because of its importance anduncertainty, three different methods were used to estimate it in this paper. All gave similar sizes - millionsof square feet, but by looking at the possible ranges of input parameters, there is quite a bit of uncertaintywith these results as already stated (1 to 50 million ft2). The good news is that there is a linear relationshipbetween the fracture surface area and the model outputs, so it is easy to manage. If the fracture surface areais half, then half of the gas enters the matrix by both diffusion and advection, and half of the oil is produced,but ratio of effects remains the same.
The model used to describe diffusion in this paper is simple. More complex models exist that, for example,can account for multi-component mixing (e.g. Moortgat & Firoozabadi, 2013), but a more complex model ofdiffusion is probably not needed at this point in the work. The diffusion coefficients, have the most influenceon modeling how much diffusion is taking place, but these coefficients are not known with a high level ofaccuracy for gas injection into unconventional oils. At this point, it is probably better to keep the modelsimple and evaluate the sensitivity of the diffusion coefficients. If D is reduced by one order of magnitude to4.63x10-4 ft2/day, the gas entering the matrix due to diffusion would go from 91 million scf to 28 million scf,given the other assumptions remain the same. This amounts to 16% of the total gas going into the matrix,which is much less than the 40% contribution from the base case.
Much like the amount of gas injected due to diffusion is dominated by the diffusion coefficient, theamount of gas injected due to advection is dominated by one term, permeability. There may be 3 or moreorders of magnitude of uncertainty around matrix permeability. For higher permeability, advection becomesmore important for gas entering the matrix than diffusion, and as the permeability is lower, diffusion gainsimportance. When the matrix permeability is 1000 nd (1 μd) or higher and the diffusion coefficient is reducedby 10 times, diffusion becomes insignificant for this process, and there are microdarcy unconventionalreservoirs (i.e. Bakken) where diffusion may not be important.
In this paper, oil swelling is the principal mechanism for additional recovery. Experimental data hasshown that swelling occurs when oil from unconventional reservoirs is mixed with injection gases, andmuch of the additional recovery observed in the field can be explained by this mechanism. Furthermore,in black oil regions, it physically makes sense that mixing between the injection gas and in-situ fluids isneeded to increase recovery. That being said, other mechanisms such as viscosity reduction, vaporizationand pressure support might be important. For example, it has been reported that vaporization is the primaryrecovery mechanism for unconventional gas injection projects (Tovar, et al, 2018). In particular, as the gas-oil-ratios (GORs) vary across formations and basins, the reasons for recovery may also change. Furtherwork needs to be done to evaluate the importance of the various recovery mechanisms for huff-n-puff naturalgas injection in unconventional oil reservoirs as a function of their initial GORs and other operating andreservoir properties.

12 SPE-195223-MS
Summary / Conclusions1. Huff-n-puff gas injection has been shown to be an effective enhanced oil recovery method for
unconventional oil wells, but the process for the recovery is not well described or understood.2. We show that analytical models can be used to successfully explain and evaluate the process.3. Fracture surface area is key to assessing the recovery of both primary and EOR processes. While there
is a wide range of values, typical wells will have millions of square feet of surface area.4. During the gas injection phase, gas can enter the matrix from the fractures by both advection (Darcy
driven flow) and diffusion. We estimate that over 200 million scf of gas can enter the matrix duringa 100 day injection/soak period. Using typical reservoir and fluid parameters, it appears that 40%is due to diffusion and 60% is due to advection. Sensitivity analysis shows that these numbers varyconsiderable based on the parameters used.
5. Analytical models also show that during a 100 day production timeframe, over 14,000 STBs can beproduced due to huff-n-puff gas injection. This is consistent with field pilot data where these methodswere applied.
6. By integrating the conceptual model with the analytical models, we are able to match the field data,describe the process and have a better understanding of what is happening in the reservoir.
7. While much has been learned, significant work needs to be done to further describe mechanisms thatcontribute to recovery from huff-n-puff natural gas injection in unconventionals.
ReferencesBhandari, A.R., Flemings, P.B., Hofmann, R. and Polito P.J., (2018) Transport in Porous Media, v. 123, Iss. 1. https://
doi.org/10.1007/s11242-018-1021-6Chen, C., Balhoff, M. T., & Mohanty, K. K. (2014). Effect of Reservoir Heterogeneity on Primary Recovery and CO2
Huff "n" Puff Recovery in Shale-Oil Reservoirs. Society of Petroleum Engineers. doi:10.2118/164553-PACrank, M. (1975). The Mathematics of Diffusion: Second Edition, Oxford University Press, 414p.Downey, M. W., Garvin, J., Lagomarsino R. C., and Nicklin D. F., (2011). Quick Look Determination of Oil-in-Place
in Oil Shale Resource Plays, Eagle Ford Shale: American Association of Petroleum Geologists (AAPG) Search andDiscovery Article No. 40764.
El-Banbi, A.H., (1998) Analysis of Tight Gas Wells. Ph.D. Dissertation, Texas A&M U., College Station, Texas, 196 p.Energy Information Administration (ETA), (2015). U.S. Field Production of Crude Oil, http://www.eia.govidnav/pet/hist/
LeafHandler.ashx?n=PET&s=MCRFPUSl&f=MGherabati, S. A., Hammes, U., Male, F., & Browning, J. (2018). Assessment of Hydrocarbon in Place and Recovery
Factors in the Eagle Ford Shale Play. Society of Petroleum Engineers. doi:10.2118/189982-PAHawthorne, S. B., Gorecki, C. D., Sorensen, J. A., Steadman, E. N., Harju, J. A., & Melzer, S. (2013). Hydrocarbon
Mobilization Mechanisms from Upper, Middle, and Lower Bakken Reservoir Rocks Exposed to CO. Society ofPetroleum Engineers. doi:10.2118/167200-MS
Hoffman, B. T., (2018) Huff-n-Puff Gas Injection Pilot Projects in the Eagle Ford. Society of Petroleum Engineers.doi:10.2118/189816-MS
Hoffman, B. T. and Evans, J. G., (2016). Improved Oil Recovery (IOR) Pilot Projects in the Bakken Formation. Societyof Petroleum Engineers. doi:10.2118/180270-MS
Horne, R., (1995) Modern Well Test Analysis: A Computer Aided Approach, Petroway, 257 p.King, George E., (2014) Maximizing Recovery Factors: Improving Recovery Factors In Liquids-Rich Resource Plays
Requires New Approaches. The American Oil and Gas Reporter. https://www.aogr.com/magazine/editors-choice/archives/2019
Kurtoglu, B., (2013). Integrated Reservoir Characterization and Modeling in Support of Enhanced Oil Recovery forBakken, PhD dissertation, Colorado School of Mines, 221 p.
Lee, J., (1982) Well Testing, Society of Petroleum Engineers Textbook Series, 159 p.Li, S., and Luo, P., (2017) Experimental and Simulation Determination of Minimum Miscibility Pressure for a Bakken
Tight Oil and Different Injection Gases, Petroleum, doi:10.1016/j.petlm.2016.11.011.Mobilia, M., Lieskovsky, J. and Yan, R., (2016) Initial production rates in tight oil formations continue to rise. U.S. Energy
Information Administration. February 11, 2016 https://www.eia.gov/todayinenergy/detail.php?id=24932
SPE-195223-MS 13
Moortgat, J., and Firoozabadi, A., (2013) Fickian Diffusion in Discrete-Fractured Media from Chemical PotentialGradients and Comparison to Experiment, Energy & Fuels, doi:10.1021/ef401141q
Mostinsky, J., (2011). Diffusion Coefficient. Thermopedia, Article added: 2 February 2011. doi: 10.1615/AtoZ.d.diffusion_coefficient
Perkins, T. K., & Johnston, O. C. (1963). A Review of Diffusion and Dispersion in Porous Media. Society of PetroleumEngineers. doi:10.2118/480-PA
Prats, M. (1982). Thermal Recovery, Society of Petroleum Engineers Monograph Series Vol. 7, 283 p.Raterman, K. T., Farrell, H. E., Mora, O. S., Janssen, A. L., Gomez, G. A.,… Warren, M. (2018). Sampling a Stimulated
Rock Volume: An Eagle Ford Example. Society of Petroleum Engineers. doi:10.2118/191375-PAReamer, H. H., Opfell, J. B., and Sage, B. H., (1959). Diffusion Coefficients in Hydrocarbon Systems: Methane-Decane
in Liquid Phase. Industrial and Engineering Chemistry, Vol. 48. No 2. p. 275–282.Stalkup, F. I., (1983) Miscible Displacement, Society of Petroleum Engineers Monograph Series, 204 p.Thomas, W. R., Helms, L. W., Driggers T. K., Trice, D. W. and Thomas, G. L.; (2016) EOG Resources (EOG) Earnings
Call, May 06, 2016. http://investors.eogresources.com/Tovar, F. D., Barrufet, M. A., & Schechter, D. S. (2018). Gas Injection for EOR in Organic Rich Shales. Part II: Mechanisms
of Recovery. Unconventional Resources Technology Conference. doi:10.15530/URTEC-2018-2903026Tovar, F. D., Eide, O., Graue, A., & Schechter, D. S. (2014). Experimental Investigation of Enhanced Recovery in
Unconventional Liquid Reservoirs using CO2: A Look Ahead to the Future of Unconventional EOR. Society ofPetroleum Engineers. doi:10.2118/169022-MS
Vega, B., O'Brien, W. J., & Kovscek, A. R. (2010). Experimental Investigation of Oil Recovery from Siliceous Shale byMiscible CO2 Injection. Society of Petroleum Engineers. doi:10.2118/135627-MS