Spatiotemporal variation of methane and other trace ...
13
Environmental Science & Policy 5 (2002) 449–461 Spatiotemporal variation of methane and other trace hydrocarbon concentrations in the Valley of Mexico Felisa A. Smith a,∗ , Scott Elliott b , Donald R. Blake c , F. Sherwood Rowland c a Department of Biology, University of New Mexico, Albuquerque, NM 87131, USA b Atmospheric and Climate Sciences Group, Division of Earth and Environmental Sciences, Los Alamos National Laboratory, Los Alamos, NM 87545, USA c Department of Chemistry, Rowland Hall, University of California, Irvine, CA 92697, USA Abstract Mexico City is the world’s largest and most polluted urban center. We examine the distribution of methane and other hydrocarbons within the Valley of Mexico, using it as a model for the role developing megacities will play in the next century of geochemical cycling. Seventy-five whole air samples were analyzed with multivariate statistical techniques, including factor analysis using principal components. Methane concentrations are highly variable in space and time, due to air circulations and source distribution. Landfills and open sewage canals are major inputs. Emissions into and out from the valley are modeled to be ∼515 t per day. Per capita emission is 0.01 t per annum per person, consistent with the global average for human related anaerobic generation. Natural gas leaks are small, and likely to be higher in other developing megacities; Mexican natural gas use has been discouraged out of earthquake safety concerns. In contrast, liquefied petroleum gas loss constitutes the major emission of propane and butane estimated at a leak rate of 5–10%. Kyoto and other environmental conventions have ignored methane as a greenhouse gas. Our analysis underscores the need to consider methane and other hydrocarbons, and the urbanization process, in future emission protocols. © 2002 Elsevier Science Ltd. All rights reserved. Keywords: Mexico City; Climate forcing; Factor analysis; Source receptor analysis; Megacities 1. Introduction In 1989, the United Nations (UN, 1989) estimated that almost half the global population would be living in urban areas by the year 2000, with continued aggregation leading to an increasing number of megacities. In many ways, the Valley of Mexico can be considered an archetype of the evolution of megacities in underdeveloped countries. Until fairly recently, urban planning in Mexico City has been largely nonexistent and/or ignored, and consequently growth has been rampant, chaotic and unstructured (WHO/UNEP, 1992; Nord, 1996; Pick and Butler, 1997). Approximately 40% of citizens live in ‘informal settlements’, often with- out water, sewage or regulated utilities; additionally some >30,000 industries are located within the basin (UNCHS, 1986; WHO/UNEP, 1992; Chen and Heligman, 1994). Unregulated expansion has led to widespread pollution problems and Mexico City now has what may be the worst air quality in the world (WHO/UNEP, 1992, 1994). As ∗ Corresponding author. Tel.: +1-505-277-6725; fax: +1-505-277-0304. E-mail addresses: [email protected] (F.A. Smith), [email protected] (S. Elliott). developing areas become concerned with the aesthetic, health and environmental costs of air pollution, they have turned to cleaner burning energy sources such as natural and liquefied petroleum gas. In the Valley of Mexico, for example, power generation plants were switched from fuel oil to natural gas in 1991 because of pollution concerns (WHO/UNEP, 1992). Although natural gas releases much less carbon dioxide, particulate and sulfur dioxide than other fuels, methane is approximately 25–30 times more potent than carbon dioxide as a greenhouse species (Lelieveld and Crutzen, 1992; Lelieveld et al., 1993, 1998; WHO/UNEP, 1992). Leakage from gas infrastructures could thus offset some of the benefit of fuel substitution. The extreme air pollution problem in metropolitan Mex- ico City has attracted international research attention, but the emphasis has been on smog chemistry and the urban aerosol (Aldape et al., 1991, 1993; Miranda et al., 1994; MARI, 1994). In Spring 1993, the Rowland/Blake atmo- spheric chemistry group conducted whole air sampling of a wide spectrum of hydrocarbons, across portions of central Mexico. The species distributions have already been ana- lyzed for their relevance to local oxidant generation (e.g. Blake and Rowland, 1995; Elliott et al., 1997). Here, we 1462-9011/02/$ – see front matter © 2002 Elsevier Science Ltd. All rights reserved. PII:S1462-9011(02)00089-8
Transcript of Spatiotemporal variation of methane and other trace ...

Environmental Science & Policy 5 (2002) 449–461
Spatiotemporal variation of methane and other trace hydrocarbonconcentrations in the Valley of Mexico
Felisa A. Smitha,∗, Scott Elliottb, Donald R. Blakec, F. Sherwood Rowlandca Department of Biology, University of New Mexico, Albuquerque, NM 87131, USA
b Atmospheric and Climate Sciences Group, Division of Earth and Environmental Sciences,Los Alamos National Laboratory, Los Alamos, NM 87545, USA
c Department of Chemistry, Rowland Hall, University of California, Irvine, CA 92697, USA
Abstract
Mexico City is the world’s largest and most polluted urban center. We examine the distribution of methane and other hydrocarbonswithin the Valley of Mexico, using it as a model for the role developing megacities will play in the next century of geochemical cycling.Seventy-five whole air samples were analyzed with multivariate statistical techniques, including factor analysis using principal components.Methane concentrations are highly variable in space and time, due to air circulations and source distribution. Landfills and open sewagecanals are major inputs. Emissions into and out from the valley are modeled to be∼515 t per day. Per capita emission is 0.01 t per annumper person, consistent with the global average for human related anaerobic generation. Natural gas leaks are small, and likely to be higherin other developing megacities; Mexican natural gas use has been discouraged out of earthquake safety concerns. In contrast, liquefiedpetroleum gas loss constitutes the major emission of propane and butane estimated at a leak rate of 5–10%. Kyoto and other environmentalconventions have ignored methane as a greenhouse gas. Our analysis underscores the need to consider methane and other hydrocarbons,and the urbanization process, in future emission protocols.© 2002 Elsevier Science Ltd. All rights reserved.
Keywords:Mexico City; Climate forcing; Factor analysis; Source receptor analysis; Megacities
1. Introduction
In 1989, the United Nations (UN, 1989) estimated thatalmost half the global population would be living in urbanareas by the year 2000, with continued aggregation leadingto an increasing number of megacities. In many ways, theValley of Mexico can be considered an archetype of theevolution of megacities in underdeveloped countries. Untilfairly recently, urban planning in Mexico City has beenlargely nonexistent and/or ignored, and consequently growthhas been rampant, chaotic and unstructured (WHO/UNEP,1992; Nord, 1996; Pick and Butler, 1997). Approximately40% of citizens live in ‘informal settlements’, often with-out water, sewage or regulated utilities; additionally some>30,000 industries are located within the basin (UNCHS,1986; WHO/UNEP, 1992; Chen and Heligman, 1994).Unregulated expansion has led to widespread pollutionproblems and Mexico City now has what may be the worstair quality in the world (WHO/UNEP, 1992, 1994). As
∗ Corresponding author. Tel.:+1-505-277-6725; fax:+1-505-277-0304.E-mail addresses:[email protected] (F.A. Smith),
[email protected] (S. Elliott).
developing areas become concerned with the aesthetic,health and environmental costs of air pollution, they haveturned to cleaner burning energy sources such as naturaland liquefied petroleum gas. In the Valley of Mexico, forexample, power generation plants were switched from fueloil to natural gas in 1991 because of pollution concerns(WHO/UNEP, 1992). Although natural gas releases muchless carbon dioxide, particulate and sulfur dioxide than otherfuels, methane is approximately 25–30 times more potentthan carbon dioxide as a greenhouse species (Lelieveld andCrutzen, 1992; Lelieveld et al., 1993, 1998; WHO/UNEP,1992). Leakage from gas infrastructures could thus offsetsome of the benefit of fuel substitution.
The extreme air pollution problem in metropolitan Mex-ico City has attracted international research attention, butthe emphasis has been on smog chemistry and the urbanaerosol (Aldape et al., 1991, 1993; Miranda et al., 1994;MARI, 1994). In Spring 1993, the Rowland/Blake atmo-spheric chemistry group conducted whole air sampling of awide spectrum of hydrocarbons, across portions of centralMexico. The species distributions have already been ana-lyzed for their relevance to local oxidant generation (e.g.Blake and Rowland, 1995; Elliott et al., 1997). Here, we
1462-9011/02/$ – see front matter © 2002 Elsevier Science Ltd. All rights reserved.PII: S1462-9011(02)00089-8
450 F.A. Smith et al. / Environmental Science & Policy 5 (2002) 449–461
utilize the data to examine spatial and temporal distribu-tions of methane and other light hydrocarbons within theValley of Mexico. Multivariate statistical analysis is ap-plied to methane concentrations as well as those of severalother light alkanes, and unsaturated double bonded species.Our primary aims are to investigate hydrocarbon sourcedistributions in the Mexico City basin, and to interpretthe results in the context of currently emerging megaci-ties. We identify major methane emission types, and deriveintegrated leak rates for C3 and C4 compounds from theliquefied petroleum gas infrastructure. Mexican govern-mental agencies have discouraged reliance on natural gasas an energy source in residential areas because pipelineswould be subject to earthquake damage (Villarreal et al.,1996). Developing megacities in tectonically stable zonesmay well develop larger and leakier distribution systems aspollution concerns drive a shift from coal to petroleum gasfuels.
In addition to using multivariate techniques to investi-gate spatiotemporal variation of methane and other selectedhydrocarbon concentrations, we use factor analysis andmass conservation principles to partition chemical compo-sitions into potential sources. Results are compared withgeopolitical information on industries, landfills and otherpotential hydrocarbon emitters. The total flux of methanethrough the basin is estimated both from ‘bottom up’ and‘top down’ perspectives. Surface level emissions are com-puted based on accumulation under the nocturnal inversion;outflow is estimated based on burden and air mass turnover.The urban scale production figures are population normal-ized and compared with global averages. Coupled withgovernment consumption figures, infrastructure leak ratesare determined for LPG. Our results are interpreted in thecontext of historical patterns of urbanization within thecentral Mexican highlands. We view the flux calculationsection as extending a local analysis of atmospheric organiccomposition into the global policy arena.
2. Methods
2.1. Study area
The urban area of Mexico City (latitude 19.26N, longi-tude 99.07W) is located in a high elevation basin (∼2240 m),surrounded by mountainous terrain averaging 3500 m. Sev-eral nearby volcanic peaks exceed 5000 m in elevation. Themetropolitan area covers some 2500 km2 and is inhabitedby close to 20 million people. Population densities rangefrom 500 to 7000 persons/km2 (WHO/UNEP, 1992, 1994;Pick and Butler, 1997). There are more than 30,000 indus-tries located within the basin, and∼33% of Mexico’s GDPis produced there (WHO/UNEP, 1992, 1994). The ancientcity of Teotihuacan, located some 60 km NE of the outskirtsof Mexico City, was used as a baseline for air sampling.Methane levels there were comparable to baseline estimates
at other rural locations around the globe (Blake et al., 1984;Houghton et al., 1992, 1996).
2.2. Air sampling
Hydrocarbon measurements were obtained through wholeair sampling over a 1 week period in March 1993. Sam-ples were relatively well dispersed across the Mexico Citymetropolitan area (Fig. 1), and were taken at various timesfrom 06:00 to 21:00 h at ground level. Throughout the col-lection period, atmospheric conditions were mild, with lowvelocity winds of less than 10–20 km/h predominating. A to-tal of 75 canisters were filled, including three at Teotihuacan.The air within them was analyzed by cryogenic separation ofthe components condensable at liquid nitrogen temperature,followed by multiple-aliquot gas chromatography. Volatilehalocarbons were detected by electron capture and hydro-carbons by flame ionization (Blake et al., 1992). More than70 separate species were identified and quantitatively mea-sured. Further methodological details are presented inBlakeet al. (1992, 1996a,b,c)andBlake and Rowland (1995).
2.3. Data analysis and source receptor modeling
Data were analyzed using a variety of multivariate pro-cedures from the SPSS statistical package and advancedmodules (Norusis, 1986). Because the analysis of tracegas concentration by time phase occasionally violated theassumption of homogeneity of variance, nonparametericmethods were used to confirm important results. Factorreduction by principal components analysis was employedto help identify the potential sources of methane and othertrace hydrocarbons (Henry and Hidy, 1979, 1981; Hopke,1981, 1985; Hopke et al., 1983). Factor analysis identifies arelatively small number of factors that can be used to repre-sent the relationships among sets of correlated variables; thishelps distinguish the underlying constructs. A correlationmatrix is computed and diagonalization yields eigenvalues.These are analyzed using principal components to extractthe most parsimonious number of factors (components)that explain the interrelationships among the variables. Wehave used the normal convention of restricting the analysisto factors yielding eigenvalues >1.0; examination of factorscree plots corroborated the appropriateness of the cutoff. AVARIMAX rotation was performed to ensure componentswere orthogonal (i.e. uncorrelated with each other). Emis-sion profiles were used to help interpret the factor loadings.
We also applied conservation arguments to distinguishbetween various anthropogenic sources of methane. Ourmethod resembles the EPA sanctioned chemical mass bal-ance approach (e.g.Watson, 1983; Hopke, 1985), but isconducted at the heuristic level. Direct information on rela-tive source strengths can be obtained by conducting multipleregressions after principal component analysis. We feel thatthe uncertainties in our catalog of emission fingerprints aretoo large to warrant a formal source receptor calculation.
F.A. Smith et al. / Environmental Science & Policy 5 (2002) 449–461 451
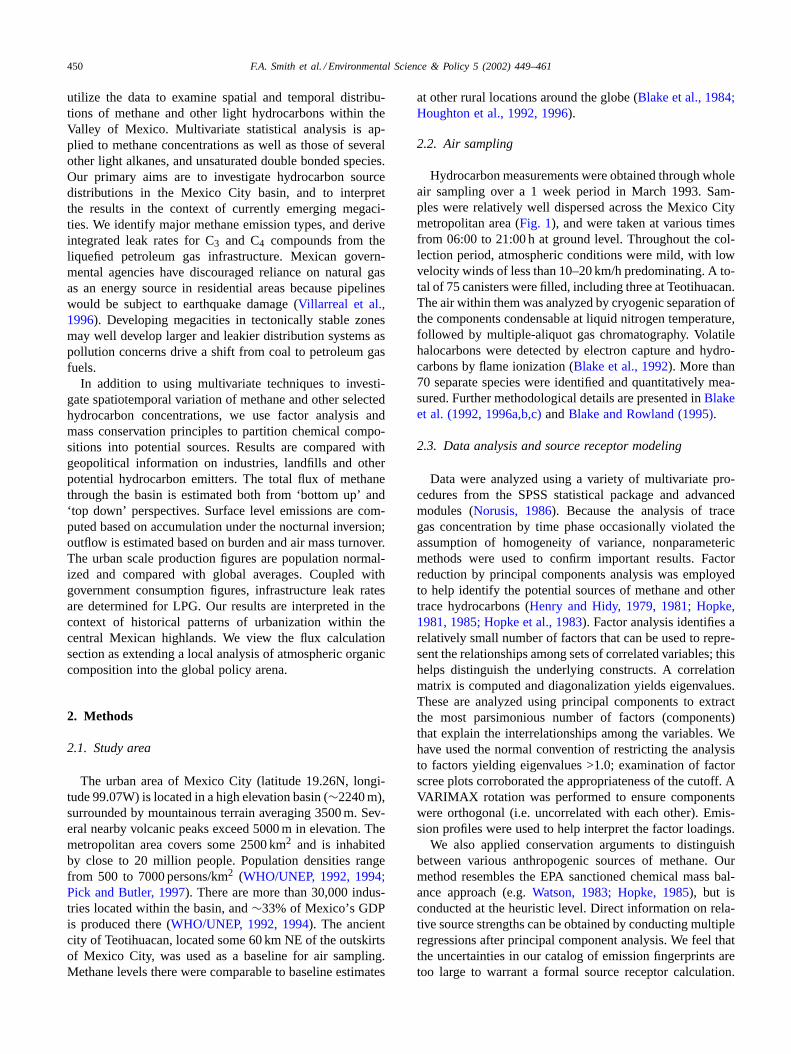
Fig. 1. Map of Mexico City and sampling localities. The urban area of Mexico City is located in a high elevation basin with several of the surroundingmountains exceeding 5000 m. The metropolitan area covers some 2500 km2 and is occupied by∼20 million people. The ancient city of Teotihuacan,located some 60 km NE of the outskirts of Mexico City, was used as a baseline for comparisons. Levels there were comparable to baseline estimates atother locations around the globe (Blake et al., 1984; Houghton et al., 1996).
452 F.A. Smith et al. / Environmental Science & Policy 5 (2002) 449–461
Further, the concentrations for key signature moleculeswere highly variable, making such estimates unreliable.
3. Results
3.1. Statistical analyses—methane
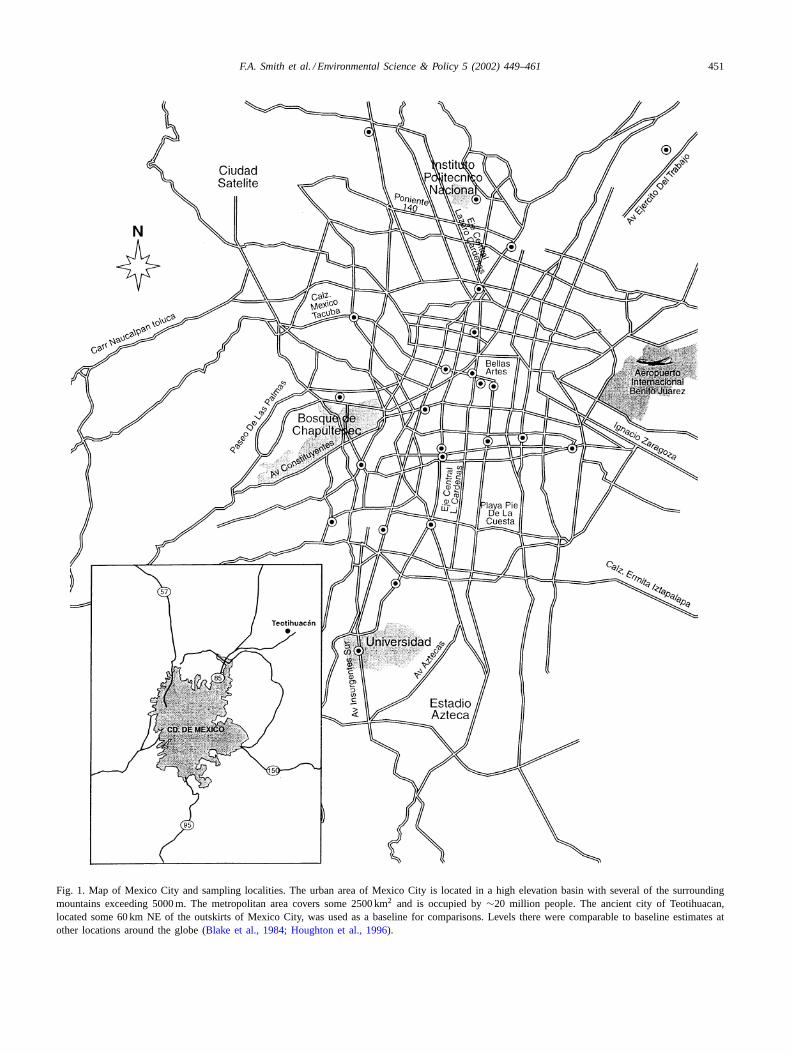
Methane concentrations in the Valley of Mexico have apredictable diurnal pattern, reflecting the underlying mete-orology and air circulation patterns (Table 1). We binnedmethane and other alkane measurements into 3 h intervalsrepresenting fairly homogeneous atmospheric conditions.Most of the variance in methane could be explained by timephase (one-way analysis of variance,P < 0.001, d.f . = 71);range tests indicated that concentrations between 03:00 and12:00 h were elevated relative to those from 12:00 to 21:00 h(Scheffle, LSD and Duncan test,P < 0.05; Fig. 2, Table 1).Because both the Bartlett Box and Cochrans C tests sug-gested that significant heterogeneity of variance existed, theanalysis was rerun using a nonparametric Kruskal–Wallisone-way ANOVA. Results were also highly significant(P < 0.001). The Spearman correlation coefficient be-tween methane concentration and time phase was−0.9429(P < 0.005, d.f . = 71). When used as a covariate, tempera-ture did not independently influence our results (ANCOVA,P > 0.05). Higher concentrations in the morning representbuild-up of methane under the nocturnal inversion layer(Elliott et al., 1997); after the layer lifts, vertical mixingresumes and levels approach background (e.g.Table 1,Fig. 2). Heterogeneity in methane concentrations has beenreported by other researchers (e.g.Riveros et al., 1995).
We also found a highly significant difference in valuesfrom within the metropolitan area and those from a nearbyrural site (the pyramids at Teotihuacan), even when data werecontrolled for time phase (e.g. one-way ANOVA on datafrom 12:00 to 15:00 h,P < 0.02, d.f . = 20; Tables 1 and2). The average methane concentration between 12:00 and15:00 h for the urban area was 2.01 ppm (±0.1478,N = 18)versus 1.78 (±0.01,N = 3) for Teotihuacan, suggesting an
Table 1Temporal variation and urban excess of several important trace hydrocarbons during the week long sampling campaign
Time period (h) N Methane (ppm) Excessa Ethane (ppb) Excess Propane (ppb) Excess
Mean σ Mean σ Mean σ
00:00–03:00 1 1.800 – 0.02 4.708 – 3.227 35.480 – 31.49903:00–06:00 8 3.336 1.555 1.553 13.105 3.856 11.624 135.198 48.589 131.21706:00–09:00 9 7.971 9.650 6.188 15.242 6.903 13.761 208.831 122.590 204.85009:00–12:00 10 2.999 1.146 1.216 15.674 5.508 14.193 115.541 64.983 111.56012:00–15:00 17 2.015 0.143 0.232 8.991 5.076 7.510 42.307 25.097 38.32615:00–18:00 18 1.942 0.104 0.159 6.424 4.323 4.923 25.288 9.617 21.30718:00–21:00 9 1.934 0.046 0.151 10.335 2.409 8.854 44.844 12.747 40.863
a “Excess” is the difference in concentrations between the Mexico City samples and those measured 60 km away at the pyramids at Teotihuacan (Fig.1). Levels of all trace gases at Teotihuacan were consistent with “normal” background levels (see text); the rural site is sufficiently distant from MexicoCity to have negligible impact from urban inputs.
Fig. 2. Variation in methane concentrations (ppm) averaged in 3 h bins.Bars indicate one standard deviation; if not shown deviations were lessthan the thickness of the bar. Values are significantly higher during themorning time periods (03:00–12:00 h) before the nocturnal inversion layerdisperses. Samples from the same sites sampled both in the morningand late-afternoon differed; atmospheric mixing results in concentrationsequivalent to background levels by mid-afternoon.
urban excess of 0.23 ppm. The urban value is consistent withmeasurements byRiveros et al. (1995); that for Teotihuacanis slightly higher than the global average of 1.72 reported bytheHoughton et al. (1992, 1996)when spatial and temporaldifferences are taken into account (e.g.Cicerone and Orem-land, 1988; Dlugokencky et al., 1994; Lelieveld et al., 1998).The urban excess calculated with the well mixed afternoonmean is comparable to other urban areas (Blake et al., 1984),although these earlier studies did not take time or transportinto account. Had the excess been estimated from the morn-
F.A. Smith et al. / Environmental Science & Policy 5 (2002) 449–461 453
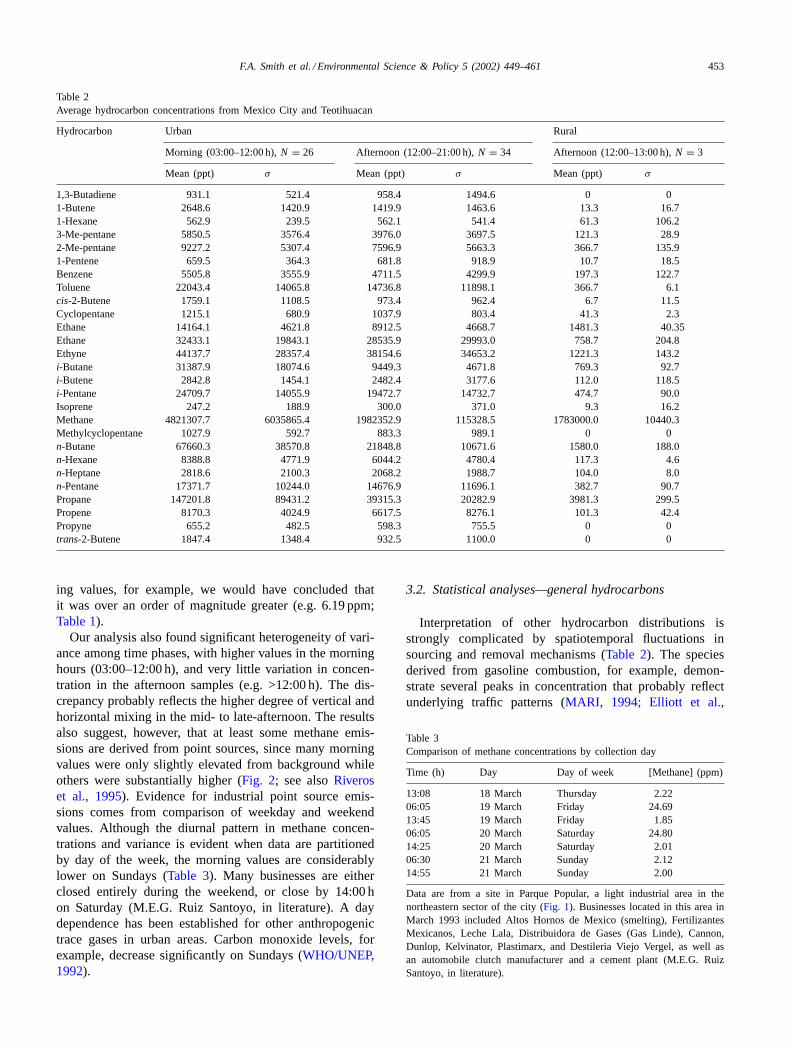
Table 2Average hydrocarbon concentrations from Mexico City and Teotihuacan
Hydrocarbon Urban Rural
Morning (03:00–12:00 h),N = 26 Afternoon (12:00–21:00 h),N = 34 Afternoon (12:00–13:00 h),N = 3
Mean (ppt) σ Mean (ppt) σ Mean (ppt) σ
1,3-Butadiene 931.1 521.4 958.4 1494.6 0 01-Butene 2648.6 1420.9 1419.9 1463.6 13.3 16.71-Hexane 562.9 239.5 562.1 541.4 61.3 106.23-Me-pentane 5850.5 3576.4 3976.0 3697.5 121.3 28.92-Me-pentane 9227.2 5307.4 7596.9 5663.3 366.7 135.91-Pentene 659.5 364.3 681.8 918.9 10.7 18.5Benzene 5505.8 3555.9 4711.5 4299.9 197.3 122.7Toluene 22043.4 14065.8 14736.8 11898.1 366.7 6.1cis-2-Butene 1759.1 1108.5 973.4 962.4 6.7 11.5Cyclopentane 1215.1 680.9 1037.9 803.4 41.3 2.3Ethane 14164.1 4621.8 8912.5 4668.7 1481.3 40.35Ethane 32433.1 19843.1 28535.9 29993.0 758.7 204.8Ethyne 44137.7 28357.4 38154.6 34653.2 1221.3 143.2i-Butane 31387.9 18074.6 9449.3 4671.8 769.3 92.7i-Butene 2842.8 1454.1 2482.4 3177.6 112.0 118.5i-Pentane 24709.7 14055.9 19472.7 14732.7 474.7 90.0Isoprene 247.2 188.9 300.0 371.0 9.3 16.2Methane 4821307.7 6035865.4 1982352.9 115328.5 1783000.0 10440.3Methylcyclopentane 1027.9 592.7 883.3 989.1 0 0n-Butane 67660.3 38570.8 21848.8 10671.6 1580.0 188.0n-Hexane 8388.8 4771.9 6044.2 4780.4 117.3 4.6n-Heptane 2818.6 2100.3 2068.2 1988.7 104.0 8.0n-Pentane 17371.7 10244.0 14676.9 11696.1 382.7 90.7Propane 147201.8 89431.2 39315.3 20282.9 3981.3 299.5Propene 8170.3 4024.9 6617.5 8276.1 101.3 42.4Propyne 655.2 482.5 598.3 755.5 0 0trans-2-Butene 1847.4 1348.4 932.5 1100.0 0 0
ing values, for example, we would have concluded thatit was over an order of magnitude greater (e.g. 6.19 ppm;Table 1).
Our analysis also found significant heterogeneity of vari-ance among time phases, with higher values in the morninghours (03:00–12:00 h), and very little variation in concen-tration in the afternoon samples (e.g. >12:00 h). The dis-crepancy probably reflects the higher degree of vertical andhorizontal mixing in the mid- to late-afternoon. The resultsalso suggest, however, that at least some methane emis-sions are derived from point sources, since many morningvalues were only slightly elevated from background whileothers were substantially higher (Fig. 2; see alsoRiveroset al., 1995). Evidence for industrial point source emis-sions comes from comparison of weekday and weekendvalues. Although the diurnal pattern in methane concen-trations and variance is evident when data are partitionedby day of the week, the morning values are considerablylower on Sundays (Table 3). Many businesses are eitherclosed entirely during the weekend, or close by 14:00 hon Saturday (M.E.G. Ruiz Santoyo, in literature). A daydependence has been established for other anthropogenictrace gases in urban areas. Carbon monoxide levels, forexample, decrease significantly on Sundays (WHO/UNEP,1992).
3.2. Statistical analyses—general hydrocarbons
Interpretation of other hydrocarbon distributions isstrongly complicated by spatiotemporal fluctuations insourcing and removal mechanisms (Table 2). The speciesderived from gasoline combustion, for example, demon-strate several peaks in concentration that probably reflectunderlying traffic patterns (MARI, 1994; Elliott et al.,
Table 3Comparison of methane concentrations by collection day
Time (h) Day Day of week [Methane] (ppm)
13:08 18 March Thursday 2.2206:05 19 March Friday 24.6913:45 19 March Friday 1.8506:05 20 March Saturday 24.8014:25 20 March Saturday 2.0106:30 21 March Sunday 2.1214:55 21 March Sunday 2.00
Data are from a site in Parque Popular, a light industrial area in thenortheastern sector of the city (Fig. 1). Businesses located in this area inMarch 1993 included Altos Hornos de Mexico (smelting), FertilizantesMexicanos, Leche Lala, Distribuidora de Gases (Gas Linde), Cannon,Dunlop, Kelvinator, Plastimarx, and Destileria Viejo Vergel, as well asan automobile clutch manufacturer and a cement plant (M.E.G. RuizSantoyo, in literature).

454 F.A. Smith et al. / Environmental Science & Policy 5 (2002) 449–461
1999). Vehicular activity in the Valley of Mexico formsa virtual square wave rising at 07:00 and falling again at22:00 h. The meteorological inversion overlaps inputs forseveral hours in the morning and evening. The dual maximaseen in monitoring data for carbon monoxide were evidentfor several compounds (Elliott et al., 1997).
The pattern of temporal variation in ethane and propaneparallels that of methane (Table 1). Concentrations of bothgases are significantly higher from 06:00 to 12:00 h thanfrom 12:00 to 18:00 h (ANOVA, d.f . = 65; P < 0.01and P < 0.001, respectively; Duncan and Scheffe mul-tiple range tests,P < 0.05). By contrast with methane,however, afternoon concentrations remain elevated and de-spite the resumption of general circulation patterns in theafternoon do not drop to background levels (e.g.Table 1).Presumably this is because the gases are reactive on freetropospheric mixing time scales (e.g.Singh and Zimmer-man, 1992; Blake et al., 1996a,b,c). They are stable priorto ventilation from the basin, however, and so are useful
Table 4Factor structure matrices for hydrocarbons within Mexico City
Hydrocarbon Morning (03:00–12:00 h),N = 26 Afternoon (12:00–21:00 h),N = 34
Factor 1 Factor 2 Factor 3 Factor 4 Factor 1 Factor 2
1,3-Butadiene 0.764 0.485 0.113 0.224 0.978 0.1251-Butene 0.909 0.316 0.205 0.149 0.964 0.2321-Hexene 0.721 0.431 0.375 −0.034 0.904 0.0733-Me-pentane 0.121 0.368 0.904 −0.006 0.744 0.4782-Me-pentane 0.195 0.414 0.872 0.489 0.847 0.4251-Pentene 0.579 0.303 0.512 −0.120 0.691 −0.004Benzene 0.232 0.728 0.511 0.244 0.913 0.374Toluene −0.031 0.164 0.953 0.047 0.713 0.644cis-2-Butene 0.980 −0.006 0.049 0.016 0.936 0.142Cyclopentane 0.316 0.581 0.741 −0.024 0.889 0.396Ethane 0.225 0.659 0.169 −0.234 0.402 0.820Ethene 0.254 0.908 0.268 0.090 0.946 0.286Ethyne 0.106 0.853 0.494 0.041 0.911 0.374i-Butane 0.888 0.223 0.198 0.199 0.192 0.949i-Butene 0.854 0.438 0.180 0.117 0.979 0.137i-Pentane 0.494 0.554 0.624 −0.087 0.904 0.348Isoprene 0.619 0.116 −0.022 0.715 0.970 0.059Methane 0.324 −0.060 −0.002 0.884 −0.127 0.887Methylcyclopentane 0.683 0.423 0.535 0.018 0.933 0.160n-Butane 0.888 0.237 0.223 0.179 0.336 0.906n-Hexane 0.220 0.615 0.519 −0.029 0.774 0.576n-Heptane 0.162 0.660 0.573 0.340 0.549 0.514n-Pentane 0.408 0.560 0.695 −0.070 0.888 0.329Propane 0.892 0.163 0.159 0.245 −0.027 0.971Propene 0.619 0.690 0.266 0.192 0.970 0.194Propyne 0.198 0.843 0.475 0.023 0.936 0.280trans-2-Butene 0.979 −0.097 −0.029 0.106 0.965 0.086
Eigenvalue 17.711 5.187 1.289 1.236 21.015 4.048Percentage of variance 63.3 18.5 4.6 4.4 75.1 14.5Cumulative explained variance 63.3 81.8 86.4 90.8 75.1 89.6
Factor analysis using principal components was conducted on morning and afternoon concentrations separately. Four factors yielded eigenvalues >1.0for the morning samples; two factors were identified from the afternoon samples. A VARIMAX rotation was performed to ensure that factors wereorthogonal. Factor loadings are analogous to standardized partial regression coefficients (e.g. the regression for methane= 0.324F1 −0.059F2 − 0.002F3
+ 0.884F4) and can be used to identify common emission sources. The largest coefficient is highlighted in bold for each hydrocarbon. Communalitiescan be calculated by summing the squares of the factor loadings for each hydrocarbon.
in our consideration of mass conservation. Since the urbanexcess is relatively large, winter tropospheric levels couldpotentially be used for reference (Singh and Zimmerman,1992); we have subtracted Teotihuacan concentrations. Theethane variance over time is much less heterogeneous thanthat of methane, suggesting that sources causing spikes inmethane concentration are ethane poor.
Reactive hydrocarbons such as the olefins were depletedduring periods of high photochemical activity (mid-day).Cloudiness was not a factor during the week long 1993sampling campaign. Located as it is in the tropics and athigh altitude, Mexico City receives high levels of ultravioletradiation for most of the year. This is one of the reasons of-ten cited for the severity of its oxidant and aerosol pollutionproblems. Short-lived species were left in the dataset dur-ing our factor analyses but are excluded from the chemicalmass balance arguments. Average urban excess concentra-tions for all hydrocarbons can readily be obtained fromTable 2.
F.A. Smith et al. / Environmental Science & Policy 5 (2002) 449–461 455
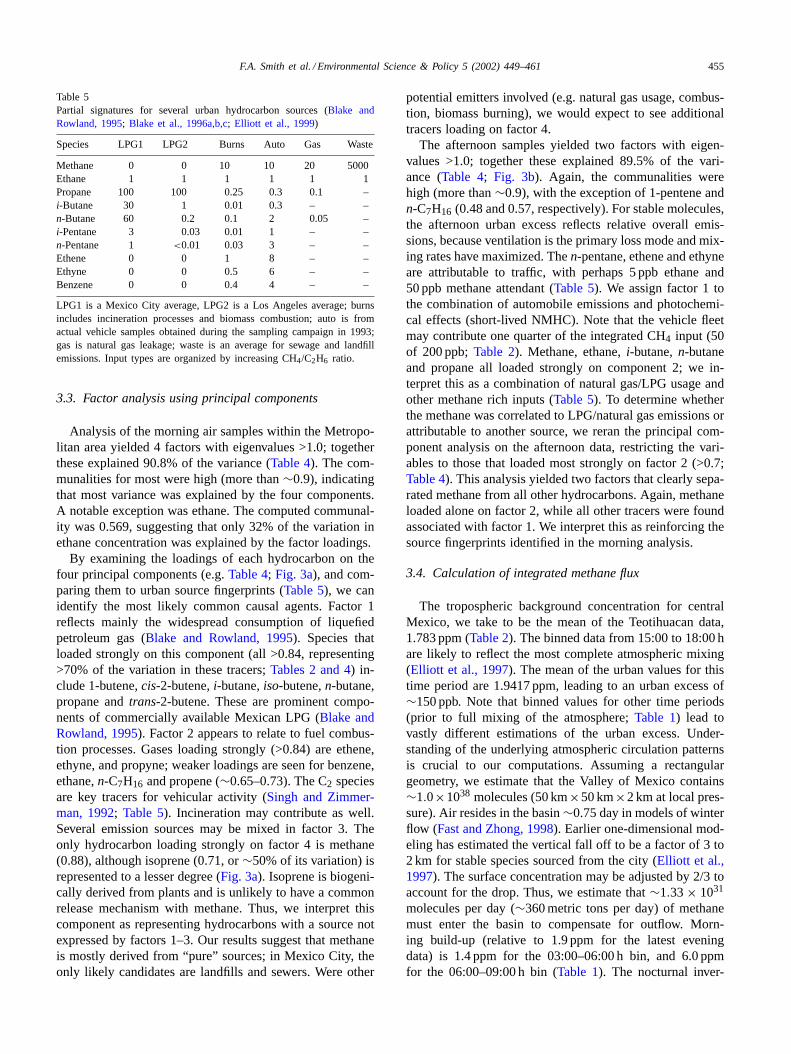
Table 5Partial signatures for several urban hydrocarbon sources (Blake andRowland, 1995; Blake et al., 1996a,b,c; Elliott et al., 1999)
Species LPG1 LPG2 Burns Auto Gas Waste
Methane 0 0 10 10 20 5000Ethane 1 1 1 1 1 1Propane 100 100 0.25 0.3 0.1 –i-Butane 30 1 0.01 0.3 – –n-Butane 60 0.2 0.1 2 0.05 –i-Pentane 3 0.03 0.01 1 – –n-Pentane 1 <0.01 0.03 3 – –Ethene 0 0 1 8 – –Ethyne 0 0 0.5 6 – –Benzene 0 0 0.4 4 – –
LPG1 is a Mexico City average, LPG2 is a Los Angeles average; burnsincludes incineration processes and biomass combustion; auto is fromactual vehicle samples obtained during the sampling campaign in 1993;gas is natural gas leakage; waste is an average for sewage and landfillemissions. Input types are organized by increasing CH4/C2H6 ratio.
3.3. Factor analysis using principal components
Analysis of the morning air samples within the Metropo-litan area yielded 4 factors with eigenvalues >1.0; togetherthese explained 90.8% of the variance (Table 4). The com-munalities for most were high (more than∼0.9), indicatingthat most variance was explained by the four components.A notable exception was ethane. The computed communal-ity was 0.569, suggesting that only 32% of the variation inethane concentration was explained by the factor loadings.
By examining the loadings of each hydrocarbon on thefour principal components (e.g.Table 4; Fig. 3a), and com-paring them to urban source fingerprints (Table 5), we canidentify the most likely common causal agents. Factor 1reflects mainly the widespread consumption of liquefiedpetroleum gas (Blake and Rowland, 1995). Species thatloaded strongly on this component (all >0.84, representing>70% of the variation in these tracers;Tables 2 and 4) in-clude 1-butene,cis-2-butene,i-butane,iso-butene,n-butane,propane andtrans-2-butene. These are prominent compo-nents of commercially available Mexican LPG (Blake andRowland, 1995). Factor 2 appears to relate to fuel combus-tion processes. Gases loading strongly (>0.84) are ethene,ethyne, and propyne; weaker loadings are seen for benzene,ethane,n-C7H16 and propene (∼0.65–0.73). The C2 speciesare key tracers for vehicular activity (Singh and Zimmer-man, 1992; Table 5). Incineration may contribute as well.Several emission sources may be mixed in factor 3. Theonly hydrocarbon loading strongly on factor 4 is methane(0.88), although isoprene (0.71, or∼50% of its variation) isrepresented to a lesser degree (Fig. 3a). Isoprene is biogeni-cally derived from plants and is unlikely to have a commonrelease mechanism with methane. Thus, we interpret thiscomponent as representing hydrocarbons with a source notexpressed by factors 1–3. Our results suggest that methaneis mostly derived from “pure” sources; in Mexico City, theonly likely candidates are landfills and sewers. Were other
potential emitters involved (e.g. natural gas usage, combus-tion, biomass burning), we would expect to see additionaltracers loading on factor 4.
The afternoon samples yielded two factors with eigen-values >1.0; together these explained 89.5% of the vari-ance (Table 4; Fig. 3b). Again, the communalities werehigh (more than∼0.9), with the exception of 1-pentene andn-C7H16 (0.48 and 0.57, respectively). For stable molecules,the afternoon urban excess reflects relative overall emis-sions, because ventilation is the primary loss mode and mix-ing rates have maximized. Then-pentane, ethene and ethyneare attributable to traffic, with perhaps 5 ppb ethane and50 ppb methane attendant (Table 5). We assign factor 1 tothe combination of automobile emissions and photochemi-cal effects (short-lived NMHC). Note that the vehicle fleetmay contribute one quarter of the integrated CH4 input (50of 200 ppb;Table 2). Methane, ethane,i-butane,n-butaneand propane all loaded strongly on component 2; we in-terpret this as a combination of natural gas/LPG usage andother methane rich inputs (Table 5). To determine whetherthe methane was correlated to LPG/natural gas emissions orattributable to another source, we reran the principal com-ponent analysis on the afternoon data, restricting the vari-ables to those that loaded most strongly on factor 2 (>0.7;Table 4). This analysis yielded two factors that clearly sepa-rated methane from all other hydrocarbons. Again, methaneloaded alone on factor 2, while all other tracers were foundassociated with factor 1. We interpret this as reinforcing thesource fingerprints identified in the morning analysis.
3.4. Calculation of integrated methane flux
The tropospheric background concentration for centralMexico, we take to be the mean of the Teotihuacan data,1.783 ppm (Table 2). The binned data from 15:00 to 18:00 hare likely to reflect the most complete atmospheric mixing(Elliott et al., 1997). The mean of the urban values for thistime period are 1.9417 ppm, leading to an urban excess of∼150 ppb. Note that binned values for other time periods(prior to full mixing of the atmosphere;Table 1) lead tovastly different estimations of the urban excess. Under-standing of the underlying atmospheric circulation patternsis crucial to our computations. Assuming a rectangulargeometry, we estimate that the Valley of Mexico contains∼1.0×1038 molecules (50 km×50 km×2 km at local pres-sure). Air resides in the basin∼0.75 day in models of winterflow (Fast and Zhong, 1998). Earlier one-dimensional mod-eling has estimated the vertical fall off to be a factor of 3 to2 km for stable species sourced from the city (Elliott et al.,1997). The surface concentration may be adjusted by 2/3 toaccount for the drop. Thus, we estimate that∼1.33× 1031
molecules per day (∼360 metric tons per day) of methanemust enter the basin to compensate for outflow. Morn-ing build-up (relative to 1.9 ppm for the latest eveningdata) is 1.4 ppm for the 03:00–06:00 h bin, and 6.0 ppmfor the 06:00–09:00 h bin (Table 1). The nocturnal inver-

456 F.A. Smith et al. / Environmental Science & Policy 5 (2002) 449–461
Fig. 3. Rotated factor loadings. (a) Morning (06:00–12:00 h). All combinations of the three significant factors are shown. (b) Afternoon (12:00–21:00 h).There were only two significant factors. SeeTable 4for explanation of loadings.
F.A. Smith et al. / Environmental Science & Policy 5 (2002) 449–461 457
sion is established at an average of 22:00 h (MARI, 1994;Elliott et al., 1997) and at heights varying from 100 to 200 m(MARI, 1994; Vidal and Raga, 1998). Here, we use a me-dian value of 150 m. Approximately 7.5 × 1036 moleculeslie below the inversion within the valley, with about halfthe basin covered by urban areas. Little horizontal mixingoccurs until the afternoon, thus, methane molecules are be-ing added to the∼3.75× 1036 molecules contained withinthe three-dimensional city atmospheric space. Build-up to04:30 h is 8.047×1029 molecules/h. The early-morning datatranslate to∼2.0 × 1031 molecules per day (∼515 metrictons per day). The values for the build-up to 07:30 h are2.38× 1030 molecules/h and 5.7 × 1031 molecules per day(∼1525 metric tons per day). Since the variance increasesas mid-day is approached, it is likely that data from earlierin the morning are more representative. The independentapproaches indicate an injection of∼515 metric tons ofmethane per day from the city into the Valley of Mexico.
The basin methane cycle can be placed in a global per-spective by normalizing to the urban population (∼17 ×106 inhabitants in 1993). Mexico City releases a total of0.011 metric tons CH4 per year per person to the regionaltroposphere from all sources [(∼515 metric tons per day×365 days)/17× 106 persons]. Our factor analysis suggeststhat the major inputs are landfills, sewage and vehicles (e.g.Tables 4 and 5). The flux thus constitutes an upper limitto human associated anaerobic production. Globally, totalper capita anthropogenic production is∼0.068 metric tonsCH4 per year per person (e.g. for 1995,∼535 × 1012 gper year/5.5× 109 persons;Cicerone and Oremland, 1988).This figure includes rice paddies, enteric fermentation, ani-mal waste, coal combustion and coal mines, none of whichare likely inputs within the Valley of Mexico. Eliminatingthese sources yields a figure of∼0.029 metric tons CH4 peryear per person, which is still almost double our estimateof the 0.011 metric tons CH4 per year per person producedin Mexico City. In fact, our figure is close to the global percapita average emissions from landfills alone (∼0.01 metrictons per year, or a total of∼60×1012 g per year;Houghtonet al., 1996). Even given uncertainties in global estimates(e.g. the range for methane from landfills is from 20× 1012
to 70× 1012 g per year;Bogner and Spokas, 1993; Bogneret al., 1997), our comparison suggests that Mexico City maybe releasinglessmethane than expected on a per capita basis.
3.5. Calculation of leak rates
Mexico City consumes approximately 500 pJ of energyper year of which 20% derives from natural gas and another20% from LPG (Villarreal et al., 1996). Methane usage is5000 t per day (carbon content fromOTA, 1991). Given thatthe natural gas signature plays only a minor role in sourcedistributions, we estimate leakage to be on the order of 1%.The efficiency may be attributed in part to the governmentdecision to restrict gas consumption to the industrial sector.Losses are comparable to those estimated for the global gas
production life cycle (Muller, 1992). At the propane/butanecarbon content (OTA, 1991), LPG combustion comes to5400 t per day. Half of the Mexico LPG is butane by moles(Elliott et al., 1999); propane combustion is then 2300 t perday. The bottom up and top down basin budget manipula-tions give 200 t per day as a city-wide propane flux. Losseswere on the order of 5–10% during the sampling period in1993. LPG services mainly the residential areas of the city.The Mexican Petroleum Institute has identified pilot lightsin cooking devices as one of the major sources of leaks (M.Ruiz, personal communication). Residential applicationsof the commercial petroleum gases are clearly a potentialweak point within energy infrastructures of the developingmegacities.
4. Discussion
The Valley of Mexico has been called the ‘heart of thenation’ not only because∼30% of the population is locatedthere, but also because it largely controls the economy, fi-nancial system, communication networks and governmentof the country (Nord, 1996; Pick and Butler, 1997). Its im-portance as a primate city is of long standing; estimates ofpreconquest population are as high as 500,000 inhabitants(Nord, 1996). Although warfare and disease introduced byEuropean conquistadors decimated the city, it remainedan important focal point for the nation. Population growthaccelerated during the Revolutionary War, as ruralites fledthe conflict and sought refuge in the city. Continued immi-gration and high birth rates since that time have lead to thecreation of the modern megacity.
The rapid urbanization in the Valley of Mexico has trans-formed the entire environment. Extensive wetlands andlakes once dominated the basin. By the 19th century, how-ever, flood control, increasing water demands, and the needfor land for construction, had drastically reduced the extentof wetlands (Nord, 1996; Pick and Butler, 1997). Thus, earlyon, human settlement drastically impacted the local methanebudget (e.g.Subak, 1994; Etheridge et al., 1998). Someswamps still exist today in the area around Lake Texcoco.These are fairly limited and are located well outside oursampling area. The land surfaces within the valley also havebeen extensively reshaped, leading to soil erosion and lossof woodlands and native vegetation. Extensive squatter set-tlements have sprung up on the periphery of the downtownarea; most are without adequate water, sewage, energy orother utilities (WHO/UNEP, 1994; Pick and Butler, 1997).The lack of infrastructure, coupled with rapid populationgrowth, has led to widespread environmental degradation.
A number of studies have examined the environmentalchallenges Mexico City faces, much of them focused on thevisible and charismatic problem of air pollution (e.g.Garfiasand Gonzalez, 1992; Nickerson et al., 1992; Ruiz-Suarezet al., 1993; Blake and Rowland, 1995; Streit and Guzman,1996; Riveros et al., 1995; Bossert, 1997; Elliott et al., 1997;

458 F.A. Smith et al. / Environmental Science & Policy 5 (2002) 449–461
Fig. 4. Location of landfills and path of water and sewage within the Mexico City metropolitan area. Figure is redrawn from the Butler/Pick MexicoDatabase (Pick and Butler, 1997). Open arrows indicate water inputs into the basin; the large filled arrow indicates the open sewage channel (the ‘GrandCanal’) by which most wastewater exists.
Vidal and Raga, 1998). We have focused here on methanebecause of its importance as a greenhouse gas forcing ter-restrial climate. Our analysis, based on rural and urbanmeasurements (Tables 1 and 2; Fig. 2), suggests the Val-ley of Mexico inputs∼515 metric tons of methane per day(∼187,975 metric tons per year) into the troposphere. Ear-lier speculation (e.g.Elliott et al., 1997, 1999) postulatedthat a leaky infrastructure could account for a substantialportion of the methane, similar to the problems found withLPG usage (Blake and Rowland, 1995). Earthquake safetyconcerns, however, have restricted residential and industrialusage of natural gas. Consequently, the gas infrastructure islimited in scope and leak rates are comparable to other urbanareas (Shorter et al., 1996; Harriss, 1994; Houghton et al.,1996). If the use of natural gas were widespread, we mightwell expect both the fractional and absolute leak rates to in-crease; maintaining a large network would be difficult underthe tight fiscal restrictions faced by Mexico and other emerg-ing megacities (Chen and Heligman, 1994; Nord, 1996).
Given the increasing switch towards cleaner fuel sources indeveloping areas (WHO/UNEP, 1992, 1994), it is clear thatmaintenance, regulation and enforcement of industries willbe essential to keep leakage at acceptable levels. It has beenestimated, for example, that leak rates during the transporta-tion, distribution and usage of natural gas must be less than2.4–2.9% to get reduction in climate forcing when switchingfrom oil to gas, and less than 4.3–5.7% to be less harmfulthan coal (Lelieveld et al., 1993).
We found significant spatial and temporal variationin methane concentrations within the Valley of Mexico(Table 1; Fig. 2). Several conclusions can be drawn. First,our results underscore the importance of understandingthe underlying air circulation patterns and meteorologywhen measurements are interpreted. Had our calculationof methane ‘urban excess’ been based on morning values,for example, we would have estimated fluxes an order ofmagnitude greater than those obtained in the afternoon.Second, the high variability in concentrations found prior to

F.A. Smith et al. / Environmental Science & Policy 5 (2002) 449–461 459
atmospheric mixing in the early-afternoon suggest at leastsome point sources for methane emissions. That some ofthese are from businesses is evidenced by their locationswithin the industrial sector of the city, and by the reducedconcentrations measured on Sundays (e.g.Figs. 1 and 4;Table 3). Nevertheless, because of Mexico City’s locationin a seismically active zone, little natural gas is actuallyused by the residential and industrial sector (Blake andRowland, 1995; Elliott et al., 1999).
Despite the presence of some point sources, principalcomponent analysis suggested that methane was derived inlarge part from pure sources (e.g.Tables 4 and 5; Fig. 3).Such potential inputs include swamps, landfills, sewage, andlosses associated with the transportation and distributionsystem. We have argued that leakage is unlikely to be theprimary cause; the C1/C2 ratios observed during the morn-ing are not consistent with substantial natural gas leakage(e.g.Table 5). Swamps are an important source of biogenicmethane, but the limited wetlands remaining probably onlycontribute in a modest way to the high urban backgroundlevels. Our factor analysis implicated landfills and sewageas the most important contributors (Table 5). Studies inLos Angeles and Boston have indicated that even in devel-oped countries, landfills and sewage are major sources ofmethane inputs (Hogan, 1993; Houghton et al., 1996). Weexpected that the amount of methane produced by landfillsand sewage would be much higher in Mexico City than otherurban areas, not only because of its much large population,but because much of it is untreated. Some 15,046 t per dayof trash was generated in Mexico City in 1992 (Pick andButler, 1997). Unlike cities in more developed countries,however, a substantial amount (� 25%) ended-up in ille-gal uncovered landfills at the southern and eastern periph-ery of the city (Pick and Butler, 1997; Fig. 4). Wastewateris disposed of through an open sewage channel called the‘Grand Canal’, and by a deep transmission system calledthe ‘Emisor Central’ built in 1960 (Fig. 4). Only a smallportion of the sewage is actually serviced by these two sys-tems, however. A recent study reported that only 44.3% ofthe area within the Federal District and 27.3% of that withinthe 17 Municipios in the metropolis are served by water andwastewater disposal systems (Pick and Butler, 1997). Theremaining effluent is released into the local environment andis known as the ‘aguas negras’, or black waters. The inad-equate sewage infrastructure was further compromised bythe 1985 earthquake, which damaged portions of the sys-tem. Despite all this, our per capita calculations suggest thatanthropogenic production of methane in Mexico City is lessthan the global average. We estimate that 0.011 metric tonsCH4 per year per person is released in the atmosphere fromall sources. This is on the order of the global per capitaaverage for landfills alone−0.002 to 0.01 metric tons CH4per year per person, with the latter value more appropri-ate because of the lack of highly controlled landfill siteswithin Mexico City (Bogner and Spokas, 1993; Houghtonet al., 1996; Bogner et al., 1997). The result is an apparent
paradox because of the well documented pollution problemsand poorly and/or marginally treated effluent and waste (e.g.WHO/UNEP, 1994). One possibility is that as poor as theurban sanitation system is, it still outperforms that of otherrural and less urbanized counterparts in other regions ofthe world. Another intriguing possibility is that the methaneburden scales nonlinearly with city size or level of develop-ment. If this is indeed the case, increased urbanization couldactuallyreduceclimate forcing in the short-term by anthro-pogenic greenhouse gases. Given the large uncertainties inglobal estimates, more study is clearly called for.
The exclusion of methane from the Kyoto mandatedemissions agreements and trading may have substantialimpacts on our ability to reduce anthropogenic climateforcing. Although found in much lower concentration in theatmosphere than carbon dioxide, its far greater potency as agreenhouse gas means that its contribution to climate forc-ing is 35–50% that of carbon dioxide (Houghton et al., 1992,1996; Lelieveld and Crutzen, 1992; Lelieveld et al., 1993,1998). Human activities are now estimated to be responsiblefor ∼70% of global methane emissions (Houghton et al.,1996; Lelieveld et al., 1998), thus, methane reduction shouldbe a major objective in greenhouse mitigation strategies. TheUnited States Climate Change Action Plan announced by theClinton Administration in 1993 identified methane reductionas a major objective (Clinton and Gore, 1993). However,new leadership in the US executive branch has increasinglyturned away from treaties while emphasizing large-scaletechnological solutions to the climate change dilemma.Thus, how effective the Bush Administration will ultimatelybe in mitigating or reducing anthropogenic environmentalimpacts remains unclear. Finally, we note that the majorityof the many studies investigating methane production and/orbudgets have focused on highly developed countries (e.g.Crill, 1991; Bogner and Spokas, 1993; Frolking and Crill,1994; Castro et al., 1995; Mosier et al., 1996). Further in-vestigations of the increasing role developing countries playin global atmospheric budgets is essential. Studies are espe-cially needed that investigate the effects of urbanization onmethane production. Moreover, our results also highlight theimportance of detailed examination of spatiotemporal vari-ation within the context of local meteorology and climate.
Acknowledgements
We thank M.E.G. Ruiz Santoyo for providing us withunpublished data on natural gas leakage and geopoliticalinformation.
References
Aldape, F., Flores, M.J., Diaz, R.V., Morales, J.R., Cahill, T.A., Saravia,L., 1991. Seasonal study of the composition of the atmospheric aerosolsin Mexico City. Int. J. PIXE 1, 355–371.

460 F.A. Smith et al. / Environmental Science & Policy 5 (2002) 449–461
Aldape, F., Flores, M.J., Diaz, R.V., Crumpton, D., 1993. Temporalvariations in elemental concentrations of atmospheric aerosols inMexico City. Nucl. Instrum. Methods Phys. Res. 75 (Section B), 304–307.
Blake, D.R., Rowland, F.S., 1995. Urban leakage of liquefied petroleumgas and its impact on Mexico City air quality. Science 269, 953–956.
Blake, D.R., Woo, V.H., Tyler, S.C., Rowland, F.S., 1984. Methaneconcentrations and source strengths in urban locations. Geophys. Res.Lett. 11, 1211–1214.
Blake, D.R., Hurst, D.F., Tyrrel, W., Smith, W., Whipple, W.J., Chen,T.Y., Blake, N.J., Rowland, F.S., 1992. Summertime measurements ofselected nonmethane hydrocarbons in the arctic and subarctic duringthe 1988 Arctic Boundary Layer Expedition. J. Geophys. Res. 97,16559–16588.
Blake, D.R., Blake, N.J., Smith, T.W., Wingenter, O.W., Rowland, F.S.,1996a. Nonmethane hydrocarbon and halocarbon distributions duringAtlantic Stratocumulus Transition Experiment June 1992. J. Geophys.Res. 101, 4501–4514.
Blake, D.R., Chen, T.Y., Smith, T.W., Wang, C.J.L., Wingenter, O.W.,Blake, N.J., Rowland, F.S., 1996b. Three-dimensional distributionof nonmethane hydrocarbons and halocarbons over the northwesternPacific during the 1991 Pacific Exploratory Mission (PEM West A).J. Geophys. Res. 101, 1763–1778.
Blake, N.J., Blake, D.R., Sive, B.C., Chen, T.Y., Rowland, F.S., 1996c.Biomass burning emissions and vertical distribution of atmosphericmethyl halides and other reduced carbon gases in the south Atlanticregion. J. Geophys. Res. 101, 24151–24164.
Bogner, J., Spokas, K., 1993. Landfill methane: rates, fates, and role inglobal carbon cycle. Chemosphere 26, 369–386.
Bogner, J., Meadows, M., Czepiel, P., 1997. Fluxes of methane betweenlandfills and the atmosphere: natural and engineered controls. Soil UseManage. 13, 268–277.
Bossert, J.E., 1997. An investigation of flow regimes affecting the MexicoCity region. J. Appl. Meteorol. 36, 119–140.
Castro, M.S., Steudler, P.A., Melillo, J.M., Aber, J.D., Bowden, R.D.,1995. Factors controlling atmospheric methane consumption bytemperate forest soils. Global Biogeochem. Cycles 9, 1–10.
Chen, N.Y., Heligman, L., 1994. Growth of the world’s megalopolises.In: Fuchs, R.J., Brennan, E., Chamie, J., Lo, F., Uitto, J.I. (Eds.),Mega-City Growth and the Future. United Nations University Press,Tokyo.
Cicerone, R.J., Oremland, R.S., 1988. Biogeochemical aspects ofatmospheric methane. Global Biogeochem. Cycles 2, 299–327.
Clinton, W.J., Gore Jr., A., 1993. The Climate Change Action Plan.Washington, DC.
Crill, R.M., 1991. Seasonal patterns of methane uptake and carbon dioxiderelease by a temperate woodland soil. Global Biogeochem. Cycles 5,319–334.
Dlugokencky, E.J., Steele, L.P., Lang, P.M., Masarie, K.A., 1994. Thegrowth-rate and distribution of atmospheric methane. J. Geophys. Res.:Atmos. 99, 17021–17043.
Elliott, S., Blake, D.R., Rowland, F.S., Lu, R., Brown, M.J., Williams,M.D., Russell, A.G., Bossert, J.E., Streit, G.E., Santoyo, M.R., Guzman,F., Porch, W.M., McNair, L.A., Keyantash, J., Kao, C.Y.J., Turco,R.P., Eichinger, W.E., 1997. Ventilation of liquefied petroleum gascomponents from the Valley of Mexico. J. Geophys. Res.: Atmos. 102,211997–212007.
Elliott, S., Blake, D.R., Bossert, J.E., Chow, J., Colina, J.A., Dubey,M., Duce, R.A., Edgerton, S., Gaffney, J., Gupta, M., Guzman, F.,Matson, P.A., McNair, L.A., Ortiz, E., Riley, W., Rowland, F.S., Ruiz,M.E., Russell, A.G., Smith, F.A., Sosa, G., Streit, G., Watson, J.,1999. Mexico City and the biogeochemistry of global urbanization.Los Alamos Report LA-13516-MS, Los Alamos National Laboratory.
Etheridge, D.M., Steele, L.P., Francey, R.J., Langenfelds, R.L., 1998.Atmospheric methane between 1000a.d. and present: evidence ofanthropogenic emissions and climate variability. J. Geophys. Res. 103,15979–15993.
Fast, J., Zhong, S., 1998. Meteorological factors associated withinhomogeneous ozone concentrations within the Mexico City basin. J.Geophys. Res. 103, 18927–18946.
Frolking, S., Crill, P., 1994. Climate controls on temporal variabilityof methane flux from a poor fen in Southeastern New Hampshire,measurement and modeling. Global Biogeochem. Cycles 8, 385–397.
Garfias, J., Gonzalez, R., 1992. Air quality in Mexico City. In: Dunnette,D.A., O’Brien, R.J. (Eds.), The Science of Global Change: The Impactof Human Activities on the Environment. American Chemical Society,Washington, DC.
Harriss, R., 1994. Reducing urban sources of methane: an experimentin industrial ecology. In: Socolow, R., Andrews, C., Berkhout, F.,Thomas, V. (Eds.), Industrial Ecology and Global Change. CambridgeUniversity Press, Cambridge, MA.
Henry, R.C., Hidy, G.M., 1979. Multivariate analysis of particulate sulfateand other air quality variables by principal components. Part I. Annualdata from Los Angeles and New York. Atmos. Environ. 13, 1581–1586.
Henry, R.C., Hidy, G.M., 1981. Multivariate analysis of particulate sulfateand other air quality variables by principal components. II. Salt LakeCity, Utah and St. Louis, Missouri. Atmos. Environ. 16, 929–943.
Hogan, K.B. (Ed.), 1993. Anthropogenic methane emissions in the UnitedStates: estimates for 1990. United States Environmental ProtectionAgency, Office of Air and Radiation Report Number 430-R-93-003,Washington, DC.
Hopke, P.K., 1981. The application of factor analysis to urban aerosolsource resolution. In: Macias, E.S., Hopke, P.K. (Eds.), AtmosphericAerosol: Source/Air Quality Relationships. Symposium Series No. 167,American Chemical Society, Washington, DC.
Hopke, P.K., 1985. Receptor Modeling in Environmental Chemistry. Wiley,New York.
Hopke, P.K., Severin, K.G., Chang, S.N., 1983. Application andverification studies of target transformation factor analysis as an aerosolreceptor model. In: Dattner, S.L., Hopke, P.K. (Eds.), Receptor ModelsApplied to Contemporary Pollution Problems. Air Pollution ControlAssociation, Pittsburgh, PA.
Houghton, J.T., Callander, B.A., Varney, S.K., 1992. Climate Change1992: The Supplementary Report to the IPCC Scientific Assessment.Cambridge University Press, New York.
Houghton, J.T., Meira Filho, L.G., Callander, B.A., Harris, N., Kattenberg,A., Maskell, K., 1996. Climate Change 1995: The Science of ClimateChange. Cambridge University Press, New York.
Lelieveld, J., Crutzen, P.J., 1992. Indirect chemical effects of methane onclimate warming. Nature 355, 339–342.
Lelieveld, J., Crutzen, P.J., Bruhl, C., 1993. Climate effects of atmosphericmethane. Chemosphere 26, 739–768.
Lelieveld, J., Crutzen, P.J., Dentener, F.J., 1998. Changing concentration,lifetime and climate forcing of atmospheric methane. Tellus Ser. B:Chem. Phys. Meteorol. 50, 128–150.
Mexico City Air Quality Research Initiative (MARI), 1994. The MexicoCity air quality research initiative. Los Alamos National Lab ReportLA-12699, Los Alamos.
Miranda, J., Cahill, T.A., J, R., Aldape, F., Flores, M.J., Diaz, R.V., 1994.Determination of elemental concentrations in atmospheric aerosolsin Mexico City using proton induced X-ray emission, proton elasticscattering, and laser absorption. Atmos. Environ. 28, 2299–2306.
Mosier, A.R., Parton, W.J., Valentine, D.W., Ojima, D.S., Schimel,D.S., Delgado, J.A., 1996. CH4 and N2O fluxes in the Coloradoshortgrass steppe. 1. Impact of landscape and nitrogen addition. GlobalBiogeochem. Cycles 10, 387–399.
Muller, J.F., 1992. Geographic distribution and seasonal variation ofsurface emissions and deposition velocities of atmospheric trace gases.J. Geophys. Res. 97, 3787–3804.
Nickerson, E.C., Sosa, G., Hochstein, H., McCaslin, P., Luke, W., Schanot,A., 1992. Project Aguila: in situ measurements of Mexico City airpollution by a research aircraft. Atmos. Environ. 26B, 445.
Nord, B., 1996. Mexico City’s Alternative Futures. University Press ofAmerica, Lanham.

F.A. Smith et al. / Environmental Science & Policy 5 (2002) 449–461 461
Norusis, M.J., 1986. SPSS/PC+ Advanced Statistics. SPSS Incorporated,Chicago.
Office of Technology Assessment of the United States Congress (OTA),1991. Changing by Degrees: Steps to Reduce Greenhouse Gases. CutterInformation Corporation, Arlington.
Pick, J.B., Butler, E.W., 1997. Mexico Megacity. Westview Press, Boulder,CO.
Riveros, H.G., Tejeda, J., Ortiz, L., Julian-Sanchez, A., Riveros-Rosas,H., 1995. Hydrocarbons and carbon monoxide in the atmosphere ofMexico City. J. Air Waste Manage. 45, 973–980.
Ruiz-Suarez, J.C., Ruiz-Suarez, L.G., Gay, C., Castro, T., Montero, M.,Eidels-Duvoboi, S., Muhlia, A., 1993. Photolytic rates for NO2, O3 andHCHO in the atmosphere of Mexico City. Atmos. Environ. 27A, 427.
Shorter, J.H., McManus, J.B., Kolb, C.E., Allwine, E.J., Lamb, B.K.,Mosher, B.W., Harriss, R.C., Partchatka, U., Fischer, H., Harris, G.W.,Crutzen, P.J., Karback, H., 1996. Methane emission measurements inurban areas in eastern Germany. J. Atmos. Chem. 24, 121–140.
Singh, H.B., Zimmerman, P.B., 1992. Atmospheric distribution andsources of nonmethane hydrocarbons. In: Nriagu, J.O. (Ed.), GaseousPollutants: Characterization and Cycling. Wiley, New York, NY.
Streit, G.E., Guzman, F., 1996. Mexico City air quality: progress of aninternational collaborative project to define air quality managementoptions. Atmos. Environ. 30, 723–733.
Subak, S., 1994. Methane from the house-of-Tudor and the Ming-Dynasty:anthropogenic emissions in the 16th century. Chemosphere 29, 843–854.
United Nations (UN), 1989. Prospects of World Urbanization 1988.Population Studies No. 112, New York.
United Nations Centre for Human Settlements (UNCHS), 1986. GlobalReport on Human Settlements 1986. United Nations, New York.
Vidal, H.P., Raga, G.B., 1998. On the vertical distribution of pollutantsin Mexico City. Atmosfera 11, 95–108.
Villarreal, O.E., Quiroz, C.C., Lillo, J.C., Ramierz, J.R., 1996. Programapara mejorar la calidad del aire en el Valle de Mexico. Departamentodel Distrito Federal, Mexico City, D.F.
Watson, J.G., 1983. Overview of receptor model principles. In: Dattner,S.L., Hopke, P.K. (Eds.), Receptor Models Applied to ContemporaryPollution Problems. Air Pollution Control Association, Pittsburgh, PA.
World Health Organization/United Nations Environment Programme(WHO/UNEP), 1992. Urban Air Pollution in Megacities of the World.World Health Organization, United Nations Environment Programme,Blackwell, Oxford.
World Health Organization/United Nations Environment Programme(WHO/UNEP), 1994. Air Pollution in the World’s Megacities.Environment 36, 4–37.
Felisa A. Smith is a research associate professor in the Department ofBiology at the University of New Mexico. Her interests in Urban EcologyCenter around the scaling of various inputs and outputs (particularlyenergy usage) with city size. She is also keenly interested in the responseof organisms to past and present climate change. Currently she is usingwoodrat paleomiddens to investigate the impact of climate change on theecology and evolution of mammals over the late-Quaternary.
Scott Elliott is a biogeochemistry researcher in the Earth and Environ-mental Sciences Division at Los Alamos National Laboratory. His groupstudies several global scale geocycling issues including the role of urban-ization in driving regional ozone/aerosol distribution changes, and linksfrom air pollution to ecodynamics on land and in the sea. Elliott andcompany also develop fine resolution global simulations of elemental pro-cessing by marine ecosystems, in the Los Alamos eddy resolving oceancirculation models.
Donald R. Blake is an analytical atmospheric chemist at the Univer-sity of California, Irvine. His group performs gas chromatography onair samples from around the world, in order to determine tropospherictrace hydrocarbon concentrations and distributions. Blake and colleaguesparticipate in multiple ground based and aircraft atmospheric chemistrymeasurement campaigns per year. Their results have helped to elucidateglobal atmospheric methane increases and the contribution of megacitiesto regional photooxidation processes.
F. Sherwood Rowland began his career in the late-1950s and early-1960sas a hot atom chemist. He and his group performed intermittent atmo-spheric and environmental studies during this period. In the mid-1970swhile working with then post-doctoral fellow Mario Molina, Rowlanddiscovered the potential for chlorine originating from anthropogenic halo-carbons to enter the stratosphere and catalyze massive, world-wide ozonedepletion. His group rapidly evolved into a general atmospheric trace gasmeasurements facility. Rowland was awarded the Nobel Prize in chem-istry in 1995 for his pioneering work on ozone.