Spatiotemporal Transmission and Determinants of Typhoid ... · Spatiotemporal Transmission and...
9
Spatiotemporal Transmission and Determinants of Typhoid and Paratyphoid Fever in Hongta District, Yunnan Province, China Jin-Feng Wang 1 *, Yan Wang 1 , Jing Zhang 2 *, George Christakos 3 , Jun-Ling Sun 2 , Xin Liu 1 , Lin Lu 4 , Xiao- Qing Fu 4 , Yu-Qiong Shi 5 , Xue-Mei Li 5 1 State Key Laboratory of Resources and Environmental Information System, Institute of Geographic Sciences and Natural Resources Research, Chinese Academy of Sciences, Beijing, China, 2 Chinese Center for Disease Control and Prevention, Beijing, China, 3 Department of Geography, San Diego State University, San Diego, California, United States of America, and College of Environment & Natural Resources, Zhejiang University, Hangzhou, China, 4 Yunnan Provincial Center for Disease Control and Prevention, Kunming, Yunnan, China, 5 Center for Disease Control and Prevention of Hongta District, Yuxi, Yunnan, China Abstract Background: Typhoid and paratyphoid fever are endemic in Hongta District and their prevalence, at 113 per 100,000 individuals, remains the highest in China. However, the exact sources of the disease and its main epidemiological characteristics have not yet been clearly identified. Methods and Findings: Numbers of typhoid and paratyphoid cases per day during the period 2006 to 2010 were obtained from the Chinese Center of Disease Control (CDC). A number of suspected disease determinants (or their proxies), were considered for use in spatiotemporal analysis: these included locations of discharge canals and food markets, as well as socio-economic and environmental factors. Results showed that disease prevalence was spatially clustered with clusters decreasing with increasing distance from markets and discharge canals. More than half of the spatial variance could be explained by a combination of economic conditions and availability of health facilities. Temporal prevalence fluctuations were positively associated with the monthly precipitation series. Polluted hospital and residential wastewater was being discharged into rainwater canals. Salmonella bacteria were found in canal water, on farmland and on vegetables sold in markets. Conclusion: Disease transmission in Hongta district is driven principally by two spatiotemporally coupled cycles: one involving seasonal variations and the other the distribution of polluted farmland (where vegetables are grown and sold in markets). Disease transmission was exacerbated by the fact that rainwater canals were being used for disposal of polluted waste from hospitals and residential areas. Social factors and their interactions also played a significant role in disease transmission. Citation: Wang J-F, Wang Y, Zhang J, Christakos G, Sun J-L, et al. (2013) Spatiotemporal Transmission and Determinants of Typhoid and Paratyphoid Fever in Hongta District, Yunnan Province, China. PLoS Negl Trop Dis 7(3): e2112. doi:10.1371/journal.pntd.0002112 Editor: Joseph M. Vinetz, University of California San Diego School of Medicine, United States of America Received September 12, 2012; Accepted January 29, 2013; Published March 14, 2013 Copyright: ß 2013 Wang et al. This is an open-access article distributed under the terms of the Creative Commons Attribution License, which permits unrestricted use, distribution, and reproduction in any medium, provided the original author and source are credited. Funding: This study was supported by the following grants: MOST (2012CB955503; 2011AA120305; 2009ZX10004-201; 200802025), and NSFC (41023010; 41271404). The funders had no role in study design, data collection and analysis, decision to publish, or preparation of the manuscript. Competing Interests: The authors have declared that no competing interests exist. * E-mail: [email protected] (JFW); [email protected] (JZ) Introduction Typhoid and paratyphoid fever are serious infections, particu- larly in low-income countries, causing about 16 million cases and 600,000 deaths annually worldwide [1]. These diseases are notorious for their high infection rate, long duration, and heavy health burden. In China, typhoid and paratyphoid have been recorded daily since 2004 by the National Infectious Diseases Reporting Information System (NIDRIS) of the Chinese CDC, which enables all health care institutes across the country to report individual case information of important infectious diseases in real time using the Internet. Typhoid and paratyphoid fever are now regarded as being under control nationwide, and during 2010 the national disease incidence was 1.2 per 100,000.However, preva- lence, varied considerably from place to place with the highest incidence of 113 per 100,000,occurringinHongta district of Yunnan province in southwestern China [2,3]. Water and food sanitation and environmental awareness generally can effectively reduce food and water borne diseases. A total of 3538 cases of typhoid and paratyphoid fever were reported in Hongta district during the period 2006–2010. Sanitation conditions in general are better for Hongta residents than for people in other parts of the province: a previous investigation showed that 50% of the population did not drink unboiled water, 91% washed their hands before dinner and 79% washed fruit before eating it. The case-control study [4], which included80 pairs of cases and controls, showed that adding fresh mint (OR = 2.17, 95%CL: 1.04–4.54) to breakfast, eating uncooked vegetables (OR = 2.29, 95%CL: 1.24–4.24) at restau- rants or roadside food sites, and eating flavoring that contained PLOS Neglected Tropical Diseases | www.plosntds.org 1 March 2013 | Volume 7 | Issue 3 | e2112
Transcript of Spatiotemporal Transmission and Determinants of Typhoid ... · Spatiotemporal Transmission and...

Spatiotemporal Transmission and Determinants ofTyphoid and Paratyphoid Fever in Hongta District,Yunnan Province, ChinaJin-Feng Wang1*, Yan Wang1, Jing Zhang2*, George Christakos3, Jun-Ling Sun2, Xin Liu1, Lin Lu4, Xiao-
Qing Fu4, Yu-Qiong Shi5, Xue-Mei Li5
1 State Key Laboratory of Resources and Environmental Information System, Institute of Geographic Sciences and Natural Resources Research, Chinese Academy of
Sciences, Beijing, China, 2 Chinese Center for Disease Control and Prevention, Beijing, China, 3 Department of Geography, San Diego State University, San Diego,
California, United States of America, and College of Environment & Natural Resources, Zhejiang University, Hangzhou, China, 4 Yunnan Provincial Center for Disease
Control and Prevention, Kunming, Yunnan, China, 5 Center for Disease Control and Prevention of Hongta District, Yuxi, Yunnan, China
Abstract
Background: Typhoid and paratyphoid fever are endemic in Hongta District and their prevalence, at 113 per 100,000individuals, remains the highest in China. However, the exact sources of the disease and its main epidemiologicalcharacteristics have not yet been clearly identified.
Methods and Findings: Numbers of typhoid and paratyphoid cases per day during the period 2006 to 2010 were obtainedfrom the Chinese Center of Disease Control (CDC). A number of suspected disease determinants (or their proxies), wereconsidered for use in spatiotemporal analysis: these included locations of discharge canals and food markets, as well associo-economic and environmental factors. Results showed that disease prevalence was spatially clustered with clustersdecreasing with increasing distance from markets and discharge canals. More than half of the spatial variance could beexplained by a combination of economic conditions and availability of health facilities. Temporal prevalence fluctuationswere positively associated with the monthly precipitation series. Polluted hospital and residential wastewater was beingdischarged into rainwater canals. Salmonella bacteria were found in canal water, on farmland and on vegetables sold inmarkets.
Conclusion: Disease transmission in Hongta district is driven principally by two spatiotemporally coupled cycles: oneinvolving seasonal variations and the other the distribution of polluted farmland (where vegetables are grown and sold inmarkets). Disease transmission was exacerbated by the fact that rainwater canals were being used for disposal of pollutedwaste from hospitals and residential areas. Social factors and their interactions also played a significant role in diseasetransmission.
Citation: Wang J-F, Wang Y, Zhang J, Christakos G, Sun J-L, et al. (2013) Spatiotemporal Transmission and Determinants of Typhoid and Paratyphoid Fever inHongta District, Yunnan Province, China. PLoS Negl Trop Dis 7(3): e2112. doi:10.1371/journal.pntd.0002112
Editor: Joseph M. Vinetz, University of California San Diego School of Medicine, United States of America
Received September 12, 2012; Accepted January 29, 2013; Published March 14, 2013
Copyright: � 2013 Wang et al. This is an open-access article distributed under the terms of the Creative Commons Attribution License, which permitsunrestricted use, distribution, and reproduction in any medium, provided the original author and source are credited.
Funding: This study was supported by the following grants: MOST (2012CB955503; 2011AA120305; 2009ZX10004-201; 200802025), and NSFC (41023010;41271404). The funders had no role in study design, data collection and analysis, decision to publish, or preparation of the manuscript.
Competing Interests: The authors have declared that no competing interests exist.
* E-mail: [email protected] (JFW); [email protected] (JZ)
Introduction
Typhoid and paratyphoid fever are serious infections, particu-
larly in low-income countries, causing about 16 million cases and
600,000 deaths annually worldwide [1]. These diseases are
notorious for their high infection rate, long duration, and heavy
health burden. In China, typhoid and paratyphoid have been
recorded daily since 2004 by the National Infectious Diseases
Reporting Information System (NIDRIS) of the Chinese CDC,
which enables all health care institutes across the country to report
individual case information of important infectious diseases in real
time using the Internet. Typhoid and paratyphoid fever are now
regarded as being under control nationwide, and during 2010 the
national disease incidence was 1.2 per 100,000.However, preva-
lence, varied considerably from place to place with the highest
incidence of 113 per 100,000,occurringinHongta district of
Yunnan province in southwestern China [2,3].
Water and food sanitation and environmental awareness
generally can effectively reduce food and water borne diseases.
A total of 3538 cases of typhoid and paratyphoid fever were
reported in Hongta district during the period 2006–2010.
Sanitation conditions in general are better for Hongta residents
than for people in other parts of the province: a previous
investigation showed that 50% of the population did not drink
unboiled water, 91% washed their hands before dinner and 79%
washed fruit before eating it. The case-control study [4], which
included80 pairs of cases and controls, showed that adding fresh
mint (OR = 2.17, 95%CL: 1.04–4.54) to breakfast, eating
uncooked vegetables (OR = 2.29, 95%CL: 1.24–4.24) at restau-
rants or roadside food sites, and eating flavoring that contained
PLOS Neglected Tropical Diseases | www.plosntds.org 1 March 2013 | Volume 7 | Issue 3 | e2112
fresh caraway and mint (OR = 2.38, 95%CL: 1.00–5.69) are all
risk factors for typhoid and paratyphoid fever in the Hongta
district. The incidence reaches its highest peak during the June–
October period, and then decreases, reaching its lowest value
during February. This pattern is consistent with the seasonal
characteristics of other intestinal infectious diseases. During the
high incidence period the weather is hot and humid, allowing
more rapid bacteria reproduction; also during this weather people
often eat more raw and cold food. The cycle has been repeated for
many years and the situation has become chronic. Furthermore, in
the Hongta district, infection is often left untreated and only
42.6%–47.9% of carriers receive medical care. This leads to a
large number of infection sources and carriers, and contributes
significantly to the persistence of these diseases in the region.
In recent years, intervention has become a crucial determinant
of disease transmission [5–7]. During 2008, the typhoid and
paratyphoid fever control program (2008–2010) in the Hongta
district focused on the restriction of fresh caraway and mint eating
in restaurants and roadside food sites, the surveillance and hospital
treatment of patients and carriers using appropriate antibiotics,
improvement of the environment, health education, food hygie-
ne(especially for fresh vegetables), drinking water disinfection and
vaccination. As a result, the morbidity in the Hongta district
dropped from 232 per100,000 during 2000–2007 to 113 per
100,000 in 2010, a decrease of about 51%, but still high compared
with other regions of China.
Intervention would be much more efficient if the disease
sources, transmission paths and factors were accurately identified.
According to other studies [8–16], and our present work, the
following disease transmission hypotheses are proposed: (1)
Polluted water from hospitals and residential sewage discharged
into canals is an important disease determinant. (2) Polluted
vegetables sold in the markets constitute another determinant. (3)
Social and environmental factors interact together to influence
disease transmission.
The environmental health processes and variables involved in
the above hypotheses are distributed across space and time [17].
Understanding this pattern should provide valuable clues about
disease sources and determinants. The disease pattern can be
rigorously addressed using stochastic spatiotemporal analysis [18–
20] and powerful GIS technology [21–25] available at a relatively
lower cost than the mainstream epidemiological techniques. A
non-random disease distribution will always display spatial disease
clusters [22]. The concordance between the spatial pattern of a
disease and that of a contributing factor or determinant usually
indicates the power of that determinant [23,24]. Integration of
GIS with statistical models of disease distribution forms a
nationwide web-based automated system for early disease
outbreak detection and rapid response in China [25]. The dataset
and tools have already been used in the analysis of typhoid
transmission [26–28]. The main objective of the present study is to
identify the sources, transmission processes, and determinants of
typhoid and paratyphoid fever in the Hongta District, based on
the space-time analysis of the available epidemiological and
notification data.
Methods
Data for the typhoid and paratyphoid cases for the Hongta
district, and the factors associated with it were collected and a
conceptual model was developed to study the proposed transmis-
sion hypotheses based on the available data. Transmission sources
and population exposure were studied using geographical detec-
tors and epidemiological surveys.
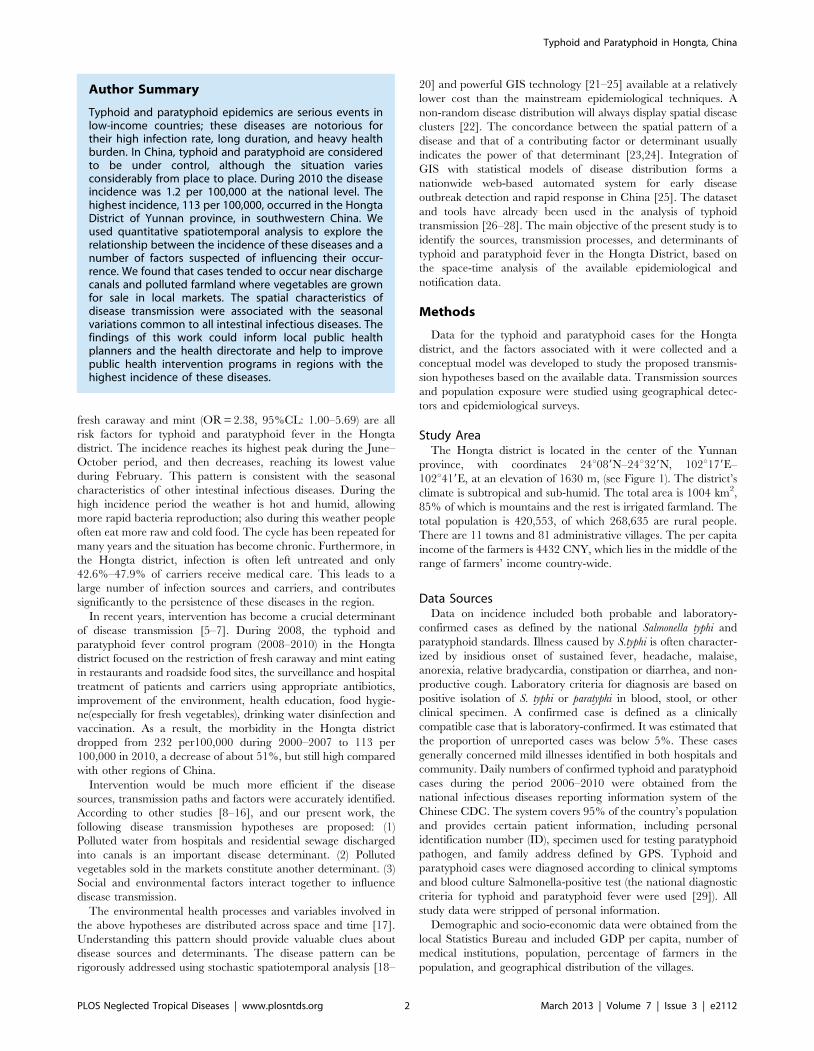
Study AreaThe Hongta district is located in the center of the Yunnan
province, with coordinates 24u089N–24u329N, 102u179E–
102u419E, at an elevation of 1630 m, (see Figure 1). The district’s
climate is subtropical and sub-humid. The total area is 1004 km2,
85% of which is mountains and the rest is irrigated farmland. The
total population is 420,553, of which 268,635 are rural people.
There are 11 towns and 81 administrative villages. The per capita
income of the farmers is 4432 CNY, which lies in the middle of the
range of farmers’ income country-wide.
Data SourcesData on incidence included both probable and laboratory-
confirmed cases as defined by the national Salmonella typhi and
paratyphoid standards. Illness caused by S.typhi is often character-
ized by insidious onset of sustained fever, headache, malaise,
anorexia, relative bradycardia, constipation or diarrhea, and non-
productive cough. Laboratory criteria for diagnosis are based on
positive isolation of S. typhi or paratyphi in blood, stool, or other
clinical specimen. A confirmed case is defined as a clinically
compatible case that is laboratory-confirmed. It was estimated that
the proportion of unreported cases was below 5%. These cases
generally concerned mild illnesses identified in both hospitals and
community. Daily numbers of confirmed typhoid and paratyphoid
cases during the period 2006–2010 were obtained from the
national infectious diseases reporting information system of the
Chinese CDC. The system covers 95% of the country’s population
and provides certain patient information, including personal
identification number (ID), specimen used for testing paratyphoid
pathogen, and family address defined by GPS. Typhoid and
paratyphoid cases were diagnosed according to clinical symptoms
and blood culture Salmonella-positive test (the national diagnostic
criteria for typhoid and paratyphoid fever were used [29]). All
study data were stripped of personal information.
Demographic and socio-economic data were obtained from the
local Statistics Bureau and included GDP per capita, number of
medical institutions, population, percentage of farmers in the
population, and geographical distribution of the villages.
Author Summary
Typhoid and paratyphoid epidemics are serious events inlow-income countries; these diseases are notorious fortheir high infection rate, long duration, and heavy healthburden. In China, typhoid and paratyphoid are consideredto be under control, although the situation variesconsiderably from place to place. During 2010 the diseaseincidence was 1.2 per 100,000 at the national level. Thehighest incidence, 113 per 100,000, occurred in the HongtaDistrict of Yunnan province, in southwestern China. Weused quantitative spatiotemporal analysis to explore therelationship between the incidence of these diseases and anumber of factors suspected of influencing their occur-rence. We found that cases tended to occur near dischargecanals and polluted farmland where vegetables are grownfor sale in local markets. The spatial characteristics ofdisease transmission were associated with the seasonalvariations common to all intestinal infectious diseases. Thefindings of this work could inform local public healthplanners and the health directorate and help to improvepublic health intervention programs in regions with thehighest incidence of these diseases.
Typhoid and Paratyphoid in Hongta, China
PLOS Neglected Tropical Diseases | www.plosntds.org 2 March 2013 | Volume 7 | Issue 3 | e2112
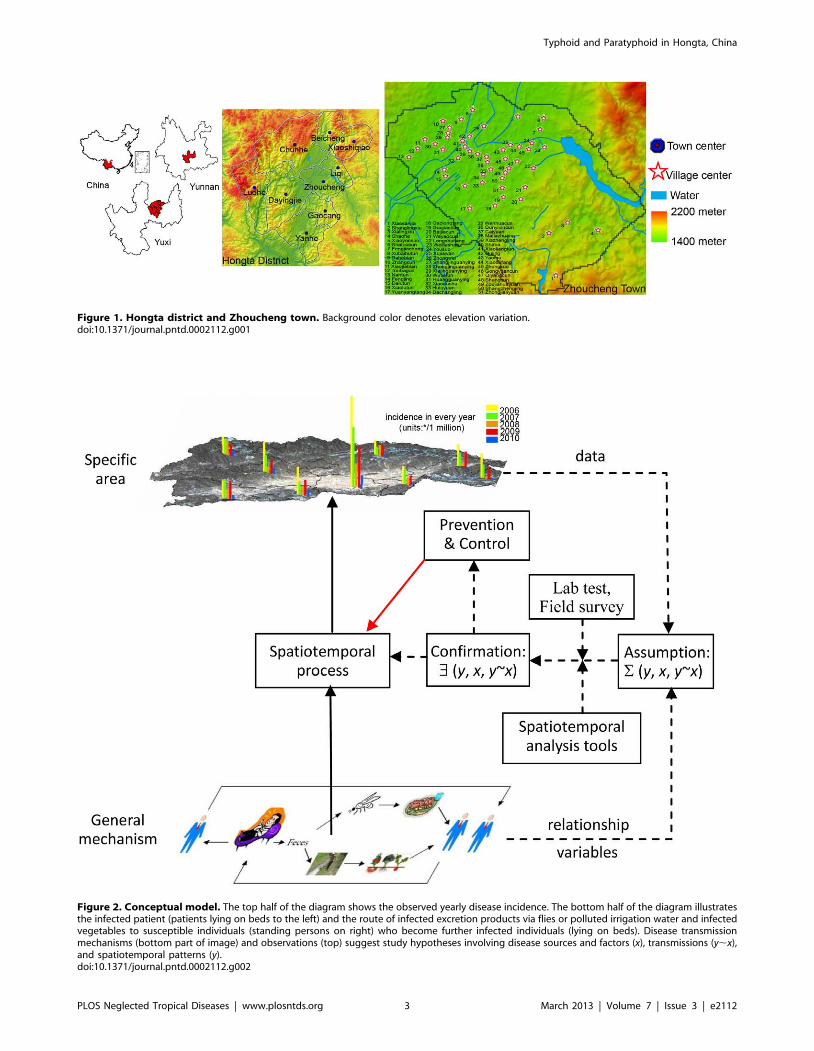
Figure 1. Hongta district and Zhoucheng town. Background color denotes elevation variation.doi:10.1371/journal.pntd.0002112.g001
Figure 2. Conceptual model. The top half of the diagram shows the observed yearly disease incidence. The bottom half of the diagram illustratesthe infected patient (patients lying on beds to the left) and the route of infected excretion products via flies or polluted irrigation water and infectedvegetables to susceptible individuals (standing persons on right) who become further infected individuals (lying on beds). Disease transmissionmechanisms (bottom part of image) and observations (top) suggest study hypotheses involving disease sources and factors (x), transmissions (y,x),and spatiotemporal patterns (y).doi:10.1371/journal.pntd.0002112.g002
Typhoid and Paratyphoid in Hongta, China
PLOS Neglected Tropical Diseases | www.plosntds.org 3 March 2013 | Volume 7 | Issue 3 | e2112

Annual precipitation and other meteorological data were
available from the China meteorological data-sharing network,
and were interpolated using the spatial kriging technique to cover
the entire study area.
Geomorphic data were obtained from the China geomorphy
map (1:1,000,000 scale), and seven categories were defined: plain,
terrace, hill, low-relief mountain, middle-relief mountain, high-
relief mountain and extremely high-relief mountain. Geomorphic
data were provided by the state key Laboratory of Resources and
Environmental Information Systems from the Institute of
Geographic Sciences and Natural Resources Research, Chinese
Academy of Science.
The Normalized Difference Vegetation Index (NDVI), acquired
by satellite remote sensing imaging, reflects greenness of vegeta-
tion, photosynthetic rate, and vegetation metabolic intensity and
measures seasonal and inter-annual changes. This makes NDVI
an efficient indicator of vegetation and eco-environment in the
locations where typhoid/paratyphoid Salmonellae occur. We used
monthly NDVI values with spatial resolution 1 km by 1 km.
The spatial distribution of canals, markets, water wells, streets,
and landuse in Zhoucheng town (Hongta district) were provided
by the Yuxi city Bureau of Mapping and Survey. Field surveying
showed that hospital disposal and residential sewage are connected
and discharged into the rainwater canal system.
Water and vegetable samples were collected from markets and
farmland, canals irrigating the farmland, hospital disposal
products and residential sewage. The samples were tested by
pulsed field gel electrophoresis, a technique used for the separation
of and identification of Salmonella DNA.
The data were organized either into excel tables or handled by
means of ENVI and ArcGIS 10.1 software.
Conceptual ModelFigure 2 outlines the study design. The observed yearly disease
incidence for towns located in the Hongta district is shown in the
top part of the diagram. The bottom part of the diagram depicts
the infected patient and the route taken by the patient’s
unsterilized excretion products to water sources that are then
used to irrigate vegetables grown on the farmland. Transmission to
susceptible patients may occur either directly via flies or polluted
water or via vegetables grown on the polluted farmland. Infected
individuals may recover and become susceptible, and then become
infected again. Untreated individuals may recover but remain
carriers of the disease. As noted earlier, disease transmission
mechanisms depicted in the bottom part of diagram and
observations shown along the top, have suggested certain study
hypotheses involving disease sources and factors (x), transmission
(y,x), and spatiotemporal patterns (y). These hypotheses can be
investigated by means of rigorous spatiotemporal analysis and
laboratory testing. Cases and suspected determinant data were
collected for this purpose.
Figure 3. The temporal variability of typhoid and paratyphoid incidence and relevant factors in Hongta district. (a) Relationshipbetween incidence of typhoid and paratyphoid and NDVI; (b) Relationship between incidence of typhoid and paratyphoid and precipitation.doi:10.1371/journal.pntd.0002112.g003
Typhoid and Paratyphoid in Hongta, China
PLOS Neglected Tropical Diseases | www.plosntds.org 4 March 2013 | Volume 7 | Issue 3 | e2112
Spatial StatisticsSpatial modeling goes beyond standard data analysis by
providing new dimensions that can process additional information,
discriminate factors that may not be perceivable (in simple time
series analysis for example), and locate sources and factors for
accurate intervention. We examined clustered and geographically
correlated cases, spatial patterns linked to suspected sources, and
case distribution-disease determinant consistencies suggesting
transmission mechanisms. These were analyzed by means of,
local indicator of spatial association (LISA), spatial buffering, and
geographical detector techniques [24] respectively. Multivariate
analysis was performed by the interaction detector technique,
measuring the spatial consistency between disease distribution and
a distribution formed by overlaying the distributions of the
multivariate of the determinants. Multivariate regression was not
suitable because either the sample size was too small (9 towns in
Hongta district) or the associated explanatory variables were not
available (in villages and streets).
Local Moran’s I, i.e. LISA measures the spatial autocorrelation
of an attribute as [22]
Ii~xi{�xx
s2
Xjcij(xj{�xx)
where xi is the attribute value in the spatial cell i; c is the matrix of
spatial weights, e.g., cij denotes the weight of relationship between
cells i and j; �xx and s2 denote the mean and variance of x,
respectively. A positive Ii implies that the cell i and its neighbors
are similar; e.g., high-high or low-low cells. A negative Ii implies
that the cell i and its neighbors are dissimilar; e.g., high-low or low-
high cells. LISA was performed using the publically available
software GeoDA software.
An object’s buffer refers to a zone covering a specified distance
around it. For a single object a series of buffers may be considered
at increasing distances. If the object is a point (e.g. a market), its
buffers are a series of circles centered at that point. If the object is a
line (e.g., a canal), its buffers are a series of belts parallel to the line.
If the prevalence in the buffers exhibits a trend with distance from
an object, it implies that the specified object is associated with
disease transmission. Buffer statistics were calculated using
ARCGIS software.
The geographical detector [24] is used to assess environmental
risks to human population. The method is different from
conventional mathematical correlation or regression, which
require that the determinants or their proxies are quantitative. It
is assumed that the disease will exhibit a spatial distribution similar
to that of an environmental factor if the environment contributes
to disease transmission, as measured by the Power of Determinant
(PD),
PD~1{1
<s2
XL
h~1<hs2
where R and s2 denote the area and the dispersion variance of
disease incidence of the study area, respectively. The study area is
stratified into L stratums, h = 1, …, L [23] according to spatial
heterogeneity of a suspected determinant or its proxy of the
disease. Note that spatial heterogeneity is defined as an attribute
whose statistical properties (e.g., mean and standard deviation)
change in space. PD M[0, 1], where 1 indicates that the
determinant completely controls the disease, and 0 indicates that
the determinant is completely unrelated to the disease. In other
words, PD expresses the extent to which a determinant explains
disease incidence. In addition, disease transmission is often
determined by multiple factors. The PD, combined with spatial
overlay techniques of GIS and set theory, yields a geographical
detector that can effectively assess the relationship between
multiple factors: Are these factors independent or interacting?
Are they enhancing or weakening each other? Is their interaction
linear or nonlinear? In the present study, the geographical detector
was implemented using the software www.sssampling.org/
geogdetector (publicly available).
Results
Spatiotemporal DistributionThe overall disease distribution as a function of time is shown in
Table 1. Figure 3 shows that the disease incidence is in inverse
phase with NDVI (Figure 3a) and in the same phase as
precipitation (Figure 3b).
Figure 4 displays yearly incidence in 9 towns of the Hongta
district during the period 2006–2010, with the exception of 2009,
together with population densities and landuse. Towns are
categorized as having low (L), medium (M) and high (H)
population densities. Zhoucheng town is located at the south-
eastern and central area of Hongta district and is made up of 51
villages. It has the highest population density and much higher
incidence than towns in the western and northern hill woodland,
which is why it was made the focus of this study. LISA statistic
(P = 0.01) in Figure 5, shows that low incidence villages are close to
other low incidence villages in the outskirts, whereas villages
forming high incidence clusters are located close to the town
centre. Higher disease incidence occurs in areas with a larger
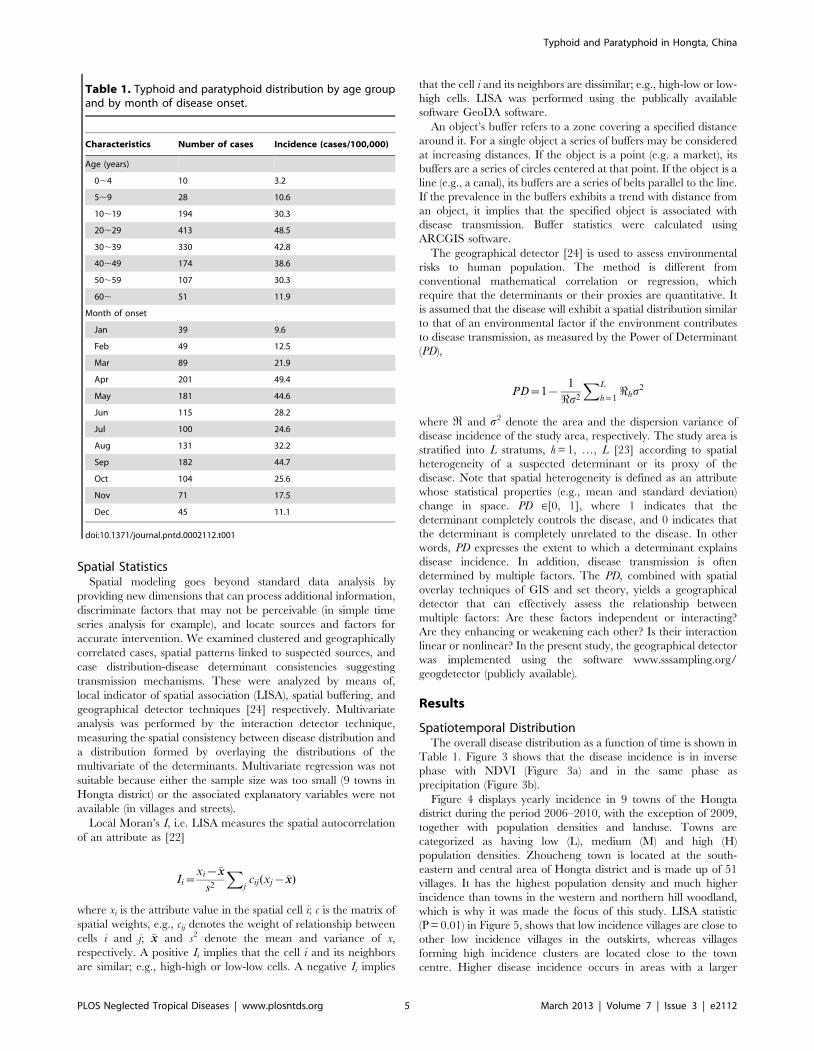
Table 1. Typhoid and paratyphoid distribution by age groupand by month of disease onset.
Characteristics Number of cases Incidence (cases/100,000)
Age (years)
0,4 10 3.2
5,9 28 10.6
10,19 194 30.3
20,29 413 48.5
30,39 330 42.8
40,49 174 38.6
50,59 107 30.3
60, 51 11.9
Month of onset
Jan 39 9.6
Feb 49 12.5
Mar 89 21.9
Apr 201 49.4
May 181 44.6
Jun 115 28.2
Jul 100 24.6
Aug 131 32.2
Sep 182 44.7
Oct 104 25.6
Nov 71 17.5
Dec 45 11.1
doi:10.1371/journal.pntd.0002112.t001
Typhoid and Paratyphoid in Hongta, China
PLOS Neglected Tropical Diseases | www.plosntds.org 5 March 2013 | Volume 7 | Issue 3 | e2112

proportion of farmers in the population. Data relating to
distribution of canals and markets are also available.
Figure 6 displays the associations between disease incidence and
suspected determinants in Zhoucheng town. The x-axis represents
the distance between sewer and confluence (in Figure 6a) and
between market and well (in Figure 6b), shown with their
respective buffer zones. The y-axis denotes years (2006–2010),
and the z-axis the population incidence. Figure 6a shows that the
population incidence increases with decreasing distance from the
canals. Interestingly, the incidence reduces rapidly away from
confluence canals (note: blue bars rapidly shorten along buffer-
axis), whereas it reduces rather slowly away from sewage canals
(red bars slowly shorten along buffer-axis).Figure 6b shows that
disease incidence reduces with distance from markets and
groundwater wells, the decline being more rapid from the markets
(red bars rapidly shorten along buffer-axis) than from the wells
(blue bars slowly shorten along buffer-axis). Figures 6a and b, show
that the abnormally high incidence during 2009 occurred within a
500 m buffer zone of sewers and confluences and an 800 m buffer
zone of markets and wells, suggesting that the suspected disease
sources are not only a cause of the observed spatial disease
distribution but they were also responsible for the 2009 disease
outbreak.
After being standardized as (y2min)/(max2min), the time
series of incidence, precipitation and NDVI were analyzed. The
typhoid fever and the paratyphoid fever both fluctuated in time,
experiencing two peaks per year; the first peak from April to June
and the second from September to November. The incidence was
positively correlated with the precipitation time series and usually
peaked about one month earlier or one month later than the
precipitation peak. NDVI is an index reflecting biological mass,
and its time series appears to be negatively correlated with disease
incidence.
Multivariate InteractionLaboratory testing indicated that the Salmonella strains found in
water samples from hospitals, canals, farmland, and market
vegetables belonged to closely related clones of S. typhi. Vegetables
sold in the markets came from farmland irrigated by water
contaminated by hospital and residential sewage. The findings of
our spatiotemporal analysis, that hospital and residential sewage
discharge and food markets are the most probable routes of disease
transmission, support previous surveys carried out in this area.
In addition to these direct disease sources, other environmental
factors are believed to exert an influence on disease transmission.
These include factors such as economic and social status, types of
disease intervention, climate-biology types and physical conditions.
However, these factors are rather difficult to measure in a
straightforward manner. Instead, they are represented by their
proxies: GDP per capita (economic determinant), proportion of
farmers in total population (social determinant), number of
medical institutions (intervention), NDVI (climate-biology type),
and geomorphic types (environmental conditions).
Using the geographical detectors it was found that social factors
have the highest disease impact of all those measured (Table 2).
The combined impact of two factors A and B on disease incidence
generally differs from the simple linear summation of the separate
A and B impacts, i.e., A > B?A+B. The spatial incidence
distribution is highly correlated with that of farmer proportion and
Figure 4. Yearly incidence of typhoid and paratyphoid in nine towns, Hongta district. Landuse as categorized by farmland, woodland,grass, water bodies and residential areas are mapped using different colors; red circles marked by L, M and H denote towns with low, medium andhigh population densities respectively.doi:10.1371/journal.pntd.0002112.g004
Typhoid and Paratyphoid in Hongta, China
PLOS Neglected Tropical Diseases | www.plosntds.org 6 March 2013 | Volume 7 | Issue 3 | e2112

population density. The proportions of spatial prevalence variation
explained by these two factors reach PD = 78.3% (for A) and
73.8% (for B). The farmer proportion and population density
together explain 84.7% of the variation of disease incidence,
higher than that explained by any single factor.
The incidence is weakly associated with the economic condition
(GDP per capita) and the climate-biological type (NDVI), with PD
values of 9.7% and 1.8%, respectively. However, the incidence is
more strongly linked with the spatial combination of GDP and
NDVI. More than half (53.8%) of the spatial variation of the
Figure 5. LISA in Hongta district and Zhoucheng town.doi:10.1371/journal.pntd.0002112.g005
Figure 6. The spatial variability of typhoid and paratyphoid incidence and suspected determinants in the Zhoucheng town. (a)Relationship between incidence of typhoid and paratyphoid and sewer/confluence; (b) Relationship between incidence of typhoid and paratyphoidand market/well (Sew denotes Sewer; Con denotes Confluence; Mar denotes Market).doi:10.1371/journal.pntd.0002112.g006
Typhoid and Paratyphoid in Hongta, China
PLOS Neglected Tropical Diseases | www.plosntds.org 7 March 2013 | Volume 7 | Issue 3 | e2112

incidence can be explained by the spatial distribution of economic
condition (GDP per capita) combined with availability of medical
intervention (number of medical institutions). The individual
determinant impact of GDP and NDVI are clearly low (8.7% and
18.7% respectively). Geomorphology explains only a small part of
spatial disease transmission, but its impact increases when it is
combined with population density or GDP per capita. These
findings jointly imply that a policy instrument based on analysis of
a combination of the most relevant determinants,(in this case,
population density and farmer proportion), would be highly
efficient in controlling spatial disease transmission in a region.
Discussion
Based on the results of rigorous spatiotemporal analysis and GIS
technology, disease transmission processes can be identified,
modeled, and used for population health management purposes.
The findings of the present Hongta district study include the
following: Unsterilized water from hospital disposal and residential
sewage are discharged into the rainwater canal system to irrigate
the region’s farmlands where local vegetables are grown. Polluted
vegetables are sold in the markets and consumed without being
adequately washed. Infection is magnified during the rainy
seasons, when more contaminated water irrigates the farmlands
and the polluted water, mixed with additional garbage spreads
over a larger area of the inhabited region. Over time, the
combination of the farmers’ poor hygiene conditions and low cure
rates lead to considerable pathogen reserves among the popula-
tion. The general seasonal-intestinal infection cycle, driven mainly
by annual temperature fluctuations and varying volume of
polluted canal water in the irrigation system driven mainly by
the rainy seasons, combine to cause the persistent high endemic
transmission of the disease in the Hongta district.
The availability of spatiotemporal data and the development of
health information systems facilitate the GIS-spatiotemporal
exploration of public health issues. The physical and social
determinants of health are usually spatially distributed: surface and
subsurface contaminated water, polluted water emission from
workplaces, disease prevention methods, and nutrition and food
habits. More importantly, the susceptible and the infected
populations are always geographically distributed. Health deter-
minants may be detected when the disease incidence shares similar
spatial features with environmental features suspected of being
associated with the disease. When disease cases and environmental
features do not share similar spatial features, however, this does
not necessarily mean that they are unrelated. Instead, the
geographically dispersed disease cases may have the same casual
sources as features which may be elucidated by alternative
techniques such as molecular tracking in food or serum samples,
and food electronic label tracking systems.
This study identified some of the disease sources, determinants,
and transmission cycles, which affect the distribution of typhoid and
paratyphoid cases in the Hongta district which currently exhibits the
highest incidence in China. This knowledge can be used to design
intervention measures to reduce and hopefully eradicate the disease
in this area. In addition to the measures common to the control of
enteric infectious disease intervention, such as washing hands before
eating and environmental sanitation, particular attention should be
paid to the sterilization of hospital waste prior to discharge into
canals, especially during the rainy season.
Supporting Information
Checklist S1 STROBE Checklist.
(PDF)
Author Contributions
Conceived and designed the experiments: JFW JZ. Performed the
experiments: JZ JLS XL LL XQF YQS XML. Analyzed the data: JFW
YW JZ JLS XL LL XQF YQS XML. Contributed reagents/materials/
analysis tools: GC JZ. Wrote the paper: JFW YW.
References
1. The World Health Report (1996) Fighting Disease, Fostering Development. Geneva:
World Health Organization.
2. Yan MY, Liang WL (2005) Epidemics of typhoid and paratyphoid fever 1995–
2004 in China. Disease Surveillance 20: 401–403.
3. Zeng LP, Zhao W, Yu QF, Liu HY, Yao YB, Li SX (2005) The epidemic
analysis of typhoid and paratyphoid fever in Hongta District, Yuxi City in 2000–
2003. Journal Prevention Medicine Information 21: 199–201.
4. Zhang Y, Zhang J (2010) Epidemiology of enteric fever in area with high
incidence in Yunnan province. Disease Surveillance 25: 538–541.
5. Butler T (2011) Treatment of typhoid fever in the 21st century: promises and
shortcomings. Clinical Microbiology and Infection 17: 959–63.
6. Christakos G (2010) Integrative Problem-Solving in a Time of Decadence. New York,
NY: Springer.
7. Clasen T, Schmidt WP, Rabie T, Roberts I, Cairncross S (2007) Interventions to
improve water quality for preventing diarrhoea: systematic review and meta-
analysis. British Medicine Journal 334:782.
8. De Roeck D, OchiaiRL, Yang J, Anh DD, Alag V, Clemens JD (2008)
Typhoid vaccination: the Asian experience. Expert Review of Vaccines 7:547–
560.
9. Fischer M, Getis A (2010) Handbook of Applied Spatial Analysis. Berlin: Springer.
10. Fu XQ, Chang LT (2010) Comparative analysis on the KAP of typhoid and
paratyphoid fever between Hongta District and Chengjiang County of Yuxi in
Yunnan. Modern Preventive Medicine 37: 2725–2728.
11. Getwin V (2004) Mapping opportunities. Nature 427: 376–377.
12. Haining R (2003) Spatial Data Analysis Theory and Practice. UK: Cambridge
University Press.
Table 2. Interaction between factors affecting the prevalence of typhoid and paratyphoid.
A\B = C (%) A (%) B (%) A+B (%) Conclusion Interpretation
GDP per capita \ NDVI = 23.4 8.7 1.8 10.5 C.A+B; C.A, B A enhances B
GDP per capita \ Num. of medical inst. = 53.8 8.7 18.7 27.4 C.A+B; C.A, B A enhances B
Farmer proportion \ Population density = 84.7 78.3 73.8 152.1 C,A+B A weakens B
Geomorphy \ Population density = 79.4 20.1 73.8 93.9 C,A+B A weakens B
Geomorphy \ GDP per capita = 28.9 20.1 8.7 28.8 C = A+B A independent of B
Note: A and B denote two determinants, with their PD values in geographical detector. The PD value measures the % of spatial disease variance explained by adeterminant; A>B refers to a map formed by an overlay by A and B; C is the PD value of the A and B overlaid map. For more detail of geographical detector please referto the main text or literature [24].doi:10.1371/journal.pntd.0002112.t002
Typhoid and Paratyphoid in Hongta, China
PLOS Neglected Tropical Diseases | www.plosntds.org 8 March 2013 | Volume 7 | Issue 3 | e2112

13. Kulldorff M, Nagarwalla N (1995) Spatial disease clusters: detection and
inference. Statistics in Medicine 14: 799–810.14. Liao YL, Wang JF, GuoYQ ZhengXY (2010) Risk assessment of human neural
tube defects using a Bayesian belief network. Stochastic Environmental Research
and Risk Assessment 24: 93–100.15. Mikler AR, Venkatachalam S, Ramisetty-Mikler S (2006) Decisions under
uncertainty: a computational framework for quantification of policies addressinginfectious disease epidemics. Stochastic Environmental Research and Risk
Assessment 21: 533–543.
16. Meng B, Wang JF, Liu JY, Wu JL, Zhong ES (2005) Understanding the spatialdiffusion process of SARS in Beijing. Public Health 119: 1080–1087.
17. Riley S (2008) A prospective study of spatial clusters gives valuable insights intodengue transmission. PLoS Medicine 5: e220. doi:10.1371/journal.
pmed.0050220.18. Sonnenberg A (2008). Seasonal variation of enteric infections and inflammatory
bowel disease. Inflammatory Bowel Diseases 14: 955–959.
19. Vollaard AM, Ali S, van Asten H, Widjaja S, Visser LG, et al. (2004) Risk factorsfor typhoid and paratyphoid fever in Jakarta, Indonesia. Journal of the American
Medical Association 21: 2607–2615.20. Wang FY, Jin ZP, Pang ZF (2008) The epidemics analysis on typhoid and
paratyphoid fever 1990–2006 in Jinhua City. Zhejiang Journal of Preventive
Medicine 20: 30–31.21. Wang JF (2006) Spatial Analysis. Science Press.
22. Anselin L (1995) Local indicators of spatial association – LISA. Geographical
Analysis 27: 93–115.
23. Wang JF, Haining R, Cao ZD (2010) Sample surveying to estimate the mean of
a heterogeneous surface: reducing the error variance through zoning.
International Journal of Geographical Information Science 24: 523–543.
24. Wang JF, Li XH, Christakos G, Liao YL, Zhang T, Gu X, ZhengXY(2010)
Geographical detectors-based health risk assessment and its application in the
neural tube defects study of the Heshun Region, China. International Journal of
Geographical Information Science 24: 107–127.
25. Yang WZ, Li ZJ, LanYJ, Wang JF, Ma JQ, et al. (2011) A nationwide web-based
automated system for outbreak early detection and rapid response in China.
Western Pacific Surveillance and Response 2: doi: 10.5365/wpsar.2010.1.1.009.
26. Wang LX, Yan MY, Fang LQ, Fu XQ, Wang DC, et al. (2011) Typhoid and
paratyphoid fever in Yunnan province: distributional patterns and the related
meteorological factors. Zhonghua Liu Xing Bing XueZaZhi 32: 485–489.
27. Whitaker JA, Franco-Paredes C, del Rio C, Edupuganti S (2009) Rethinking
typhoid fever vaccines: implications for travelers and people living in highly
endemic areas. Journal of Travel Medicine 16: 46–52.
28. Xiang H, Xiang E (2010) An outbreak of typhoid in a rural school. Journal of
Public Health and Prevention Medicine 21: 71–72.
29. Ministry of Health of the People’s Republic of China (2008) Diagnostic Criteria for
Typhoid Fever and Paratyphoid Fever. ICS 11.020/C59/23221-2008.
Typhoid and Paratyphoid in Hongta, China
PLOS Neglected Tropical Diseases | www.plosntds.org 9 March 2013 | Volume 7 | Issue 3 | e2112