Spatiotemporal dynamics of urban expansion in 13 cities ... · The Jing-Jin-Ji Urban Agglomeration...
12
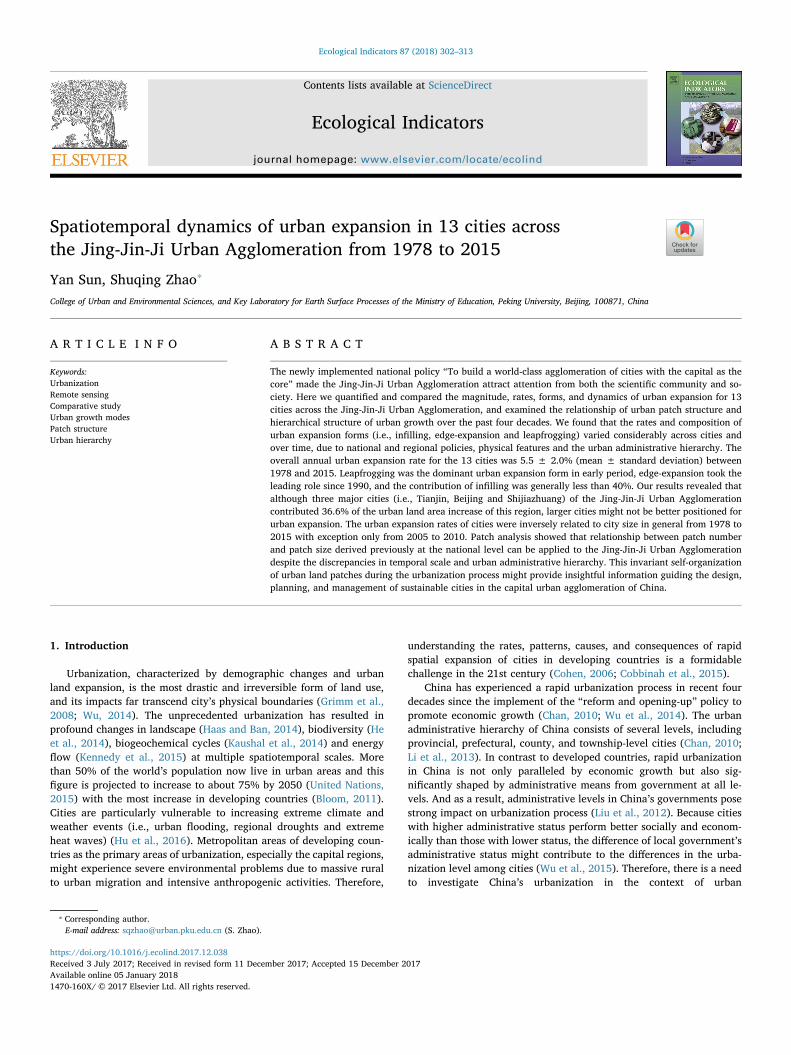
Contents lists available at ScienceDirect Ecological Indicators journal homepage: www.elsevier.com/locate/ecolind Spatiotemporal dynamics of urban expansion in 13 cities across the Jing-Jin-Ji Urban Agglomeration from 1978 to 2015 Yan Sun, Shuqing Zhao ⁎ College of Urban and Environmental Sciences, and Key Laboratory for Earth Surface Processes of the Ministry of Education, Peking University, Beijing, 100871, China ARTICLE INFO Keywords: Urbanization Remote sensing Comparative study Urban growth modes Patch structure Urban hierarchy ABSTRACT The newly implemented national policy “To build a world-class agglomeration of cities with the capital as the core” made the Jing-Jin-Ji Urban Agglomeration attract attention from both the scientific community and so- ciety. Here we quantified and compared the magnitude, rates, forms, and dynamics of urban expansion for 13 cities across the Jing-Jin-Ji Urban Agglomeration, and examined the relationship of urban patch structure and hierarchical structure of urban growth over the past four decades. We found that the rates and composition of urban expansion forms (i.e., infilling, edge-expansion and leapfrogging) varied considerably across cities and over time, due to national and regional policies, physical features and the urban administrative hierarchy. The overall annual urban expansion rate for the 13 cities was 5.5 ± 2.0% (mean ± standard deviation) between 1978 and 2015. Leapfrogging was the dominant urban expansion form in early period, edge-expansion took the leading role since 1990, and the contribution of infilling was generally less than 40%. Our results revealed that although three major cities (i.e., Tianjin, Beijing and Shijiazhuang) of the Jing-Jin-Ji Urban Agglomeration contributed 36.6% of the urban land area increase of this region, larger cities might not be better positioned for urban expansion. The urban expansion rates of cities were inversely related to city size in general from 1978 to 2015 with exception only from 2005 to 2010. Patch analysis showed that relationship between patch number and patch size derived previously at the national level can be applied to the Jing-Jin-Ji Urban Agglomeration despite the discrepancies in temporal scale and urban administrative hierarchy. This invariant self-organization of urban land patches during the urbanization process might provide insightful information guiding the design, planning, and management of sustainable cities in the capital urban agglomeration of China. 1. Introduction Urbanization, characterized by demographic changes and urban land expansion, is the most drastic and irreversible form of land use, and its impacts far transcend city’s physical boundaries (Grimm et al., 2008; Wu, 2014). The unprecedented urbanization has resulted in profound changes in landscape (Haas and Ban, 2014), biodiversity (He et al., 2014), biogeochemical cycles (Kaushal et al., 2014) and energy flow (Kennedy et al., 2015) at multiple spatiotemporal scales. More than 50% of the world’s population now live in urban areas and this figure is projected to increase to about 75% by 2050 (United Nations, 2015) with the most increase in developing countries (Bloom, 2011). Cities are particularly vulnerable to increasing extreme climate and weather events (i.e., urban flooding, regional droughts and extreme heat waves) (Hu et al., 2016). Metropolitan areas of developing coun- tries as the primary areas of urbanization, especially the capital regions, might experience severe environmental problems due to massive rural to urban migration and intensive anthropogenic activities. Therefore, understanding the rates, patterns, causes, and consequences of rapid spatial expansion of cities in developing countries is a formidable challenge in the 21st century (Cohen, 2006; Cobbinah et al., 2015). China has experienced a rapid urbanization process in recent four decades since the implement of the “reform and opening-up” policy to promote economic growth (Chan, 2010; Wu et al., 2014). The urban administrative hierarchy of China consists of several levels, including provincial, prefectural, county, and township-level cities (Chan, 2010; Li et al., 2013). In contrast to developed countries, rapid urbanization in China is not only paralleled by economic growth but also sig- nificantly shaped by administrative means from government at all le- vels. And as a result, administrative levels in China’s governments pose strong impact on urbanization process (Liu et al., 2012). Because cities with higher administrative status perform better socially and econom- ically than those with lower status, the difference of local government’s administrative status might contribute to the differences in the urba- nization level among cities (Wu et al., 2015). Therefore, there is a need to investigate China’s urbanization in the context of urban https://doi.org/10.1016/j.ecolind.2017.12.038 Received 3 July 2017; Received in revised form 11 December 2017; Accepted 15 December 2017 ⁎ Corresponding author. E-mail address: [email protected] (S. Zhao). Ecological Indicators 87 (2018) 302–313 Available online 05 January 2018 1470-160X/ © 2017 Elsevier Ltd. All rights reserved. T
Transcript of Spatiotemporal dynamics of urban expansion in 13 cities ... · The Jing-Jin-Ji Urban Agglomeration...
Contents lists available at ScienceDirect
Ecological Indicators
journal homepage: www.elsevier.com/locate/ecolind
Spatiotemporal dynamics of urban expansion in 13 cities acrossthe Jing-Jin-Ji Urban Agglomeration from 1978 to 2015
Yan Sun, Shuqing Zhao⁎
College of Urban and Environmental Sciences, and Key Laboratory for Earth Surface Processes of the Ministry of Education, Peking University, Beijing, 100871, China
A R T I C L E I N F O
Keywords:UrbanizationRemote sensingComparative studyUrban growth modesPatch structureUrban hierarchy
A B S T R A C T
The newly implemented national policy “To build a world-class agglomeration of cities with the capital as thecore” made the Jing-Jin-Ji Urban Agglomeration attract attention from both the scientific community and so-ciety. Here we quantified and compared the magnitude, rates, forms, and dynamics of urban expansion for 13cities across the Jing-Jin-Ji Urban Agglomeration, and examined the relationship of urban patch structure andhierarchical structure of urban growth over the past four decades. We found that the rates and composition ofurban expansion forms (i.e., infilling, edge-expansion and leapfrogging) varied considerably across cities andover time, due to national and regional policies, physical features and the urban administrative hierarchy. Theoverall annual urban expansion rate for the 13 cities was 5.5 ± 2.0% (mean ± standard deviation) between1978 and 2015. Leapfrogging was the dominant urban expansion form in early period, edge-expansion took theleading role since 1990, and the contribution of infilling was generally less than 40%. Our results revealed thatalthough three major cities (i.e., Tianjin, Beijing and Shijiazhuang) of the Jing-Jin-Ji Urban Agglomerationcontributed 36.6% of the urban land area increase of this region, larger cities might not be better positioned forurban expansion. The urban expansion rates of cities were inversely related to city size in general from 1978 to2015 with exception only from 2005 to 2010. Patch analysis showed that relationship between patch numberand patch size derived previously at the national level can be applied to the Jing-Jin-Ji Urban Agglomerationdespite the discrepancies in temporal scale and urban administrative hierarchy. This invariant self-organizationof urban land patches during the urbanization process might provide insightful information guiding the design,planning, and management of sustainable cities in the capital urban agglomeration of China.
1. Introduction
Urbanization, characterized by demographic changes and urbanland expansion, is the most drastic and irreversible form of land use,and its impacts far transcend city’s physical boundaries (Grimm et al.,2008; Wu, 2014). The unprecedented urbanization has resulted inprofound changes in landscape (Haas and Ban, 2014), biodiversity (Heet al., 2014), biogeochemical cycles (Kaushal et al., 2014) and energyflow (Kennedy et al., 2015) at multiple spatiotemporal scales. Morethan 50% of the world’s population now live in urban areas and thisfigure is projected to increase to about 75% by 2050 (United Nations,2015) with the most increase in developing countries (Bloom, 2011).Cities are particularly vulnerable to increasing extreme climate andweather events (i.e., urban flooding, regional droughts and extremeheat waves) (Hu et al., 2016). Metropolitan areas of developing coun-tries as the primary areas of urbanization, especially the capital regions,might experience severe environmental problems due to massive ruralto urban migration and intensive anthropogenic activities. Therefore,
understanding the rates, patterns, causes, and consequences of rapidspatial expansion of cities in developing countries is a formidablechallenge in the 21st century (Cohen, 2006; Cobbinah et al., 2015).
China has experienced a rapid urbanization process in recent fourdecades since the implement of the “reform and opening-up” policy topromote economic growth (Chan, 2010; Wu et al., 2014). The urbanadministrative hierarchy of China consists of several levels, includingprovincial, prefectural, county, and township-level cities (Chan, 2010;Li et al., 2013). In contrast to developed countries, rapid urbanizationin China is not only paralleled by economic growth but also sig-nificantly shaped by administrative means from government at all le-vels. And as a result, administrative levels in China’s governments posestrong impact on urbanization process (Liu et al., 2012). Because citieswith higher administrative status perform better socially and econom-ically than those with lower status, the difference of local government’sadministrative status might contribute to the differences in the urba-nization level among cities (Wu et al., 2015). Therefore, there is a needto investigate China’s urbanization in the context of urban
https://doi.org/10.1016/j.ecolind.2017.12.038Received 3 July 2017; Received in revised form 11 December 2017; Accepted 15 December 2017
⁎ Corresponding author.E-mail address: [email protected] (S. Zhao).
Ecological Indicators 87 (2018) 302–313
Available online 05 January 20181470-160X/ © 2017 Elsevier Ltd. All rights reserved.
T

administrative hierarchy for building robust knowledge and providingguidance for sustainable planning, designing, and managing of Chineseurban expansion. Previous studies found that larger cities might bebetter positioned than smaller ones for urban expansion owing to theirhigher ranks in the administrative hierarchy, and greater competive-ness for land-use priority and resource exploitation (Schneider andMertes, 2014; Zhang et al., 2014). Li et al. (2015) used spatial regimeregression to examine the spatial effect of city hierarchy and found thatin China between 1998 and 2008, cities ranked higher tend to expandmore rapidly. However, Gibrat’s law, the well-documented urban ex-pansion theory, states that growth rate of cities are independent of citysize (Eeckhout, 2004; Rozenfeld et al., 2008; Jiang and Jia, 2011).Recent studies found that during the entire period of 1978–2010, Chi-nese cities expansion in terms of urban growth rate showed an inverserelationship to city size, contradicting Gibrat’s law (Zhao et al., 2015a).The emergence of various urban agglomeration development strategyand adjustment of city administrative divisions press the necessity toapply spatially explicit methods to understand the new urbanization incontemporary China (Li et al., 2015; Zhao et al., 2015a; Zeng et al.,2017).
The Jing-Jin-Ji Urban Agglomeration as the capital urban agglom-eration of China has attracted much attention due to the newly im-plemented national policy “To build a world-class agglomeration ofcities with the capital as the core” (Wu et al., 2015; Zhang et al., 2017).The administrative hierarchy of the Jing-Jin-Ji Urban Agglomeration isquite complete with a set of cities ranging from large (e.g. Beijing andTianjin) to small. Therefore, the Jing-Jin-Ji Urban Agglomeration pro-vides an ideal place for a synthetic understanding on the impacts ofurban hierarchy systems; a comprehensive study on the urban growthcharacteristics of cities at all administrative levels of the Jing-Jin-Ji
Urban Agglomeration will be of great significance to better understandthe urban expansion model of China.
Compared to other important urban agglomerations of China (i.e.,the Yangtze River Delta and the Pearl River Delta), there have beenfewer spatially explicit studies on urbanization process of the Jing-Jin-Ji Urban Agglomeration (Xie et al., 2017). A comparative study of ur-banization process in three major urban agglomerations of China re-vealed that from 1990 to 2010, the Jing-Jin-Ji Urban Agglomerationshowed the highest magnitude and speed of urban growth (Haas andBan, 2014). Using multi-temporal satellite data, Wu et al. (2015)quantified and compared magnitude of urban expansion in three majorcities (i.e., Tianjin, Beijing and Shijiazhuang) of the Jing-Jin-Ji UrbanAgglomeration from the late 1970s to 2010. Recently, Zhang et al.(2016) emphasized neighbor-city influence on intra-city urban expan-sion direction through comparing the spatiotemporal patterns of urbangrowth in Beijing, Tianjin and Tangshan from the 1970s to 2013. Mostof those studies only included several more developed cities of thisregion or covered relatively short time periods, or not designed to in-vestigate the impacts of the urban administrative hierarchy. Further-more, spatial and temporal evolution of urban patch structure can re-veal the metabolism and mechanism of city evolution and organization(Zhao et al., 2015a,b). Unfortunately, few studies have been conductedto examine patch characteristics (Dietzel et al., 2005; Li et al., 2013;Zhao et al., 2015a,b), let alone the convergence or divergence of urbanpatch structure in the context of urban administrative hierarchy. Thereis a dearth of multi-temporal spatially explicit research on the urbanland growth, and the hierarchical structure of all major cities in theJing-Jin-Ji Urban Agglomeration across recent four decades.
In this study, we mapped and quantified the magnitude, rates andspatial patterns of urban expansion for the Jing-Jin-Ji Urban
Fig. 1. The location and administrative divisions of the study area: (A) The study area in China, (B) The 13 cities in the Jing-Jin-Ji Urban Agglomeration, (C) Topography of study area.
Y. Sun, S. Zhao Ecological Indicators 87 (2018) 302–313
303

Agglomeration of China from the late 1970s to 2015 using multi-tem-poral Landsat Multispectral Scanner (MSS), Thematic Mapper (TM),Enhanced Thematic Mapper (ETM) and Operational Land Imager (OLI)satellite images. The objectives of this study were to (1) map the spatialand temporal dynamics of urban land covers of all major cities of theJing-Jin-Ji Urban Agglomeration; (2) quantify and compare the rates,growth forms of urbanization in the Jing-Jin-Ji Urban Agglomeration;(3) examine the change of converged urban patch structure across timeand space; and (4) investigate the impact of urban administrativehierarchy and the applicability of Gibrat’s law in the region.
2. Data and methods
2.1. Study area
The Jing-Jin-Ji Urban Agglomeration is located in the northeasternpart of mainland China and belongs to the Bohai Economic Rim (Fig. 1).The Jing-Jin-Ji Urban Agglomeration includes three provincial-levelcity: Beijing (the capital city of China and municipality), Tianjin (mu-nicipality) and Shijiazhuang (the provincial capital of Hebei); ten pre-fectural-level cities: Langfang, Baoding, Chengde, Zhangjiakou,Cangzhou, Tangshan, Qinhuangdao, Hengshui, Handan, Xingtai, eachof which incorporates many districts and counties (Table 1). Our studyarea (i.e., its metropolitan area) includes Beijing and Tianjin, and all ofthe 11 cities in Hebei province surrounding them, covering an area ofapproximately 216,000 km2. As one of the three most important urbanagglomerations, this region is designated as the political, cultural, andeconomic center of China, with a population of approximately 110.5million, contributing to 10.4% to China’s GDP in 2014 rivaling YangtzeRiver Delta and the Pearl River Delta (Table 2). The climate of thisregion is humid continental with hot summers and cold winters. Since2010, various national and local policies have been implemented tocoordinate development of the Jing-Jin-Ji Urban Agglomeration andaddress subsequent environmental problems in urbanization process(Wang et al., 2013).
2.2. Remote sensing data and urban land cover classification
Cloud-free MSS (Multispectral Scanner), TM (Thematic Mapper),ETM+ (Landsat Enhanced Thematic Mappler Plus) and OLI(Operational Land Imager) satellite images were used to monitor urbanland changes for the 13 cities over the past 37 years. The acquisitiontime of these images represent seven time periods of circa 1978, 1990,1995, 2000, 2005, 2010 and 2015, corresponding to the rapid urbani-zation process of China since the critical national policy of “reform andopening-up” initialized in the late 1970s. Around 200 scenes of imageswith relatively high-quality were used to map the spatial extent ofurban land for the 13 cities of the Jing-Jin-Ji Urban Agglomeration.
For all cities, we acquired images in summer as much as possible to
effectively separate urban land from crop fields. For most of those 13cities, several images have to be mosaicked to cover the whole ad-ministrative area of a city. When selecting images for mosaicking, wetried to use images with the date as close as possible (Table S1). Weused official definition of the administrative area to cut the mosaickedimages for each city using ERDAS Imagine version 9.2. Each selectedimage was geo-encoded, re-projected, histogram equalized and re-sampled to the resolution of 30m. The coordinate system of AlbersConical Equal Area was used in this study.
We further coordinated Digital Elevation Models (DEM, down-loaded from http://www.gdem.aster.ersdac.or.jp/search.jsp) andNormalized Difference Vegetation Index (NDVI, derived from the re-mote sensing images) to enhance the spectral and topographic hetero-geneity and thus facilitate our following classification. The maximumlikelihood classification (MLC) approach was used to classify the landcovers into four types (i.e., cropland, urban land, water body, and othercover) (Zhao et al., 2006; Sun et al., 2015; Wu et al., 2015). The urbanland consisted of all non-vegetative areas (e.g., roads and buildings),including transportation, industrial, commercial and residential spacewithin the administrative boundary.
This study used the high-resolution images provided by GoogleEarth Pro to validate the classification results of all cities (Luedelingand Buerkert, 2008; Zhou et al., 2012). In addition, some of the localphotos uploaded to the Panoramio website (http://www.panoramio.com/) were used to help distinguish different land cover types. Becauseof the lack of high-resolution images before 2009, this article usesGoogle Earth's satellite imagery for 2010 and 2015 to validate (1)classification products in 2010 and 2015 and (2) land cover unchangedarea in the classification products from 1978 to 2010. For each city,three sets of 300 random points were selected based on the stratifiedsampling method in the 2010 and 2015 classification results and in thearea where land cover was not changed between 1978 and 2010. Theresults show that the Kappa coefficients of all cities in 2010 and 2015are larger than 0.77, the accuracy of classification results before 2010 isgreater than 0.82 (Table S2), which can meet the accuracy require-ments of land cover change evaluation (Foody, 2002).
Table 1Urban hierarchical System of the Jing-Jin-Ji Urban Agglomeration.
Level City Per capita GDP (dollars) Area (km2) Administrative divisions
Capital and Municipality Beijing 16278 16411 16 districtsMunicipality Tianjin 17131 11946 15 districts 1 countyProvincial capital Shijiazhuang 7907 15848 6 districts 17 countiesPrefectural Tangshan 13148 13472 6 districts 8 countiesPrefectural Langfang 7490 6429 2 districts 8 countiesPrefectural Cangzhou 6978 13419 2 districts 14 countiesPrefectural Qinhuangdao 6415 7812 3 districts 4 countiesPrefectural Chengde 6218 39519 3 districts 8 countiesPrefectural Handan 5377 12087 4 districts 15 countiesPrefectural Zhangjiakou 5011 36797 4 districts 13 countiesPrefectural Baoding 4389 22185 3 districts 22 countiesPrefectural Hengshui 4206 8815 2 districts 10 countiesPrefectural Xingtai 3763 12486 2 districts 17 counties
Table 2Socioeconomic data of three major urban agglomerations in China.
UrbanAgglomeration
Area(104 km2)
GDP(1012
RMB)a
% NationalGDP
Population(Million)b
Jing-Jin-Ji 21.6 6.6 10.5 110.5Yangtze River Delta 21.17 12.7 20.0 150.0Pearl River Delta 5.6 5.8 8.9 57.4
a 1 RMB approximately equals 0.15 US Dollar.b Resident population.
Y. Sun, S. Zhao Ecological Indicators 87 (2018) 302–313
304

2.3. Rates and spatiotemporal analyses of urban expansion
The annual urban expansion rate (AER) of each city between sixneighboring periods from 1978 to 2015 was computed using followingequation:
⎜ ⎟= × ⎛⎝
− ⎞⎠
UU
AER 100% 1end
startd
(1)
where Ustart is the urban area at the initial time, Uend is the urban area atthe end time, and d is the time span of the period in years.
Urbanization may proceed by different urban growth modes at agiven urban growth rate (Berling-Wolff and Wu, 2004). We classifiedurban growth into infilling, edge-expansion, and leapfrogging to ex-amine urban expansion patterns and processes. To differentiate in-filling, edge-expansion and leapfrogging, an urban expansion type (E)index (Zhao et al., 2015b) was calculated using following equation:
= LP
E com
new (2)
where Pnew is the perimeter of a newly developed urban patch, and Lcomis the length of common edge between the existing urban patch orpatches and the newly developed urban patch. The urban expansiontype will be defined according to the value of E ranging from 0 to 1: thenew urban patch is infilling when E > 0.5, edge-expansion when0 < E≤ 0.5, and leapfrogging when E=0 (Zhao et al., 2015b).
Zhao et al. (2015b) analyzed the composition and frequency dis-tribution of urban patches through binning them into 13 patch size
classes: 0–0.05, 0.05–0.25, 0.25–0.5, 0.5–1, 1–2, 2–5, 5–10, 10–20,20–50, 50–100, 100–200, 200–500, and> 500 km2 and calculated thearea and perimeter of each urban land patch. They derived a relation-ship for calculating the number of patches given the patch size and thetotal urban land area for 32 major cities (including Beijing, Tianjin andShijiazhuang) of China from 1978 to 2010 (Zhao et al., 2015b):
= −S AN 0. 0863 1.29 0.977 (3)
where S is the mean patch size (km2) of each bin based on the aboveclassification and N is the corresponding patch number of each bin; Astands for the total urban area of each city (km2, excluding the binswith only one patch).
In this study, we attempt to apply the equation to test the data forBeijing, Tianjin and Shijiazhuang in 2015 since newly implementedseries of policies might have affected the urban expansion process ofthese cities. We further explored the applicability of this equation forother 10 cities from the Jing-Jin-Ji Urban Agglomeration between thelate 1970s and 2015 to examine whether an invariant scaling re-lationship between patch number, and patch size and total urban areaacross the urban administrative hierarchy exists.
2.4. Test of the impact of urban administrative hierarchy and size on urbanexpansion rate
Cities in this study fall into two levels in terms of urban adminis-trative hierarchy: the higher level includes Beijing, Tianjin andShijiazhuang and the lower level includes the ten prefectural cities of
Fig. 2. Change of spatial extent of urban areas in the Jing-Jin-Ji Urban Agglomeration from 1978 to 2015. The background map shows the topography of China.
Y. Sun, S. Zhao Ecological Indicators 87 (2018) 302–313
305

the Jing-Jin-Ji Urban Agglomeration. We used the Turkey HSD test toexamine the difference between the two levels of cities in urban ex-pansion rate, with significant difference (α=0.05) suggesting a sig-nificant impact of the administrative hierarchy on urban expansion.
On the other hand, cities with higher administrative ranks generallyhave larger city size and more urban land for urban expansion (Zenget al., 2017). Therefore, we examined the relationship between the sizeand urban expansion rate to test whether the Gibrat’s law holds at theregional level of the Jing-Jin-Ji Urban Agglomeration:
=AER kA γstart (4)
where AER is the urban expansion rate, and k and γ are regressioncoefficients. In this study, we took logarithms of both sides of Eq. (4)and calculated the coefficient γ and its 95% confidence range. If the95% confidence range of the coefficient γ did not include zero, weconsidered that the coefficient γ was significantly different from zeroand thus Gibrat’s law does not hold (Zhao et al., 2015a).
3. Results
3.1. Magnitude, rates, and spatial patterns of urban expansion
Fig. 2 illustrated the overall spatial extent of urban areas in the Jing-Jin-Ji Urban Agglomeration from the late 1970s to 2015. Hot zone ofurban growth was around Bohai Economic Rim with two municipalities(i.e., Beijing and Tianjin) and two prefectural cities of Hebei (i.e.,Tangshan and Cangzhou). Fig. 3 presents the areas and rates of urbanexpansion by city and time. The overall annual AER for the 13 citieswas 5.5 ± 2.0% between 1978 and 2015. The temporal pattern andmagnitude of urban growth varied across cities with different hier-archical level over the past 37 years. Beijing, Tianjin, and Shijiazhuangbelong to the higher hierarchy level of this region and they added up to
49.6 percent of the total urban land area of the Jing-Jin-Ji Urban Ag-glomeration in the late 1970s and increased 6717.7 km2 over the past37 years, accounting for 36.6% of the total increased urban land area ofthis region. It is noticeable that Tianjin led the rapid urbanization ofthis region from the 1ate 1970s to 2015. The ecological barrier andtourism cities of the Jing-Jin-Ji Urban Agglomeration (i.e., Chengde,Zhangjiakou and Qinhuangdao) had small urbanized areas (28, 65 and42 km2, respectively) in the initial period. Although these cities hadhigh AER (9.1%, 6.9% and 8.0%, respectively) from the late 1970s to2015, they only contributed to 11.3% of the total increased regionalurban land area. Four land-locked cities (i.e., Handan, Hengshui,Langfang, and Xingtai) displayed an average rate of urban growthduring the past 37 years.
The rapid urbanization of the Jing-Jin-Ji Urban Agglomeration re-sulted from a combination of three urban growth types (i.e., infilling,edge-expansion, and leapfrogging) (Fig. 4). As urbanization continued,the relative proportions of three growth types in terms of patch numberhave experienced drastic changes from 1978 to 2015 (Fig. 5). In theinitial period (i.e., 1978–1990), most cities were distributed toward theupper end of leapfrogging in the urban growth triangle, and edge-ex-pansion became dominant thereafter. Infilling increased its sharessubstantially after the period of 1978–1990 and showed completelyopposite trends of leapfrogging. The statistics associated with thesethree patterns are summarized in Table 3. The mean fraction of infillingwas quite low (7.1%) in 1978–1990, giving way to edge-expansion andleapfrogging. Although the mean fractions of infilling fluctuated be-tween 1990 and 2015, its coefficient of variation (CV) steadily de-creased from 0.34 to 0.24. On the other hand, Table 3 illustrated theincreasing role of edge-expansion in urban growth process of the Jing-Jin-Ji Urban Agglomeration since 1990, increasing from about 30% to46% over time. In contrast, the weight of leapfrogging gradually
Fig. 3. The existing urban area in 1978 and growthof urban area (km2) between six neighboring periodsfrom 1978 to 2015 for 13 cities in the Jing-Jin-JiUrban Agglomeration.
Y. Sun, S. Zhao Ecological Indicators 87 (2018) 302–313
306

decreased to about 24.4% during 2005–2010 and then rebounded to33.3%. It is noticeable that after 2000, the spatial expansion patterns ofChengde and Zhangjiakou were significantly different from other 11cities, both of which were composed of larger proportion of leapfrog-ging and smaller proportion of edge-expansion.
3.2. Characteristics of urban land patches
Patch analysis revealed that the patch size and its number in eachcity of the Jing-Jin-Ji Urban Agglomeration at a given time generallyfollowed the “hockey-stick” log–log relationship (Fig. 6). The urbanland patch with a frequency of one (i.e., the hockey stick’s “blade”portion) usually refer to the urban center or core of a city and thus canreflect the expansion trait of a city’s largest urban land patch. Beijing,Tianjin and Shijiazhuang had quite similar hockey-stick structure withapparent blade part and mostly overlapped sticks over the past 37years. However, the other ten prefectural cities displayed slightly dif-ferent structures of urban land patches. The hockey-sticks in 1978 forTangshan and Qinhuangdao are obviously lower than other periods,which indicates that the urban land patches of the two cities increased
considerably from 1978 to 1990, especially small size urban patches.Noticeably, characteristics of the smallest size bins for Chengde andZhangjiakou differ from other cities with a gradually increasing trend ateach given time. The other six prefectural cities shared roughly similarcharacteristics of urban land patches.
3.3. Relationship between patch number and size
We applied the Eq. (3) to test the data for Beijing, Tianjin andShijiazhuang in 2015 since newly implemented series of policies mighthave affected the urban expansion process of these cities (Fig. 7). Sur-prisingly, the equation worked well (p < 0.001) which implied theinvariance of the function. A slight overestimation of the number ofurban patches was found for Tianjin and Shijiazhuang in 2015 (Fig. 7Band C), which was related to their magnitude of urban expansion andcomposition of urban growth types (Figs. 3 and 5). Our analysis alsoshowed that the equation predicted remarkably well for those 10 pre-fectural cities in the Jing-Jin-Ji Urban Agglomeration (Fig. 8). Notice-ably, the robustness of our equation increased steadily from the late1970s to 2015 and the predicted and observed number of patches had
Fig. 4. Spatial distribution of three urban expansion types for the Jing-Jin-Ji Urban Agglomeration among six neighboring periods from 1978 to 2015.
Y. Sun, S. Zhao Ecological Indicators 87 (2018) 302–313
307

almost lain in 1:1 line since 1995 (Fig. 8A–G).
3.4. Relationship between urban administrative rank or size and urbanexpansion rate
The average urban expansion rates were 4.1% and 5.9% respec-tively for the provincial and prefectural cities in the administrativehierarchy. There was no significant difference in urban expansion ratesbetween the two levels of cities (α=0.05). However, the differencewas substantial (p=0.076) and the expansion rate of prefectural citieswas higher on average than that of provincial cities, opposite to theurban hierarchy theory (i.e., provincial cities expand faster than the
prefectural ones because of power and resource accessibility).Fig. 9 illustrates the temporal change of urban expansion rates
against city size of all major cities in the Jing-Jin-Ji Urban Agglom-eration and shows the 95% confidence ranges of the coefficient γ foreach time period. Except 2005–2010, the 95% confidence ranges of thecoefficient γ for each time period does not contain zero and γ is sig-nificantly lower than zero. The negative γ suggests that smaller citiesexpanded faster than larger ones, contradicting Gibrat’s law and pos-sibly the urban hierarchy theory. During the period 2005–2010, therelationship between expansion rate and city size became insignificant(the coefficient is not significantly different from zero). Therefore,Girat’s law applies for the Jing-Jin-Ji Urban Agglomeration only in2005–2010, but the urban hierarchy theory still does not hold. It isnoticeable that during the entire period from 1978 to 2010, the 95%confidence bounds of the coefficient γ was [−0.36, −0.22], contra-dicting Gibrat’s law and the urban hierarchy theory.
4. Discussion
4.1. Urban expansion diversity of 13 cities
Over the past 37 years, all major cities of the Jing-Jin-Ji UrbanAgglomeration experienced rapid urban expansion. However, the spa-tial and temporal patterns of urban expansion varied widely amongcities. Therefore, it is of great importance to take account of intercitydifferences in making urban planning strategies to achieve the
Fig. 5. Change of the proportional composition, calculated from number of patches, of the three growth types (i.e., infilling, edge-expansion, and leapfrogging) with city and time.
Table 3The mean fractions (%) and coefficient of variation (i.e., mean divided by standard de-viations) of the three urban growth types in terms of patch number across 13 cities duringeach time period.
Infilling Edge-expansion Leapfrogging
Mean CV Mean CV Mean CV
1978–1990 7.1 0.52 30.3 0.39 62.6 0.231990–1995 23.7 0.34 42.7 0.13 33.6 0.391995–2000 29.1 0.26 41.8 0.12 29.0 0.392000–2005 26.3 0.28 45.1 0.13 28.6 0.372005–2010 28.3 0.25 47.3 0.09 24.4 0.312010–2015 20.5 0.24 46.3 0.16 33.3 0.29
Y. Sun, S. Zhao Ecological Indicators 87 (2018) 302–313
308

coordinated development goal of this region. Urban expansion rate anddiversity are defined by multiple forces including various physical andadministrative conditions. Chengde, Qinhuangdao, and Zhangjiakouare designated as tourist and ecological barrier cities for the entire re-gion with relatively lower per capita GDP (Table 1). With substantiallylower initial expansion rates compared to other cities of the Jing-Jin-JiUrban Agglomeration, these three cities experienced increasing urbanexpansion rates during the recent decade (Fig. 3). Taking Chengde as anexample (Fig. 4), physical conditions such as Bashang Plateau greatlyconstrained its urban expansion direction and urban expansion patchesonly concentrated in the plain area between mountains. Although theurbanization process of Chengde accelerated since 2010, the leapfrog-ging patches which accounts for the highest proportion of its urbanexpansion types still mostly distributed along the narrow intermountainplain of Yanshan Mountain Range. Comparatively, urban expansion ofcoastal cities (e.g. Cangzhou, Tangshan and Tianjin) on one hand enjoysthe advantage of flat terrain (Fig. 2), and on the other hand have beenpromoted by the strategy of local city or Hebei Province to developinternational trade, shipping, and logistics industry in coastal areas(Zhang et al., 2016).
4.2. Urban administrative hierarchy effect
The urban hierarchy theory states that, in China, a city with a higheradministrative status is more likely to obtain more construction land
quota for development and thus acquire higher potential for urbanexpansion and economic development (Zeng et al., 2017). However,our results revealed that cities with higher ranks in the administrativehierarchy might not be better positioned for urban expansion. Threemajor provincial cities (i.e., Tianjin, Beijing and Shijiazhuang) of theJing-Jin-Ji Urban Agglomeration did contribute 36.6% of the urbanland area increase of this region, but the urban expansion rates of werenot the highest. In fact, the expansion rate was inversely related to citysize during the entire study period (Fig. 9G). Before 2005, prefecturalcities in general expanded faster than the above three cities with higherurban administrative ranks (Fig. 9A–D). In the only period when Gi-brat’s law held (i.e., 2005–2010), cities with higher administrativeranks (Fig. 9E) showed comparable fast expansion to the rates ofsmaller cities, which is consistent with previous study (Zhao et al.,2015a). The newly implemented strategy of “urbanization from below”which aims to “strictly control the growth of large cities, rationallydevelop medium sized cities, and vigorously promote the developmentof small cities and town” (Li, 2012) might have limited the further rapidexpansion of Beijing and Tianjin (Fig. 9F). Furthermore, the new na-tional policy “Integrated and coordinated development of Beijing,Tianjin and Hebei” have been issued to promote the future urbanizationof Hebei Province (Zhang et al., 2017), as evidenced by the abruptdecrease of AER for Beijing and Tianjin, but continued increase forShijiazhuang (the capital city of Hebei Province) and prefectural citiesof Hebei Province (Figs. 3 and 9F). Therefore, when analyzing the
Fig. 6. The relationship between the number and size of patches across cities and time periods.
Fig. 7. Comparison of predicted and observed number of urban land patches for Beijing (A), Tianjin (B) and Shijiazhuang (C) in 2015 using = −N 0.0863S A1.29 0.977 (where S is the patchsize and A is the total urban area excluding the largest patch).
Y. Sun, S. Zhao Ecological Indicators 87 (2018) 302–313
309

impact of urban administrative hierarchy on urban expansion rate, it isnecessary to take the critical role of government planning policy intoaccount at the same time for better understanding the organizationevolution of cities in contemporary China (Li et al., 2015; Zhao et al.,2015a). To better understand the hierarchical effect of administrative
level on urban expansion in China’s urban agglomerations, we com-pared the hierarchy structure of the Jing-Jin-Ji Urban agglomerationwith the Yangtze River Delta and the Pearl River Delta to shed light onpossible drivers behind different urbanization situations in China's topthree urban agglomerations. We found that adjustment to the urban
Fig. 8. Comparison of predicted and observed number of patches for a given patch size across 10 prefectural cities from the late 1970s to 2015. The equation used was the same as inFig. 7.
Fig. 9. The relationship between urban expansion rate and city size from 1978 to 2015. The values of γ is the 95% confidence range of the exponent of the power regression.
Y. Sun, S. Zhao Ecological Indicators 87 (2018) 302–313
310
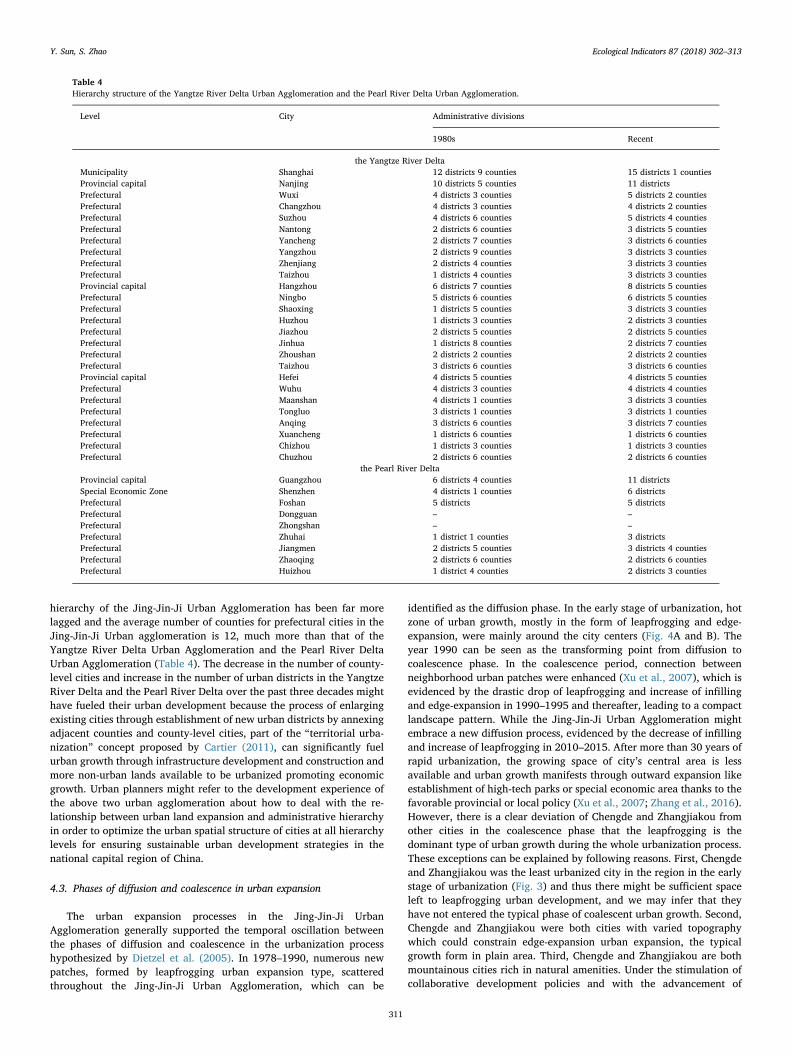
hierarchy of the Jing-Jin-Ji Urban Agglomeration has been far morelagged and the average number of counties for prefectural cities in theJing-Jin-Ji Urban agglomeration is 12, much more than that of theYangtze River Delta Urban Agglomeration and the Pearl River DeltaUrban Agglomeration (Table 4). The decrease in the number of county-level cities and increase in the number of urban districts in the YangtzeRiver Delta and the Pearl River Delta over the past three decades mighthave fueled their urban development because the process of enlargingexisting cities through establishment of new urban districts by annexingadjacent counties and county-level cities, part of the “territorial urba-nization” concept proposed by Cartier (2011), can significantly fuelurban growth through infrastructure development and construction andmore non-urban lands available to be urbanized promoting economicgrowth. Urban planners might refer to the development experience ofthe above two urban agglomeration about how to deal with the re-lationship between urban land expansion and administrative hierarchyin order to optimize the urban spatial structure of cities at all hierarchylevels for ensuring sustainable urban development strategies in thenational capital region of China.
4.3. Phases of diffusion and coalescence in urban expansion
The urban expansion processes in the Jing-Jin-Ji UrbanAgglomeration generally supported the temporal oscillation betweenthe phases of diffusion and coalescence in the urbanization processhypothesized by Dietzel et al. (2005). In 1978–1990, numerous newpatches, formed by leapfrogging urban expansion type, scatteredthroughout the Jing-Jin-Ji Urban Agglomeration, which can be
identified as the diffusion phase. In the early stage of urbanization, hotzone of urban growth, mostly in the form of leapfrogging and edge-expansion, were mainly around the city centers (Fig. 4A and B). Theyear 1990 can be seen as the transforming point from diffusion tocoalescence phase. In the coalescence period, connection betweenneighborhood urban patches were enhanced (Xu et al., 2007), which isevidenced by the drastic drop of leapfrogging and increase of infillingand edge-expansion in 1990–1995 and thereafter, leading to a compactlandscape pattern. While the Jing-Jin-Ji Urban Agglomeration mightembrace a new diffusion process, evidenced by the decrease of infillingand increase of leapfrogging in 2010–2015. After more than 30 years ofrapid urbanization, the growing space of city’s central area is lessavailable and urban growth manifests through outward expansion likeestablishment of high-tech parks or special economic area thanks to thefavorable provincial or local policy (Xu et al., 2007; Zhang et al., 2016).However, there is a clear deviation of Chengde and Zhangjiakou fromother cities in the coalescence phase that the leapfrogging is thedominant type of urban growth during the whole urbanization process.These exceptions can be explained by following reasons. First, Chengdeand Zhangjiakou was the least urbanized city in the region in the earlystage of urbanization (Fig. 3) and thus there might be sufficient spaceleft to leapfrogging urban development, and we may infer that theyhave not entered the typical phase of coalescent urban growth. Second,Chengde and Zhangjiakou were both cities with varied topographywhich could constrain edge-expansion urban expansion, the typicalgrowth form in plain area. Third, Chengde and Zhangjiakou are bothmountainous cities rich in natural amenities. Under the stimulation ofcollaborative development policies and with the advancement of
Table 4Hierarchy structure of the Yangtze River Delta Urban Agglomeration and the Pearl River Delta Urban Agglomeration.
Level City Administrative divisions
1980s Recent
the Yangtze River DeltaMunicipality Shanghai 12 districts 9 counties 15 districts 1 countiesProvincial capital Nanjing 10 districts 5 counties 11 districtsPrefectural Wuxi 4 districts 3 counties 5 districts 2 countiesPrefectural Changzhou 4 districts 3 counties 4 districts 2 countiesPrefectural Suzhou 4 districts 6 counties 5 districts 4 countiesPrefectural Nantong 2 districts 6 counties 3 districts 5 countiesPrefectural Yancheng 2 districts 7 counties 3 districts 6 countiesPrefectural Yangzhou 2 districts 9 counties 3 districts 3 countiesPrefectural Zhenjiang 2 districts 4 counties 3 districts 3 countiesPrefectural Taizhou 1 districts 4 counties 3 districts 3 countiesProvincial capital Hangzhou 6 districts 7 counties 8 districts 5 countiesPrefectural Ningbo 5 districts 6 counties 6 districts 5 countiesPrefectural Shaoxing 1 districts 5 counties 3 districts 3 countiesPrefectural Huzhou 1 districts 3 counties 2 districts 3 countiesPrefectural Jiazhou 2 districts 5 counties 2 districts 5 countiesPrefectural Jinhua 1 districts 8 counties 2 districts 7 countiesPrefectural Zhoushan 2 districts 2 counties 2 districts 2 countiesPrefectural Taizhou 3 districts 6 counties 3 districts 6 countiesProvincial capital Hefei 4 districts 5 counties 4 districts 5 countiesPrefectural Wuhu 4 districts 3 counties 4 districts 4 countiesPrefectural Maanshan 4 districts 1 counties 3 districts 3 countiesPrefectural Tongluo 3 districts 1 counties 3 districts 1 countiesPrefectural Anqing 3 districts 6 counties 3 districts 7 countiesPrefectural Xuancheng 1 districts 6 counties 1 districts 6 countiesPrefectural Chizhou 1 districts 3 counties 1 districts 3 countiesPrefectural Chuzhou 2 districts 6 counties 2 districts 6 counties
the Pearl River DeltaProvincial capital Guangzhou 6 districts 4 counties 11 districtsSpecial Economic Zone Shenzhen 4 districts 1 counties 6 districtsPrefectural Foshan 5 districts 5 districtsPrefectural Dongguan – –Prefectural Zhongshan – –Prefectural Zhuhai 1 district 1 counties 3 districtsPrefectural Jiangmen 2 districts 5 counties 3 districts 4 countiesPrefectural Zhaoqing 2 districts 6 counties 2 districts 6 countiesPrefectural Huizhou 1 district 4 counties 2 districts 3 counties
Y. Sun, S. Zhao Ecological Indicators 87 (2018) 302–313
311

technology such as road construction and building engineering, inner-city and inter-city highway of Chengde and Zhangjiakou increased,which might on one hand facilitate the tourism development ofChengde and Zhangjiakou, and on the other hand fire the investment ofreal estate on independent villas which have been increasingly popularin tourist cities of China.
4.4. Urban patch structure under urban administrative hierarchy
Our urban patch analysis verified that a converged urban patchstructure and an invariant scaling relationship between patch size andits corresponding number (Zhao et al., 2015b) can be applied to capitalmunicipality, municipality, provincial capital and prefectural cities in-dependent of the ranks in the urban administrative hierarchy. A slightoverestimation (Fig. 7) for Tianjin and Shijiazhuang might be related tothe fact that Tianjin underwent urban expansion with almost the lowestannual growth rate whereas Shijiazhuang did experience its highestrate of urban expansion but most of this growth (more than 80%) wasaccomplished via the forms of edge-expansion and infilling that will notincrease the number of patches, resulting in higher predictions thanobservations. One important reason for the relatively poor fitting(Fig. 8A) for the 10 prefectural cities in the late 1970s might be thestrong governmental intervention on urban expansion. In addition, theresampling of MSS imagery from 60m to 30m resolution might lead tothe number of patches higher than its true value and a resultant un-derprediction. The generality of converged urban path structure acrossthe urban hierarchy systems in the Jing-Jin-Ji Urban Agglomerationimplies that although cities are complex systems interwoven withphysical, socioeconomic, political and planning properties and pro-cesses, they are invariantly self-organized in a way that can be easilyunderstood and managed.
5. Conclusions
China has 23 urban agglomerations that are considered to possessthe greatest potential for China’s future economic development.Although the urbanization of the Jing-Jin-Ji Urban Agglomeration hasbeen behind the Yangtze River Delta Urban Agglomeration and thePearl River Delta Urban Agglomeration, the new policy of “To build aworld-class agglomeration of cities with the capital as the core” will belikely to fuel the urbanization process of this region.
We quantified and compared the magnitude, rates, and forms ofurban expansion, urban patch structure, and their dynamics for 13 ci-ties across the Jing-Jin-Ji Urban Agglomeration from 1978 to 2015. Therates and forms of urban expansion varied considerably across citiesand time due to national and regional policies, physical features and theurban administrative hierarchy. The overall annual urban expansionrate for 13 cities was 5.5 ± 2.0% between 1978 and 2015. For mostcities, edge-expansion accounts for the highest proportion of urbanexpansion form except the early period when leapfrogging dominated.The diverged patterns of urban growth composition for two mountai-nous cities suggested that the influence of physical intrinsic features ofthe city on urban expansion could not be ignored in regional urbanplanning and management strategies. Three major cities (i.e., Tianjin,Beijing and Shijiazhuang) of the Jing-Jin-Ji Urban Agglomerationcontributed 36.6% of the urban land area increase of this region.However, the urban expansion rate was generally inversely related tocity size, contradicting Gibrat’s law during the study period except2005–2010. Therefore, we cannot draw the conclusion that in the Jing-Jin-Ji Urban Agglomeration, larger cities were better positioned forurban expansion than their smaller counterparts as the hierarchicaltheory implies. Considerable differences in urbanization level andurban growth trajectory were found for those 13 cities over the past 37years. Beijing, Tianjin, Shijiazhuang and Baoding contributed to 45.4percentage of the increased urban land area, with Tianjin leading the
rapid urbanization of this region while Chengde, Zhangjiakou, andQinhuangdao not only displayed distinct spatial patterns of urban ex-pansion from other cities but also ranked in the bottom of urban growthrate.
Our results generally supported the applicability of converged urbanpatch structure across time and space, and an invariant scaling re-lationship between patch size and its corresponding number could beapplied to capital municipality, municipality, provincial capital andprefectural cities despite the urban administrative hierarchy.
Acknowledgments
This study was supported by the National Natural ScienceFoundation of China Grants 41590843, 41771093 and 41571079.
Appendix A. Supplementary data
Supplementary data associated with this article can be found, in theonline version, at https://doi.org/10.1016/j.ecolind.2017.12.038.
References
Berling-Wolff, S., Wu, J., 2004. Modeling urban landscape dynamics: a case study inPhoenix, USA. Urban Ecosyst. 7 (3), 215–240. http://dx.doi.org/10.1023/B:UECO.0000044037.23965.45.
Bloom, D.E., 2011. 7 billion and counting. Science 333 (6042), 562–569. http://dx.doi.org/10.1126/science.1209290.
Cartier, C., 2011. Urban growth, rescaling, and the spatial administrative hierarchy. Prov.China 3 (1), 9–33. http://epress.lib.uts.edu.au/journals/index.php/provincial_china/article/view/2440.
Chan, K.W., 2010. Fundamentals of China's urbanization and policy. China Rev. 63–93.http://www.jstor.org/stable/23462243.
Cobbinah, P.B., Erdiaw-Kwasie, M.O., Amoateng, P., 2015. Africa’s urbanisation: im-plications for sustainable development. Cities 47, 62–72. http://dx.doi.org/10.1016/j.cities.2015.03.013.
Cohen, B., 2006. Urbanization in developing countries: current trends, future projections,and key challenges for sustainability. Technol. Soc. 28 (1), 63–80. http://dx.doi.org/10.1016/j.techsoc.2005.10.005.
Dietzel, C., Herold, M., Hemphill, J.J., Clarke, K.C., 2005. Spatio-temporal dynamics inCalifornia's Central Valley: empirical links to urban theory. Int. J. Geogr. Inf. Sci. 19(2), 175–195. http://dx.doi.org/10.1080/13658810410001713407.
Eeckhout, J., 2004. Gibrat's law for (All) cities. Am. Econ. Rev. 94 (5), 1429–1451. http://dx.doi.org/10.1257/0002828043052303.
Foody, G.M., 2002. Status of land cover classification accuracy assessment. Remote Sens.Environ. 80 (1), 185–201. http://dx.doi.org/10.1016/S0034-4257(01)00295-4.
Grimm, N.B., Faeth, S.H., Golubiewski, N.E., Redman, C.L., Wu, J., Bai, X., Briggs, J.M.,2008. Global change and the ecology of cities. Science 319 (5864), 756–760. http://dx.doi.org/10.1126/science.1150195.
Haas, J., Ban, Y., 2014. Urban growth and environmental impacts in Jing-Jin-Ji, theYangtze, River Delta and the Pearl River Delta. Int. J. Appl. Earth Obs. Geoinf. 30,42–55. http://dx.doi.org/10.1016/j.jag.2013.12.012.
He, C., Liu, Z., Tian, J., Ma, Q., 2014. Urban expansion dynamics and natural habitat lossin China: a multiscale landscape perspective. Global Change Biol. 20 (9), 2886–2902.http://dx.doi.org/10.1111/gcb.12553.
Hu, X., Hall, J.W., Shi, P., Lim, W.H., 2016. The spatial exposure of the Chinese infra-structure system to flooding and drought hazards. Nat. Hazards 80 (2), 1083–1118.http://dx.doi.org/10.1007/s11069-015-2012-3.
Jiang, B., Jia, T., 2011. Zipf's law for all the natural cities in the United States: a geospatialperspective. Int. J. Geogr. Inf. Sci. 25 (8), 1269–1281. http://dx.doi.org/10.1080/13658816.2010.510801.
Kaushal, S.S., McDowell, W.H., Wollheim, W.M., 2014. Tracking evolution of urbanbiogeochemical cycles: past, present, and future. Biogeochemistry 121 (1), 1–21.http://dx.doi.org/10.1007/s10533-014-0014-y.
Kennedy, C.A., Stewart, I., Facchini, A., Cersosimo, I., Mele, R., Chen, B., Sahin, A.D.,et al., 2015. Energy and material flows of megacities. Proc. Natl. Acad. Sci. 112 (19),5985–5990. http://dx.doi.org/10.1073/pnas.1504315112.
Li, C., Li, J., Wu, J., 2013. Quantifying the speed, growth modes, and landscape patternchanges of urbanization: a hierarchical patch dynamics approach. Landsc. Ecol. 28(10), 1875–1888. http://dx.doi.org/10.1007/s10980-013-9933-6.
Li, H., Wei, Y., Liao, F., Huang, Z., 2015. Administrative hierarchy and urban land ex-pansion in transitional China. Appl. Geogr. 56, 177–186. http://dx.doi.org/10.1016/j.apgeog.2014.11.029.
Li, Y.H., 2012. Urban-rural interaction patterns and dynamic land use: implications forurban-rural integration in China. Reg. Environ. Change 12 (4), 803–812. http://dx.doi.org/10.1007/s10113-012-0295-4.
Liu, Y., Yin, G., Ma, L.J., 2012. Local state and administrative urbanization in post-reformChina: a case study of Hebi City, Henan Province. Cities 29 (2), 107–117. http://dx.doi.org/10.1016/j.cities.2011.08.003.
Y. Sun, S. Zhao Ecological Indicators 87 (2018) 302–313
312

Luedeling, E., Buerkert, A., 2008. Typology of oases in northern Oman based on Landsatand SRTM imagery and geological survey data. Remote Sens. Environ. 112 (3),1181–1195.
Rozenfeld, H.D., Rybski, D., Andrade, J.S., Batty, M., Stanley, H.E., Makse, H.A., 2008.Laws of population growth. Proc. Natl. Acad. Sci. U. S. A. 105 (48), 18702–18707.http://dx.doi.org/10.1073/pnas.0807435105.
Schneider, A., Mertes, C.M., 2014. Expansion and growth in Chinese cities, 1978–2010.Environ. Res. Lett. 9 (2), 024008. http://dx.doi.org/10.1088/1748-9326/9/2/024008.
Sun, Y., Zhao, S., Qu, W., 2015. Quantifying spatiotemporal patterns of urban expansionin three capital cities in Northeast China over the past three decades using satellitedata sets. Environ. Earth Sci. 73 (11), 7221–7235. http://dx.doi.org/10.1007/s12665-014-3901-6.
United Nations, 2015. World Urbanization Prospects: The 2014 Revision. United NationsDepartment of Economics and Social Affairs, Population Division, New York.
Wang, M., Yan, X., Liu, J., Zhang, X., 2013. The contribution of urbanization to recentextreme heat events and a potential mitigation strategy in the Beijing-Tianjin-Hebeimetropolitan area. Theor. Appl. Climatol. 114 (3–4), 407–416. http://dx.doi.org/10.1007/s00704-013-0852-x.
Wu, J., Xiang, W.-N., Zhao, J., 2014. Urban ecology in China: historical developments andfuture directions. Landsc. Urban Plann. 125, 222–233. http://dx.doi.org/10.1016/j.landurbplan.2014.02.010.
Wu, W., Zhao, S., Zhu, C., Jiang, J., 2015. A comparative study of urban expansion inBeijing, Tianjin and Shijiazhuang over the past three decades. Landsc. Urban Plann.134, 93–106. http://dx.doi.org/10.1016/j.landurbplan.2014.10.010.
Wu, J., 2014. Urban ecology and sustainability: the state of the science and future di-rections. Landsc. Urban Plann. 125, 209–221. http://dx.doi.org/10.1016/j.landurbplan.2014.01.018.
Xie, H., He, Y., Xie, X., 2017. Exploring the factors influencing ecological land change forChina's Beijing–Tianjin–Hebei region using big data. J. Clean. Prod. 142, 677–687.
http://dx.doi.org/10.1016/j.jclepro.2016.03.064.Xu, C., Liu, M., Zhang, C., An, S., Yu, W., Chen, J., 2007. The spatiotemporal dynamics of
rapid urban growth in the Nanjing metropolitan region of China. Landsc. Ecol. 22 (6),925–937. http://dx.doi.org/10.1007/s10980-007-9079-5.
Zeng, C., Zhang, A., Liu, L., Liu, Y., 2017. Administrative restructuring and land-use in-tensity—a spatial explicit perspective. Land Use Policy 67 (Supplement C), 190–199.http://dx.doi.org/10.1016/j.landusepol.2017.05.034.
Zhang, Q., Wallace, J., Deng, X., Seto, K.C., 2014. Central versus local states: whichmatters more in affecting China's urban growth? Land Use Policy 38, 487–496.http://dx.doi.org/10.1016/j.landusepol.2013.12.015.
Zhang, Z., Li, N., Wang, X., Liu, F., Yang, L., 2016. A Comparative Study of UrbanExpansion in Beijing, Tianjin and Tangshan from the 1970s to 2013. Remote Sens. 8(6), 496. http://dx.doi.org/10.3390/rs8060496.
Zhang, Y., Li, Y., Zheng, H., 2017. Ecological network analysis of energy metabolism inthe Beijing-Tianjin-Hebei (Jing-Jin-Ji) urban agglomeration. Ecol. Modell. 351,51–62. http://dx.doi.org/10.1016/j.ecolmodel.2017.02.015.
Zhao, S., Da, L., Tang, Z., Fang, H., Song, K., Fang, J., 2006. Ecological consequences ofrapid urban expansion: Shanghai, China. Front. Ecol. Environ. 4 (7), 341–346. http://dx.doi.org/10.1890/1540-9295(2006)004%5B0341:ECORUE%5D2.0.CO;2.
Zhao, S., Zhou, D., Zhu, C., Sun, Y., Wu, W., Liu, S., 2015a. Spatial and temporal di-mensions of urban expansion in China. Environ. Sci. Technol. 49 (16), 9600–9609.http://dx.doi.org/10.1021/acs.est.5b00065.
Zhao, S., Zhou, D., Zhu, C., Qu, W., Zhao, J., Sun, Y., Huang, D., Wu, W., Liu, S., 2015b.Rates and patterns of urban expansion in China’s 32 major cities over the past threedecades. Landsc. Ecol. 30 (8), 1541–1559. http://dx.doi.org/10.1007/s10980-015-0211-7.
Zhou, D., Zhao, S., Zhu, C., 2012. The Grain for Green Project induced land cover changein the Loess Plateau: a case study with Ansai County, Shanxi Province, China. Ecol.Indic. 23, 88–94. http://dx.doi.org/10.1016/j.ecolind.2012.03.021.
Y. Sun, S. Zhao Ecological Indicators 87 (2018) 302–313
313