Spatially clustered loci with multiple enhancers are ...
12
ARTICLE Spatially clustered loci with multiple enhancers are frequent targets of HIV-1 integration Bojana Lucic 1,11 , Heng-Chang Chen 2,3,11 , Maja Kuzman 4,11 , Eduard Zorita 2,3,11 , Julia Wegner 1,10 , Vera Minneker 5 , Wei Wang 6 , Raffaele Fronza 6 , Stefanie Laufs 6 , Manfred Schmidt 6 , Ralph Stadhouders 7,8 , Vassilis Roukos 5 , Kristian Vlahovicek 4 , Guillaume J. Filion 2,3,9 & Marina Lusic 1 HIV-1 recurrently targets active genes and integrates in the proximity of the nuclear pore compartment in CD4 + T cells. However, the genomic features of these genes and the relevance of their transcriptional activity for HIV-1 integration have so far remained unclear. Here we show that recurrently targeted genes are proximal to super-enhancer genomic elements and that they cluster in specific spatial compartments of the T cell nucleus. We further show that these gene clusters acquire their location during the activation of T cells. The clustering of these genes along with their transcriptional activity are the major deter- minants of HIV-1 integration in T cells. Our results provide evidence of the relevance of the spatial compartmentalization of the genome for HIV-1 integration, thus further strengthening the role of nuclear architecture in viral infection. https://doi.org/10.1038/s41467-019-12046-3 OPEN 1 Department of Infectious Diseases, Integrative Virology, Heidelberg University Hospital and German Center for Infection Research, Heidelberg, Germany. 2 Genome Architecture, Gene Regulation, Stem Cells and Cancer Programme, Center for Genomic Regulation (CRG), Barcelona Institute of Science and Technology, Barcelona, Spain. 3 University Pompeu Fabra, Barcelona, Spain. 4 Bioinformatics Group, Division of Molecular Biology, Department of Biology, Faculty of Science, University of Zagreb, Zagreb, Croatia. 5 Institute of Molecular Biology (IMB), Mainz, Germany. 6 German Cancer Research Center (DKFZ) and National Center for Tumor Diseases (NCT), Heidelberg, Germany. 7 Department of Pulmonary Medicine, Erasmus MC, Rotterdam, The Netherlands. 8 Department of Cell Biology, Erasmus MC, Rotterdam, The Netherlands. 9 Department of Biological Sciences, University of Toronto Scarborough, Toronto, ON, Canada. 10 Present address: Institute for Clinical Chemistry and Clinical Pharmacology, Universitätsklinikum Bonn, Bonn, Germany. 11 These authors contributed equally: Bojana Lucic, Heng-Chang Chen, Maja Kuzman, Eduard Zorita. 12 These authors jointly supervised this work: Kristian Vlahovicek, Guillaume J. Filion, Marina Lusic. Correspondence and requests for materials should be addressed to K.V. (email: [email protected]) or to G.J.F. (email: guillaume.fi[email protected]) or to M.L. (email: [email protected]) NATURE COMMUNICATIONS | (2019)10:4059 | https://doi.org/10.1038/s41467-019-12046-3 | www.nature.com/naturecommunications 1 1234567890():,;
Transcript of Spatially clustered loci with multiple enhancers are ...

ARTICLE
Spatially clustered loci with multiple enhancers arefrequent targets of HIV-1 integrationBojana Lucic1,11, Heng-Chang Chen 2,3,11, Maja Kuzman 4,11, Eduard Zorita 2,3,11, Julia Wegner1,10,
Vera Minneker5, Wei Wang6, Raffaele Fronza6, Stefanie Laufs6, Manfred Schmidt6, Ralph Stadhouders7,8,
Vassilis Roukos 5, Kristian Vlahovicek 4, Guillaume J. Filion 2,3,9 & Marina Lusic 1
HIV-1 recurrently targets active genes and integrates in the proximity of the nuclear pore
compartment in CD4+ T cells. However, the genomic features of these genes and the
relevance of their transcriptional activity for HIV-1 integration have so far remained unclear.
Here we show that recurrently targeted genes are proximal to super-enhancer genomic
elements and that they cluster in specific spatial compartments of the T cell nucleus. We
further show that these gene clusters acquire their location during the activation of T cells.
The clustering of these genes along with their transcriptional activity are the major deter-
minants of HIV-1 integration in T cells. Our results provide evidence of the relevance of the
spatial compartmentalization of the genome for HIV-1 integration, thus further strengthening
the role of nuclear architecture in viral infection.
https://doi.org/10.1038/s41467-019-12046-3 OPEN
1 Department of Infectious Diseases, Integrative Virology, Heidelberg University Hospital and German Center for Infection Research, Heidelberg, Germany.2 Genome Architecture, Gene Regulation, Stem Cells and Cancer Programme, Center for Genomic Regulation (CRG), Barcelona Institute of Science andTechnology, Barcelona, Spain. 3 University Pompeu Fabra, Barcelona, Spain. 4 Bioinformatics Group, Division of Molecular Biology, Department of Biology,Faculty of Science, University of Zagreb, Zagreb, Croatia. 5 Institute of Molecular Biology (IMB), Mainz, Germany. 6German Cancer Research Center (DKFZ)and National Center for Tumor Diseases (NCT), Heidelberg, Germany. 7 Department of Pulmonary Medicine, Erasmus MC, Rotterdam, The Netherlands.8 Department of Cell Biology, Erasmus MC, Rotterdam, The Netherlands. 9 Department of Biological Sciences, University of Toronto Scarborough, Toronto,ON, Canada. 10Present address: Institute for Clinical Chemistry and Clinical Pharmacology, Universitätsklinikum Bonn, Bonn, Germany. 11These authorscontributed equally: Bojana Lucic, Heng-Chang Chen, Maja Kuzman, Eduard Zorita. 12These authors jointly supervised this work: Kristian Vlahovicek,Guillaume J. Filion, Marina Lusic. Correspondence and requests for materials should be addressed to K.V. (email: [email protected])or to G.J.F. (email: [email protected]) or to M.L. (email: [email protected])
NATURE COMMUNICATIONS | (2019) 10:4059 | https://doi.org/10.1038/s41467-019-12046-3 | www.nature.com/naturecommunications 1
1234
5678
90():,;
Integration of the proviral genome into the host chromosomalDNA is one of the defining features of retroviral replication1–3.Following integration, the viral genome can either be expres-
sed or enter a transcriptionally dormant stage, establishing areservoir of latently infected cells. Latently infected cells areindistinguishable from the non-infected ones and are thereforenot eliminated by immune clearance mechanisms or recognizedby current antiretroviral treatments4,5. Resting CD4+ T cells ofthe memory phenotype represent the main reservoir of latenthuman immunodeficiency virus type 1 (HIV-1)6. However, it isstill unclear how these reservoirs are established, as HIV-1 doesnot efficiently infect resting T cells due to different blocks at bothpre-integration and integration levels4,7–10. One possible expla-nation is that some of the activated CD4+ T cells revert back tothe resting state upon infection with HIV-1, generating thereservoirs of silenced but replication-competent viruses4. Whatremains still to be defined is how this transition from activated toresting state occurs, and what changes in the cellular genome andchromatin are involved11,12.
In activated CD4+ T cells, the viral DNA enters the nucleus toaccess chromatin13 passing through the nuclear pore complex(NPC)14–16. Nuclear pore proteins are important factors forthe viral nuclear entry17, as well as for the positioning andconsequent integration of the viral DNA into the cellulargenome3,13–16,18,19. Integration is not a random process, as HIV-1 predominantly integrates into active genes in gene-denseregions20, mediated by the action of viral proteins integrase (IN)and capsid (CA). Through its interaction with LEDGF/p7521–23,IN guides the integration into gene bodies. This pattern is shiftedtoward 5′ end regions of genes22,24,25 or toward gene-poorregions25 when LEDGF/p75 is depleted. Through its interactionwith cleavage and polyadenylation specificity factor 6 (CPSF6),HIV-1 CA also contributes to the location of the viralgenome24,26,27. Lack of CPSF6 arrests the incoming viral particlesat the level of the NPC27 or retargets the integrating viral DNA tothe lamina-associated heterochromatin domains26.
It is well established that HIV-1 targets open chromatin regionsof active transcription and regions bearing enhancermarks20,28,29. Unlike typical enhancers, genomic elements knownas super-enhancers (SEs) are defined by high levels of acetylatedlysine 27 of histone 3 (H3K27ac) and binding of transcriptionalco-activators, such as bromodomain-containing protein 4(BRD4), the mediator complex30, and the p300 histone acetyl-transferase30–32. SEs control the expression of genes that definecell identity30,32–34, and in case of CD4+ T cells, relevant forHIV-1 infection, they control cytokines, cytokine receptors, andtranscription factors regulating T cell-specific transcriptionalprograms35. Strikingly, one of the strongest immune-activationSEs36,37 encoding for transcription factor BACH2 is among themost frequently targeted HIV-1 integration genes38,39. SE ele-ments of cell identity genes were shown to be bound by nuclearpore proteins, which regulate their expression40,41 and anchorthem to the nuclear periphery41. Moreover, SEs seem to play ageneral role in organizing the genome through higher-orderchromatin structures and architectural chromatin loops42–44.
Evidence accumulated in the past decade has revealed thatthe chromosomal contacts, achieved by genome folding andlooping, define separate compartments in the nucleus45. Hi-Cdata have shown that transcribed genes make preferentialcontacts with other transcribed genes, forming a spatial clusterknown as the A compartment46,47. Reciprocally, silent genesand intergenic regions form a spatial cluster known as the Bcompartment. The loci of the B compartment are usually incontact with the nuclear lamina48, i.e., at the periphery of thenucleus, where low levels of gene expression and hetero-chromatin histone signatures are found. In fact, these regions
are almost completely avoided by HIV-118,25,26, whereas HIV-1targets regions of open chromatin, which in some studies mapin proximity to the NPC18,19,49.
This suggests that a complex and dynamic interplay betweenthe incoming virus, the host cell chromatin, and the dynamicnuclear organization contribute to the selection of genomicsequences into which HIV-1 integrates.
Here we find that HIV-1 integrates in proximity of SEs inpatients and in T cell cultures in vitro. The observed phenomenondoes not depend on the activity of SEs but on their position inspatial neighborhoods where HIV-1 insertion is facilitated.Consistently, HIV-1 integration hotspots cluster in the nuclearspace and tend to contact SEs. Finally, we find that SE activity iscritical to reorganize the genome of activated T cells, showing thatthey indirectly contribute to HIV-1 insertion biases.
ResultsHIV-1 integrates in genes proximal to SEs. We assembled a listof 4031 HIV-1 integration sites from activated primary CD4+
T cells infected in vitro (ref. 50 and this study) and 9519 insertionsites from 6 studies from HIV-1 patients38,39,51–54 (Supplemen-tary Table 1). Ten thousand seven hundred and thirty-five inte-grations were in gene bodies (77% averaged over patient studiesand 84% over in vitro infection studies), targeting a total of 5601different genes (Supplementary Fig. 1a). This insertion dataset isnot saturating (Supplementary Fig. 1b), yet we found that a subsetof genes are recurrent HIV-1 targets, consistent with our previousfindings18. We thus defined recurrent integration genes (RIGs) asgenes with ≥1 HIV-1 integrations in at least 2 out of 8 datasets(see “Methods”), yielding a total of 1648 RIGs (SupplementaryFig. 1c).
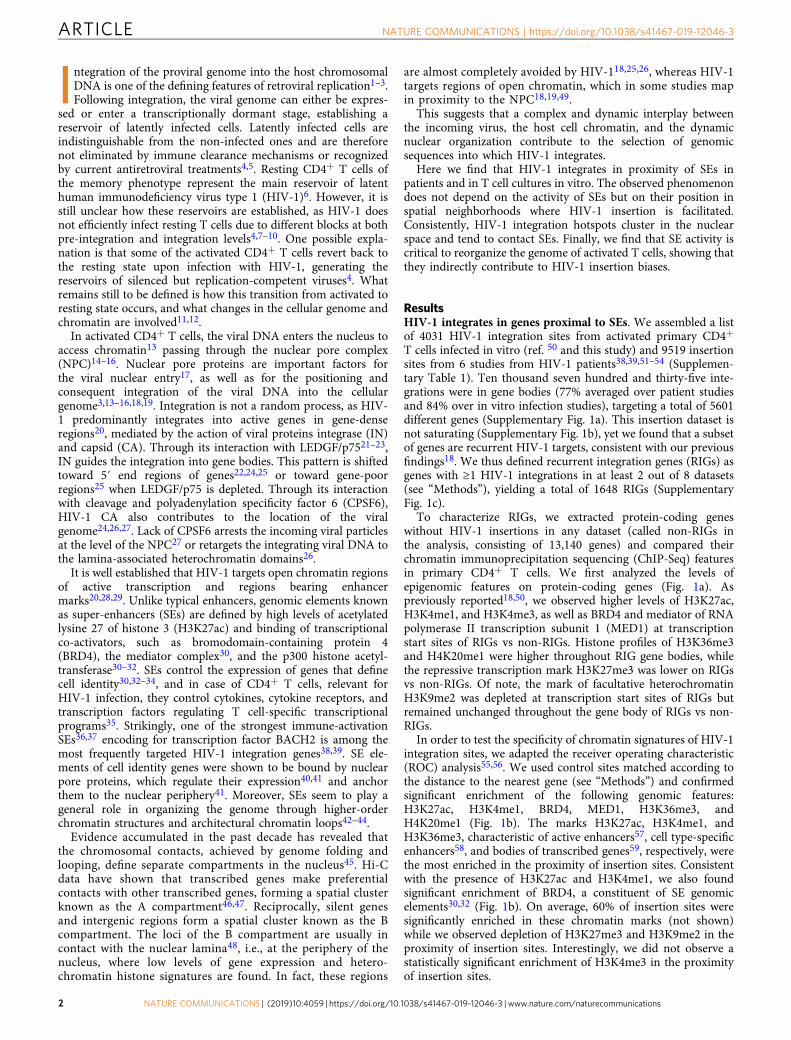
To characterize RIGs, we extracted protein-coding geneswithout HIV-1 insertions in any dataset (called non-RIGs inthe analysis, consisting of 13,140 genes) and compared theirchromatin immunoprecipitation sequencing (ChIP-Seq) featuresin primary CD4+ T cells. We first analyzed the levels ofepigenomic features on protein-coding genes (Fig. 1a). Aspreviously reported18,50, we observed higher levels of H3K27ac,H3K4me1, and H3K4me3, as well as BRD4 and mediator of RNApolymerase II transcription subunit 1 (MED1) at transcriptionstart sites of RIGs vs non-RIGs. Histone profiles of H3K36me3and H4K20me1 were higher throughout RIG gene bodies, whilethe repressive transcription mark H3K27me3 was lower on RIGsvs non-RIGs. Of note, the mark of facultative heterochromatinH3K9me2 was depleted at transcription start sites of RIGs butremained unchanged throughout the gene body of RIGs vs non-RIGs.
In order to test the specificity of chromatin signatures of HIV-1integration sites, we adapted the receiver operating characteristic(ROC) analysis55,56. We used control sites matched according tothe distance to the nearest gene (see “Methods”) and confirmedsignificant enrichment of the following genomic features:H3K27ac, H3K4me1, BRD4, MED1, H3K36me3, andH4K20me1 (Fig. 1b). The marks H3K27ac, H3K4me1, andH3K36me3, characteristic of active enhancers57, cell type-specificenhancers58, and bodies of transcribed genes59, respectively, werethe most enriched in the proximity of insertion sites. Consistentwith the presence of H3K27ac and H3K4me1, we also foundsignificant enrichment of BRD4, a constituent of SE genomicelements30,32 (Fig. 1b). On average, 60% of insertion sites weresignificantly enriched in these chromatin marks (not shown)while we observed depletion of H3K27me3 and H3K9me2 in theproximity of insertion sites. Interestingly, we did not observe astatistically significant enrichment of H3K4me3 in the proximityof insertion sites.
ARTICLE NATURE COMMUNICATIONS | https://doi.org/10.1038/s41467-019-12046-3
2 NATURE COMMUNICATIONS | (2019) 10:4059 | https://doi.org/10.1038/s41467-019-12046-3 | www.nature.com/naturecommunications
To confirm these trends, we identified SEs in activated CD4+
T cells using H3K27ac ChIP-Seq and merged them with the SEsin activated CD4+ T cells from dbSuper60,61. We obtained 2584SEs, intersecting 564 RIGs (34.22%, Supplementary Fig. 1d). Inaddition, the more a RIG is targeted by HIV-1 (i.e., the higherthe number of datasets where HIV-1 insertions are found in thegene), the closer it lies to SEs on average (Fig. 1c). In contrast,the insertion sites of the retrovirus HTLV-162 (human Tlymphotropic virus type 1) were not enriched in SE marks(Supplementary Fig. 1e), while murine leukemia virus (MLV)showed a strong enrichment in all SE marks as expected63.Figure 1d shows the integration biases at gene scale on FOXP1,STAT5B, and BACH2, three highly targeted RIGs involved in Tcell differentiation and activity. The ChIP-Seq profiles ofH3K27ac, H3K36me3, and BRD4 indicate prominent clusteringof HIV-1 insertion sites near the SEs defined by those marks.Thus HIV-1 displays specific preference to integrate into genes
proximal to SEs, herein defined as genomic elements ofretroviral integrations.
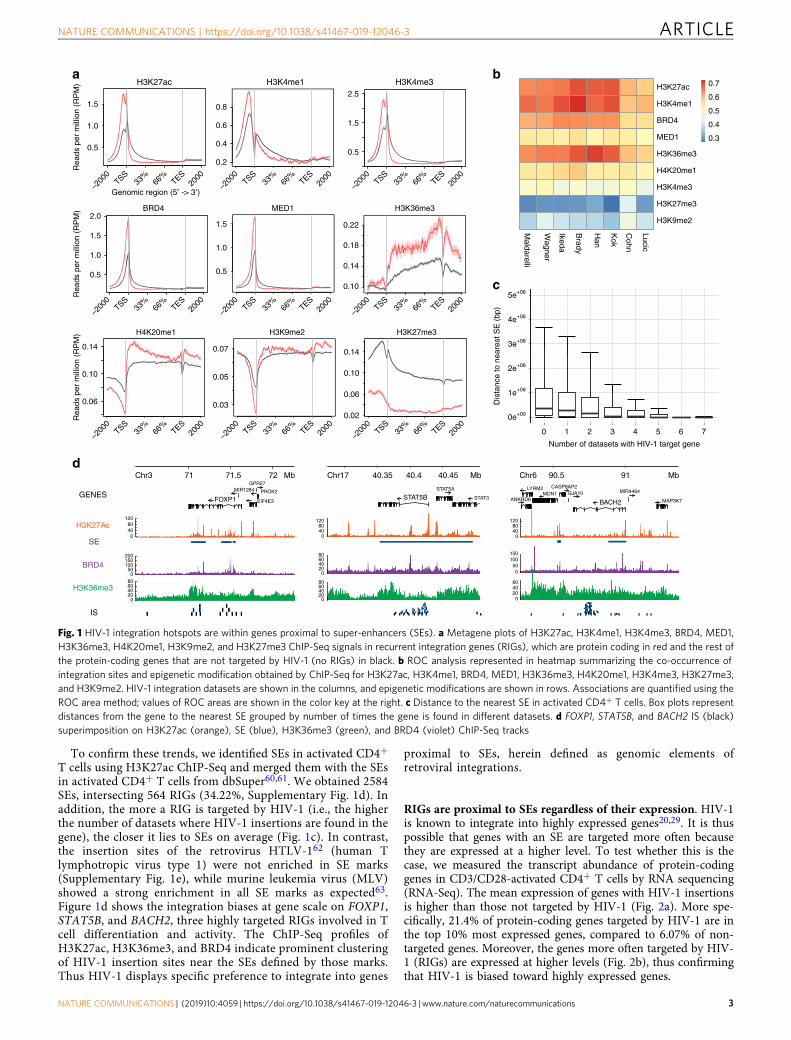
RIGs are proximal to SEs regardless of their expression. HIV-1is known to integrate into highly expressed genes20,29. It is thuspossible that genes with an SE are targeted more often becausethey are expressed at a higher level. To test whether this is thecase, we measured the transcript abundance of protein-codinggenes in CD3/CD28-activated CD4+ T cells by RNA sequencing(RNA-Seq). The mean expression of genes with HIV-1 insertionsis higher than those not targeted by HIV-1 (Fig. 2a). More spe-cifically, 21.4% of protein-coding genes targeted by HIV-1 are inthe top 10% most expressed genes, compared to 6.07% of non-targeted genes. Moreover, the genes more often targeted by HIV-1 (RIGs) are expressed at higher levels (Fig. 2b), thus confirmingthat HIV-1 is biased toward highly expressed genes.
H3K27ac
H3K36me3
H3K4me3
H4K20me1 H3K9me2 H3K27me3
a b
–200
0TSS
33%
66%
TES20
00
–200
0TSS
33%
66%
TES20
00
–200
0TSS
33%
66%
TES20
00
–200
0TSS
33%
66%
TES20
00
–200
0TSS
33%
66%
TES20
00
–200
0TSS
33%
66%
TES20
00
–200
0TSS
33%
66%
TES20
00
–200
0TSS
33%
66%
TES20
00
–200
0TSS
33%
66%
TES20
00
Genomic region (5′ -> 3′)
H3K4me1R
eads
per
mill
ion
(RP
M)
Han
Kok
Ikeda
Brady
Maldarelli
Wagner
Cohn
Lucic
H3K27ac
H3K4me1
BRD4
H3K36me3
MED1
H4K20me1
H3K27me3
H3K9me2
0.3
0.4
0.5
0.6
0.7
Number of datasets with HIV-1 target gene
c
04080
120
020406080
020406080
Chr17 Mb
STAT5B STAT3
STAT5A
04080
120
40.35 40.4 40.4571 71.5 72Chr3 Mb
050
100150200
020406080
FOXP1 EIF4E3
PROK2
GPR27MIR1284
04080
120
050
100150
0204060
90.5 91Chr6 Mb
BACH2ANKRD6MDN1
MAP3K7
LYRM2 CASP8AP2GJA10 MIR4464
H3K27Ac
SE
BRD4
H3K36me3
IS
GENES
d
Rea
ds p
er m
illio
n (R
PM
)
H3K4me3
Rea
ds p
er m
illio
n (R
PM
) BRD4 MED1
0.5
1.0
1.5
0.2
0.4
0.6
0.8
0.5
1.5
2.5
0.10
0.14
0.18
0.22
0.5
1.0
1.5
2.0
0.5
1.0
1.5
0.06
0.10
0.14
0.02
0.06
0.10
0.14
0.03
0.05
0.07
0e+00
1e+06
2e+06
3e+06
4e+06
5e+06
0 1 2 3 4 5 6 7
Dis
tanc
e to
nea
rest
SE
(bp
)
Fig. 1 HIV-1 integration hotspots are within genes proximal to super-enhancers (SEs). a Metagene plots of H3K27ac, H3K4me1, H3K4me3, BRD4, MED1,H3K36me3, H4K20me1, H3K9me2, and H3K27me3 ChIP-Seq signals in recurrent integration genes (RIGs), which are protein coding in red and the rest ofthe protein-coding genes that are not targeted by HIV-1 (no RIGs) in black. b ROC analysis represented in heatmap summarizing the co-occurrence ofintegration sites and epigenetic modification obtained by ChIP-Seq for H3K27ac, H3K4me1, BRD4, MED1, H3K36me3, H4K20me1, H3K4me3, H3K27me3,and H3K9me2. HIV-1 integration datasets are shown in the columns, and epigenetic modifications are shown in rows. Associations are quantified using theROC area method; values of ROC areas are shown in the color key at the right. c Distance to the nearest SE in activated CD4+ T cells. Box plots representdistances from the gene to the nearest SE grouped by number of times the gene is found in different datasets. d FOXP1, STAT5B, and BACH2 IS (black)superimposition on H3K27ac (orange), SE (blue), H3K36me3 (green), and BRD4 (violet) ChIP-Seq tracks
NATURE COMMUNICATIONS | https://doi.org/10.1038/s41467-019-12046-3 ARTICLE
NATURE COMMUNICATIONS | (2019) 10:4059 | https://doi.org/10.1038/s41467-019-12046-3 | www.nature.com/naturecommunications 3

On average, genes with a SE are expressed at higher levels thanthose without (Fig. 2c). This trend is more subtle for RIGs, as theyare expressed at a high level, with or without SEs (Fig. 2c,compare the blue boxes). However, RIGs are more often in theproximity of SEs than non-RIGs, irrespective of their expression(Fig. 2d). In particular, 19.05% of RIGs that are silent also have aproximal SE, while this is true for only 1.5% of the silent genesthat were never found to be HIV-1 targets (Fig. 2d, leftmostpanel). The trend remains the same for expressed genes (Fig. 2d)after dividing them into “low,” “medium,” and “high” expressiongroups (see “Methods”). In summary, our gene expressionanalysis suggests that genes recurrently targeted by HIV-1 haveadjacent SE elements, irrespective of their transcriptional levels.
We next assessed the relationship between HIV-1 integrationand transcription of genes controlled by SEs by using JQ1, abromodomain and extraterminal domain protein inhibitor thatprevents BRD4 binding to acetylated chromatin64 and causes asubsequent dysregulation of RNA Pol II binding31.
MYC is known to be regulated by SEs31, so we used the MYCRNA and protein levels as a control for the JQ1 treatment inCD4+ T cells (Supplementary Fig. 2a). We compared the HIV-1insertion profiles with or without JQ1 by inverse PCR (see“Methods”). We mapped a total of 38,964 HIV-1 insertion sitesand did not observe, at the chromosome scale, that JQ1 affectsthe insertion biases (Supplementary Fig. 2b, left panel).Similarly, spatial localization of the provirus and two repre-sentative RIGs remained unchanged upon treatment (Supple-mentary Fig. 2c, d).
Transcriptional profiling of activated CD4+ T cells confirmedthat protein-coding genes proximal to SEs are significantly moreupregulated or downregulated upon JQ1 treatment than codinggenes without SEs (Supplementary Fig. 2e, f). This effect is morepronounced among RIGs than among non-targeted genes(Supplementary Fig. 2f). Of note, HIV-1 maintains its preferencesfor highly transcribed genes in both control and JQ1-treated cells(compare Fig. 2a and Supplementary Fig. 2g).
In summary, our gene expression analysis suggests that genesrecurrently targeted by HIV-1 are adjacent to SE elements,irrespective of their transcriptional levels, but disruption of SEsdoes not impact HIV-1 integration patterns.
HIV-1 insertion hotspots are clustered in the nuclear space.Our previously published results showed that the majority oftested RIGs are distributed in the outer zones of the T cellnucleus18, so we hypothesized that the enrichment of HIV-1insertion sites near SEs may be due to their particular organiza-tion in the nuclear space. We thus performed Hi-C to get someinsight into the conformation of the T cell genome.
In order to minimize issues caused by the heterogeneity of thebiological material, we used the widely available Jurkat lymphoidT cellular model. To ensure that the behavior of HIV-1 is similarin both models, we compared a published collection of 58,240insertion sites in Jurkat cells28 to the 28,419 insertion sites inprimary CD4+ T cells from the current study (obtained bylinear amplification-mediated and inverse PCR) and previous
a b
RIGs lists
012 or more
c dNot-expressed Low10% Mid High10%
0
5
10
15
Genes without integrations Genes with integrations
Activated control cells
Rlo
g of
mea
n ex
pres
sion
val
ue
0
5
10
15
0 1 2 3 4 5 6 7
Number of lists
Rlo
g of
mea
n ex
pres
sion
in a
ctiv
ated
cel
ls
0 1 2 or more 0 1 2 or more
0
5
10
15
Number of lists genes are found in
Rlo
g of
mea
n ex
pres
sion
in a
ctiv
ated
cel
l
No SE in gene proximity SE in gene proximity
0 1 2 or more 0 1 2 or more 0 1 2 or more 0 1 2 or more
0%
25%
50%
75%
100%
Number of lists genes are found in
No superenhancer in gene proximity Superenhancer in gene proximity
Fig. 2 RIGs are proximal to super-enhancers regardless of their expression. a Regularized log-transformed read counts on protein-coding genes averagedover three replicates in activated CD4+ T cells shown as violin plot for genes without HIV-1 integrations and genes with HIV-1 integrations. b Box plot forprotein-coding genes grouped by number of HIV-1 lists they appear in. c Box plot for protein-coding genes grouped by the number of HIV-1 lists theyappear in, with RIGs grouped together in ≥2 lists’ group. Box plots are shown separately for genes that have super-enhancer 5 kb upstream of TSS or super-enhancer overlaps them (SE in proximity) and genes that do not have super-enhancer in proximity. Differences in median abundances of mRNA arestatistically significant for all groups (p value <2.2 x 10⁻¹⁶ for genes without HIV integrations and genes found on only one list and p value 3.7 × 10⁻¹² forRIGs, calculated by Wilcoxon rank-sum test). d Bar plots show the percentage of protein-coding genes that have super-enhancer in proximity, arranged bynumber of lists the gene is found in and by expression group
ARTICLE NATURE COMMUNICATIONS | https://doi.org/10.1038/s41467-019-12046-3
4 NATURE COMMUNICATIONS | (2019) 10:4059 | https://doi.org/10.1038/s41467-019-12046-3 | www.nature.com/naturecommunications

studies38,39,51–54. The insertion rates per chromosome are similarbetween cells (Fig. 3a); both show the characteristic approxi-mately threefold increase on chromosomes 17 and 19. Theapparent difference on chromosome 17 is possibly due to the useof different mapping technologies. For comparison, our previousmeasure of the insertion rates on chromosome 17 of Jurkat cells29
(using the same inverse PCR technology) is very close to thecurrent measure in primary CD4+ T cells. The insertion cloudrepresentation shows that the profiles are similar on chromosome17, with the exception of a hotspot visible only in primary CD4+
T cells at position ~57Mb (Fig. 3b). We also found that the HIV-1 target genes are similar in Jurkat cells and in other CD4+
datasets (Supplementary Fig. 3). In summary, apart from minordifferences, HIV-1 insertion biases are comparable in primaryCD4+ T and in Jurkat cells.
Hi-C on uninfected Jurkat cells yielded ~1.5 billion informativecontacts. Topologically associating domains (TADs) and loopdomains are clearly visible on the raw Hi-C map in 5 kb bins (Fig.3c), showing that the experiment captures the basic structuralfeatures of the Jurkat genome. We also verified that the A and Bcompartments are well defined and that they correspond to theregions of high and low gene expression, respectively (data notshown). To our knowledge, this dataset constitutes the highest-resolution Hi-C experiment presently available in Jurkat cells.
If the insertion pattern of HIV-1 reflects a particularorganization of the genome, one predicts that the insertionhotspots occupy the same nuclear space and thus cluster togetherin three dimension (3D). We tested this hypothesis by measuring
the amount of inter-chromosomal Hi-C contact densities amongdifferent classes of HIV-1 insertion sites (Fig. 3d). The loci mosttargeted by HIV-1 engage in stronger contact with each otherthan non-targeted loci. Also, the differences in contact strengthare more pronounced when loci correspond to active genes. Inaddition, SEs tend to cluster together and with HIV-1 insertionhotspots in 3D (Fig. 3e, Supplementary Fig. 4), indicating that SEslocate in the physical proximity of HIV-1 insertion sites. ThusHIV-1 insertion sites form spatial clusters interacting with SEs inthe nucleus, consistently with the view that the insertion processdepends on the underlying 3D organization of the T cell genome.
SEs and HIV-1 occupy the same 3D sub-compartment. Tobetter define the properties of HIV-1 insertion sites, we seg-mented the Jurkat genome into spatial clusters. For each chro-mosome, we generated 15 clusters of loci enriched in selfinteractions, which we coalesced down to 5 genome-wide clustersbased on their inter-chromosomal contacts (Fig. 4a and see“Methods”). This approach yielded two A-type sub-compart-ments called A1 and A2, two B-type sub-compartments called B1and B2, and one intermediate/mixed compartment called AB(Fig. 4b, c).
The AB- and B-type sub-compartments correspond to knowntypes of silent chromatin: AB is richest in the Polycomb markH3K27me3, B1 is richest in H3K9me3, and B2 is richest in lamin(Fig. 4d and Supplementary Fig. 5a). The two A-type sub-compartments are enriched in euchromatin marks, with highercoverage in A1 than in A2 (Fig. 4d and Supplementary Fig. 5a).
c
a b
1 3 5 7 9 11 13 15 17 19 21 X
HIV
inse
rtio
n ra
te (
a.u.
)
0
1
2
3Primary
Jurkat
0 20 40 60 80
Position on chromosome 17 (Mb)
97.5 Mb 102.5 Mb
102.
5 M
b97
.5 M
b
Chromosome 1
d e
0e+00
1e–04
2e–04
3e–04
4e–04
Active–Active
Gene activity
Inte
rchr
omos
omal
Hi-C
con
tact
den
sity
[Hi-C
rea
ds/k
b2 ]
HIV-HIV
Active–Silent Silent–Silent
HIV-No HIVNo HIV-No HIV
HIV-HIVHIV-No HIVNo HIV-No HIV
Inte
rchr
omos
omal
Hi-C
con
tact
den
sity
[Hi-C
rea
ds/k
b2 ]
SE-SE
Super-enhancer in gene proximity
SE-No SE No SE-No SE
0e+00
1e–04
2e–04
3e–04
4e–04
Fig. 3 HIV-1 integration hotspots are clustered in the nuclear space. a Bar plot of HIV-1 insertion rate per chromosome (the genome-wide average is set to1) in primary T and in Jurkat cells. b HIV-1 insertion cloud on chromosome 17 in primary T and Jurkat cells. Each dot represents an HIV-1 insertion site. Thex-coordinate indicates the location of the insertion site on chromosome 17; the y-coordinate is random so that insertion hotspots appear as vertical lines.c Detail of the unnormalized Hi-C contact map in Jurkat in 5 kb bins. TADs and loop domains are clearly visible. d Box plot of inter-chromosomal Hi-Ccontact density (see “Methods”). Contact densities were computed between chromosomal aggregates of all gene fragments (5 kb) corresponding toActive and Silent genes, with (HIV) or without HIV insertions (No HIV). The distribution of densities are composed of the scores for all inter-chromosomalcombinations. e Same as in d, but genes are classified between genes in proximity of super-enhancers (SE), i.e., within gene body or 5 kb upstream of TSS,or far from super-enhancers (No SE)
NATURE COMMUNICATIONS | https://doi.org/10.1038/s41467-019-12046-3 ARTICLE
NATURE COMMUNICATIONS | (2019) 10:4059 | https://doi.org/10.1038/s41467-019-12046-3 | www.nature.com/naturecommunications 5
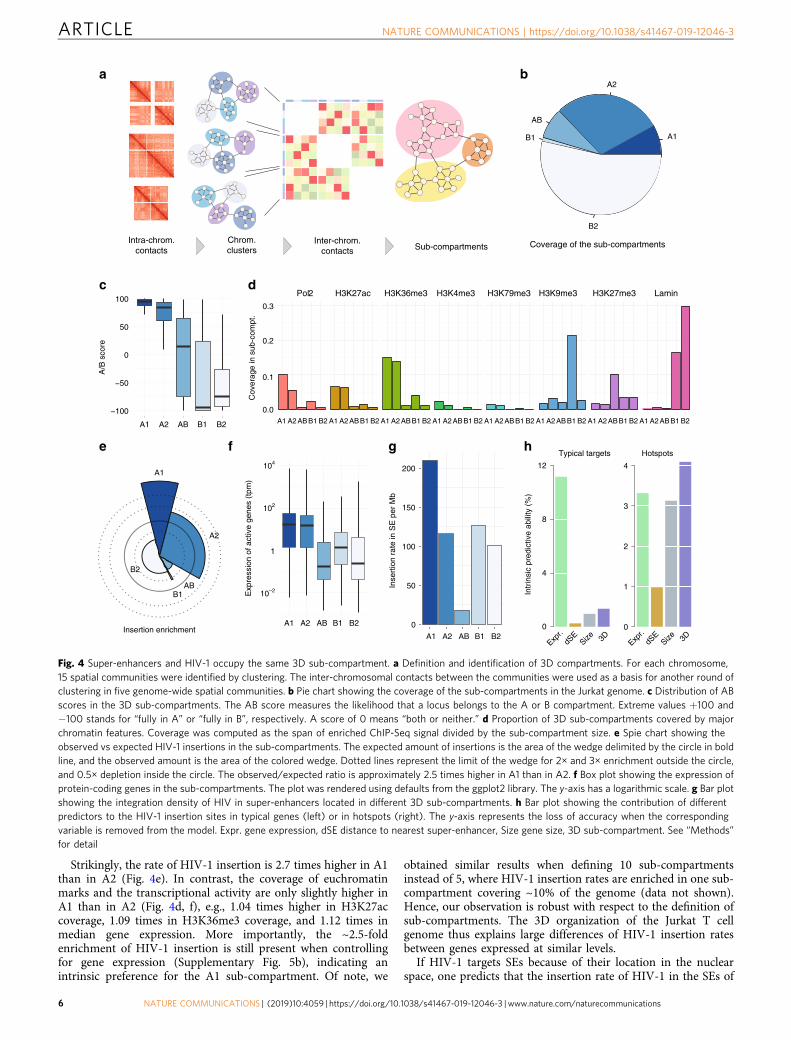
Strikingly, the rate of HIV-1 insertion is 2.7 times higher in A1than in A2 (Fig. 4e). In contrast, the coverage of euchromatinmarks and the transcriptional activity are only slightly higher inA1 than in A2 (Fig. 4d, f), e.g., 1.04 times higher in H3K27accoverage, 1.09 times in H3K36me3 coverage, and 1.12 times inmedian gene expression. More importantly, the ~2.5-foldenrichment of HIV-1 insertion is still present when controllingfor gene expression (Supplementary Fig. 5b), indicating anintrinsic preference for the A1 sub-compartment. Of note, we
obtained similar results when defining 10 sub-compartmentsinstead of 5, where HIV-1 insertion rates are enriched in one sub-compartment covering ~10% of the genome (data not shown).Hence, our observation is robust with respect to the definition ofsub-compartments. The 3D organization of the Jurkat T cellgenome thus explains large differences of HIV-1 insertion ratesbetween genes expressed at similar levels.
If HIV-1 targets SEs because of their location in the nuclearspace, one predicts that the insertion rate of HIV-1 in the SEs of
a b
c d
fe g h
A1 A2 AB B1 B2
A1 A2 AB B1 B2
Coverage of the sub-compartments
Insertion enrichment
10–2
102
1
104
A1
ABB1
B2
A2
Exp
ress
ion
of a
ctiv
e ge
nes
(tpm
)Intra-chrom.
contactsInter-chrom.
contactsChrom.clusters Sub-compartments
0
50
100
150
200
Inse
rtio
n ra
te in
SE
per
Mb
Typical targets Hotspots
Cov
erag
e in
sub
-com
pt.
0.0
0.1
0.2
0.3
A1 A2ABB1 B2 A1 A2ABB1 B2 A1 A2ABB1 B2 A1 A2ABB1 B2 A1 A2ABB1 B2 A1 A2ABB1 B2 A1 A2ABB1 B2 A1 A2ABB1 B2
A1
A2
AB
B1
B2
−100
−50
0
50
100
A1 A2 AB B1 B2
A/B
sco
re
Intr
insi
c pr
edic
tive
abili
ty (
%)
0
4
8
12
Expr.
dSE
Size 3D Expr.
dSE
Size 3D0
1
2
3
4
22
22
Pol2 H3K27ac H3K36me3 H3K4me3 H3K79me3 H3K9me3 H3K27me3 Lamin
Fig. 4 Super-enhancers and HIV-1 occupy the same 3D sub-compartment. a Definition and identification of 3D compartments. For each chromosome,15 spatial communities were identified by clustering. The inter-chromosomal contacts between the communities were used as a basis for another round ofclustering in five genome-wide spatial communities. b Pie chart showing the coverage of the sub-compartments in the Jurkat genome. c Distribution of ABscores in the 3D sub-compartments. The AB score measures the likelihood that a locus belongs to the A or B compartment. Extreme values +100 and−100 stands for “fully in A” or “fully in B”, respectively. A score of 0 means “both or neither.” d Proportion of 3D sub-compartments covered by majorchromatin features. Coverage was computed as the span of enriched ChIP-Seq signal divided by the sub-compartment size. e Spie chart showing theobserved vs expected HIV-1 insertions in the sub-compartments. The expected amount of insertions is the area of the wedge delimited by the circle in boldline, and the observed amount is the area of the colored wedge. Dotted lines represent the limit of the wedge for 2× and 3× enrichment outside the circle,and 0.5× depletion inside the circle. The observed/expected ratio is approximately 2.5 times higher in A1 than in A2. f Box plot showing the expression ofprotein-coding genes in the sub-compartments. The plot was rendered using defaults from the ggplot2 library. The y-axis has a logarithmic scale. g Bar plotshowing the integration density of HIV in super-enhancers located in different 3D sub-compartments. h Bar plot showing the contribution of differentpredictors to the HIV-1 insertion sites in typical genes (left) or in hotspots (right). The y-axis represents the loss of accuracy when the correspondingvariable is removed from the model. Expr. gene expression, dSE distance to nearest super-enhancer, Size gene size, 3D sub-compartment. See “Methods”for detail
ARTICLE NATURE COMMUNICATIONS | https://doi.org/10.1038/s41467-019-12046-3
6 NATURE COMMUNICATIONS | (2019) 10:4059 | https://doi.org/10.1038/s41467-019-12046-3 | www.nature.com/naturecommunications
A1 should be higher than in the SEs of A2. Figure 4g shows that,indeed, HIV-1 is ~1.5 times more likely to integrate in the SEs ofA1 than in those of A2. Since the insertion rate in SEs dependsprimarily on their location, we conclude that the enrichment inSEs at genome-wide scale is due to their position in the 3D spaceof the nucleus, rather than to their activity or their chromatinfeatures.
To quantify this statement and to clarify how differentdeterminants contribute to HIV-1 insertion, we used amodeling approach based on logistic regression. We predictedeither typical HIV-1 target genes (top 33% gene-wide insertionrate) or HIV-1 hotspots (top 2.5% bin-wise insertion rate, see“Methods”). Typical HIV-1 targets are almost entirelydetermined by gene expression (Fig. 4h), consistently withprevious reports that HIV-1 integrates primarily in activegenes2,3,20. On the other hand, HIV-1 hotspots are multi-factorial and sub-compartments appear as the major determi-nants (Fig. 4h). These results establish that typical HIV-1targets and hotspots, such as RIGs, are driven by differentclasses of mechanisms. Finally, they show that the 3Dorganization is a major contributor of HIV-1 hotspots.
Genes proximal to SEs reposition upon T cell activation. Ourresults so far suggest that HIV-1 insertion hotspots cluster nearSEs because of their location in the structured genome of T cells,but they do not address the contribution of SEs to this structure.
We thus investigated the role of SEs in the spatial distributionof genes in T cells. RIGs belong to a subset of T cell genes thatshow the strongest response to T cell activation (SupplementaryFig. 6a), so we reasoned that their spatial positioning mightchange with the activation status of the cell. We thereforeemployed 3D immuno-DNA fluorescence in situ hybridization(FISH) to visualize gene positioning in resting and activated CD4+ T cells. The cumulative frequency plots revealed that nine RIGs,seven of which have SEs FOXP1, STAT5B, NFATC3 (Fig. 5a),KDM2A, PACS1 (Fig. 5b), and GRB2, RNF157 (Fig. 5c), changespatial positioning and relocalize further toward the outer shellsof the T cell nucleus upon activation. Three RIGs, NPLOC4,RPTOR, and BACH2, were already peripheral before activationand remained so afterwards (Supplementary Fig. 6c). Werecapitulated the overall distribution of 9 RIGs that displayedrepositioning in activated (n= 1690 alleles) vs resting CD4+
T cells (n= 1700 alleles, Fig. 5d). As expected, the frequencydistribution of alleles in three zones of equal surface areas18
showed a prominent shift toward the outer shells of the nucleusin activated T cells, corresponding to the area located <1 micronunder the nuclear envelope. Of note, a pan nuclear distribution ofKDM2A and PACS1 in activated CD4+ T cells was alsoobserved26.
We then asked whether the observed gene redistribution is anexclusive feature of genes proximal to SEs or a general feature ofall expressed genes, independent of HIV-1 targeting. Wetherefore evaluated the spatial distribution of two groups ofcontrol genes: expressed genes with SEs and expressed geneswithout SEs. The MYC gene, a gene harboring five well-describedSEs, changed its radial position toward the outer shells of thenucleus upon T cell activation (Supplementary Fig. 6d). The sametrend was observed for two other regions proximal to SEs that arenot targeted by the virus: one on chromosome 1 covering the geneLMNA and the other on chromosome 11 encompassingSLC43A1, UBE2L6, and TIMM10. Both regions showed statisti-cally significant repositioning toward the more exterior shells ofthe nucleus with T cell activation.
In contrast, when we assessed the spatial distribution of threehighly expressed genes without SEs, TAP1, CCNC, and MCM4,
we did not observe any statistically significant allele redistributionupon T cell activation (Supplementary Fig. 6e).
Next, we wanted to understand whether disruption of SEsimpacts the nuclear position of genes proximal to these elementsduring T cell activation. To do so, we pretreated resting T cellswith JQ1 before activating them with CD3/CD28 beads andobserved that the two tested RIGs, STAT5B and GRB2, retainedtheir position in the center of the nucleus (Supplementary Fig. 6g,h), supporting the notion that SEs contribute to the positioning ofgenes prior and during T cell activation.
As HIV-1 target genes group together on linear chromo-somes18 and integration hotspots cluster in the nuclear space (Fig.3e and Supplementary Fig. 4), we assessed their spatial relation-ships during T cell activation. Two highly targeted regions(top 10% of RIGs density) on chromosomes 11 and 17 werevisualized by dual-color FISH coupled to high-throughputimaging (HTI)65,66. We observed that KDM2A and PACS1, twogenes proximal to SEs lying at 1.1 Mb from each other onchromosome 11 (Fig. 5e), clustered together in the nuclear space,with a minimized median distance of 0.42 μm in both resting andactivated state (data summarized in Supplementary Fig. 6f).Similarly, we found that, in the hotspot region mapping to q25.1-3 on chromosome 17 containing 35 RIGs (Fig. 5f), three RIGs,GRB2, TNRC6C, and RNF157, cluster together (Fig. 5f, datasummarized in Supplementary Fig. 6f). This clustering is not amere consequence of the linear distances between these genes, astwo other genes from the same locus, NPLOC4 and RPTOR,despite being at a similar linear distance, are not spatiallyassociated (measured distances given in Supplementary Fig. 6f).
In summary, our results show that seven out of nine RIGsproximal to SEs change their radial positioning upon T cellactivation, moving to the outer shell of the nucleus. This is afeature pertinent also to genes proximal to SEs that are not HIV-1targets, suggesting that SEs contribute to the spatial organizationof the genome and that in dependence of the activation statecould be more exposed to HIV-1 insertions.
DiscussionThe integration of the viral DNA into the host cell genome isresponsible for the long-term persistence of HIV-1 in cellularreservoirs67. The persistence of HIV-1 is influenced by thechromosomal context at the sites of integration, with a strongimpact on the outcome of viral infection29. Here we characterizedthe genomic features of integration sites identified frompatients38,39,51–54 and from in vitro infections of activated CD4+
T cells (ref. 50 and this study). By analyzing these large datasets,we confirmed that HIV-1 recurrently integrates into a subset oftranscriptionally active cellular genes. We show that HIV-1recurrently integrates into a group of genes proximal to SEgenomic elements in activated CD4+ T cells and in patients (Fig.1c). Yet, neither the activity of SEs nor their effect on geneexpression alone explain the integration biases (SupplementaryFig. 2b). Instead, we found that the correlation can be attributedto the enrichment of SEs in the A2 and especially in the A1 sub-compartments, where HIV-1 integrates at higher frequency thanin the rest of the genome (Fig. 4e).
The contribution of gene expression levels to the insertion rateof HIV-1 is intricate. On one hand, HIV-1 shows a clear biastoward expressed genes, even upon JQ1 treatment where it stillintegrates preferentially into genes that are most active after JQ1treatment. However, HIV-1 recurrently integrates into genesproximal to SEs (Fig. 2d), among which there are both upregu-lated and downregulated genes (Supplementary Fig. 2f). Onepotential explanation is that the HIV-1 IN has a strong affinity forsome protein present in transcribed regions (e.g., LEDGF). The
NATURE COMMUNICATIONS | https://doi.org/10.1038/s41467-019-12046-3 ARTICLE
NATURE COMMUNICATIONS | (2019) 10:4059 | https://doi.org/10.1038/s41467-019-12046-3 | www.nature.com/naturecommunications 7

complete absence of such proteins in non-transcribed regionswould have more influence on the signal than its quantitativevariations in transcribed regions. In any event, gene expressionand chromatin are not the sole contributors to HIV-1 insertionpatterns. The A1 sub-compartment is targeted more frequentlythan the rest of the genome (Fig. 4e), even when controlling forchromatin and gene expression (Supplementary Fig. 5b). Thisindicates that the 3D genome organization of activated T lym-phocytes is an important determinant of the HIV-1 insertionprocess. SEs most likely contribute to this organization42 becausetheir dismantling prior to T cell activation prevents repositioning
of genes with SEs toward the outer shells of the nucleus (Sup-plementary Fig. 6g, h).
Predictive modeling helps clarify this conclusion. An importantinsight is that HIV-1 insertion hotspots do not obey the samerules as typical target genes (Fig. 4h). There are thus two pro-cesses at work: one that attracts viruses to active genes, andanother one, more complex, that provokes recurrent integrationswithin the same genes (i.e., the RIGs). 3D compartmentalizationplays a role only in the second process, explaining why studieswith different definitions of HIV-1 targets may come to differentconclusions.
0.0 0.2 0.4 0.6 0.8 1.00
20
40
60
80
100
0
20
40
60
80
100
0
20
40
60
80
100
0
20
40
60
80
100
Signal/radius ratio
0.0 0.2 0.4 0.6 0.8 1.00
20
40
60
80
100
Signal/radius ratio
0.0 0.2 0.4 0.6 0.8 1.00
20
40
60
80
100
Signal/radius ratio0.0 0.2 0.4 0.6 0.8 1.0
0
20
40
60
80
100
Signal/radius ratio
0.0 0.2 0.4 0.6 0.8 1.00
20
40
60
80
100
Signal/radius ratio
0.0 0.2 0.4 0.6 0.8 1.00
20
40
60
80
100
Signal/radius ratio
STAT5BCTD-3124P7 17q21.2
a
0.20.0 0.4 0.6 0.8 1.0
Signal/radius ratio
0.20.0 0.4 0.6 0.8 1.0
Signal/radius ratio
0.20.0 0.4 0.6 0.8 1.0
Signal/radius ratio
RestingActivated
RestingActivated
RestingActivated
RestingActivated
RestingActivated
RestingActivated
RestingActivated
Resting Activated
****P < 0.0001
NFATC3RP11-67A1 16q22.1
RestingActivated
Resting Activated
****P < 0.0001
b
****P < 0.0001
FOXP1RP11-905F6 3p13
Resting Activated
Resting ActivatedResting Activated Resting Activated Resting ActivatedResting Activated
Resting Activated
MKL2RP11-1072B15 16p13.12
RestingActivated
****P < 0.0001
P < 0.0001 P < 0.0001P < 0.0001
P < 0.0001 P < 0.0001
BA
C L
amin
B1
DN
A
BA
C L
amin
B1
DN
A
d
GRB2RP11-16C1 17q25.1
RNF157RP11-449J21 17q25.1
TNRC6CRP11-153A23 17q25.3
**** **** ****
Res
ting
AC
TIV
AT
ED Act
ivat
edGRB2 TNRC6CRNF157 GRB2PACS1 KDM2A
RE
ST
ING
Cum
ulat
ive
freq
uenc
y [%
]
Cum
ulat
ive
freq
uenc
y [%
]
BA
C L
amin
B1
DN
A
Cum
ulat
ive
freq
uenc
y [%
]
–5 Mb + 5 Mb
1.1Distance in Mb
KDM2A
11q13.2
HNRNPUL2GANAB
STX5
RARRES3
ATL3
RTN3
RPS6KA4
NAALADL1
SF1
CAPN1
POLA2
NEAT1MALAT1
SF3B2
SUV420H1
PPP6R3
PPFIA1
NUMA1
PACS1
c
e
10 Mb +10 MbNOL11
WIPI1
ABCA10
EXOC7UNK
NFAT5PRPSAP1MFSD11
CYTH1
EIF4A3
SLC38A10
P4HBCCDC57SLC16A3CSNK1D
FOXK2WDR45BTBCD
ZNF750
KIAA0195
17q25.1-3
0.8 1.8Distance in Mb 2.7 0.8
RPTOR
NPLOC4RNF157
GRB2
TNRC6C
KDM2ARP11-157K17 11q13.2
****
PACS1RP11-675B4 11q13.1-q13.2
****
GRB2 TNRC6CRNF157 GRB2
KDM2A
-PACS1
R
KDM2A
-PACS1
A0.0
0.5
1.0
1.5
2.0 RestingActivated
Spo
t dis
tanc
e [μ
M]
0.0
0.5
1.0
1.5
2.0
Spo
t dis
tanc
e [μ
M]
GRB2-RNF15
7 R1
GRB2-RNF15
7 A
GRB2-TNRC6C
R
GRB2-TNRC6C
A
RestingActivated
0.00
0.05
0.10
0.15
0.20
Signal/radius ratio
Zone 1 Zone 2 Zone 3
0 0.19 0.43 1
Nuclear envelope Nuclear center
Resting CD4+ T (n = 1700) Activated CD4+ T (n = 1690)
f
Rel
ativ
e al
lele
freq
uenc
y(f
ract
ions
)
Fig. 5 Genes proximal to super-enhancers change their nuclear positioning upon T cell activation. Three-dimensional immuno-DNA FISH of nine RIGs inresting and activated (anti-CD3/anti-CD28 beads, IL-2 for 48 h) CD4+ T cells (green: BAC/gene probe, red: lamin B1, blue: DNA staining with Hoechst33342, scale bar represents 2 μm). Cumulative frequency plots show combined data from both experiments (n= 100, black: resting cells, red: activatedcells). The p values of the Kolmogorov–Smirnov tests are indicated. Box plots represent minimized distances (5th−95th percentile) for the analyzed genecombinations in resting (white) and activated (gray) CD4+ T cells, obtained by high-throughput imaging and subsequent computational measurements. Inthe box plots, the center line represents the median, the bounds of the box span from 25% to 75% percentile, and the whiskers visualize 5% and 95% ofthe data points. Representative images for a FOXP1, STAT5B, NFATC3, and MKL2; b KDM2A and PACS1; and c GRB2, RNF157, and TNRC6C. d Allele fractiondensity plot for all resting and activated alleles that displayed peripheral repositioning. The y-axis shows the allele fraction density for genes FOXP1, STAT5B,NFATC3, MKL2, KDM2A, PACS, GRB2, RNF157, and TNRC6C. The x-axis represents ratios of distance from nuclear envelope (lamin B1 staining) and radius(signal to radius ratio) for alleles in resting cells (n= 1700) and activated cells (n= 1690 alleles). Binning into three equal concentric zones of the nucleusis performed as in ref. 18. e Schematic representation of chromosomal region 11q13.2 within 10Mb: RIGs (bold red) and single HIV-1 integration sites (plaingray) and HTI of KDM2A and PACS1. f Schematic representation of chromosomal region 17q25.1-3 within 20Mb: RIGs (bold red) and single HIV-1integration sites (plain gray) and HTI of GRB2, RNF157, and TNRC6C
ARTICLE NATURE COMMUNICATIONS | https://doi.org/10.1038/s41467-019-12046-3
8 NATURE COMMUNICATIONS | (2019) 10:4059 | https://doi.org/10.1038/s41467-019-12046-3 | www.nature.com/naturecommunications

Although we show that SEs do not affect HIV-1 integrationpatterns in activated T cells, we find that, during T cell activation,genes with SEs move toward the outer shells of the nucleus (Fig.5a–c). In line with the previously shown association of nuclearpore proteins with HIV-118,19, and their proximity to SEs andenrichment in the A1 sub-compartment defined here (ref. 41 anddata not shown), it is tempting to speculate that the A1 sub-compartment corresponds to genomic loci associated with thenuclear pore. None of the chromatin features mapped in Jurkatcells is known to discriminate active genes at the nuclear porefrom other active genes, and the chromatin of A1 is otherwisesimilar to that of A2 (Supplementary Fig. 5a). Interestingly, thedensity of SEs is similar between A1 and A2 (Supplementary Fig.5a), so it is unlikely that the A1 sub-compartment simply emergesfrom the clustering of SEs. More plausibly, SEs are one of manycontributors to the segregation of the genome in spatial clusters.More generally, the existence of two separate clusters of activegenes in the 3D space of the nucleus is itself an intriguingobservation that will require more work to be fully understood.
While the spatial positioning of the A1 and A2 sub-compartments in T cells still needs to be mapped, a recentstudy proposed an alternative concept to the one where nuclearperiphery represents solely transcriptionally repressiveenvironment68,69. Instead, and consistently with our findings,they predict distinctive localization of active A1 and A2 Hi-C sub-compartments. Transcriptionally active regions are divided intotwo groups: a transcriptional “hot zone” close to nuclear specklescorresponds to the A1 sub-compartment and another one farfrom speckles corresponds to A268. Interestingly, transcriptionalhot zones confined within the A1 sub-compartment are enrichedin SEs and highly expressed genes, traits we observed to bestrongly associated with HIV-1 insertional hotspots.
It is well established that the main components that mediateHIV-1 integration into actively transcribing units are the viralproteins IN and CA3,17. Their cellular partners LEDGF/p75 andCPSF6 could chaperone the virus into clusters of SE domains inthe A1 compartment. LEDGF/p75 interacts with a large numberof splicing factors and directs HIV-1 integration to highly splicedtranscription units22, making this a plausible link to the A1compartment.
Likewise, CPSF6 as part of the mRNA polyadenylationmachinery, could guide HIV-1 integrations toward the nuclearcompartment with high transcription and mRNA processingrates (such as A168). Alternatively, the CA–CPSF6 axis couldregulate HIV-1 targeting independently of the polyadenylationrole of CPSF624,26,70.
Among the factors that are binding putative SEs and could playa role in integration site selection, p300 and BRD4 seem to be themost promising candidates. p300, a histone acetyltransferase usedto identify typical71,72 and SEs32,73,74, is an interaction partner ofthe HIV-1 IN. p300 promotes the DNA-binding activity of IN75
and could serve to direct viral integration toward genes with SEsin the A1 compartment, though a role for p300 in HIV-1 inte-gration targeting has yet to be established.
BRD4, on the other hand, does not bind HIV-1 IN76,77 but hasa well-established role in HIV-1 latency78,79. The mechanism ofaction has recently been ascribed to the short isoform of BRD4,which recruits a repressive SWI/SNF complex to the viral longterminal repeat (LTR)80. Loss of the short isoform, occurringrapidly upon JQ1 treatment, leaves the long isoform engaged inthe transcriptional activation of the viral genome80. The samemechanism could account for the activation of cellular genesupon JQ1 treatment31. In fact, our RNA-Seq data show that genesproximal to SEs are both upregulated and downregulated uponJQ1 (Supplementary Fig. 2e). Furthermore, genes targeted byHIV-1 are more responsive to JQ1 than non-HIV-1 targets
(Supplementary Fig. 2g). This implies that HIV-1 preferentiallytargets genes that have a rapid and tightly regulated transcrip-tional response. Given the opposing role of BRD4 on viral LTRand cellular genes, insertion into genes proximal to SEs mightrepresent a source of transcriptional fluctuations81,82 and play animportant role in either establishment or reversal of latency.
Based on our findings that the majority of tested RIGs andgenes with SEs reposition from the nuclear interior to the per-iphery during T cell activation, it could be envisaged that RIGsdiffer between resting and activated CD4+ T cells. Meta-analysisof the only available integration sites dataset50 from these two cellactivation states showed, however, no significant difference.Additional work will thus be required to assess comprehensivelythe RIGs that are used by HIV-1 in resting T cells.
Overall, we show that HIV-1 insertion sites form spatial clus-ters interacting with SEs of A1 compartment, highlighting theimportance of the underlying 3D genome organization for HIV-1integration. While additional studies will be needed to decipherthe mechanism of such site selection, our results identify hotspotsof integration that could improve characterization and enabletargeting of latent HIV-1 reservoirs.
MethodsPrimary cell isolation, culture, treatments, and infection. For CD4+ T cellsisolation, whole blood was mixed with RosetteSep Human CD4+ T cell enrichmentcocktail beads according to the manufacturer’s instructions and CD4+ T cells wereseparated using Histopaque Ficoll gradient by centrifugation. Cells were cultured incomplete T cell medium (RPMI-1640+10% fetal bovine serum (FBS)+ primocin),left in resting state or activated with Dynabeads Human T-Activator CD3/CD28and plated in complete medium supplemented with 5 ng/ml IL-2 for 20–72 hat 37 °C.
Cells were treated when indicated with 500 nM JQ1(+) or dimethyl sulfoxide(DMSO) for 6 h at 37 °C.
In all, 1 × 10⁶ activated CD4+ T cells were infected with 0.5–1 µg of p24 of virusby spinoculation for 90 min at 2300 rpm at room temperature (RT) in the presenceof polybrene at 37 °C. Virus stocks were produced from the viral clone HIV-1NL4_3and a mutant that harbors a frameshift (FS) mutation in the env gene (pNL4_3-envFS) and was pseudotyped with vesicular stomatitis virus glycoprotein, resultingin a FS virus that performs a single-round infection (HIV-1NL4_3 FS). Cells werethen incubated for 72 h at 37 °C. When indicated, 14 h after infection with HIV-1NL4_3, cells were treated with the fusion inhibitor T20 to prevent multipleinfection and integration. All viral stocks were generated by transfecting viral DNAin HEK 293T cells and collecting supernatants after 48–72 h following sucrosegradient purification of virus articles. Viral production was quantified in thesupernatants for HIV-1 p24 antigen content using the Innotest HIV Antigen mABKit (INNOGENETICS N.V. Gent, Belgium). The human Jurkat T cell line(obtained from the cell collection of the Center for Genomic Regulation, Barcelona)was grown at 37 °C under a 95% air and 5% CO2 atmosphere, in RPMI 1640medium (Gibco) supplemented with 10% FBS (Gibco), 1% penicillin–streptomycin(Gibco), and 1% GlutaMAX (100×) (Gibco). Jurkat cells were passaged every 2 dayswith a 1:5 dilution. Cells were tested for mycoplasma regularly.
Fluorescence in situ hybridization. Approximately 3 × 10⁵ CD4+ T cells wereplated on the PEI-coated coverslips placed into a 24-well plate for 1 h at 37 °C.Cells were treated with 0.3× phosphate-buffered saline (PBS) to induce a hypotonicshock and fixed in 4% paraformaldehyde (PFA)/PBS for 10 min Coverslips wereextensively washed with PBS and cells were permeabilized in 0.5% triton X-100/PBS for 10 min. After three additional washings with PBS-T (0.1% tween-20),coverslips were blocked with 4% bovine serum albumin (BSA)/PBS for 45 min atRT and primary antibody anti-lamin B1 ab16048, from Abcam (1:500 in 1% BSA/PBS), was incubated overnight at 4 °C. Following three washings with PBS-T,fluorophore-coupled secondary antibody (anti-rabbit, coupled to Alexa 488#11034, Alexa 568 #A11011, or Alexa 647 #A27040 from Invitrogen, diluted 1:1000in 1% BSA/PBS) were incubated for 1 h at RT, extensively washed, and post fixedwith ethylene glycol bis(succinimidyl succinate) (EGS) in PBS. Coverslips werewashed three times with PBS-T and incubated in 0.5% triton X-100/0.5% saponin/PBS for 10 min. After three washings with PBS-T, coverslips were treated with0.1 M HCl for 10 min, washed three times with PBS-T, and additionally permea-bilized step in 0.5% triton X-100/0.5% saponin/PBS for 10 min. After extensivePBS-T washings, coverslips were equilibrated for 5 min in 2× saline sodium citrate(SSC) and then put in hybridization solution overnight at 4 °C. For the HIV-1FISH, RNA digestion was additionally performed beforehand using RNAse A (100µg/ml).
For FISH without immunofluorescence (IF) for HTI, 1–2 × 10⁶ CD4+ T cells in500 µl of medium were adhered to coverslips by centrifugation at 350 × g for 10
NATURE COMMUNICATIONS | https://doi.org/10.1038/s41467-019-12046-3 ARTICLE
NATURE COMMUNICATIONS | (2019) 10:4059 | https://doi.org/10.1038/s41467-019-12046-3 | www.nature.com/naturecommunications 9

min at RT. The coverslips were washed in PBS and the cells were fixed in 4% PFA/PBS for 10 min followed by extensive PBS washing. Permeabilization wasperformed by incubation in 0.5% triton X-100/0.5% saponin/PBS for 20 min. Afterthree washings with PBS, cells were treated with 0.1 M HCl for 15 min. Coverslipswere washed twice for 10 min with 2× SSC and put in hybridization solutionovernight at 4 °C.
For DNA probe labeling, bacterial artificial chromosome (BAC) or P1 artificialchromosome (PAC) DNA was extracted using a Nucleobond Xtra Maxiprep oramplified by the Illustra GenomiPhi V2 DNA Amplification Kit according to themanufacturer’s instructions. HIV-1 plasmid HXB2 was purified using the QiagenPlasmid Extraction Kit. FISH probes were generated in a Nick translation reactionusing three different protocols. All BACs/PACs are listed in SupplementaryTable 5.
BACs were labeled with digoxigenin (DIG)-coupled dUTPs. Three microgramsof BAC DNA were diluted in H2O in a final volume of 16 μl. Four microliters ofDIG-Nick translation mix (Roche) were added and the labeling reaction wascarried out at 15 °C for up to 15 h. The labeling reaction was performed by using afluorophore-coupled dUTPs in the same concentration as biotin-16-dUTP in ref. 2.
For HIV-1 labeling, a biotin-dUTP nucleotide mix containing 0.25 mM dATP,0.25 mM dCTP, 0.25 mM dGTP, 0.17 mM dTTP, and 0.08 mM biotin-16-dUTP inH2O was prepared. Three micrograms of pHXB2 were diluted with H2O in a finalvolume of 12 μl, and 4 μl of each nucleotide mix and Nick translation mix (Roche)were added. Labeling was performed at 15 °C for 3–6 h.
For dual-color FISH or improvement of signal-to-noise ratio in single-colorFISH, probes were labeled using the fluorophore-coupled nucleotidesSpectrumGreen dUTP (Abbott), SpectrumOrange dUTP (Abbott), and Red 650dUTP (Enzo).
In all, 1–3 μg of BAC DNA were diluted in a final volume of 22.5 μl H2O. Also,2.5 μl of 0.2 mM fluorophore-coupled dUTP, 5 μl of 0.1 mM dTTP, 10 μl of dNTPmix containing 0.1 mM of each dATP, dCTP, and dGTP, and 5 μl of 5× Nicktranslation buffer (Abbott) were added and reagents were mixed well by vortexing.The reaction was started by addition of 5 μl Nick translation enzymes (Abbott) andincubated at 15 °C for 13–14 h. The probes were checked for their size on a 1%agarose gel, and 200–500 bp probes were purified using Illustra Microspin G-25columns according to the manufacturer’s instructions. Probes were precipitated inethanol, dissolved in formamide and 4× SSC/20% dextran sulfate (1:1), and storedat −20 °C prior to use.
For probe hybridization, 1–6 µl of probe was loaded on glass coverslips and heatdenatured in metal chamber at 80 °C for 8 min in a water bath. Hybridization wascarried out for 48 h at 37 °C. Four washings in 2× SSC (10 min each) at 37 °C werefollowed with 2 washings in 0.5× SSC at 56 °C.
FISH development for DIG-labeled BACs was performed by using fluoresceinisothiocyanate (FITC)-labeled anti-DIG antibody (Roche), whereas biotin-labeledHIV-1 probes were detected by TSA Plus system from Perkin Elmer, that allowssignificant amplification of the signal, by using an anti-biotin antibody (SA-HRP)and a secondary antibody with a fluorescent dye (usually FITC for HIV).
For the directly labeled probes after initial washings, nuclei were stained withHoechst 33342 (1:5000 in PBS), washed in PBS, and then mounted using mowiol.
Microscopy and image analysis. For the classical confocal microscopy andmanual image analysis, 3D stacks were acquired with a Leica TCS SP8 confocalmicroscope using a ×63 oil immersion objective. Distance measurements wereperformed using Volocity (Perkin Elmer). The smallest distance between the FISHsignal and the nuclear lamina, stained by IF for lamin B1, was determined, andmeasurements were normalized to the nuclear radius (defined as half of themaximum diameter of the lamin B1 ring). Signal-to-radius ratios were eitherbinned into three classes of equal surface (zones 1–3)18 or plotted on a cumulativefrequency plot. Kolmogorov–Smirnov (KS) tests were performed to compare thedistributions of positioning of a gene between two conditions (resting vs activatedor DMSO vs JQ1).
For HTI and image analysis of dual-color FISH, images were acquired with aspinning disk Opera Phenix High Content Screening System (PerkinElmer),equipped with four laser lines (405 nm, 488 nm, 568 nm, 640 nm). Images of FISHexperiments to calculate 3D distances were acquired in confocal mode using a ×40water objective lens (NA 1.1) and two 16 bit CMOS cameras (2160 by 2160 pixels),with camera pixel binning of 2 (corresponding to 299 nm pixel size). For eachsample, 11 z-planes separated by 0.5 µm were obtained for a total number of atleast 36 randomly sampled fields, which acquired per condition a minimum of16 × 103 cells. Image analysis was performed using the Harmony high-contentimaging and analysis software (version 4.4, Perkin Elmer), using custom-madeimage analysis building blocks. Nuclei were segmented based on the Hoechst nucleistaining signal of maximum projected images using the algorithm B and cells in theperiphery of the image were excluded from further analysis. FISH probe detectionwas performed by using the spot detection algorithm C and custom-made scriptswere used to calculate the Euclidean distances between all the different coloredprobes per cell. Single cell-level data were then exported and custom-made Rscripts were used to select the minimum distance between the different FISHprobes per allele basis. To exclude spurious spot detection events from the analysis,only the distances of cells with two FISH probes detected per channel werecalculated and plotted (Graph Pad, Prism).
Quantitative real-time PCR (qPCR). Up to 5 × 10⁶ CD4+ T cells were used forRNA extraction with the InviTrap Spin Kit (Stratec Biomedical) according to themanufacturer’s instructions and up to 500 ng of RNA was retro-transcribed usingMoloney MLV reverse transcriptase from Invitrogen according to the manu-facturer’s instructions. Gene expression analysis were performed in duplicatesusing IQ supermix from Biorad in CFX96/C1000 Touch Real-Time PCR system, asdescribed in Lusic et al., 2013. Statistical analysis of qPCR data was performedusing Graphpad. Taqman assays used were: for MYC Taqman Hs00153408_m1FAM/MGB and for GAPDH 4310884E VIC/TAMRA.
Western blotting. In all, 5 × 10⁶ cells were harvested and homogenized in lysisbuffer (20 mM Tris-HCl, pH 7.4, 1 mM EDTA, 150 mM NaCl, 0.5% Nonidet P-40,0.1% sodium dodecyl sulfate (SDS), 0.5% sodium deoxycholate) supplemented withprotease inhibitors (Roche) for 10 min at 4 °C and sonicated (Bioruptor) for 5 min.Equal amounts of total cellular proteins (20 μg), as measured with Bradford reagent(Biorad), were resolved by 10% SDS-polyacrylamide gel electrophoresis, transferredonto nitrocellulose membrane (GE Healthcare), and then probed with primaryantibody, followed by secondary antibody conjugated with horseradish peroxidase.The immuno-complexes were visualized with enhanced chemiluminescence kits(GE Healthcare). Antibodies used were: for MYC 9E10, # sc-40 (1:500) from SantaCruz and for actin Anti-β-Actin AC-74, # A5316 (1:5000) from Sigma Aldrich.
Flow cytometric analysis. T cell activation with CD3/CD28 activating beads wascontrolled with CD25 and CD69 activation markers. Approximately 150,000 werefixed in 3% PFA for 10 min at RT. Cells were washed in 1% FBS/PBS and stainedwith the corresponding antibody for 45 min on ice, (1:50 dilution was used forCD25 FITC, #555431 from BD and CD69 BV510 #310929 from Biolegend). Cellswere extensively washed and profiled using BD FACSVerse™ instrument. Gates foractivation marker-positive cells were set by utilizing unstained controls. FlowJosoftware was used for the data analysis. Gating strategy is described in Supple-mentary Fig. 7.
Chromatin immunoprecipitation. In all, 20 × 106 CD4+ T cells were washed 1time in PBS prior to crosslinking with 1% formaldehyde for 10 min at RT, followedby termination of the reaction with 125 mM glycine on ice. Cell pellet was washed 2times with PBS at 4 °C and was lysed in 0.5% NP-40 buffer (10 mM Tris-Cl pH 7.4,10 mM NaCl, 3 mM MgCl2, 1 mM PMSF, and Protease Inhibitors). For histoneChIPs, obtained nuclei were washed once in the same buffer without NP-40. Nucleiwere resuspended in 0.5% NP-40 buffer supplemented with 0.15% SDS and 1.5 mMCaCl2. Nuclei were incubated at 37 °C for 10 min prior to addition of MicrococcalNuclease (16 units of the enzyme), and the reaction was stopped after 7 min with 3mM EGTA. DNA was additionally sheared by sonication (Covaris or Bioruptor,Diagenode) to an average size of DNA fragments <500 bps. Extracts were thendiluted up to 0.01% SDS, 1% Triton-X, 20 mM Tris pH 8, 150 mM NaCl, and 2mM EDTA. Extracts were precleared by 1-h incubation with protein A/G MagnaChIP beads at 4 °C and diluted with 5× IP buffer to a final concentration of 140mM NaCl and 1% NP-40. Lysate corresponding to 3−4 × 10⁶ million of cells wasthen incubated with 2–4 µg of the indicated antibody overnight at 4 °C, followed bya 2.5-h incubation with Magna ChIP Protein A/G Magnetic Beads (Millipore).Beads were then washed thoroughly with RIPA150, with LiCl-containing bufferand with TE buffer, RNAse treated for 1 h at 37 °C, and Proteinase K treated for 2 hat 56 °C. Decrosslinking of protein–DNA complexes was performed by an over-night incubation at 65 °C. Additional 1 h of Proteinase K digestion was performedat 56 °C and DNA was then extracted using Agencourt AMPure XP beads(Beckman Coulter) and quantified by real-time PCR. The following antibodies wereused for ChIP: H3K27ac (ab4729), H3K4me3 (ab8580) H3K36me3 (ab9050), IgGRabbit (ab46540).
ChIP-Seq and RNA-Seq. ChIP-Seq: Approximately 10 ng of the correspondinginputs and ChIP-ed DNA from primary CD4+ T cells: H3K27ac, H3K4me3,H3K36me3, H4K20me1, and H3K9me2, IPs were prepared for sequencing usingthe NEBNext® Ultra™ II DNA Library Prep Kit for Illumina®.
RNA-Seq: 5 × 10⁶ DMSO and 500 nM JQ1-treated CD4+ T cells from threeindependent donors were used for RNA extraction with the InviTrap Spin Kit(Stratec Biomedical) according to the manufacturer’s instructions and libraries forsequencing were prepared by using the rRNA Depletion Kit NEBNext® andNEBNext® Ultra™ RNA Library Prep Kit for Illumina®. Sequencing was performedwith 2 × 75 bp read length on the NextSeq platform.
In situ Hi-C protocol. Hi-C was performed based on the protocol published by Raoet al.83 with modifications. Briefly, one million cells were crosslinked with 1%formaldehyde for 10 min at RT with gentle rotation. Nuclei were permeabilized by0.25 ml freshly prepared ice-cold Hi-C lysis buffer [10 mM Tris-HCl pH 8.0,10 mM NaCl, 0.2% Igepal CA630 (Sigma, I8896–50ML), and 1× Roche completeprotease inhibitors (Roche, 11836153001)]. DNA was digested with 100 units ofMboI (NEB, R0147M) at 37 °C overnight, and the ends of digested fragments werefilled in by using 0.4 mM biotinylated deoxyadenosine triphosphate (biotin-14-dATP; Life Technologies, #65001) and ligated in 1 ml by incubating at 24 °C
ARTICLE NATURE COMMUNICATIONS | https://doi.org/10.1038/s41467-019-12046-3
10 NATURE COMMUNICATIONS | (2019) 10:4059 | https://doi.org/10.1038/s41467-019-12046-3 | www.nature.com/naturecommunications

overnight with gentle rotation. After reversal of the crosslinks, ligated DNA waspurified and sheared to a length of 400 bp. Ligation junctions were pulled downwith 75 μl of 10 mg/ml streptavidin C1 beads. Ten microliters of DNA-on-beadswere amplified in 50 μl standard Herculase II Fusion DNA Polymerase reactionmix (Agilent Technologies, #600675) with 1 μM NEBNext Universal primer andindex primer (NEB, E6040S). The cycling conditions were as follows: 98 °C for 2min; 98 °C for 20 s, 65 °C for 30 s, and 72 °C for 45 s (8 cycles); and 72 °C for 3 min.PCR products were purified with 1.0× Agencourt AMPure XP beads (BECKMANCOULTER, A63880). Libraries ran as a smear on 1.5% agarose gel and estimate ofthe size of a smear was around 300 bp. The quality of the libraries was assessed bydigesting with ClaI (NEB, R0197S) and checking that the smear shifts downwards.
Reporting summary. Further information on research design is available in theNature Research Reporting Summary linked to this article.
Data availabilityAll relevant data supporting the key findings of this study are available within the articleand its Supplementary Information files or from the corresponding authors onreasonable request. The RNA- Seq of resting and activated CD4+ T cells is available fromGene Expression Omnibus (GEO; Lucic et al. GSE122735), ChIP-Seq on primary CD4+
T cells (Lucic et al. GSE GSE122826), in situ Hi-C data (Chen et al. GSE122958).Integration site raw data on in vitro infected CD4+ T cells are available from GSE134382.A reporting summary for this Article is available as a Supplementary Information file.
Code availabilityCode for processing raw sequences to get integration sites is available here: https://github.com/gui11aume/genome_structure_and_HIV_integration/blob/master/maja/Brady_Integration_Sites.md. Integration sites used in this analysis are available as an Robject containing a list of GRanges objects, one list element for each dataset used; https://github.com/gui11aume/genome_structure_and_HIV_integration/blob/master/maja/is.Robj. The matrix that contains the number of lists each gene is found in all 100randomizations can be found here (in RDS format): https://github.com/gui11aume/genome_structure_and_HIV_integration/raw/master/maja/Replicates.RDS. Genuine Hi-C contacts were validated with the Hi.C pipeline (https://github.com/ezorita/hi.c).
Received: 11 May 2018 Accepted: 19 August 2019
References1. Coffin, J. M., Hughes, S. H. & Varmus, H. E. in Retroviruses (eds Coffin, J. M.,
Hughes, S. H. & Varmus, H. E.) (Cold Spring Harbor Laboratory Press, 2011).2. Craigie, R. & Bushman, F. D. HIV DNA integration. Cold Spring Harb.
Perspect. Med. 2, a006890 (2012).3. Lusic, M. & Siliciano, R. F. Nuclear landscape of HIV-1 infection and
integration. Nat. Rev. Microbiol. 15, 69–82 (2017).4. Sengupta, S. & Siliciano, R. F. Targeting the latent reservoir for HIV-1.
Immunity 48, 872–895 (2018).5. Churchill, M. J., Deeks, S. G., Margolis, D. M., Siliciano, R. F. & Swanstrom, R.
HIV reservoirs: what, where and how to target them. Nat. Rev. Microbiol. 14,55–60 (2016).
6. Chomont, N. et al. HIV reservoir size and persistence are driven by T cellsurvival and homeostatic proliferation. Nat. Med. 15, 893–900 (2009).
7. Zack, J. A., Kim, S. G. & Vatakis, D. N. HIV restriction in quiescent CD4+
T cells. Retrovirology 10, 37 (2013).8. Dai, J. et al. Human immunodeficiency virus integrates directly into naive
resting CD4+ T cells but enters naive cells less efficiently than memory cells. J.Virol. 83, 4528–4537 (2009).
9. Agosto, L. M. et al. The CXCR4-tropic human immunodeficiency virusenvelope promotes more-efficient gene delivery to resting CD4+ T cells thanthe vesicular stomatitis virus glycoprotein G envelope. J. Virol. 83, 8153–8162(2009).
10. Pace, M. J. et al. Directly infected resting CD4+T cells can produce HIV Gagwithout spreading infection in a model of HIV latency. PLoS Pathog. 8,e1002818 (2012).
11. Dahabieh, M. S., Battivelli, E. & Verdin, E. Understanding HIV latency: theroad to an HIV cure. Annu. Rev. Med. 66, 407–421 (2015).
12. Lusic, M. & Giacca, M. Regulation of HIV-1 latency by chromatin structureand nuclear architecture. J. Mol. Biol. 427, 688–694 (2015).
13. Suzuki, Y. & Craigie, R. The road to chromatin - nuclear entry of retroviruses.Nat. Rev. Microbiol. 5, 187–196 (2007).
14. Ocwieja, K. E. et al. HIV integration targeting: a pathway involvingTransportin-3 and the nuclear pore protein RanBP2. PLoS Pathog. 7,e1001313 (2011).
15. Di Nunzio, F. et al. Nup153 and Nup98 bind the HIV-1 core and contribute tothe early steps of HIV-1 replication. Virology 440, 8–18 (2013).
16. Koh, Y. et al. Differential effects of human immunodeficiency virus type 1capsid and cellular factors nucleoporin 153 and LEDGF/p75 on the efficiencyand specificity of viral DNA integration. J. Virol. 87, 648–658 (2013).
17. Yamashita, M. & Engelman, A. N. Capsid-dependent host factors in HIV-1infection. Trends Microbiol. 25, 741–755 (2017).
18. Marini, B. et al. Nuclear architecture dictates HIV-1 integration site selection.Nature 521, 227–231 (2015).
19. Lelek, M. et al. Chromatin organization at the nuclear pore favours HIVreplication. Nat. Commun. 6, 6483 (2015).
20. Schröder, A. R. W. et al. HIV-1 integration in the human genome favors activegenes and local hotspots. Cell 110, 521–529 (2002).
21. Ciuffi, A. et al. A role for LEDGF/p75 in targeting HIV DNA integration. Nat.Med 11, 1287–1289 (2005).
22. Singh, P. K. et al. LEDGF/p75 interacts with mRNA splicing factors andtargets HIV-1 integration to highly spliced genes. Genes Dev. 29, 2287–2297(2015).
23. Cherepanov, P. et al. HIV-1 integrase forms stable tetramers and associateswith LEDGF/p75 protein in human cells. J. Biol. Chem. 278, 372–381 (2003).
24. Sowd, G. A. et al. A critical role for alternative polyadenylation factor CPSF6in targeting HIV-1 integration to transcriptionally active chromatin. Proc.Natl Acad. Sci. USA 113, E1054–E1063 (2016).
25. Vranckx, L. S. et al. LEDGIN-mediated inhibition of integrase-LEDGF/p75interaction reduces reactivation of residual latent HIV. EBioMedicine 8,248–264 (2016).
26. Achuthan, V. et al. Capsid-CPSF6 interaction licenses nuclear HIV-1trafficking to sites of viral DNA integration. Cell Host Microbe 24, 392.e8–404.e8 (2018).
27. Bejarano, D. A. et al. HIV-1 nuclear import in macrophages is regulated byCPSF6-capsid interactions at the nuclear pore complex. Elife 8, e41800 (2019).
28. Wang, G. P., Ciuffi, A., Leipzig, J., Berry, C. C. & Bushman, F. D. HIVintegration site selection: analysis by massively parallel pyrosequencing revealsassociation with epigenetic modifications. Genome Res. 17, 1186–1194 (2007).
29. Chen, H.-C., Martinez, J. P., Zorita, E., Meyerhans, A. & Filion, G. J. Positioneffects influence HIV latency reversal. Nat. Struct. Mol. Biol. 24, 47–54 (2017).
30. Whyte, W. A. et al. Master transcription factors and mediator establish super-enhancers at key cell identity genes. Cell 153, 307–319 (2013).
31. Lovén, J. et al. Selective inhibition of tumor oncogenes by disruption of super-enhancers. Cell 153, 320–334 (2013).
32. Hnisz, D. et al. Super-enhancers in the control of cell identity and disease. Cell155, 934–947 (2013).
33. Parker, S. C. J. et al. Chromatin stretch enhancer states drive cell-specific generegulation and harbor human disease risk variants. Proc. Natl Acad. Sci. USA110, 17921–17926 (2013).
34. Hnisz, D., Day, D. S. & Young, R. A. Insulated neighborhoods: structural andfunctional units of mammalian gene control. Cell 167, 1188–1200 (2016).
35. Witte, S., O’Shea, J. J. & Vahedi, G. Super-enhancers: asset management inimmune cell genomes. Trends Immunol. 36, 519–526 (2015).
36. Roychoudhuri, R. et al. BACH2 represses effector programs to stabilize T(reg)-mediated immune homeostasis. Nature 498, 506–510 (2013).
37. Tsukumo, S.-I. et al. Bach2 maintains T cells in a naive state by suppressingeffector memory-related genes. Proc. Natl Acad. Sci. USA 110, 10735–10740(2013).
38. Wagner, T. A. et al. HIV latency. Proliferation of cells with HIV integratedinto cancer genes contributes to persistent infection. Science 345, 570–573(2014).
39. Maldarelli, F. et al. HIV latency. Specific HIV integration sites are linked toclonal expansion and persistence of infected cells. Science 345, 179–183(2014).
40. Toda, T. et al. Nup153 interacts with Sox2 to enable bimodal gene regulationand maintenance of neural progenitor cells. Cell Stem Cell 21, 618–634.e7(2017).
41. Ibarra, A., Benner, C., Tyagi, S., Cool, J. & Hetzer, M. W. Nucleoporin-mediated regulation of cell identity genes. Genes Dev. 30, 2253–2258 (2016).
42. Rao, S. et al. Cohesin loss eliminates all loop domains, leading to links amongsuperenhancers and downregulation of nearby genes. Cell. 171, 305.e24–320.e24 (2017).
43. Olley, G. et al. BRD4 interacts with NIPBL and BRD4 is mutated in a Corneliade Lange-like syndrome. Nat. Genet. 50, 329–332 (2018).
44. Beagrie, R. A. et al. Complex multi-enhancer contacts captured by genomearchitecture mapping. Nature 543, 519–524 (2017).
45. Bonev, B. & Cavalli, G. Organization and function of the 3D genome. Nat.Rev. Genet. 17, 772 (2016).
46. Lieberman-Aiden, E. et al. Comprehensive mapping of long-range interactionsreveals folding principles of the human genome. Science 326, 289–293 (2009).
47. Rao, S. S. et al. A 3D map of the human genome at kilobase resolution revealsprinciples of chromatin looping. Cell 159, 1665–1680 (2014).
NATURE COMMUNICATIONS | https://doi.org/10.1038/s41467-019-12046-3 ARTICLE
NATURE COMMUNICATIONS | (2019) 10:4059 | https://doi.org/10.1038/s41467-019-12046-3 | www.nature.com/naturecommunications 11

48. Noordermeer, D. et al. The dynamic architecture of Hox gene clusters. Science334, 222–225 (2011).
49. Di Primio, C. et al. Single-cell imaging of HIV-1 provirus (SCIP). Proc. NatlAcad. Sci. USA 110, 5636–5641 (2013).
50. Brady, T. et al. HIV integration site distributions in resting and activated CD4+ T cells infected in culture. AIDS 23, 1461–1471 (2009).
51. Han, Y. et al. Resting CD4+ T cells from human immunodeficiency virus type1 (HIV-1)-infected individuals carry integrated HIV-1 genomes withinactively transcribed host genes. J. Virol. 78, 6122–6133 (2004).
52. Kok, Y. L. et al. Monocyte-derived macrophages exhibit distinct and morerestricted HIV-1 integration site repertoire than CD4(+) T cells. Sci. Rep. 6,24157 (2016).
53. Cohn, L. B. et al. HIV-1 integration landscape during latent and activeinfection. Cell 160, 420–432 (2015).
54. Ikeda, T., Shibata, J., Yoshimura, K., Koito, A. & Matsushita, S. RecurrentHIV-1 integration at the BACH2 locus in resting CD4+ T cell populationsduring effective highly active antiretroviral therapy. J. Infect. Dis. 195, 716–725(2007).
55. Berry, C., Hannenhalli, S., Leipzig, J. & Bushman, F. D. Selection of target sitesfor mobile DNA integration in the human genome. PLoS Comput. Biol. 2,e157 (2006).
56. Brady, T. et al. Integration target site selection by a resurrected humanendogenous retrovirus. Genes Dev. 23, 633–642 (2009).
57. Creyghton, M. P. et al. Histone H3K27ac separates active from poisedenhancers and predicts developmental state. Proc. Natl. Acad. Sci. USA 107,21931–21936 (2010).
58. Heintzman, N. D. et al. Histone modifications at human enhancers reflectglobal cell-type-specific gene expression. Nature 459, 108–112 (2009).
59. Wagner, E. J. & Carpenter, P. B. Understanding the language of Lys36methylation at histone H3. Nat. Rev. Mol. Cell Biol. 13, 115–126 (2012).
60. Heinz, S. et al. Simple combinations of lineage-determining transcriptionfactors prime cis-regulatory elements required for macrophage and B cellidentities. Mol. Cell 38, 576–589 (2010).
61. Khan, A. & Zhang, X. dbSUPER: a database of super-enhancers in mouse andhuman genome. Nucleic Acids Res. 44, D164–D171 (2016).
62. Shao, W. et al. Retrovirus Integration Database (RID): a public databasefor retroviral insertion sites into host genomes. Retrovirology 13, 47(2016).
63. LaFave, M. C. et al. MLV integration site selection is driven by strongenhancers and active promoters. Nucleic Acids Res. 42, 4257–4269 (2014).
64. Filippakopoulos, P. et al. Selective inhibition of BET bromodomains. Nature468, 1067–1073 (2010).
65. Roukos, V. et al. Spatial dynamics of chromosome translocations in livingcells. Science 341, 660–664 (2013).
66. Roukos, V. & Misteli, T. Deep imaging: the next frontier in microscopy.Histochem. Cell Biol. 142, 125–131 (2014).
67. Hughes, S. H. & Coffin, J. M. What integration sites tell us about HIVpersistence. Cell Host Microbe 19, 588–598 (2016).
68. Chen, Y. et al. Mapping 3D genome organization relative to nuclearcompartments using TSA-Seq as a cytological ruler. J. Cell Biol. 217,4025–4048 (2018).
69. Bickmore, W. A. The spatial organization of the human genome. Annu. Rev.Genom. Hum. Genet. 14, 67–84 (2013).
70. Rasheedi, S. et al. The cleavage and polyadenylation specificity factor 6(CPSF6) subunit of the capsid-recruited pre-messenger RNA cleavage factor I(CFIm) complex mediates HIV-1 integration into genes. J. Biol. Chem. 291,11809–11819 (2016).
71. Blow, M. J. et al. ChIP-Seq identification of weakly conserved heart enhancers.Nat. Genet. 42, 806–810 (2010).
72. Visel, A. et al. ChIP-seq accurately predicts tissue-specific activity ofenhancers. Nature 457, 854–858 (2009).
73. Vahedi, G. et al. Super-enhancers delineate disease-associated regulatorynodes in T cells. Nature 520, 558–562 (2015).
74. Witte, S., Bradley, A., Enright, A. J. & Muljo, S. A. High-density P300enhancers control cell state transitions. BMC Genomics 16, 903 (2015).
75. Cereseto, A. et al. Acetylation of HIV-1 integrase by p300 regulates viralintegration. EMBO J. 24, 3070–3081 (2005).
76. Sharma, A. et al. BET proteins promote efficient murine leukemia virusintegration at transcription start sites. Proc. Natl Acad. Sci. USA 110,12036–12041 (2013).
77. De Rijck, J. et al. The BET family of proteins targets moloney murine leukemiavirus integration near transcription start sites. Cell Rep. 5, 886–894 (2013).
78. Boehm, D. et al. BET bromodomain-targeting compounds reactivate HIV fromlatency via a Tat-independent mechanism. Cell Cycle 12, 452–462 (2013).
79. Li, Z., Guo, J., Wu, Y. & Zhou, Q. The BET bromodomain inhibitor JQ1activates HIV latency through antagonizing Brd4 inhibition of Tat-transactivation. Nucleic Acids Res. 41, 277–287 (2013).
80. Conrad, R. J. et al. The short isoform of BRD4 promotes HIV-1 latency byengaging repressive SWI/SNF chromatin-remodeling complexes. Mol. Cell 67,1001–1012.e6 (2017).
81. Rouzine, I. M., Weinberger, A. D. & Weinberger, L. S. An evolutionary role forHIV latency in enhancing viral transmission. Cell 160, 1002–1012 (2015).
82. Razooky, B. S., Pai, A., Aull, K., Rouzine, I. M. & Weinberger, L. S. Ahardwired HIV latency program. Cell 160, 990–1001 (2015).
83. Rao, S. S. et al. A 3D map of the human genome at kilobase resolution revealsprinciples of chromatin looping (Erratum). Cell 162, 687–688 (2015).
AcknowledgementsWe thank the Infectious Diseases Imaging Platform (IDIP) and the platform coordinatorDr. Vibor Laketa (DZIF), as well as the genomics core facility of the CRG for theirtechnical support. We also thank Monsef Benkirane and Thomas Gayraud from the IGHMontpellier for providing samples of cell sorted infected primary CD4+ T cell. Thiswork was supported by German Center for Infection Research (DZIF) ThematicTranslational Unit HIV-1 04.704 Infrastructural Measure to M.L. and by the HectorGrant M70 “HiPNose: HiV Positioning in the Nuclear Space” to M.L. and M.S. Weacknowledge the financial support of the Spanish Ministry of Economy and Competi-tiveness (“Centro de Excelencia Severo Ochoa 2013–2017,” Plan NacionalBFU2012–37168), of the CERCA (Centres de Recerca de Catalunya) Programme/Gen-eralitat de Catalunya, and of the European Research Council (Synergy Grant 609989).K.V. and M.K. are supported by the European Structural and Investment Funds grant forthe Croatian National Centre of Research Excellence in Personalized Healthcare (con-tract #KK.01.1.1.01.0010), Croatian National Centre of Research Excellence for DataScience and Advanced Cooperative Systems (contract KK.01.1.1.01.0009), and CroatianScience Foundation (grant IP-2014–09–6400).
Author contributionsM.L, B.L. and G.F. designed the research; B.L., H.C., J.W., V.M. and W.W. performed theexperiments; M.K., R.S., E.Z., R.F., K.V., and G.F. performed bioinformatics analysis;B.L., M.K., E.Z., V.R., K.V., G.F. and M.L analyzed the data; B.L., M.K., G.F. and M.L.wrote the manuscript; M.L., G.F., K.V., M.S. and S.L. provided funding.
Additional informationSupplementary Information accompanies this paper at https://doi.org/10.1038/s41467-019-12046-3.
Competing interests: The authors declare no competing interests.
Reprints and permission information is available online at http://npg.nature.com/reprintsandpermissions/
Peer review information: Nature Communications thanks the anonymous reviewers fortheir contribution to the peer review of this work. Peer reviewer reports are available.
Publisher’s note: Springer Nature remains neutral with regard to jurisdictional claims inpublished maps and institutional affiliations.
Open Access This article is licensed under a Creative CommonsAttribution 4.0 International License, which permits use, sharing,
adaptation, distribution and reproduction in any medium or format, as long as you giveappropriate credit to the original author(s) and the source, provide a link to the CreativeCommons license, and indicate if changes were made. The images or other third partymaterial in this article are included in the article’s Creative Commons license, unlessindicated otherwise in a credit line to the material. If material is not included in thearticle’s Creative Commons license and your intended use is not permitted by statutoryregulation or exceeds the permitted use, you will need to obtain permission directly fromthe copyright holder. To view a copy of this license, visit http://creativecommons.org/licenses/by/4.0/.
© The Author(s) 2019
ARTICLE NATURE COMMUNICATIONS | https://doi.org/10.1038/s41467-019-12046-3
12 NATURE COMMUNICATIONS | (2019) 10:4059 | https://doi.org/10.1038/s41467-019-12046-3 | www.nature.com/naturecommunications