A Reproduction, growth and connectivity among populations ...

This article was downloaded by: [203.109.163.22]On: 10 March 2015, At: 18:58Publisher: Taylor & FrancisInforma Ltd Registered in England and Wales Registered Number: 1072954 Registered office: Mortimer House,37-41 Mortimer Street, London W1T 3JH, UK
Click for updates
Invertebrate Reproduction & DevelopmentPublication details, including instructions for authors and subscription information:http://www.tandfonline.com/loi/tinv20
Spatial variation in reproduction in southernpopulations of the New Zealand bivalve Paphiesventricosa (Veneroida: Mesodesmatidae)Kendall Gadomskia & Miles Lamarea
a Department of Marine Science, University of Otago, PO Box 56, Dunedin 9054, NewZealandPublished online: 13 Feb 2015.
To cite this article: Kendall Gadomski & Miles Lamare (2015): Spatial variation in reproduction in southern populations ofthe New Zealand bivalve Paphies ventricosa (Veneroida: Mesodesmatidae), Invertebrate Reproduction & Development, DOI:10.1080/07924259.2015.1007216
To link to this article: http://dx.doi.org/10.1080/07924259.2015.1007216
PLEASE SCROLL DOWN FOR ARTICLE
Taylor & Francis makes every effort to ensure the accuracy of all the information (the “Content”) containedin the publications on our platform. However, Taylor & Francis, our agents, and our licensors make norepresentations or warranties whatsoever as to the accuracy, completeness, or suitability for any purpose of theContent. Any opinions and views expressed in this publication are the opinions and views of the authors, andare not the views of or endorsed by Taylor & Francis. The accuracy of the Content should not be relied upon andshould be independently verified with primary sources of information. Taylor and Francis shall not be liable forany losses, actions, claims, proceedings, demands, costs, expenses, damages, and other liabilities whatsoeveror howsoever caused arising directly or indirectly in connection with, in relation to or arising out of the use ofthe Content.
This article may be used for research, teaching, and private study purposes. Any substantial or systematicreproduction, redistribution, reselling, loan, sub-licensing, systematic supply, or distribution in anyform to anyone is expressly forbidden. Terms & Conditions of access and use can be found at http://www.tandfonline.com/page/terms-and-conditions

Spatial variation in reproduction in southern populations of the New Zealand bivalve Paphiesventricosa (Veneroida: Mesodesmatidae)
Kendall Gadomski and Miles Lamare*
Department of Marine Science, University of Otago, PO Box 56, Dunedin 9054, New Zealand
(Received 25 November 2014; accepted 9 January 2015)
Paphies ventricosa is a large surf clam endemic to New Zealand, and whose populations have substantially declined dur-ing the past century owing to overfishing and habitat degradation. Poor recruitment is now evident, and therefore, under-standing the reproductive patterns of P. ventricosa is a key to developing and implementing conservation strategies forthe species. This study examines the reproductive cycle of P. ventricosa over one year in a population at Oreti Beach,Southland, the southernmost known extent of the species. At the same beach, we quantify spatial variation in reproduc-tion among four sites using quarterly surveys. Reproductive status is quantified from body indices and histological exam-ination of gonads. Based on changes in oocyte sizes, gametogenic stages and condition index, we observed a specieswith a primary spawning in spring and a second spawning event in autumn, with no resting phase but minimal reproduc-tive activity over winter. Seasonal reproduction corresponded with warmer sea surface temperature and a peak in chloro-phyll-a concentrations in the region. Small-scale (<15 km) variation in the timing of spawning was also evident alongOreti Beach, and these patterns maybe an important consideration when identifying areas that may be considered forconserving source populations.
Keywords: gametogenesis; surf clam; condition index; histology; sea temperature
Introduction
Paphies ventricosa (Veneroida: Mesodesmatidae) Gray1843, known by the Māori name toheroa, is a large surfclam (up to 150 mm shell length) endemic to New Zealand.The species has a broad latitudinal distribution rangingbetween 34.5° and 46.3°S, although only three substantialpopulations now exist, these being physically separated byup to 700 km (Beentjes et al. 2006). The species isrestricted to high-energy dissipating beaches that are onwestern-facing fully exposed coasts made of fine sand(~0.25 mm average grain size) (Rapson 1952; Cassie1955). Adult size classes (>90 mm) are concentrated atmid-tide levels, sub-adults (40–90 mm) are higher on thebeach, whilst the juveniles (<40 mm) have a wider andmore even vertical distribution across the tidal range but aremost abundant higher up the beach (Beentjes et al. 2006;Beentjes & Gilbert 2006).
P. ventricosa population sizes throughout NewZealand have decreased substantially over the past cen-tury. For example, Greenway (1972) estimated that thenorthern population has declined from an estimate of10,000,000 individuals in 1964 to 1,000,000 in 1971.Southern populations have also experienced similardeclines, with Beentjes et al. (2006) reporting populationsizes reduced from 2.2 million in the mid-1970s to78,000 individuals larger than 100 mm by 1990. Thereasons for the decline are poorly understood, but
substantial overfishing in the first half of the twentiethcentury (Rapson 1954), habitat degradation (Beentjeset al. 2006) and disturbance from beach traffic are con-tributors (Brunton 1978; Williams et al. 2013).
Recruitment has been identified as a key issue for thespecies (Beentjes et al. 2006; Morrison & Parkinson2008), and the production and supply of P. ventricosalarvae may be limited due to the small and fragmentednature of present-day populations. A key aspect in under-standing recruitment in bivalves is quantifying processescontrolling larval supply, which includes a detailedunderstanding of the spatial and temporal patterns inreproductive cycles and gamete production.
Reproduction has been examined in a range oftemperate bivalve orders such as Veneroida (Newell &Bayne 1980; Harvey & Vincent 1989; Gaspar et al.1999), Mytiloida (Wilson & Hodgkin 1967), Ostreoida(Ruiz et al. 1992), and Myoida (Zaidman et al. 2012).This includes a number of bivalve species inhabitingNew Zealand soft sand environments, such as Ruditapeslargillierti (Gribben et al. 2001), Panopea zelandica(Gribben et al. 2004) and Zenatia acinaces (Gribben2005). For the New Zealand species, reproductionfollows relatively well-defined annual cycles with spawn-ing occurring within the spring and summer period.
Of interest in this study is the family Mesodesmati-dae (Bivalvia: Veneroida), in which the reproduction has
*Corresponding author. Email: [email protected]
© 2015 Taylor & Francis
Invertebrate Reproduction & Development, 2015http://dx.doi.org/10.1080/07924259.2015.1007216
Dow
nloa
ded
by [
203.
109.
163.
22]
at 1
8:58
10
Mar
ch 2
015

been described in a small number of species includingthe Australian Donacilla cuneata (Roberts 1984), AsianCoecella chinensis (Kim et al. 2013), the SouthAmerican Mesodesma donacium (Peredo et al. 1987;Riascos et al. 2009; Uribe et al. 2012) and Mesodesmamactroides (Herrmann et al. 2009), and the tropical spe-cies Atactodea striata (Baron 1992). Reproduction inNew Zealand mesodematids, all in the genus Paphies,has been described for P. ventricosa (Redfearn 1974),P. australis (Hooker & Creese 1995), Paphies donacina(Marsden 1999) and Paphies subtriangulata (Grant &Creese 1995).
Most of what it known about P. ventricosa reproduc-tion comes from the North Island. Hoby (1933) foundthat egg diameter increased from June (59–65 μm) toOctober (75–80 μm) and that sperm activity increasedfrom “fairly active” at the end of July to “extremelyactive” in October. Additionally, Hoby (1933) found thatat the beginning of October few animals had spawned,but by the end of the month, most animals had spawned.Redfearn (1974) identified four stages of gametogenicdevelopment in P. ventricosa, classified as early active(EA), late active (LA), mature and partially spawned/spent. The study found two to three spawning eventsoccurred during the summer season, with an initialmaturing period in September followed by a secondmaturing period in December/January when mean seasurface temperature (SST) was the highest. Smith (2003)classified five gametogenic developmental stages (EA,LA, ripe, partially spawned/spent and rapid redevelop-ment) and also observed two ripening/spawning events,one in August/September, and a second from Decemberto March. No published accounts exist for reproductionof P. ventricosa in southern New Zealand, although anunpublished account by Mandeno (1999) examinedreproduction of the South Island population from a sin-gle site. Mandeno (1999) classified southern P. ventrico-sa into the same four gametogenic stages as Redfearn(1974) and identified two major ripening events, one inSeptember, and a second in February.
The current study aims to increase our understandingof the reproduction of P. ventricosa, particularly in termsof temporal and spatial patterns at Oreti Beach, South-land, New Zealand. Here, a detailed description of thereproduction of P. ventricosa is made using a conditionindex (CI) and detailed histological study of the gonadover a period of two years at four different sites (one sitein 2011, and four sites in 2012) at Oreti Beach. Repro-ductive activity over the period was compared withphysical environmental conditions from the study sites.
This study is the first to detail the reproductive cyclein southern populations of P. ventricosa and providesinsight into the spatial variation in reproduction, bothacross latitude, but at smaller scales (i.e. <5 km). Thisinformation is required for the effective management of
threatened bivalve species such as P. ventricosa, whereknowledge of spatial and temporal patterns of reproduc-tion can be used in conservation strategies to maximisefuture recruitment by identifying larval source popula-tions (Gaines et al. 2010).
Materials and methods
Study site and animal collection
Reproduction in P. ventricosa was examined at four sitesalong Oreti Beach, Southland, New Zealand. Oreti Beachis a south-west facing, 26 km long, dissipating surfbeach on the shores of Foveaux Strait (Figure 1). Eachend of the beach is bordered by two river/estuary sys-tems.
To examine reproduction over one year, 20 matureanimals were collected from a single site (Site B) everymonth between January 2011 and December 2011,excluding April 2011 (Figure 1). The following year(2012), spatial and seasonal patterns of reproduction inP. ventricosa along Oreti Beach was examined at foursample sites along the length of the beach (Site A–D)for autumn (March), winter (June), spring (September)and summer (December) (Figure 1). For this, 20 animalswere collected per site per season. All animals collectedwere greater than 95-cm shell length, exceeding the sizeof sexual maturity (76-mm shell length) reported byRapson (1952). All extractions were made by hand,packed in local sand and seawater for transportation tothe laboratory for dissection within 2 days. Collectionsin both years were made at low tide, ±2 h.
Individual condition index (CI)
For each animal, live individuals were blotted dry andthe total wet mass (Mt) was determined to the nearest0.1 g, following which the animals were dissected andthe combined weight of the visceral mass and foot deter-mined (Mv). Using these weights and methods describedby (Herrmann et al. 2009; after de Villiers 1975) a CIfor each individual was calculated as:
CIð%Þ ¼ 100Mv
Mt �Mv
� �
Histological preparation
The gonad tissue of P. ventricosa is diffused within thebody; therefore, an intact 15-mm cross-sectional portionof foot, gonad and gut was excised adjacent to the ante-rior adductor muscle and immediately fixed in 10% tetra-sodium borate (30 g L−1) buffered formalin in seawater.Following fixation, a section of gonad tissue (<15 mm
2 K. Gadomski and M. Lamare
Dow
nloa
ded
by [
203.
109.
163.
22]
at 1
8:58
10
Mar
ch 2
015

side length, surrounded by foot tissue to stabilise thegonad tissue) was removed and placed into tissue cas-settes for tissue processing. Any portion of the crystal-line style was removed from the sections, and care wastaken to avoid gut tissue in the preparations.
Excised sections were dehydrated via an alcohol ser-ies, and re-saturated with Paraplast® (Sigma-Aldrich)wax. Sections were then embedded in Paraplast®, sec-tioned at 7–10 μm thickness and mounted on chromealum gelatine-coated slides. Sections were first stainedwith Meyer’s haemotoxylin, counterstained with eosinand mounted using DPX Mountant (Sigma-Aldrich).
Determination of sex and reproductive stage
Mounted gonad sections were photographed using anOlympus BX51 compound microscope fitted with anOlympus ColorviewIII camera, controlled by the soft-ware Analysis LS (Olympus Corporation). Animals weresexed and assigned to one of four reproductive stages(Figure 2, Table 1), namely: EA, LA, ripe (RI) andpartially spawned/spent (SP). Definitions of the stageswere adapted from earlier bivalve studies (Ropes 1968;
Redfearn 1974; Grant & Creese 1995; Hooker & Creese1995; Mandeno 1999).
Oocyte diameter and density
For each female, the size of up to 50 oocytes sectionedthrough the nucleus was measured as the average of twoperpendicular diameter measurements of the longest (d1)and shortest (d2) axes. From this, the oocyte size fre-quency and average oocyte size calculated for eachfemale at each month. In addition, for each month, alloocyte size measurements were pooled to obtain thesize-frequency distribution. All measurements were madeusing the software ImageJ (NIH, USA). For each section,the average free oocyte density (per mm2 of gonadtissue) was estimated for each slide.
Environmental measurements
SST and salinity at each site was collected using aHORIBA U-50 multi-parameter water quality checker(HORIBA, Ltd) at each sampling time in 2011 and2012. Regional SST was derived from the monthly
Figure 1. Location of study sites at Oreti Beach, Southland for 2011 (Site B (46.4790°S, 168.2522°E)) and 2012 (Sites A(46.4943°S, 168.2604°E), B (46.4790°S, 168.2522°E), C (46.3935°S, 168.1970°E), and D (46.3701°S, 168.1673°E).
Invertebrate Reproduction & Development 3
Dow
nloa
ded
by [
203.
109.
163.
22]
at 1
8:58
10
Mar
ch 2
015

Figure 2. Histological sections of female and male Paphies ventricosa gonads. Females stages: EA (A); LA (B); ripe (C), and; par-tially spawned/spent (D). (Aw = Alveoli wall; Pg = protogonia; PO = pre-vitellogenic oocyte; VO = vitellogenic oocyte; Lm = lumen)Males stages: EA (E); LA (F); ripe (G), and; partially spawned/spent (H). (Aw = Alveoli wall; Sg = Spermatogonia; Sd = Spermatid;S = Spermatozoa; Ct = connective tissue; Lm = lumen). See Table 1 for detailed explanations of female and male reproductive stages.Scale bars = 100 μm.
4 K. Gadomski and M. Lamare
Dow
nloa
ded
by [
203.
109.
163.
22]
at 1
8:58
10
Mar
ch 2
015

composite Aqua MODIS SST (11 μ daytime) 9 km data-set (www.oceancolor.gsfc.nasa.gov). Regional averageswere calculated from the same 6 by 6 pixel area for eachmonth, stretching from Colac Bay to Bluff, Southlandand fully encompassing the study area, by determining
water pixel values using the provided scale. Site-specificcalculated chlorophyll-a data were compared to regionalsatellite derived chlorophyll-a concentrations from the
Table 1. Description of four reproductive stages assigned to female and male Paphies ventricosa gonad sections. Abbreviations referto Figure 2.
Stage Females Males
Early active The alveoli walls (Aw) are thick and containnumerous protogonia (Pg). Many pre-vitellogenicoocytes (PO) are present, attached to the aveoliwalls by broad cytoplasmic bases. Freevitellogenic oocytes (VO) may remain in thelumen (Lm) from the last ripe cycle
The alveoli walls (Aw) are thin and have a layer ofspermatogonia (Sg). Spermatids (Sd) fill the lumen(Lm). A few spermatozoa (S) still remain in manylumen centres
Late active The alveoli walls (Aw) are less dense. Vitellogenicoocytes are larger and quite numerous. Remainingbasal attachments are much thinner in pre-vitellogenic oocytes (PO)
The alveoli walls (Aw) are lined withspermatogonia (Sg). Roughly one-third of thelumen (Lm) is filled with spermatids (Sd). Lumencentres are loosely packed with radiating bands ofspermatozoa (S). Little lumen is visible
Ripe The alveoli walls (Aw) are thin and may containprotogonia. Vitellogenic oocytes (VO) are at theirlargest and fill the lumen of mostly follicles. Pre-vitellogenic oocytes (PO) are few and are broadlyattached to the alveoli walls
The lumen (Lm) is mostly filled with denselypacked spermatozoa (S). A thin layer of spermatids(Sd) fill the rest of the lumen space
Partially spawned/spent The alveoli walls (Aw) are thin and contracted,with some partially ruptured. Some pre-vitellogenic oocytes (PO) remain attached to thealveoli walls. Few vitellogenic oocytes (VO) mayremain in the lumen (Lm)
The alveoli walls (Aw) may be slightly contracted;have a few spermatogonia (Sg); and have amarbled appearance. Spermatids form a thin layeraround the outer edges of the lumen (Lm).Remaining spermatozoa (S) are distributedthroughout the lumen (Lm) in loosely packedgroups
Figure 3. Changes in male (- - - - -) and female (…..) CI, andthe index for sexes pooled (•) for Paphies ventricosa fromOreti Beach, New Zealand, between January 2011 and Decem-ber 2011. Standard errors are given for the CI of pooled data,but error bars for the individual sexes are omitted for clarity.Significant differences in the pooled CI among months are indi-cated by lower case lettering.
Figure 4. Average CI (±SE) for Paphies ventricosa at foursites along Oreti Beach, New Zealand, during four months in2012. Significant differences in the pooled CI among siteswithin each month are indicated by lower case lettering.
Invertebrate Reproduction & Development 5
Dow
nloa
ded
by [
203.
109.
163.
22]
at 1
8:58
10
Mar
ch 2
015
monthly composite Aqua MODIS chlorophyll-a concen-tration 9 km dataset (www.oceancolor.gsfc.nasa.gov) inboth 2011 and 2012. Regional averages were calculatedas mentioned above for SST. Day length was obtainedfor the 15th day of each collection month, and tidal rangewas determined using Land Information New Zealandtide prediction charts for Bluff, New Zealand.
Statistical analyses
The sex ratio of P. ventricosa at the four samplingsites (months pooled) and for all samples pooled wastested using the X2-test. Statistical differences (∂ = 5%)in CI (arcsine square-root transformed) between sexesand among months were tested using a two-wayANOVA, whilst the average oocyte/ova size (ln (x)transformed) and abundance (ln (x) transformed)
among months in 2011 were tested using a one-wayANOVA, with significant pairwise differences betweenmonths identified using a Tukey’s post hoc test. Dueto heterogeneity of variances, a Welch’s test was usedto assess statistical differences in the average oocyte/ova size among months in 2011. Differences in the CIand oocyte density among sites and months in 2012were tested using two-way ANOVA, and where asignificant interaction between the two factorsoccurred, differences among months within each sitewere tested using a one-way ANOVA. All transformeddata were tested for normality visually via normalquantile–quantile plots and homoscedasticity was con-firmed by Levene’s test. All statistical analyses werecarried out using the JMP 10.0 statistical package(SAS Institute).
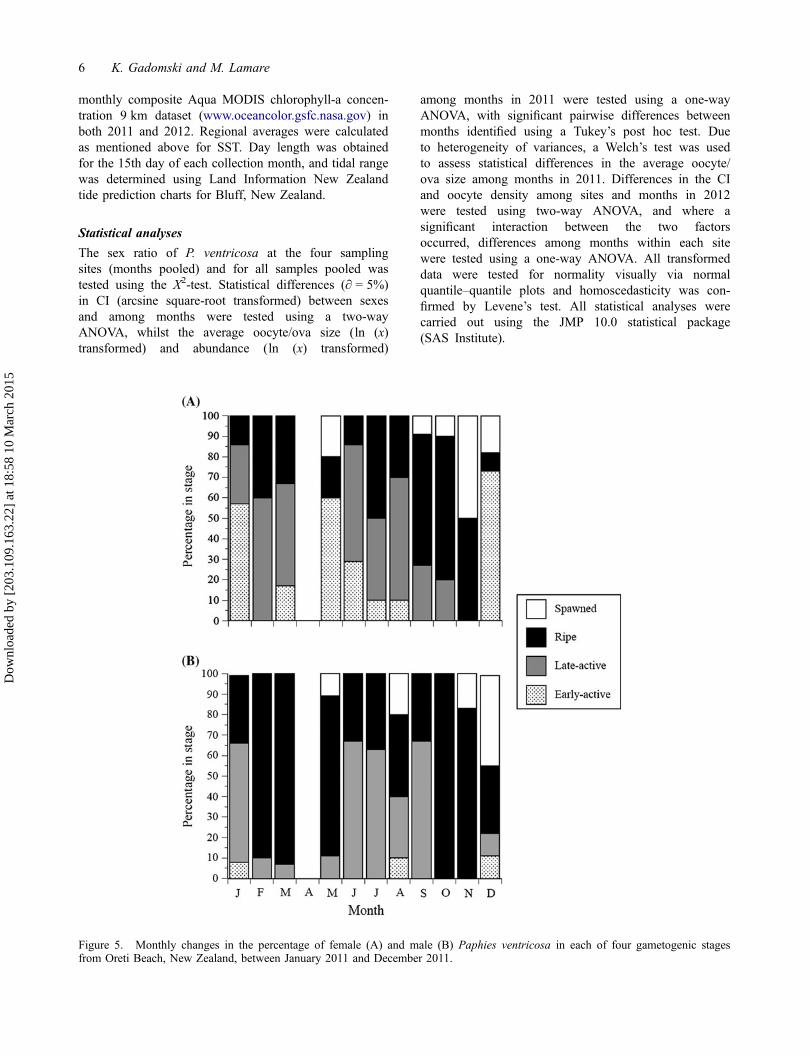
Figure 5. Monthly changes in the percentage of female (A) and male (B) Paphies ventricosa in each of four gametogenic stagesfrom Oreti Beach, New Zealand, between January 2011 and December 2011.
6 K. Gadomski and M. Lamare
Dow
nloa
ded
by [
203.
109.
163.
22]
at 1
8:58
10
Mar
ch 2
015

Results
Sex ratio
The ratio of males and females sampled over 2011 atSite B (103 Male: 93 Females) was not significantlydifferent (X2 = 0.5102, p = 0.4751) from 1:1
(Supplementary Table 1). Similarly, there was no signifi-cant difference in the male:female ratio for the four sam-ple sites in 2012 (Supplementary Table 1), or when allfours sites are pooled despite a bias towards males (304Male: 264 females).
Figure 6. The percentage of female (left column) and male (right column) Paphies ventricosa in each gametogenic stage from foursites along Oreti Beach, New Zealand, at four months in 2012.
Invertebrate Reproduction & Development 7
Dow
nloa
ded
by [
203.
109.
163.
22]
at 1
8:58
10
Mar
ch 2
015

Condition indices
The average monthly CI during 2011 ranged from 41.6to 73.7% for males and 43.9% to 72.6% for females(Figure 3). Two-way ANOVA indicated that there wasno significant difference in the CI between sexes (F(1,
194) = 1.125, p = 0.291) across all months (Sex ×Month, F(10, 194) = 1.052, p = 0.402). When sexes werepooled, there was a significant difference in the CI
among months (F(10, 194) = 9.4460, p < 0.001), with aTukey’s post hoc comparison of means indicating thatthe CI in January (42.9%) and December (43.1%) weresignificantly lower than all other months (Figure 3).The greatest CI occurred in October (73.2%), althoughthe difference in the CI from May to October wasgenerally non-significant.
Figure 7. Monthly oocyte size-frequency distributions for Paphies ventricosa from Oreti Beach, New Zealand, between January2011 and December 2011. n = number of females sampled /number of oocytes measured on each sampling date.
8 K. Gadomski and M. Lamare
Dow
nloa
ded
by [
203.
109.
163.
22]
at 1
8:58
10
Mar
ch 2
015

The CI for P. ventricosa collected during 2012(Figure 4) varied significantly among sites (F(3, 288) =20.989, p < 0.001), although the effects of site dependedon the month of collection (F(9, 288) = 7.582, p < 0.001).In this respect, there was no significant difference amongsites in September (F(3, 79) = 2.527, p = 0.063) andDecember (F(3, 78) = 1.271, p = 0.291), with the CI rang-ing between 32.2 and 45.6% during these times. The CIwas greater in March and June, ranging between 47.0and 75.1%, and was significantly lower at Site A thanSite D in both March (F(3, 52) = 13.853, p < 0.001) andJune (F(3, 72) = 16.22, p < 0.001).
Gametogenic cycle
For females, histological examination of oogenic stagesover a 1-year period in 2011 (Figure 5(A)) indicated thatripe females occurred in all months (ranging from 9 to
70% of the sample), but were most common in Septemberand October (64 and 70%, respectively). There was asmaller proportion of ripe females in February (40%),which was followed by a decrease in the proportion ripeto 14% by June. The proceeding early active and lateactive gametogenic stages were most abundant in themonths between the ripe maxima, making up to 86% (EAand LA pooled) in June and 73% in December. Spawnedfemales were present in May (20%), but were mostcommon from September to December, making up 50%of the females in November. For males, histologicalexamination of spermatogenic stages over a 1-year period(Figure 5(B)) indicated a clearer pattern in the abundanceof ripe individuals, with peaks in February/March (90and 93%, respectively) and through October andNovember (100 and 83%, respectively). Early active andlate active stages were predominant in the remainingmonths, whilst spawned males were present in May and
Figure 8. (A) Average oocyte/ova size (±SE) and (B) Average oocyte density (±SE) at monthly intervals for Paphies ventricosafrom Oreti Beach, New Zealand, between January 2011 and December 2011. The sample size for each month is given in Figure 6.For both figures, significant differences in the oocyte measurements among months are indicated by lower case lettering.
Invertebrate Reproduction & Development 9
Dow
nloa
ded
by [
203.
109.
163.
22]
at 1
8:58
10
Mar
ch 2
015
August, but most common in December when they madeup 44% of males.
Spatial variation in the gametogenic stages wasexamined at four sites along Oreti Beach for four monthsin 2012 (Figure 6). There was a substantial amount ofvariation among sites for both sexes, particularly inMarch and December, the time likely to be near or fol-lowing spawning, and suggests a degree of spawningvariability along Oreti Beach. For both sexes, a greaterdegree of gametogenic synchrony was evident amongsites in June and September, although there was a ten-dency for individuals to be more advanced gametogeni-cally with increasing distance north (i.e. from site A tosite D). This is reflected in typically a greater proportionof ripe and late active stages, and fewer spawned indi-viduals at site D in most months.
Oocyte/ova size frequencies
Oocyte and ova size-frequency distributions over the2011 sampling period (Figure 7) were unimodal, andtypically right-skewed. During the months of January toMarch, the distributions were relatively stable in shapealthough there was a progression of the distribution intobigger size classes. A clear change in size-frequencyoccurred in May with a broader distribution (≈12–60 μm), and a reduction in the abundance of largeroocytes and ova. From June to August, there was aprogressive change from a smaller and right-skewed sizedistribution to a larger and broader size range by
September. In the following three months, the distribu-tions decreased in size and breadth, with few oocytes lar-ger than 50 μm by December.
During the 2011 period, the average oocyte size var-ied significantly (Welch’s test, F(10, 1479.5) = 66.26,p < 0.001) among months (Figure 8(A)), with two dis-tinct peaks in average size, the first in January/March(37.8–38.8 μm) and a second in September (36.3 μm).The smallest average oocyte sizes occurred during thewinter months when oocyte average size was as small as29.3 μm, and in December when oocyte was at a mini-mum (25.8 μm). Tukey’s post hoc tests indicated signifi-cant differences among the months of maximum oocytediameter with those of minimum sizes (Figure 8(A)).
Oocyte density
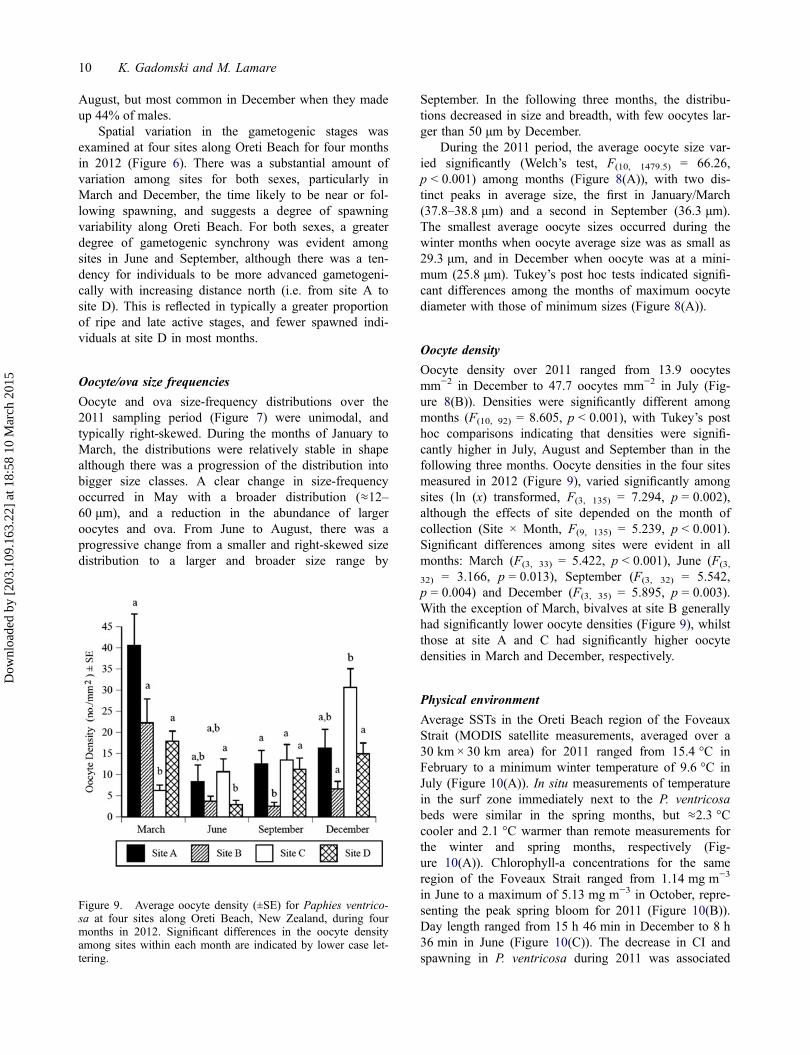
Oocyte density over 2011 ranged from 13.9 oocytesmm−2 in December to 47.7 oocytes mm−2 in July (Fig-ure 8(B)). Densities were significantly different amongmonths (F(10, 92) = 8.605, p < 0.001), with Tukey’s posthoc comparisons indicating that densities were signifi-cantly higher in July, August and September than in thefollowing three months. Oocyte densities in the four sitesmeasured in 2012 (Figure 9), varied significantly amongsites (ln (x) transformed, F(3, 135) = 7.294, p = 0.002),although the effects of site depended on the month ofcollection (Site × Month, F(9, 135) = 5.239, p < 0.001).Significant differences among sites were evident in allmonths: March (F(3, 33) = 5.422, p < 0.001), June (F(3,
32) = 3.166, p = 0.013), September (F(3, 32) = 5.542,p = 0.004) and December (F(3, 35) = 5.895, p = 0.003).With the exception of March, bivalves at site B generallyhad significantly lower oocyte densities (Figure 9), whilstthose at site A and C had significantly higher oocytedensities in March and December, respectively.
Physical environment
Average SSTs in the Oreti Beach region of the FoveauxStrait (MODIS satellite measurements, averaged over a30 km × 30 km area) for 2011 ranged from 15.4 °C inFebruary to a minimum winter temperature of 9.6 °C inJuly (Figure 10(A)). In situ measurements of temperaturein the surf zone immediately next to the P. ventricosabeds were similar in the spring months, but ≈2.3 °Ccooler and 2.1 °C warmer than remote measurements forthe winter and spring months, respectively (Fig-ure 10(A)). Chlorophyll-a concentrations for the sameregion of the Foveaux Strait ranged from 1.14 mg m−3
in June to a maximum of 5.13 mg m−3 in October, repre-senting the peak spring bloom for 2011 (Figure 10(B)).Day length ranged from 15 h 46 min in December to 8 h36 min in June (Figure 10(C)). The decrease in CI andspawning in P. ventricosa during 2011 was associated
Figure 9. Average oocyte density (±SE) for Paphies ventrico-sa at four sites along Oreti Beach, New Zealand, during fourmonths in 2012. Significant differences in the oocyte densityamong sites within each month are indicated by lower case let-tering.
10 K. Gadomski and M. Lamare
Dow
nloa
ded
by [
203.
109.
163.
22]
at 1
8:58
10
Mar
ch 2
015
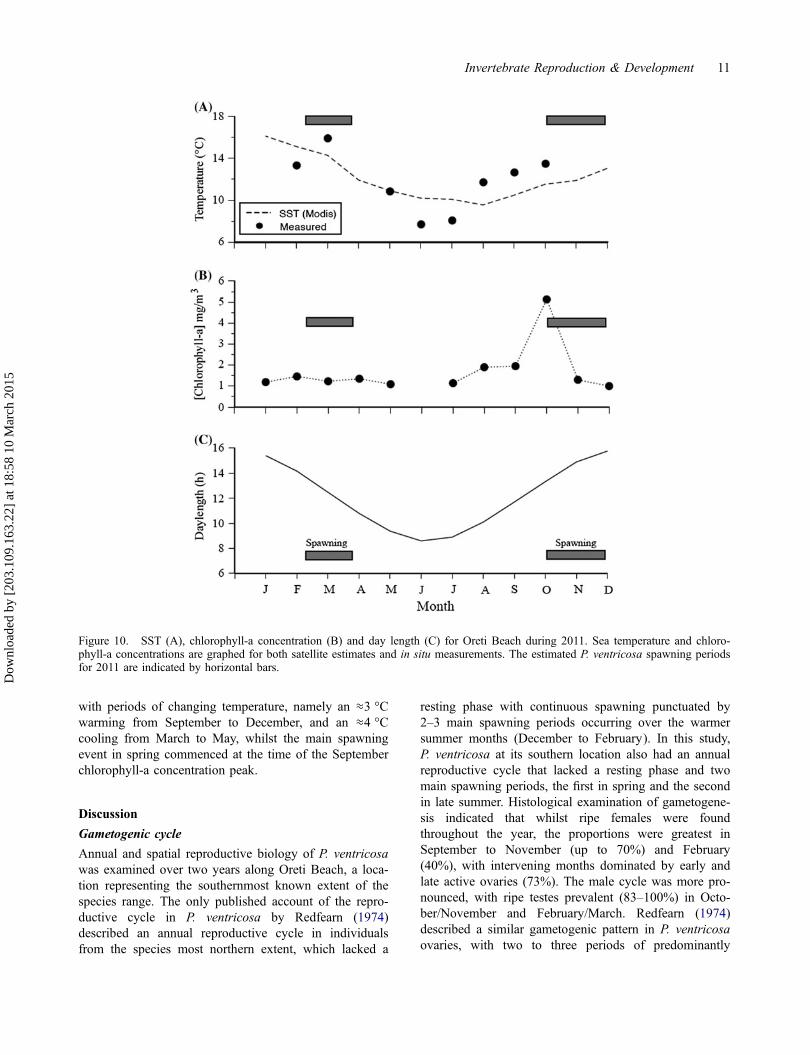
with periods of changing temperature, namely an ≈3 °Cwarming from September to December, and an ≈4 °Ccooling from March to May, whilst the main spawningevent in spring commenced at the time of the Septemberchlorophyll-a concentration peak.
Discussion
Gametogenic cycle
Annual and spatial reproductive biology of P. ventricosawas examined over two years along Oreti Beach, a loca-tion representing the southernmost known extent of thespecies range. The only published account of the repro-ductive cycle in P. ventricosa by Redfearn (1974)described an annual reproductive cycle in individualsfrom the species most northern extent, which lacked a
resting phase with continuous spawning punctuated by2–3 main spawning periods occurring over the warmersummer months (December to February). In this study,P. ventricosa at its southern location also had an annualreproductive cycle that lacked a resting phase and twomain spawning periods, the first in spring and the secondin late summer. Histological examination of gametogene-sis indicated that whilst ripe females were foundthroughout the year, the proportions were greatest inSeptember to November (up to 70%) and February(40%), with intervening months dominated by early andlate active ovaries (73%). The male cycle was more pro-nounced, with ripe testes prevalent (83–100%) in Octo-ber/November and February/March. Redfearn (1974)described a similar gametogenic pattern in P. ventricosaovaries, with two to three periods of predominantly
Figure 10. SST (A), chlorophyll-a concentration (B) and day length (C) for Oreti Beach during 2011. Sea temperature and chloro-phyll-a concentrations are graphed for both satellite estimates and in situ measurements. The estimated P. ventricosa spawning periodsfor 2011 are indicated by horizontal bars.
Invertebrate Reproduction & Development 11
Dow
nloa
ded
by [
203.
109.
163.
22]
at 1
8:58
10
Mar
ch 2
015
mature stages over the spring to late-summer period, sep-arated by actively growing ovaries with no resting periodduring the annual cycle. In contrast to the present study,Redfearn (1974) observed spawned individuals through-out the year, whilst the Oreti Beach population lackedspawned individuals in the winter and mid-summermonths.
An extended spawning period that involves an inter-vening resting or active period is often observed inbivalve species (Sastry 1979), including other Mesode-smatids such as M. mactroides (Herrmann et al. 2009).Within the wider Paphies genus, gametogenesis also fol-lows an annual cycle, with spawning occurring over thesummer periods for P. donacina (Marsden 1999), P. aus-tralis (Hooker & Creese 1995) and P. subtriangulata(Grant & Creese 1995). As for P. ventricosa, the lattertwo species have no resting phase during gametogenesis,and for P. subtriangulata spawning occurring in springand late-autumn with a mid-summer active period. P. do-nacina may also undergo more than one gametogeniccycle annually. However in contrast to other Paphiesspecies, it has an inactive resting phase during winter.
Monthly changes in the oocyte size frequency distri-butions and associated average oocyte size and densityfurther support the suggestion that female P. ventricosaundergo a major spawning in spring, followed by activeoocyte development leading to a second spawning inlate-summer. The unimodal oocyte distributions inP. ventricosa are commonly observed in bivalves(Herrmann et al. 2009), with the broad oocyte size rangeobserved throughout the year reflecting gametogenicprocesses where active and mature females are presentthroughout the year. The distinct loss of larger oocytesand reduction in oocyte density in the spring and autumnmonths reflected two spawning episodes.
Condition index
A CI has been applied to a range of bivalve species todescribe reproductive cycles, including mesodesmatidswhere the gonad and visceral tissue are closely associ-ated (Herrmann et al. 2009). For P. ventricosa, the CIvaried seasonally, with a ≈50% decrease in the index inspring, consistent with the major spawning event seen inthe Oreti Beach population. The decrease in CI in late-summer when spawning occurred was less clear and notsignificant. Redfearn (1974) calculated the CI (deter-mined by volume) in P. ventricosa over one year, andcorrelated decreases in CI with spawning in spring andlate-summer. The application of the index to other me-sodesmatids has been less informative. For example,both Marsden (1999) and Herrmann et al. (2009) showedthe CI cycled annually in P. donacina and M. mactro-ides, respectively, but neither study could consistentlycorrelate changes in the CI with gametogenic changes
associated with spawning events. Marsden (1999) notedthat the poor correlation would result from simultaneouschanges in somatic tissue, shell and gonad tissue over areproductive cycle.
Spatial and temporal variation
Whilst the annual reproductive cycle of P. ventricosashowed a clear annual pattern, there was a degree of spa-tial variation among the four sites separated by 15 km.The variation was mostly owing to variation during themonths associated with spawning, March and December,with individuals at the southern end of the beach (site A)more advanced gametogenically, having the higheroocyte densities earlier, and a lower CI in March andJune following spawning. This suggests that whilstannual cycles are broadly similar among sites, there maybe a degree spawning asynchrony along Oreti Beach.Spatial differences in bivalve reproduction at relativelysmall scales can be marked (Gosling 2004). Pecten maxi-mus populations around coastal Isle of Man, for exam-ple, showed significant variation in gonad condition,fecundity and spawning onset at small horizontal scalesof < 5 km (Hold et al. 2013), whilst intertidal bivalvescan vary reproductively across tidal heights within apopulation (Harvey & Vincent 1989; Azouzi et al.2002).
Latitudinal differences in reproduction can also bepronounced. Examples are found in a range of bivalvespecies (Sastry 1979), including Mesodesmatidae, inwhich Uribe et al. (2012) noted significant reproductiveasynchrony in populations of M. donacium along the4000-km long Humboldt Current upwelling ecosystem.P. ventricosa spans 12° of latitude (1350 km), and whilstthe cycles are broadly similar, the reproductive cycles ofP. ventricosa appear more pronounced in the southernpopulation compared with those at its northern extent(Redfearn 1974). This is best demonstrated by the pres-ence of spawned individuals all year round in the north,whilst spawned individuals were absent from winter andlate-summer months in the southern P. ventricosa popu-lation. Other Paphies species show a similar pattern ofspatial variation, with differences in spawning period inP. subtriangulata (Grant & Creese 1995) and P. australis(Hooker & Creese 1995) observed among locations.
Spatial differences in gametogenesis in bivalves arethe result of the interaction of environmental factors,which includes primarily sea temperature and food sup-ply, as well as photoperiod and lunar cycles (Sastry1979), whilst spawning episodes have been mainly asso-ciated with temperature changes, salinity and light(Sastry 1979; Gosling 2004). Temperature is undoubtedlyinfluential in mesodesmatid species inhabiting seasonalenvironments. Hermann et al. (2009) correlated thereproductive cycle of M. mactroides with seasonal
12 K. Gadomski and M. Lamare
Dow
nloa
ded
by [
203.
109.
163.
22]
at 1
8:58
10
Mar
ch 2
015

changes in sea temperatures which ranged from 11 to23 °C annually; Manzi et al. (1985) reported temperatureinfluenced the gametogenic cycle in Mercenaria merce-naria; and Peredo et al. (1987) discussed sea temperaturevariation and annual reproduction in M. donacium. Inthis study, P. ventricosa spawning was associated withperiods of changing sea temperature, namely an ≈3 °Cwarming from September to December, and a 4 °C cool-ing from March to May. Redfearn (1974) discussedreproductive events associated with temperature changes,noting spawning probably occurred in December/Januaryfollowing a period of gonad maturation over July toNovember when sea temperatures increased from 14 to20 °C, with a second spawning following the 22 °C sum-mer temperature maxima.
Temperature variation may also play a role in latitu-dinal variation in reproduction in P. ventricosa althoughit is interesting that the annual variation in temperatureat both locations (8 °C) is similar, despite the southernpopulation having a shorter and more defined spawningperiod. Latitudinal variation in the reproductive cycles ofNew Zealand bivalves has been related to sea tempera-ture. Gribben et al. (2004) concluding that the durationof gametogenesis and spawning period in two popula-tions of the New Zealand Geoduck, P. zelandica sepa-rated by ≈5° of latitude was related to seasonal changesin sea temperature, with spring spawning occurring whentemperature reached 15 °C in both populations. For Pa-phies species, cold temperatures have been shown todelay gametogenesis in P. donacina (Marsden 1999), andGrant and Creese (1995) suggested that the minimumtemperature threshold for spawning in P. subtriangulatawas 15 °C. It is conceivable, therefore, that the coldertemperatures in the southern population during June toSeptember (≈10 °C) suppress spawning in the speciesduring the winter period. Such cold temperatures are notexperienced by the northern population, with tempera-tures remaining above 14 °C throughout the year, duringwhich spawning is continuous.
It is also possible that other environmental factorsinfluence reproductive periodicity in P. ventricosa.Indeed, for M. donacium, latitudinal variation in repro-ductive cycles has been attributed to a range of factorsin addition to temperature, including localised upwellingand changes in salinity and runoff (Uribe et al. 2012).Few studies have considered the effects of day length onreproductive cycles in bivalves as it is often difficult toseparate from seasonal temperature changes (Gosling2004), but it is worth noting that seasonal changes inday length are more pronounced at the southern location(from 8 h 34 min to 15 h 50 min, seasonally) comparedwith the north (from 9 h 34 min to 14 h 36 min, season-ally). Furthermore, seasonal changes in chlorophyll-aconcentrations, which tend to be more variable at higherlatitudes, have been linked to seasonal reproduction in
bivalves (Sastry 1979; Gosling 2004), and specifically inmesodesmatids (Peredo et al. 1987; Hermann et al.2009). Seasonal variations in chlorophyll-a concentrationare greater in southern New Zealand (Murphy et al.2001), which ranged from 0.2 to 0.6 mg chl-a m−3 innorthern offshore regions compared with 0.3 to > 1.0 mgchl-a m−3 in southern waters offshore of Oreti Beach.We also noted a chlorophyll-a concentration spike(>5 mg chl-a m−3) during October, coinciding with themain spawning of P. ventricosa. It is possible, therefore,that the more pronounced reproductive cycles in thesouthern population reflect greater seasonality when arange of environmental variables are considered.
For other New Zealand Paphies species, Marsden(1999) concluded that P. donacina reproduction was pro-moted by warmer summer temperatures, with high foodconcentrations potentially extending gonad development.Grant and Creese (1995) suggested that warmer tempera-tures promoted spawning both seasonally and tidally, andHooker and Creese (1995) noted spawning during springcoincided with short-term temperature fluctuation. Thesmall-scale spatial variations in spawning that weobserved along Oreti Beach are unlikely due to tempera-ture variation, but may be associated with gradients infood supply. Densities of P. ventricosa vary significantlyalong Oreti Beach (Beentjes 2010) and are greatest atthe sites A and B in the present study. P. ventricosa dis-tribution is thought to be controlled by phytoplanktonabundances (Redfearn 1974), and the high density atsites A and B have been attributed to enhanced foodsupply from the adjacent New River Estuary (Beentjes2010, Figure 1). It is likely that the animals at these sitesare nutritionally advantaged and therefore completegametogenesis and spawning earlier. This suggestionwould be consistent with observations in bivalves thatintra-specific variation in reproductive cycles can berelated to small-scale food supply patterns (Hold et al.2013). Salinity fluctuations can also induce spawning inbivalves (Sastry 1979), and it is equally plausible indi-viduals at sites A and B experience fluctuations in salin-ity associated with freshwater output from the estuarythat could induce spawning episodes.
Conclusions
P. ventricosa has experienced dramatic declines in popu-lation sizes over the past century (Greenway 1972;Beentjes et al. 2006), and the conservation and manage-ment of the species require an understanding of thereproductive biology of the species across a range ofspatial scales. This study is the first to show that whilstreproductive cycles are broadly similar in the speciesacross its latitudinal extent, southern populations have amore defined spawning period that may be associatedwith greater environmental seasonality. Smaller-scale
Invertebrate Reproduction & Development 13
Dow
nloa
ded
by [
203.
109.
163.
22]
at 1
8:58
10
Mar
ch 2
015

variation in reproduction was also evident within theOreti Beach population and may be an important consid-eration in identifying areas for conserving source popula-tions (Gaines et al. 2010).
AcknowledgementsThe authors would like to thank kaitiaki Michael Skerrett ofthe Murihiku Marae for providing access to the Oreti popula-tion, Matthew Downes for histology advice, and ProfessorHenrik Moller and Dr Michael Beentjes for assistance with theresearch. Additional thanks to staff at Environment Southlandfor field support and the technicians at the Portobello MarineLaboratory (PML) who helped with sample preparation.Finally, the comments of two anonymous reviewers greatlyimproved the manuscript.
Supplemental dataSupplemental data for this article can be accessed here. http://dx.doi.org/10.1080/07924259.2015.1007216.
ReferencesAzouzi L, Bourget E, Borcard D. 2002. Spatial variation in the
intertidal bivalve Macoma balthica: biotic variables in rela-tion to density and abiotic factors. Marine Ecology Pro-gress Series. 234:159–170.
Baron J. 1992. Reproductive cycles of the bivalve molluscsAtactodea striata (Gmelin), Gafrarium tumidum Rödingand Anadara scapha (L.) in New Caledonia. AustralianJournal of Marine and Freshwater Research. 43:393–402.
Beentjes MP. 2010. Toheroa survey of Oreti Beach, 2009, andreview of historical surveys. New Zealand FisheriesAssessment Report 2010/6. Wellington; 40p.
Beentjes MP, Carbines GD, Willsman AP. 2006. Effects ofbeach erosion on abundance and distribution of toheroa(Paphies ventricosa) at Bluecliffs Beach, Southland, NewZealand. Journal of Marine and Freshwater Research.40:439–453.
Beentjes MP, Gilbert DJ. 2006. Oreti Beach toheroa survey:yield per recruit and review of historical surveys. New Zea-land Fisheries Assessment Report. 2006/36. Wellington;47p.
Brunton PM. 1978. Toheroa predation by black-backed gulls onDargaville Beach, North Auckland, New Zealand. Notornis.25:128–140.
Cassie RM. 1955. Population studies on the Toheroa, Amphi-desma ventricosum Gray (Eulamellibranchiata). AustralianJournal of Marine and Freshwater Research. 6:348–391.
Gaines SD, White C, Carr MH, Palumbi SR. 2010. Designingmarine reserve networks for both conservation and fisheriesmanagement. Proceedings of the National Academy of Sci-ence. 107:18286–18293.
Gaspar M, Ferriera R, Monteiro CC. 1999. Growth and repro-ductive cycle of Donax trunculus L., (Mollusca: Bivalvia)off Faro, southern Portugal. Fisheries Research. 41:309–316.
Gosling EM. 2004. Bivalve molluscs: biology, ecology, culture.Oxford: Fishing News Books, 443p.
Grant CM, Creese RG. 1995. The reproductive cycle of thetuatua-Paphies subtriangulata (Wood, 1828), in NewZealand. Journal of Shellfish Research. 14:287–292.
Greenway JPC. 1972. Further data from population surveys ontoheroa (Mollusca: Eulamellibranchiata) on Northland bea-ches, 1962–1971. New Zealand Marine Department Fisher-ies Technical Report. 85. Wellington; 36p.
Gribben PE. 2005. Gametogenic development and spawningof the razor clam, Zenatia acinaces in northeastern NewZealand. New Zealand Journal of Marine and FreshwaterResearch. 39:1287–1296.
Gribben PE, Creese RG, Hooker SH. 2001. The reproductivecycle of the New Zealand venus clam Ruditapes largillierti.Journal of Shellfish Research. 20:1101–1108.
Gribben PE, Helson J, Jeffs AG. 2004. Reproductive cycle ofthe New Zealand Geoduck, Panopea zelandica, in twoNorth Island populations. Veliger. 47:53–65.
Harvey M, Vincent B. 1989. Spatial and temporal variations ofthe reproductive cycle and energy allocation of the bivalveMacoma balthica (L.) on a tidal flat. Journal of Experimen-tal Marine Biology and Ecology. 129:199–217.
Herrmann M, Alfaya JEF, Lepore ML, Penchaszadeh PE, Lau-dien J. 2009. Reproductive cycle and gonad developmentof the Northern Argentinean Mesodesma mactroides (Bival-via: Mesodesmatidae). Helgoland Marine Research.63:207–218.
Hoby KE. 1933. The anatomy of Amphidesma ventricosum(Gray) [MSc Thesis]. Wellington: Victoria University ofWellington. 116p.
Hold N, Murray LG, Hinz H, Neill SP, Lass S, Lo M, KaiserMJ. 2013. Environmental drivers of small scale spatial vari-ation in the reproductive schedule of a commerciallyimportant bivalve mollusc. Marine EnvironmentalResearch. 92:144–153.
Hooker SH, Creese RG. 1995. The reproductive biology ofpipi, Paphies australis (Gmelin, 1790) (Bivalvia: Mesodes-matidae). I. Temporal patterns of the reproductive cycle.Journal of Shellfish Research. 14:7–15.
Kim JH, Son MH, Kang H-W, Lee K-Y. 2013. Reproductivecycle of surf clam, Coecella chinensis (Mesodesmatidae:Bivalvia). Korean Journal of Malacology. 29:113–120.
Mandeno MA. 1999. Gonadal cycle and spawning induction intoheroa (Paphies ventricosa) from Southern New Zealand[MSc Thesis]. Dunedin: University of Otago. 54p.
Manzi JJ, Bobo MY, Burrell VG. 1985. Gametogenesis in apopulation of the hard clam, Mercenaria mercenaria (Lin-naeus) in North Santee Bay, South Carolina. The Veliger.28:186–194.
Marsden ID. 1999. Reproductive cycles of the surf beach clamPaphies donacina (Spengler, 1793) from New Zealand.Journal of Shellfish Research. 18:539–546.
Morrison M, Parkinson D. 2008. Distribution and abundance oftoheroa (Paphies ventricosa) on Ninety Mile Beach, 2006.New Zealand Fisheries Assessment Report. 2008/26.Wellington; 27p.
Murphy RJ, Pinkerton MH, Richardson KM, Bradford-GrieveJM, Boyd PW. 2001. Phytoplankton distributions aroundNew Zealand derived from SeaWiFS remotely-sensedocean colour data. New Zealand Journal of Marine andFreshwater Research. 35:343–362.
Newell RIE, Bayne BL. 1980. Seasonal changes in the physiol-ogy, reproductive condition and carbohydrate content of thecockle Caridum (= Cerastoderma) edule (Bivalvia: Cardii-dae). Marine Biology. 56:11–19.
Peredo S, Parada E, Valdebenito I. 1987. Gametogenesis andreproductive cycle of the clam Mesodesma donacium(Lamarck, 1818) (Bivalvia: Mesodesmatidae) at QueleBeach, Southern Chile. The Veliger. 31:55–68.
14 K. Gadomski and M. Lamare
Dow
nloa
ded
by [
203.
109.
163.
22]
at 1
8:58
10
Mar
ch 2
015

Rapson AM. 1952. The toheroa, Amphidesma ventricosum Gray(Eulamellibranchiata), development and growth. AustralianJournal of Marine and Freshwater Research. 3:170–198.
Rapson AM. 1954. Feeding and control of the toheroa (Amphi-desma ventricosum Gray) (Eulamellibranchiata) populationsin New Zealand. Australian Journal of Marine andFreshwater Research. 5:486–512.
Redfearn P. 1974. Biology and distribution of the toheroa, Pa-phies (Mesodesma) ventricosa (Gray). Fisheries ResearchBulletin. 11:51p.
Riascos JM, Carstensen D, Laudien J, Arntz WE, Oliva ME,Güntner A, Heilmaer O. 2009. Thriving and declining:climate variability shaping life-history and populationpersistence of Mesodesma donacium in the HumboldtUpwelling System. Marine Ecology Progress Series.385:151–163.
Roberts D. 1984. A comparative study of Lasaea australis,Vulsella spongiarum, Pinna bicolor and Donacilla cuneata(mollusca; bivalvia) from Princess Royal Harbour, WesternAustralia. Journal of Molluscan Studies. 50:129–136.
Ropes JW. 1968. Reproductive cycle of the surf clam, Spisulasolidissima, in offshore New Jersey. Biological Bulletin.135:349–365.
Ruiz C, Martinez D, Mosquera G, Abad M, Sanchez J. 1992.Seasonal variations in condition, reproductive activityand biochemical composition of the flat oyster, Ostreaedulis, from San Cibran (Galacia, Spain). Marine Biology.112:67–74.
Sastry, AN. 1979. Pelecypoda (Excluding Ostreidae). In: GieseAC, Pearse JS, editors. Reproduction of marineinvertebrates, Vol 5. Molluscs: Pelecypods and Lesser Clas-ses. New York, NY: Academic Press; p. 113–292.
Smith S. 2003. The reproduction and recruitment of toheroa(Paphies ventricosa) [MSc Thesis]. Auckland: Universityof Auckland. 106p.
Uribe RA, Oliva ME, Aguilar S, Yamashiro C, Riascos JM. 2012.Latitudinal variation in the reproductive cycle of two bivalveswith contrasting biogeographical origin along the HumboldtCurrent Upwelling Ecosystem. Scientia Marina. 76:713–720.
de Villiers G. 1975. Reproduction of the white sand musselDonax serra Röding. South African Sea Fisheries BranchInvestigational Report. 102. Cape Town; 33p.
Williams J, Ferguson H, Tuck I. 2013. Distribution and abun-dance of toheroa (Paphies ventricosa) and tuatua (P. subtri-angulata) at Ninety Mile Beach in 2010 and DargavilleBeach in 2011. New Zealand Fisheries Assessment Report.2013/39. Wellington; 56p.
Wilson BR, Hodgkin EP. 1967. A comparative account of thereproductive cycles of five species of marine mussels (Biv-alvia: Mytilidae) in the vicinity of Fremantle, Western Aus-tralia. Australian Journal of Marine and FreshwaterResearch. 18:175–203.
Zaidman PC, Kroeck MA, Oehrens Kissner EM, Morsan EM.2012. Reproductive pattern of the southern geoduck, Pano-pea abbreviata, at El Sotana (San Matias Gulf, Patagonia,Argentina). Marine Biology Research. 8:172–181.
Invertebrate Reproduction & Development 15
Dow
nloa
ded
by [
203.
109.
163.
22]
at 1
8:58
10
Mar
ch 2
015