SPATIAL VARIABILITY OF HUMIDITY AND TEXTURE IN A … · D. H. S. Souza et al. foi medida utilizando...
12
SPATIAL VARIABILITY OF HUMIDITY AND TEXTURE IN A FLUVITIC NEOSSOL CROPPED WITH IRRIGATED BANANA D. H. S. Souza 1 ; A. A. A. Montenegro 2 , E.F.F Silva 3 ; K. J. Jimenez 4 ; M. R Issac 5 ; J. S. Silva 6 ABSTRACT: Soil water dynamics usually presents spatial dependence in relation to the distribution of particle sizes. Precision agriculture is fundamental for the adequate use of irrigated areas with agricultural production because it allows controlled water applications from the management of spatial variability. The aim of this study was to evaluate spatial variability of the physical-hydraulic properties in an irrigated plot with banana production, located at the Experimental Basin of Rio Ipanema, municipality of Pesqueira, Pernambuco. Soil samples were collected from a 0 - 0.20 m layer and soil moisture was evaluated using a portable probe “Time Domain Reflectometry”, with a regular size 20 x 45 meters grid pattern, in 50 sampling points, 5 meters apart. The data were submitted to a descriptive statistical and geostatistical analysis. Data showed normal distribution using the Kolmogorov-Smirnov test. The semi-variogram model that best fit the analyzed variables was the exponential. KEYWORDS: Spatial dependence, Soil water dynamics, Geostatistics. VARIABILIDADE ESPACIAL DA UMIDADE E TEXTURA DE UM NEOSSOLO FLÚVICO CULTIVADO COM BANANA SOB IRRIGAÇÃO RESUMO: A dinâmica de água no solo geralmente apresenta dependência espacial com a distribuição das frações granulométricas. A agricultura de precisão é fundamental para o manejo adequado de uma área irrigada com produção agrícola, pois permite aplicações controladas de água a partir do gerenciamento da variabilidade espacial. Objetivou-se com esse trabalho avaliar a variabilidade espacial dos atributos físico-hídricos, em um lote irrigado, com produção de bananeiras, na Bacia Experimental do Rio Ipanema, no município de Pesqueira em Pernambuco. A amostragem de solo foi realizada na camada de 0-0,20 m e a umidade do solo 1 Doutorando, UFRPE/DEAGRI/PGEA. Recife – Pernambuco, Brasil. E-mail: [email protected]. 2 Acadêmico, UFRPE/DEAGRI/PGEA. Recife – Pernambuco, Brasil. E-mail: [email protected] 3 Acadêmico, UFRPE/DEAGRI/PGEA. Recife – Pernambuco, Brasil. E-mail: [email protected] 4 Doutoranda, UFRPE/DEAGRI/PGEA. Recife – Pernambuco, Brasil. E-mail: [email protected] 5 Doutorando, UACh/FITOTECNIA/PCH. Chapingo – México, México. E-mail: [email protected] 6 Doutor, Pesquisador PNPD, UFRB/NEAS/PPGEA. Cruz das Almas – Bahia, Brasil. E-mail: [email protected]
Transcript of SPATIAL VARIABILITY OF HUMIDITY AND TEXTURE IN A … · D. H. S. Souza et al. foi medida utilizando...
SPATIAL VARIABILITY OF HUMIDITY AND TEXTURE IN A FLUVITIC
NEOSSOL CROPPED WITH IRRIGATED BANANA
D. H. S. Souza1; A. A. A. Montenegro2, E.F.F Silva3; K. J. Jimenez4; M. R Issac5;
J. S. Silva6
ABSTRACT: Soil water dynamics usually presents spatial dependence in relation to the
distribution of particle sizes. Precision agriculture is fundamental for the adequate use of
irrigated areas with agricultural production because it allows controlled water applications from
the management of spatial variability. The aim of this study was to evaluate spatial variability
of the physical-hydraulic properties in an irrigated plot with banana production, located at the
Experimental Basin of Rio Ipanema, municipality of Pesqueira, Pernambuco. Soil samples were
collected from a 0 - 0.20 m layer and soil moisture was evaluated using a portable probe “Time
Domain Reflectometry”, with a regular size 20 x 45 meters grid pattern, in 50 sampling points,
5 meters apart. The data were submitted to a descriptive statistical and geostatistical analysis.
Data showed normal distribution using the Kolmogorov-Smirnov test. The semi-variogram
model that best fit the analyzed variables was the exponential.
KEYWORDS: Spatial dependence, Soil water dynamics, Geostatistics.
VARIABILIDADE ESPACIAL DA UMIDADE E TEXTURA DE UM NEOSSOLO
FLÚVICO CULTIVADO COM BANANA SOB IRRIGAÇÃO
RESUMO: A dinâmica de água no solo geralmente apresenta dependência espacial com a
distribuição das frações granulométricas. A agricultura de precisão é fundamental para o
manejo adequado de uma área irrigada com produção agrícola, pois permite aplicações
controladas de água a partir do gerenciamento da variabilidade espacial. Objetivou-se com esse
trabalho avaliar a variabilidade espacial dos atributos físico-hídricos, em um lote irrigado, com
produção de bananeiras, na Bacia Experimental do Rio Ipanema, no município de Pesqueira em
Pernambuco. A amostragem de solo foi realizada na camada de 0-0,20 m e a umidade do solo
1 Doutorando, UFRPE/DEAGRI/PGEA. Recife – Pernambuco, Brasil. E-mail: [email protected]. 2 Acadêmico, UFRPE/DEAGRI/PGEA. Recife – Pernambuco, Brasil. E-mail: [email protected] 3 Acadêmico, UFRPE/DEAGRI/PGEA. Recife – Pernambuco, Brasil. E-mail: [email protected] 4 Doutoranda, UFRPE/DEAGRI/PGEA. Recife – Pernambuco, Brasil. E-mail: [email protected] 5 Doutorando, UACh/FITOTECNIA/PCH. Chapingo – México, México. E-mail: [email protected] 6 Doutor, Pesquisador PNPD, UFRB/NEAS/PPGEA. Cruz das Almas – Bahia, Brasil. E-mail: [email protected]

D. H. S. Souza et al.
foi medida utilizando uma sonda portátil “Time Domain Reflectometry”, em uma malha regular
de “grid” 20 x 45 m, em 50 pontos amostrais espaçados 5 m entre si. Os dados foram submetidos
à análise de estatística descritiva e geoestatística. Os dados apresentaram distribuição de
frequência normal pelo teste de Kolmogorov-Smirnov. O modelo de semivariograma que
melhor se ajustou para as variáveis analisadas foi o exponencial.
PALAVRAS-CHAVE: Dependência espacial. Dinâmica de água no solo. Geoestatística.
INTRODUCTION
The monitoring of soil moisture content is not only essential for agriculture, but allows
or controls the water applications based on hydraulic requirements of the soil (Buske et al.,
2013).
The use and adequate soil management contribute to the improvement of water storage
and infiltration capacity (Vieira et al., 2011). In this sense, precision agriculture acts as a tool
that has great potential for improving adequate soil management, having as the main component
the management of spatial and temporal variability of agricultural production (Silva, et al.,
2014).
Hydrological processes such as infiltration and soil moisture redistribution in the soil are
influenced by the physical-hydraulic properties (Silva et al., 2012). Soil moisture is affected by
vegetation as well as by soil texture as described by Baroni et al. (2013). Different production
areas can be revealed by using the spatial variability of irrigation areas, thus, maximizing the
potential of land use (Castione et al., 2015).
Considering the importance of texture and soil moisture for agricultural productivity in
the Brazilian semi-arid region, the aim of this study was to analyze the spatial variability of soil
physical-hydraulic properties at 0 - 0.20 m depth, in an irrigated plot, located at the
Experimental Basin of Rio Ipanema, municipality of Pesqueira, Pernambuco.
MATERIAL AND METHODS
The study was conducted in the municipality of Pesqueira-PE, at Fazenda Mimosa, in the
alluvial valley of Rio Ipanema, wasteland region of Pernambuco, located at coordinates 08°10'
South latitude and 35°11' west longitude, 650 masl. Based on the Köppen climate classification
system, the region has a BSsh climate, defined as an extremely hot semi-arid climate. The

IV INOVAGRI International Meeting, 2017
average annual rainfall is 607 mm (Montenegro & Montenegro, 2006). The predominant soil
of the region is Flossic Neosol (Bastos, 2004).
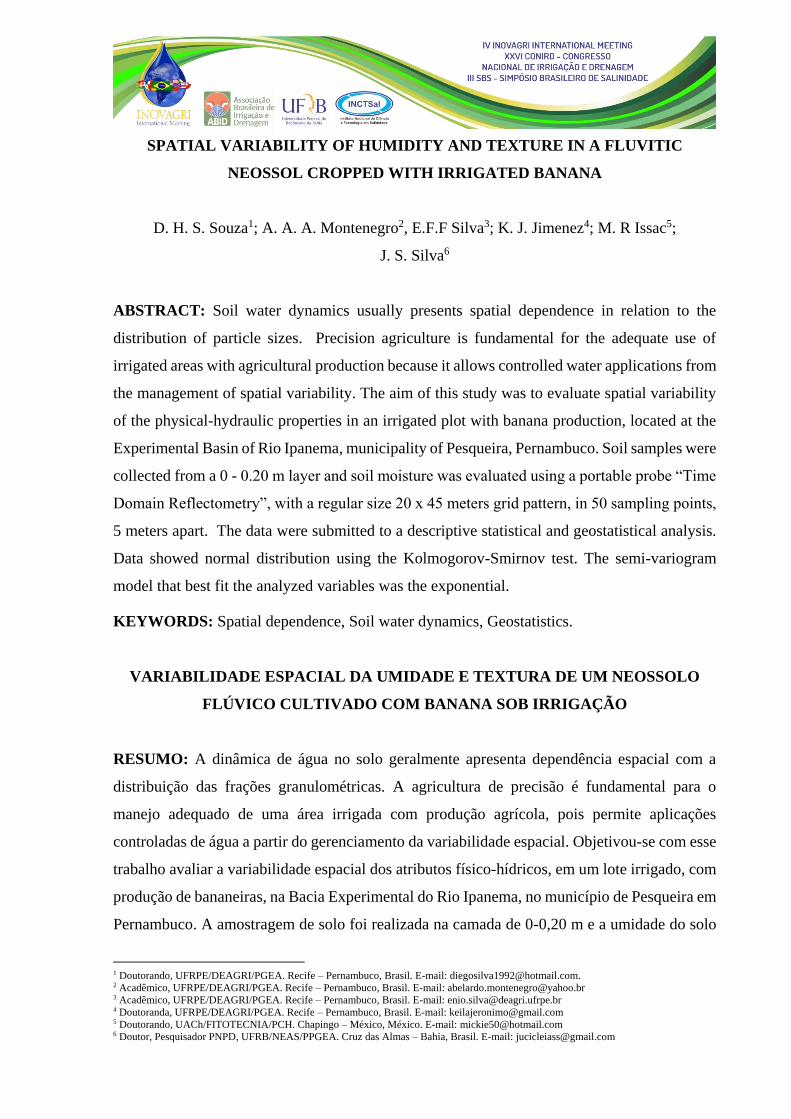
To evaluate the variability of soil physical-hydraulic properties, a 20 x 45 m regular mesh
grid was used, in 50 sample points, spaced 5 m apart, according to the graph shown in Figure
1.
The study was performed on October 27, 28 and 29, 2015. Soil samples were collected at
0-0.20 m depth, at 50 sampling points for texture analysis; also, three measurements were taken
to evaluate the soil-water content using a portable time domain reflectometry (TDR) probe.
The Boyoucos hydrometer method was used to determine the particle sizes of sand, clay,
and silt in the soil, based on the methodology proposed by Embrapa 2011.
Soil moisture monitoring was performed at three different irrigation moments: 12 hours
after irrigation, 4 hours after irrigation and immediately after irrigation. The calibration of the
TDR probe was carried out by adjusting and analyzing mathematical models to the soil moisture
readings obtained by the probe, in relation to the soil gravimetric moisture values determined
in the laboratory (Ávila et al., 2011).
In the banana cultivation areas, drip irrigation system was used, where mulch was applied
as a cultural practice to cover the soil surface using banana leaves. Descriptive statistics, such
as mean, median, standard deviation, coefficient of skewness, coefficient of kurtosis, and
coefficient of variation were used to analyze the data. To identify discrete values (outliers) and
data dispersion, “boxplot” graphs were constructed using statistic software. The hypothesis for
normality was evaluated using the Kolmogorv-Smirnov test, at a significance level of 5%, using
Excel spreadsheet (SOUZA et al., 2008).
The variability of the evaluated characteristics was estimated using the values of the
coefficient of variation, which according to the classification by Warrick & Nielsen (1998),
shows low variability if CV <15%; is moderate when found between 15-50%, and has a high
variability when CV> 50%.
In the study area, the spatial variability was analyzed using geostatistics by means of
semivariogram adjustments described by Vieira (2000). The spatial autocorrelation between the
neighboring points was calculated using semivariance γ(h), where “h” is the distance that
separates the points based on the stationarity hypothesis.
The experimental semivariogram models were obtained in which: the linear, gaussian,
spherical and exponential models were tested, where the mathematical model and their

D. H. S. Souza et al.
adjustment parameters were estimated (nugget effect, C0; sill, C0 + C1; range, a) from the
theoretical semivariogram models.
The model that best fits the data set was the one that presented the mean and standard
deviation values closer to zero and 1, respectively, based on the geostatistical technique of the
cross-validation using Jack-Knifing, described by Montenegro & Montenegro (2006).
According to Cambardella et al. (1994), the degree of spatial dependence (DSD) was evaluated,
based on the percentage ratio of the nugget effect (C0) in relation to the (C0 + C1) levels as
follows: (a) strong dependence when (DSD) <25%; (b) moderate dependence when (DSD) is
between 25 and 75% and (c) weak dependence when (DSD) is >75%.
To visualize the spatial distribution of the soil texture and moisture content, the kriging
method was used to construct the isoline map.
RESULTS AND DISCUSSION
The linear mathematical model was applied to calibrate the TDR probe used in this study,
since it presented the best statistical adjustment among the tested models, with a coefficient of
determination of 0.98. Ávila et al. (2011), using the TDR probe evaluated the spatial and
temporal pattern of soil moisture in a Hydrographic Basin in the State of Minas Gerais and
found that the coefficient of determination for calibrating an instrument is 0.85, thus, classifying
the calibration as good and acceptable.
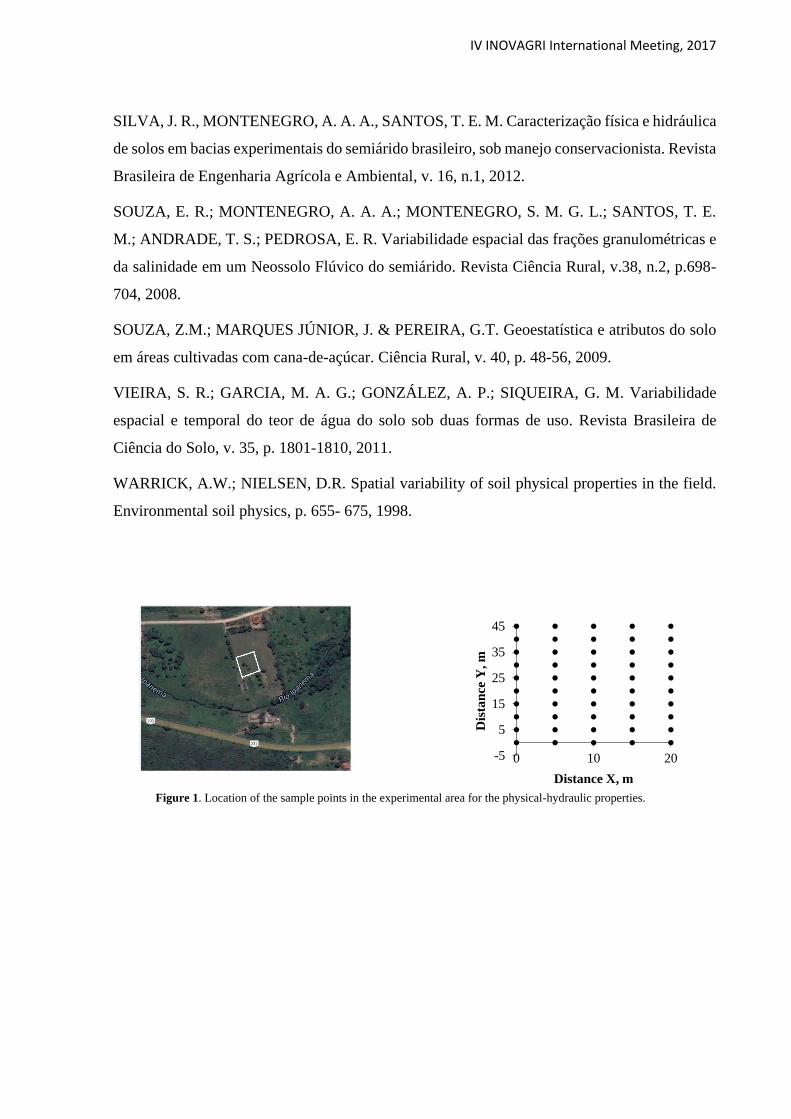
The values obtained from the descriptive statistics for soil moisture are presented in Table
1. Data analysis showed that the values of the coefficient of skewness and kurtosis were close
to zero, which explains the fact that the data presented normal distribution obtained by the
Kolmogorov-Smirnov normality test at a significance level of 5%. According to the
classification by Warrick and Nielsen (1998) the values of the coefficients of variation for soil
moisture obtained at the three considered irrigation moments presented medium variability, this
is explained because the median and mean values did not present high variations when the
measurements were carried out.
Rodrigues et al. (2015) evaluated the spatial moisture variability of a similar irrigated plot
to this study, adopting an 8 x 4 m regular spaced mesh, in 104 sample points, and found similar
results.
In the granulometric analysis, the Kolgomorov Smirnov test indicated normality in the
data for sand, clay, and silt at a significance level of 5%. The sand particles presented a low
coefficient of variation, while the clay and silt particles presented average variability. In a recent

IV INOVAGRI International Meeting, 2017
study, Andrade et al. (2014) evaluated the spatial variability of the textural classes of Flossic
Neosol soil, at 0 - 0.20 m layer; they obtained similar results, where the greater variability for
the silt particles should be associated with its greater mobility in the soil profile of an alluvial
valley.
After analyzing the variables U1 (12 hours after irrigation), U2 (4 hours after irrigation)
and U3 (immediately after irrigation), in “box plot” graph (Figure 2.), the moisture levels at
each irrigation moment for U1 and U2 presented low negative skewness. For U3, the highest
data dispersion was observed for the values below the lower quartile, although negative
skewness also occurred.
The texture variables of sand, silt, and clay contents showed skewness. Meanwhile, for
the sand and clay values, a greater data dispersion is observed for the values below the lower
quartile (negative skewness).
Existing spatial dependence was observed from the experimental semi-variograms, with
the exponential model being the one that best fits the moisture measurements in the three
irrigation moments and the analyzed texture particles, these results were based on the cross-
validation technique (means value closer to zero and standard deviation closer to 1). The
adjusted model parameters are shown in Table 2. Experimental semivariance and adjusted
models (Figure 3).
The moisture values presented by U1, U2 and U3 ranged from 12 m, 9.5 m, and 9.0 m,
respectively, for the exponential model, this allows a greater spatial dependence of soil moisture
over time. Therefore, drip irrigation influences the space-time dependence of soil moisture. For
texture data, the semivariogram model that best adjusted was the exponential, presenting in the
study area a greater continuity in the distribution of the variables in the most superficial layer
of the soil.
Santos et al. (2011) evaluated the spatial-temporal variability of soil moisture, using the
TDR probe, in the Representative Basin of Alto do Ipanema, in the municipality of Pesqueira -
PE, observing that the exponential model produced the best adjustment. Rodrigues et al. (2015)
evaluated the spatial variability of soil moisture and granulometric particles in the semi-arid
region of the municipality of Pesqueira, in the same irrigated plot with banana plantation, also
verified that the exponential model was better adjusted for moisture and texture data.
Sand, clay and silt particles, ranged from 6m, 12m, and 12 m, respectively. Larger
continued spaces were observed for clay and silt particles, allowing a better precision in non-
sampled locations. The sand and clay particles presented high spatial dependence, although silt

D. H. S. Souza et al.
presented moderate spatial dependence, these observations are based on the classification
proposed by Cambardella et al. (1994), where low values of the nugget effect represent a high
spatial dependence on the evaluated variables.
The management of the irrigated plot associated with the geomorphological processes in
the alluvial valley causes deposition and accumulation of materials from other places, due to
the topographic conditions of the area, and which explains the moderate spatial dependence of
silt (Montenegro & Montenegro, 2006). Andrade et al. (2014), evaluated the variability of
granulometric particles in Flossic Neosol soil, at Fazenda Nossa Senhora of Rosário, in the
municipality of Pesqueira-PE, and found range values for sand, clay and silt of 15 m, 9 m, and
20 m, respectively.
The distribution of the water content in the study area is represented by isoline maps for
the U1, U2 and U3 irrigation moments (Figure 4 - A, B and C), respectively, at 0 - 0.20 m layer.
In the U3 map, a higher water content variation was obtained in the 0 - 0.20 m layer of the soil
profile in the entire area, despite obtaining in the same map, higher water content concentration
in the extremes when compared with U1 and U2 moisture maps, in relation to the water
movement from the central part to the extremes.
Rodrigues et al. (2015), observed the same behavior of water dynamics, evaluating the
spatial variability of soil moisture in the same area of the study. In the U1 and U3 isoline maps,
in the central region, a higher concentration of water content in the soil was observed, which
was possibly influenced by the minimization of soil water evaporation due to the shadowing
caused by the hose located in the center of the area. In the U2 isoline map, a predominance of
lower moisture values in almost every area was noticed, because the reading was performed
outside the moisture bulb.
The isoline maps allow the adequate management of water distribution through the
irrigation system, from the identification of regions with low moisture content, as justified by
Souza et al. (2008). Higher moisture values were observed in the areas located at the extreme
of the plot, showing the unevenness of the drip irrigation system in the study area, indicating
possible temporal dependence.
The isoline maps for the granulometric particles (Figure 4. D, E and F) showed
homogeneous behavior for clay and silt on the left side of the area. The highest sand content is
concentrated in the lower soil moisture regions. Leão et al. (2010), in São Paulo, found similar
results on a slope of an alluvial valley.
Santos et al. (2012) evaluated an alluvial valley in the semi-arid region of Pernambuco
and found a medium variability for the textural particles: sand, silt, and clay, associating this

IV INOVAGRI International Meeting, 2017
result to the transport and sedimentation processes, providing greater homogenization of sand
and clay particles.
CONCLUSIONS
All physical-hydraulic properties followed a normal distribution frequency. Soil moisture
at the three measuring moments and the clay and silt granulometric particles showed mean
variation, while sand presented a low coefficient of variation. The spatial dependence of soil
moisture and texture were best represented by the exponential model.
The moisture content at the different measuring moments for sand and clay granulometric
particles presented high spatial dependence, while silt presented moderate spatial dependence.
In the isoline maps after irrigation, greater water content was observed at the extremes of the
study area, with an increase in the variability and spatial dependence of soil moisture with
irrigation.
ACKNOWLEDGEMENTS
Financial support: FACEPE, CAPES.
REFERENCES
ANDRADE, C. W. L.; SILVA, J. S.; MONTENEGRO, A. A. A.; MONTENEGRO, S. M. G.
L.; TAVARES, U. E. Variabilidade espacial da textura em solo aluvial sob o cultivo de cenoura
(Daucus Carota L.). Revista Pernambucana de Tecnologia, v. 2, n. 2 p. 59-67, 2014.
ÁVILLA, L. F.; MELLO, C. R.; MELLO, J. M.; SILVA, A. M. Padrão espaço-temporal da
umidade volumétrica do solo em uma bacia hidrográfica com predominância de latossolo.
Revista Brasileira de Ciência do Solo, v. 35, p. 1801-1810, 2011.
BARONI, G., ORTUANI, B., FACCHI, A., GANDOLFI, C. The role of vegetation and soil
properties on the spatio-temporal variability of the surface soil moisture in a maize cropped
field. Journal of Hydrology, v. 489, p. 148–159, 2013.
BASTOS, D.C.O. Manejo da salinidade em irrigação localizada: análise da alternativa de
lixiviação incompleta. Dissertação (Mestrado em Ciência do Solo). Universidade Federal Rural
de Pernambuco, Recife, 2004.

D. H. S. Souza et al.
BUSKE, T. C.; ROBAIANA, A. D.; PEITER, M. X.; ROSSO, R. B.; TORRES, R. R.; NUNES,
M.S. Avaliação do desempenho do método das pesagens para determinação da umidade do
solo. Revista Brasileira de Agricultura Irrigada, v.7, n. 6, p 340 - 348, 2013.
CAMBARDELLA, C. A.; MOORMAN, J. M.; NOVAK, T. B.; KARLEN, D. L.; TURCO, R.
F.; KONOPKA, A. E. Field-scale variability of soil properties in Central Iowa Soils. Soil
Science Society of America Journal, v.58, p.1501-1511, 1994.
CASTIONE, G. A. F.; SOUZA, Z. M., SILVA, R. B., CAMPOS, M. C. C., CUNHA, J. M.
Variabilidade espacial da textura do solo em área irrigada por pivô central em diferentes
posições na paisagem. Revista Agroambiente, v. 9, n. 3, p. 219-226, 2015.
EMPRESA BRASILEIRA DE PESQUISA AGROPECUÁRIA. Manual de métodos de
análises de solo. 2.ed. Rio de Janeiro: Embrapa, p. 230, 2011.
FONTES JÚNIOR, R. P. P.; MONTENEGRO, A. A. A.; MONTENEGRO, S. M. G. L.;
SANTOS, T. E. M. Estabilidade temporal da potenciometria e da salinidade em vale aluvial no
semiárido de Pernambuco. Revista Brasileira de Engenharia Agrícola e Ambiental, v.16,
p.1188–1197, 2012.
LEÃO, M. G. A.; MARQUES JÚNIOR, J.; SOUZA, Z. M.; PEREIRA, G. T. Variabilidade
espacial da textura de um latossolo sob cultivo de citros. Ciência e Agrotecnologia, Lavras, v.
34, n. 1, p. 121-131, 2010.
MONTENEGRO, A. A. A.; MONTENEGRO, S. M. G. L. Variabilidade espacial de classes de
textura, salinidade e condutividade hidráulica de solos em planície aluvial. Revista Brasileira
de Engenharia Agrícola e Ambiental, v.10, p.30-37, 2006.
SANTOS, T. E. M.; MONTENEGRO, A. A. A; SILVA, D. D. Umidade do solo no semiárido
pernambucano usando-se reflectometria no domínio do tempo (TDR). Revista Brasileira em
Engenharia Agrícola Ambiental, v.15, n.7, p.670–679, 2011.
SANTOS, K. S.; MONTENEGRO, A. A. A.; MONTENEGRO, S. M. G. L.; ANDRADE, T.
S.; FONTES JÚNIOR, R. V. P. Variabilidade espacial de atributos físicos em solos de vale
aluvial no semiárido de Pernambuco. Revista Brasileira de Engenharia Agrícola e Ambiental,
v.16, p.828-835, 2012.
SILVA, S. F., MENDES, D. F., FERRARI, J. L., SOUSA, E. F., GARCIA, R. F., SANTOS,
A. R. Utilização do sensoriamento remoto na agricultura de precisão: uma análise bibliométrica.
Revista Científica da Fundação Educacional de Ituverava, v.11, n.2, 2014.
IV INOVAGRI International Meeting, 2017
SILVA, J. R., MONTENEGRO, A. A. A., SANTOS, T. E. M. Caracterização física e hidráulica
de solos em bacias experimentais do semiárido brasileiro, sob manejo conservacionista. Revista
Brasileira de Engenharia Agrícola e Ambiental, v. 16, n.1, 2012.
SOUZA, E. R.; MONTENEGRO, A. A. A.; MONTENEGRO, S. M. G. L.; SANTOS, T. E.
M.; ANDRADE, T. S.; PEDROSA, E. R. Variabilidade espacial das frações granulométricas e
da salinidade em um Neossolo Flúvico do semiárido. Revista Ciência Rural, v.38, n.2, p.698-
704, 2008.
SOUZA, Z.M.; MARQUES JÚNIOR, J. & PEREIRA, G.T. Geoestatística e atributos do solo
em áreas cultivadas com cana-de-açúcar. Ciência Rural, v. 40, p. 48-56, 2009.
VIEIRA, S. R.; GARCIA, M. A. G.; GONZÁLEZ, A. P.; SIQUEIRA, G. M. Variabilidade
espacial e temporal do teor de água do solo sob duas formas de uso. Revista Brasileira de
Ciência do Solo, v. 35, p. 1801-1810, 2011.
WARRICK, A.W.; NIELSEN, D.R. Spatial variability of soil physical properties in the field.
Environmental soil physics, p. 655- 675, 1998.
Figure 1. Location of the sample points in the experimental area for the physical-hydraulic properties.
-5
5
15
25
35
45
0 10 20
Dis
tan
ce Y
, m
Distance X, m

D. H. S. Souza et al.
Figure 2. "Box-Plot" graph for the variables U1, U2, U3, Sand, Clay and Silt
(A) (B)
(C) (D)
0
5
10
15
20
25
30
35
0 20 40
Sem
ivar
ian
ceϒ
Distance (m)
0
2
4
6
8
10
12
14
0 20 40
Sem
ivar
ian
ceϒ
Distance (m)
0
5
10
15
20
25
30
0 20 40
Sem
ivar
ian
ce ϒ
Distance (m)
0
10
20
30
40
50
60
70
0 10 20 30
Sem
ivar
ian
ceϒ
Distance (m)

IV INOVAGRI International Meeting, 2017
(E) (F)
Figure 3. Adjusted semi-variograms for the moisture variables (%), in the irrigation moment U1 (A); irrigation
moment U2 (B); irrigation moment U3 (C); and soil texture: sand content (g.kg-1) (D); clay content (g.kg-1) (E); silt
content (g.kg-1) (E), at 0 - 0.20 m depth.
(A) (B) (C)
(D) (E) (F)
Figure 4. Isoline maps representing the moisture variables (%) in the irrigation moment U1 (a); irrigation moment U2 (b);
irrigation moment U3 (c); and soil granulometric particles: sand content (g.kg-1) (e); clay content (g.kg-1) (f); silt content (g.kg-1)
(g), 0-0.20 m depth.
0
1
2
3
4
5
0 10 20 30
Sem
ivar
ian
ceϒ
Distance (m)
0
10
20
30
40
50
60
0 10 20 30 40
Sem
ivar
ian
ceϒ
Distance (m)
D. H. S. Souza et al.
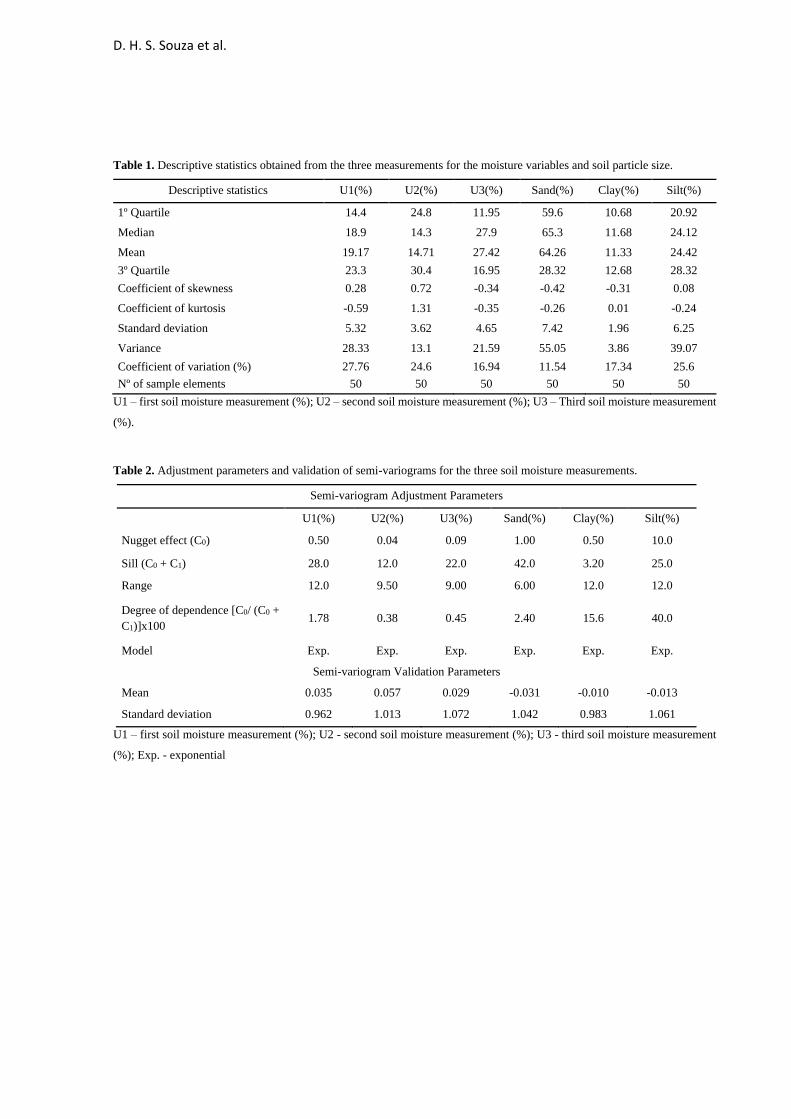
Table 1. Descriptive statistics obtained from the three measurements for the moisture variables and soil particle size.
Descriptive statistics U1(%) U2(%) U3(%) Sand(%) Clay(%) Silt(%)
1º Quartile 14.4 24.8 11.95 59.6 10.68 20.92
Median 18.9 14.3 27.9 65.3 11.68 24.12
Mean 19.17 14.71 27.42 64.26 11.33 24.42
3º Quartile 23.3 30.4 16.95 28.32 12.68 28.32
Coefficient of skewness 0.28 0.72 -0.34 -0.42 -0.31 0.08
Coefficient of kurtosis -0.59 1.31 -0.35 -0.26 0.01 -0.24
Standard deviation 5.32 3.62 4.65 7.42 1.96 6.25
Variance 28.33 13.1 21.59 55.05 3.86 39.07
Coefficient of variation (%) 27.76 24.6 16.94 11.54 17.34 25.6
Nº of sample elements 50 50 50 50 50 50
U1 – first soil moisture measurement (%); U2 – second soil moisture measurement (%); U3 – Third soil moisture measurement
(%).
Table 2. Adjustment parameters and validation of semi-variograms for the three soil moisture measurements.
Semi-variogram Adjustment Parameters
U1(%) U2(%) U3(%) Sand(%) Clay(%) Silt(%)
Nugget effect (C0) 0.50 0.04 0.09 1.00 0.50 10.0
Sill (C0 + C1) 28.0 12.0 22.0 42.0 3.20 25.0
Range 12.0 9.50 9.00 6.00 12.0 12.0
Degree of dependence [C0/ (C0 +
C1)]x100 1.78 0.38 0.45 2.40 15.6 40.0
Model Exp. Exp. Exp. Exp. Exp. Exp.
Semi-variogram Validation Parameters
Mean 0.035 0.057 0.029 -0.031 -0.010 -0.013
Standard deviation 0.962 1.013 1.072 1.042 0.983 1.061
U1 – first soil moisture measurement (%); U2 - second soil moisture measurement (%); U3 - third soil moisture measurement
(%); Exp. - exponential