Socioeconomic Segregation in Latin American Cities. A Geodemographic Application in Me

Spatial segregation and socioeconomic inequalities
in health in major Brazilian cities
An ESRC pathfinder project

Income per head and life-expectancy: rich & poor countries
Source: Wilkinson & Pickett, The Spirit Level (2009)

Male mortality (25-64 yrs) and income inequality in US states and
Canadian provinces.
Source: Ross NA, Wolfson MC, Dunn JR, Berthelot JM, Kaplan GA, Lynch JW. British
Medical Journal 2000;320:898-902
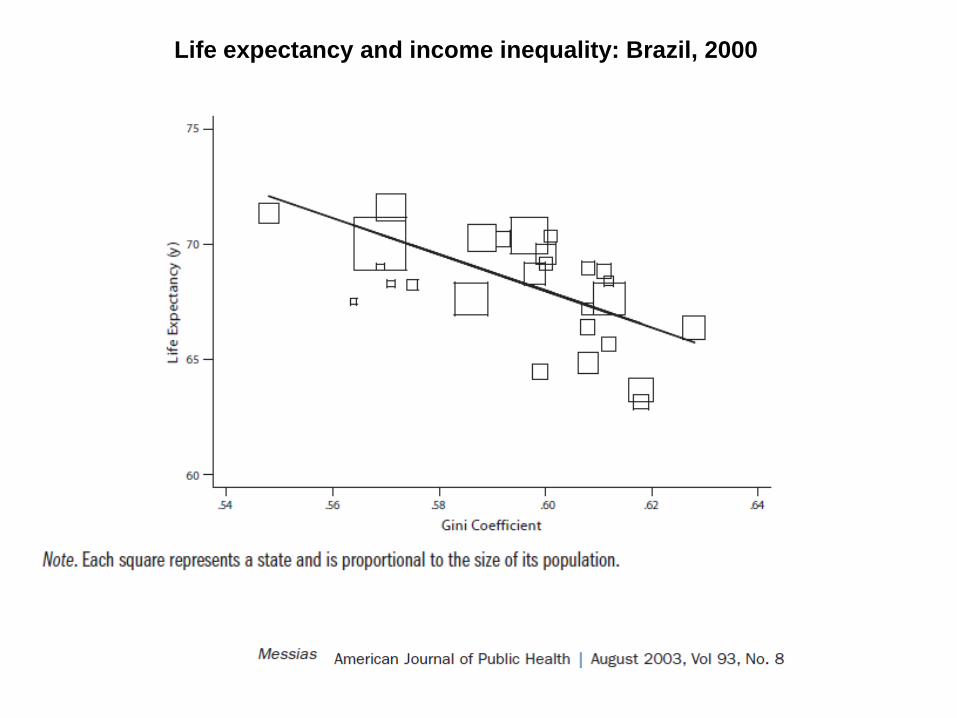
Life expectancy and income inequality: Brazil, 2000

Increasing urbanisation in developing countries
http://filipspagnoli.wordpress.com/stats-on-human-rights/statistics-on-
poverty/statistics-on-poverty-urbanization-and-slums/

Share of slum population in urban areas in selected Asian and Pacific countries
1990 and 2001
http://filipspagnoli.wordpress.com/stats-on-human-rights/statistics-on-
poverty/statistics-on-poverty-urbanization-and-slums/
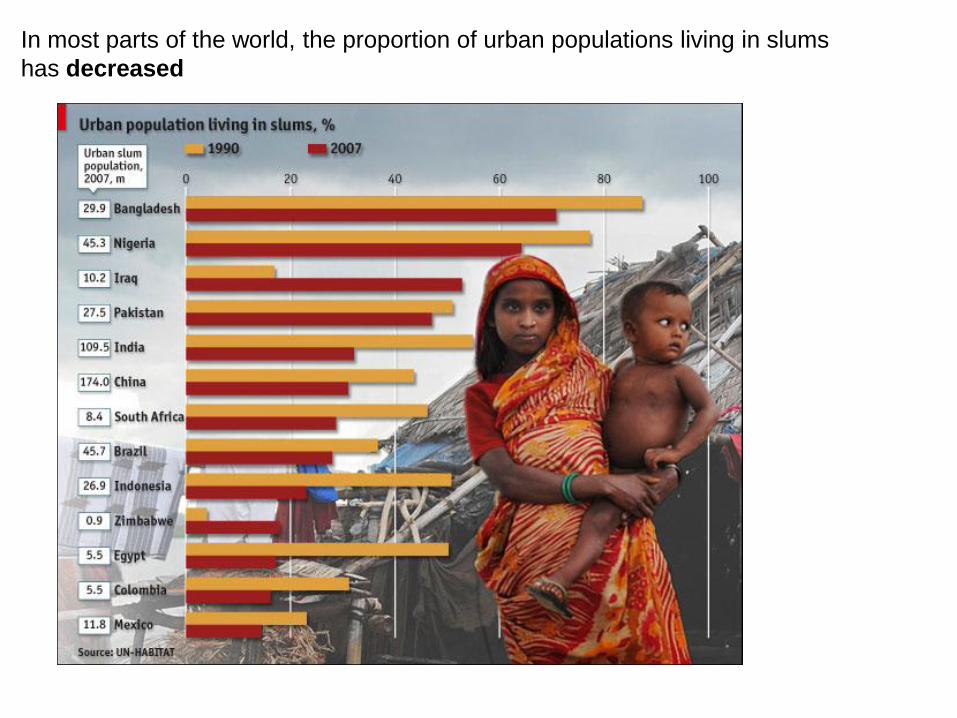
In most parts of the world, the proportion of urban populations living in slums
has decreased

At the same time, the absolute number of slum dwellers around the world
is still rising
http://filipspagnoli.wordpress.com/stats-on-human-rights/statistics-on-
poverty/statistics-on-poverty-urbanization-and-slums/

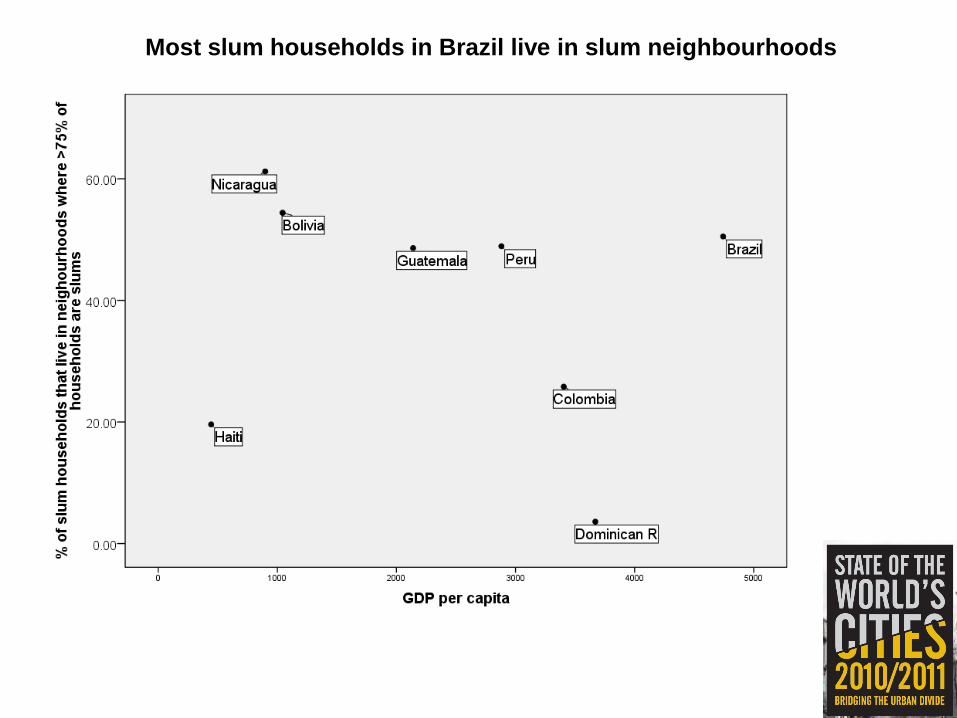
Most slum households in Brazil live in slum neighbourhoods
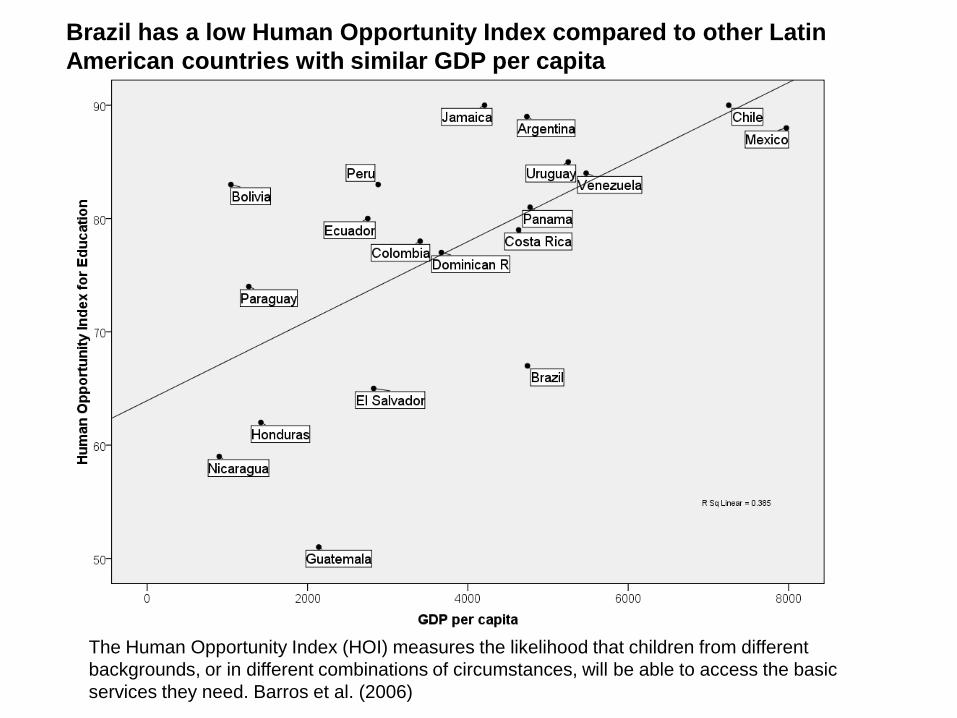
The Human Opportunity Index (HOI) measures the likelihood that children from different
backgrounds, or in different combinations of circumstances, will be able to access the basic
services they need. Barros et al. (2006)
Brazil has a low Human Opportunity Index compared to other Latin
American countries with similar GDP per capita

Spatial Inequalities and Development
Despite having a relatively high GDP per capita, Brazilian cities are highly
unequal
- urbanisation and concentration of economic activity
- spatial concentration of affluence reproduces privileges of the rich
- spatial concentration of poverty results in segregation, involuntary
clustering in ghettos
Effects on population health and premature mortality/morbidity?
“Triple health jeopardy: being poor in a poor neighbourhood that is spatially
isolated from life-enhancing opportunities…” Nancy A Ross

Socioeconomic segregation and the Spatial poverty trap
- Severe job restriction
- Gender disparities
- Worsening living conditions
- Social exclusion and marginalisation
- Lack of social interaction
- High incidence of crime

Dimensions of segregation
Evenness: the unequal distribution of social groups across areal units of an urban
area. Index of Dissimilarity
Exposure: the degree of potential contact between groups within neighborhoods
of a city. Index of Isolation and Exposure
Clustering: extent to which areas inhabited by minority members adjoin one
another in space. Index of clustering
Centralization: the degree to which a group is located near the centre of an urban
area. Index of centralisation
Concentration: the relative amount of physical space occupied by a minority
group in the urban environment. Index of concentration
However, these indices are aspatial measures.

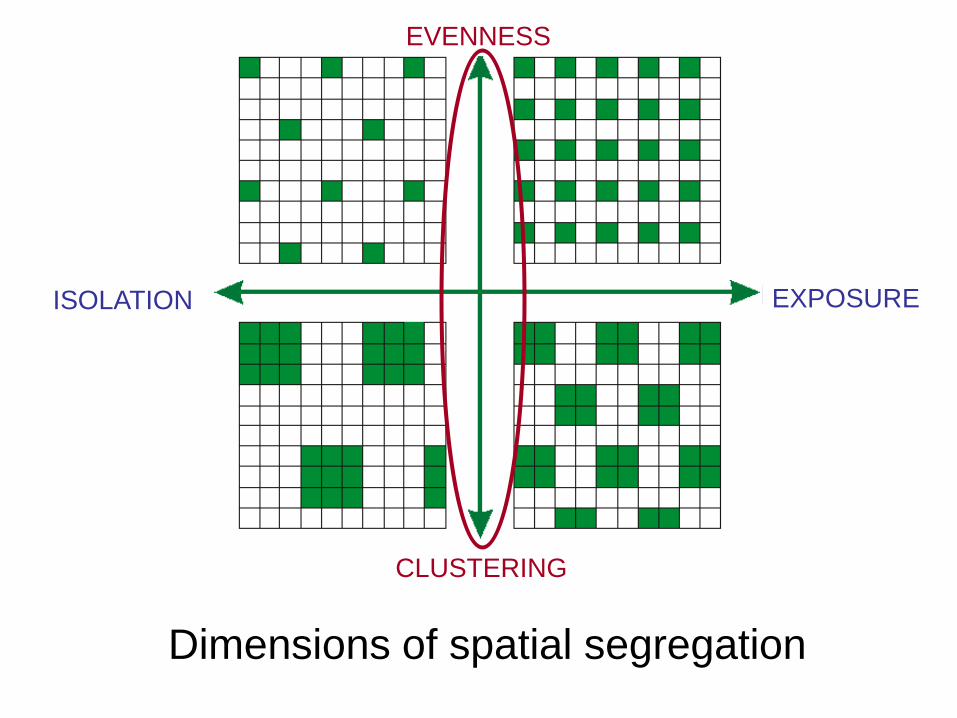
Dimensions of spatial segregation
Sean F. Reardon & David O'Sullivan. “Measures of Spatial Segregation” Sociological Methodology.
V. 34, n.1, p. 121-162, 2004
EVENNESS
CLUSTERING
EXPOSURE ISOLATION

CLUSTERING
EXPOSURE
EVENNESS
ISOLATION
Adapted from Bell, 2006 and from Reardon & O'Sullivan, 2004
Dimensions of spatial segregation

SPATIAL EXPOSURE INDEX
SPATIAL ISOLATION INDEX
EXPOSURE/ISOLATION DIMENSION
Feitosa, F. F.; Câmara, G.;Monteiro, A. M. V.; Koschitzki, T.; Silva, M. P. S., Global and local spatial indices of urban segregation.
International Journal of Geographical Information Science; Mar2007, Vol. 21 Issue 3, p299-323,
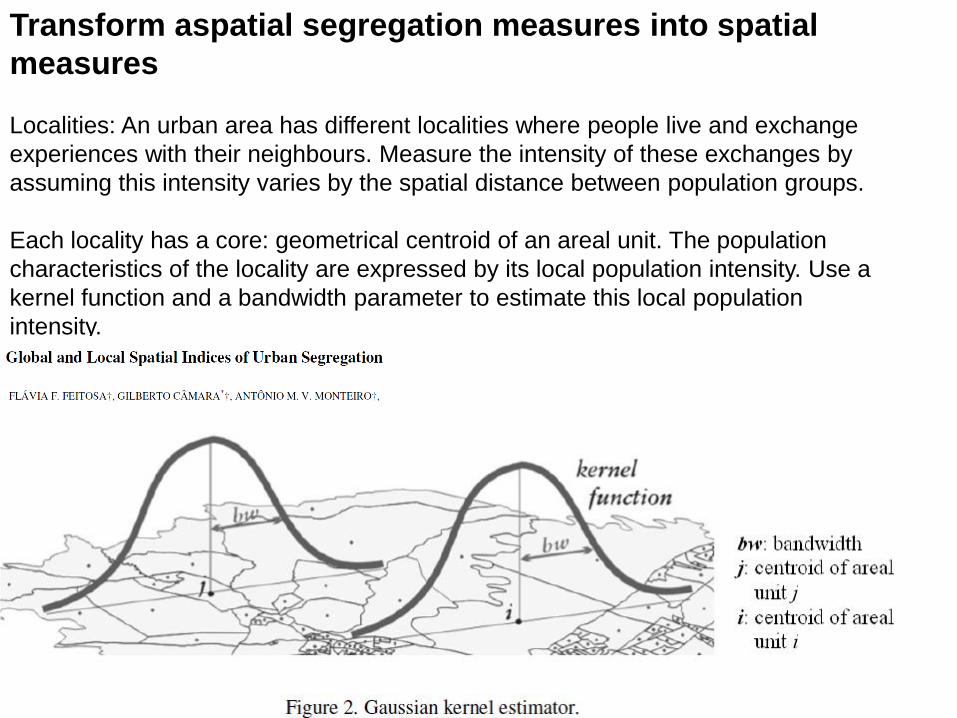
Transform aspatial segregation measures into spatial
measures
Localities: An urban area has different localities where people live and exchange
experiences with their neighbours. Measure the intensity of these exchanges by
assuming this intensity varies by the spatial distance between population groups.
Each locality has a core: geometrical centroid of an areal unit. The population
characteristics of the locality are expressed by its local population intensity. Use a
kernel function and a bandwidth parameter to estimate this local population
intensity.

Spatial clustering index:
-The percentage of the low income census tracts within a district that are
surrounded by other low income census tracts.
-The index varies from 0% to 100%
-0%: there are no low income census tracts surrounded by other low income
census tracts in the district
-100%: all the census tracts in the district are low income census tracts surrounded
by other low income census tracts

South
Southeast
Northeast
North
Central-West
Porto Alegre
Curitiba
Rio de Janeiro
Aracaju
Recife
João Pessoa
Natal Teresina
Brasília
Campo Grande
Brazilian regions, states and selected cities
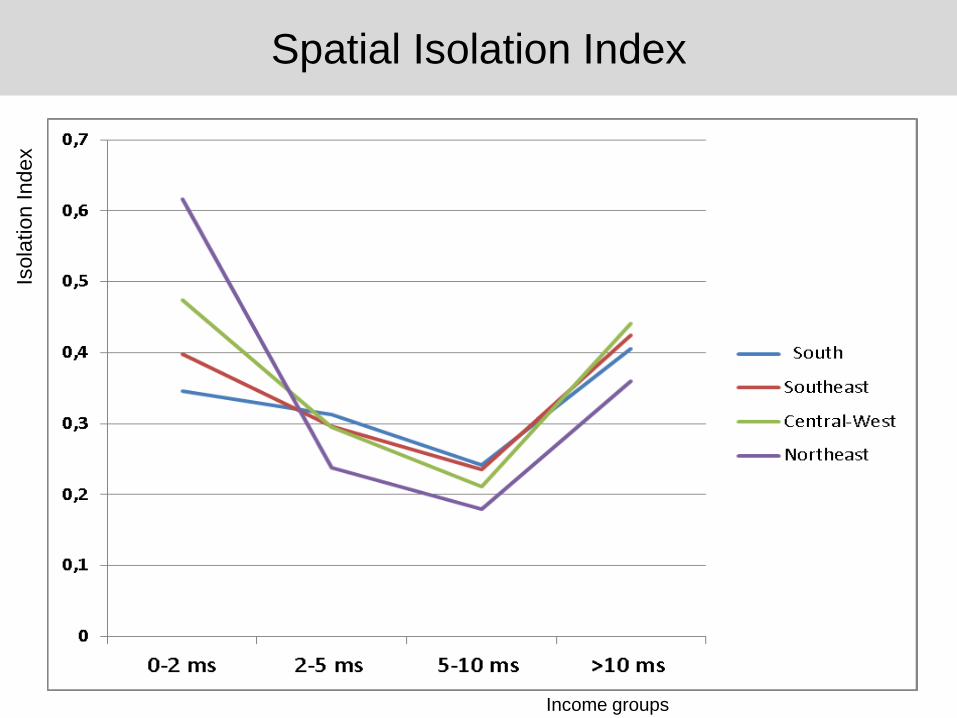
Income groups
Spatial Isolation Index Is
ola
tion
In
de
x
Dimensions of spatial segregation
EVENNESS
CLUSTERING
EXPOSURE ISOLATION
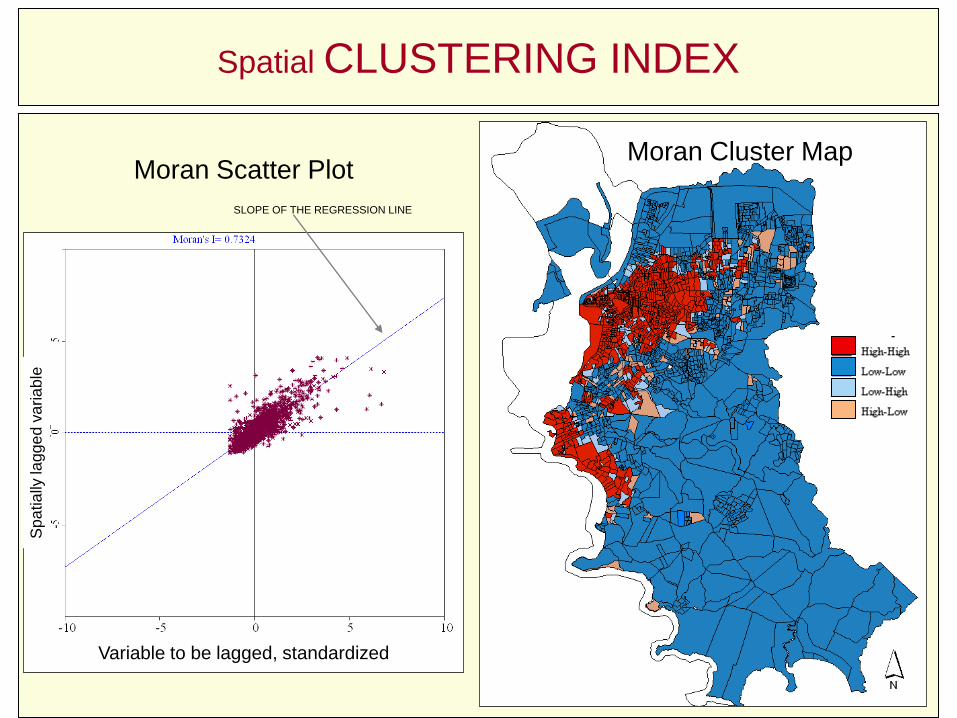
Spatial CLUSTERING INDEX
Moran Scatter Plot
SLOPE OF THE REGRESSION LINE
Sp
atia
lly lagge
d v
aria
ble
Variable to be lagged, standardized
Moran Cluster Map

Spatial CLUSTERING INDEX
Within each district, the
Spatial Clustering Index
is the proportion of
census tracts that are
low income tracts and
are surrounded by other
low income tracts.

Dimensions of spatial segregation
EVENNESS
CLUSTERING
EXPOSURE ISOLATION
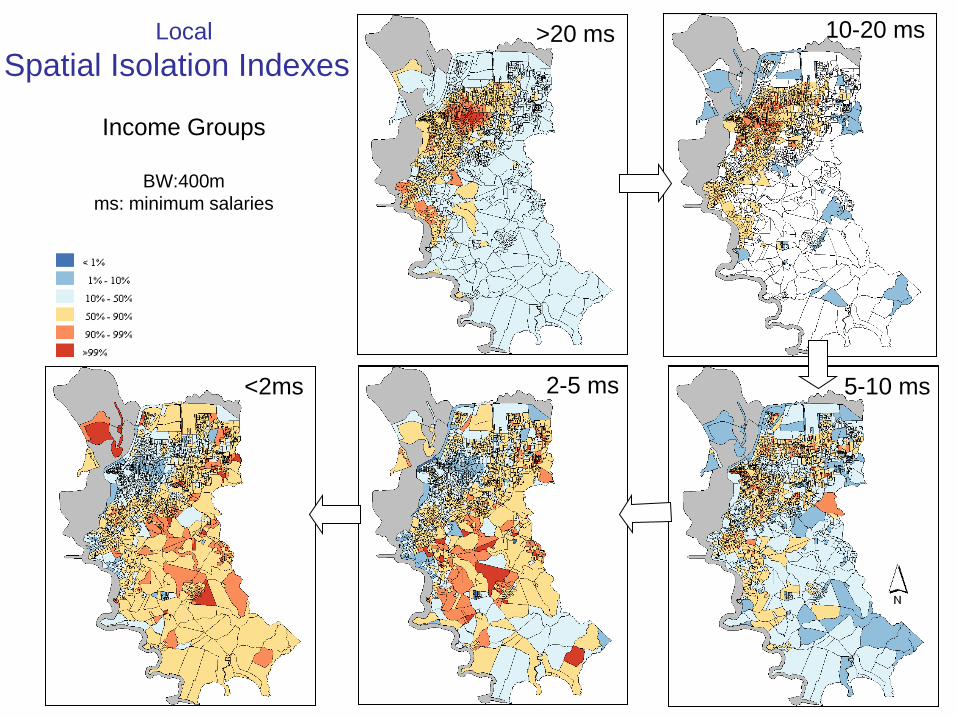
Local
Spatial Isolation Indexes
Income Groups
BW:400m
ms: minimum salaries
>20 ms 10-20 ms
5-10 ms <2ms 2-5 ms

INCOME
Moran I Index: 0.65 ( ρ< 0.0001)
Distribution of income of the head of the household by district, Porto Alegre, 2000. Source: IBGE

Outcome variable: Standardised Mortality Rates (age and
sex adjusted) for 861 districts within 15 Brazilian cities

Scatterplot of Standardised Mortality Rates by Poverty Rate
in Brazilian Districts

Scatterplot of Spatial Clustering by Poverty Rate in Brazilian
Districts
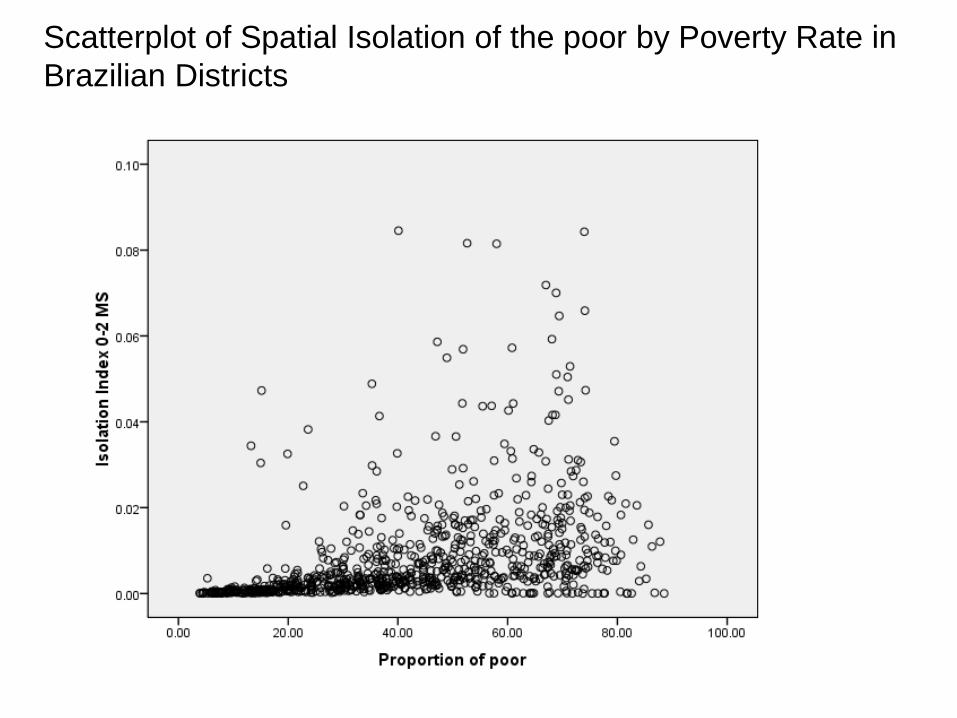
Scatterplot of Spatial Isolation of the poor by Poverty Rate in
Brazilian Districts
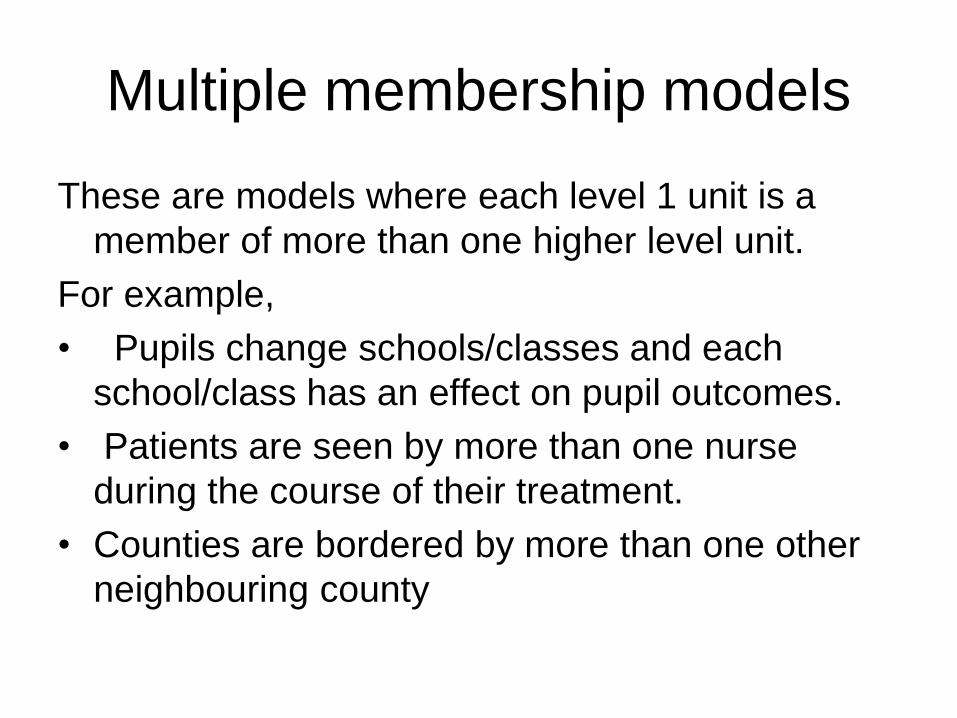
Multiple membership models
These are models where each level 1 unit is a
member of more than one higher level unit.
For example,
• Pupils change schools/classes and each
school/class has an effect on pupil outcomes.
• Patients are seen by more than one nurse
during the course of their treatment.
• Counties are bordered by more than one other
neighbouring county
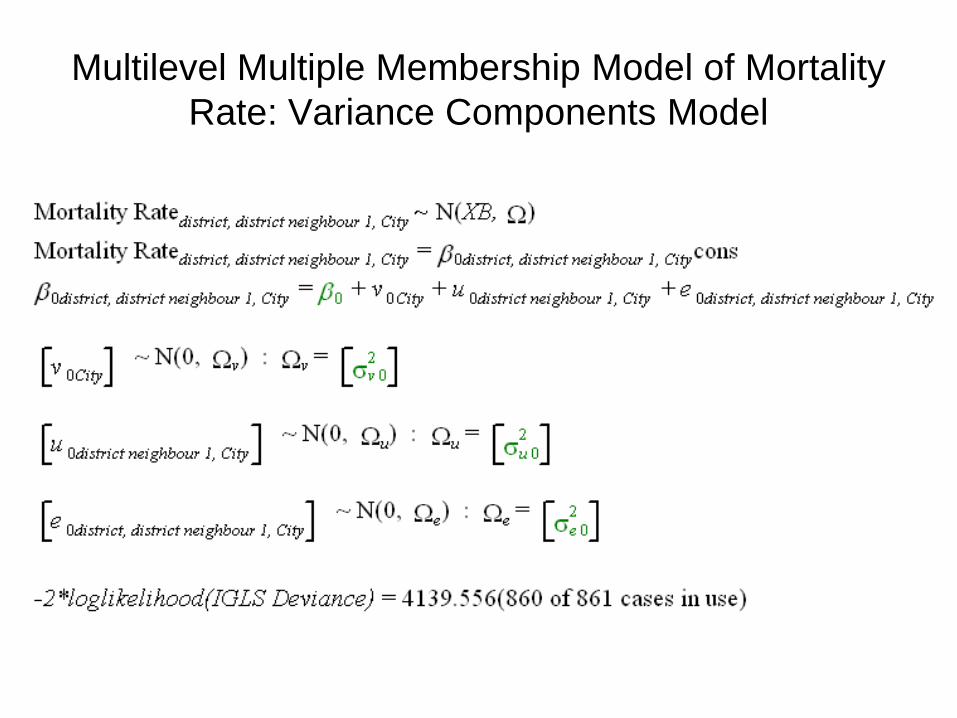
Multilevel Multiple Membership Model of Mortality
Rate: Variance Components Model
SMR
Spatial clustering Index
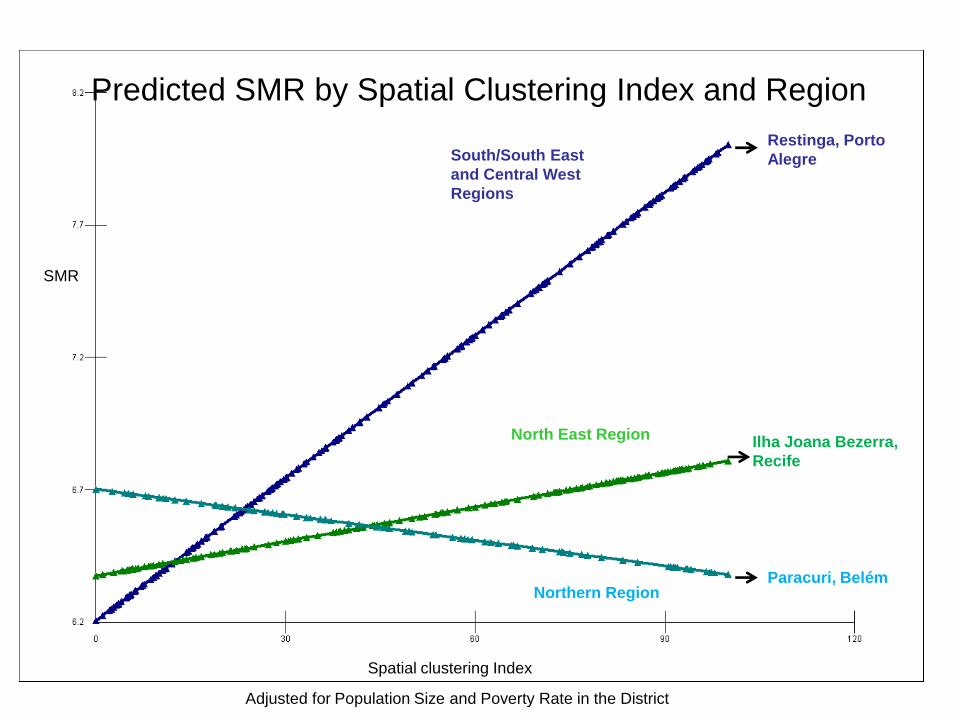
South/South East
and Central West
Regions
North East Region
Northern Region
Predicted SMR by Spatial Clustering Index and Region
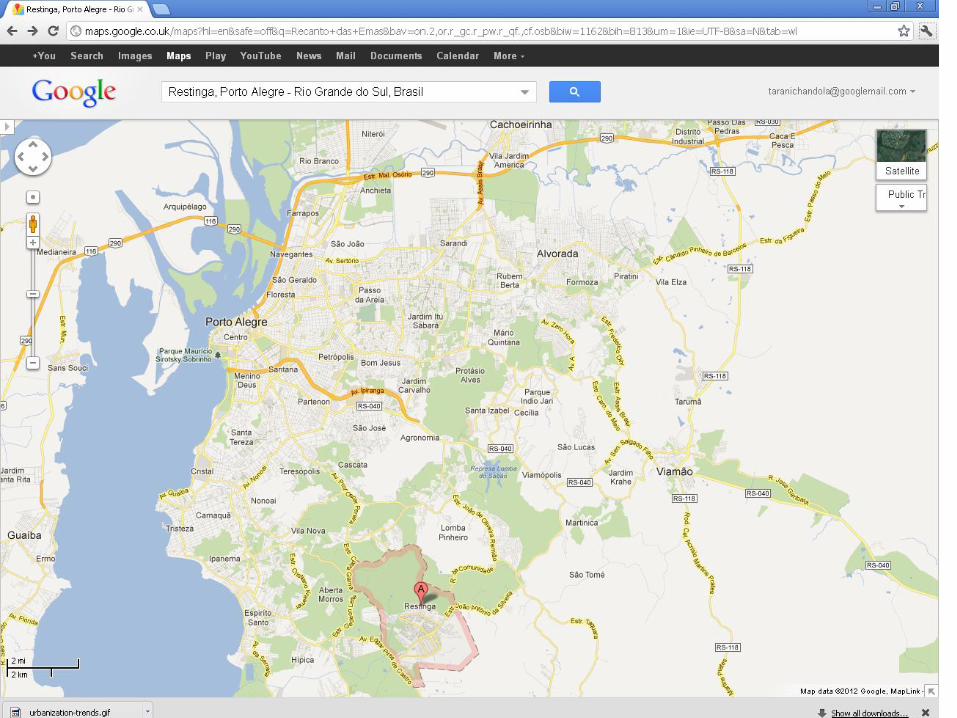
Restinga, Porto
Alegre
Ilha Joana Bezerra,
Recife
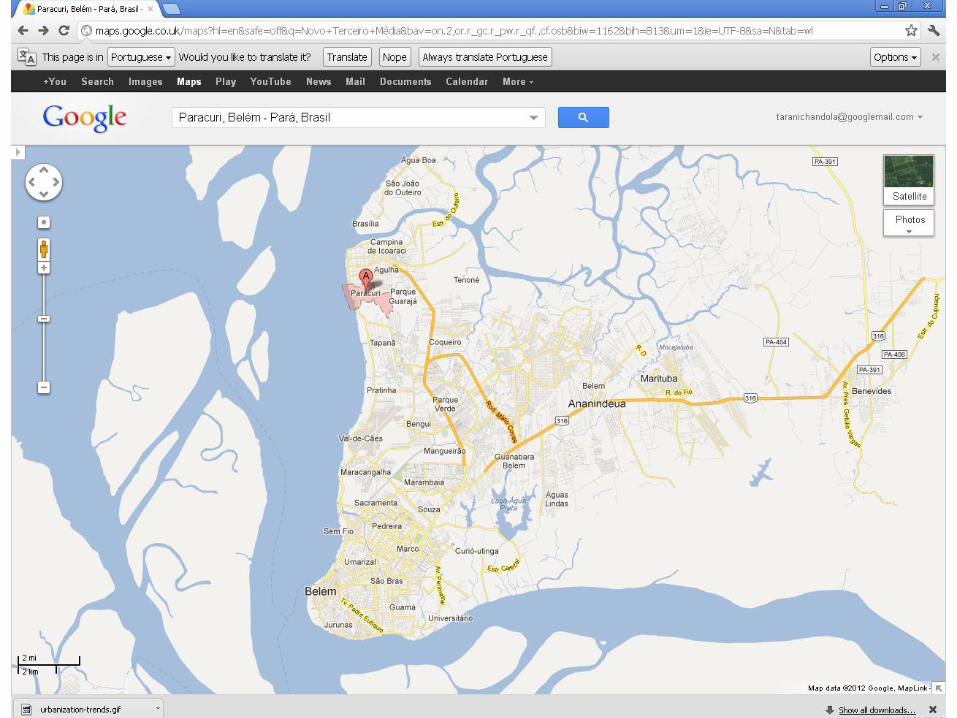
Paracuri, Belém
Adjusted for Population Size and Poverty Rate in the District


Discussion:
-“Triple health jeopardy”- revisited?
Living in a poor neighbourhood that is spatially segregated, in a developing
city
- Living in a rich city is not protective (of mortality risk) if you live in a
spatially segregated neighbourhood
- Implications for urban development and slum resettlement in other
developing countries

Slum clearances in Rio de Janeiro in preparation for the Olympics

Summary
- Districts in Brazil with higher poverty rates have higher mortality rates
- Districts where the poor are clustered also have higher mortality rates
- Interaction between Region and Spatial Clustering: The association of
clustering with mortality is strongest in cities in the richest (Southern)
regions
- Increasing the spatial isolation of the poor within rich cities could result in
poorer health and lower life expectancy.