Spatial patterns of infauna, epifauna, and demersal …Spatial patterns of infauna, epifauna, and...
16
Spatial patterns of infauna, epifauna, and demersal fish communities in the North Sea Henning Reiss, Steven Degraer, Gerard C. A. Duineveld, Ingrid Kro ¨ncke, John Aldridge, Johan A. Craeymeersch, Jacqueline D. Eggleton, Hans Hillewaert, Marc S. S. Lavaleye, Andreas Moll, Thomas Pohlmann, Eike Rachor, Mike Robertson, Edward Vanden Berghe, Gert van Hoey, and Hubert L. Rees Reiss, H., Degraer, S., Duineveld, G. C. A., Kro ¨ncke, I., Aldridge, J., Craeymeersch, J., Eggleton, J. D., Hillewaert, H., Lavaleye, M. S. S., Moll, A., Pohlmann, T., Rachor, E., Robertson, M., vanden Berghe, E., van Hoey, G., and Rees, H. L. 2010. Spatial patterns of infauna, epifauna, and demersal fish communities in the North Sea. – ICES Journal of Marine Science, 67: 278–293. Understanding the structure and interrelationships of North Sea benthic invertebrate and fish communities and their underlying environmental drivers is an important prerequisite for conservation and spatial ecosystem management on scales relevant to ecologi- cal processes. Datasets of North Sea infauna, epifauna, and demersal fish (1999 – 2002) were compiled and analysed to (i) identify and compare spatial patterns in community structure, and (ii) relate these to environmental variables. The multivariate analyses revealed significantly similar large-scale patterns in all three components with major distinctions between a southern community (Oyster Ground and German Bight), an eastern Channel and southern coastal community, and at least one northern community ( .50 m deep). In contrast, species diversity patterns differed between the components with a diversity gradient for infauna and epifauna decreasing from north to south, and diversity hotspots of demersal fish, e.g. near the major inflows of Atlantic water. The large- scale hydrodynamic variables were the main drivers for the structuring of communities, whereas sediment characteristics appeared to be less influential, even for the infauna communities. The delineation of ecologically meaningful ecosystem management units in the North Sea might be based on the structure of the main faunal ecosystem components. Keywords: benthic assemblages, community structure, demersal fish, ecosystem management, species diversity. Received 5 February 2009; accepted 17 October 2009; advance access publication 29 November 2009. H. Reiss and I. Kro ¨ncke: Department of Marine Science, Senckenberg Institute, Su ¨dstrand 40, 26832 Wilhelmshaven, Germany. S. Degraer: Management Unit of the North Sea Mathematical Model, Marine Ecosystem Management Section, Royal Belgian Institute of Natural Sciences, Gulledelle 100, 1200 Brussels, Belgium. G. C. A. Duineveld and M. S. S. Lavaleye: Netherlands Institute of Sea Research, PO Box 59, 1792 AB Den Burg, Texel, The Netherlands. J. Aldridge, J. D. Eggleton, and H. L. Rees: Centre for Environment, Fisheries and Aquaculture Science, Pakefield Road, Lowestoft, Suffolk NR33 0HT, UK. J. A. Craeymeersch: Wageningen IMARES, Institute for Marine Resources and Ecosystem Studies, PO Box 77, 4400 AB Yerseke, The Netherlands. H. Hillewaert and G. van Hoey: Institute for Agricultural and Fisheries Research (ILVO Fisheries), Ankerstraat 1, 8400 Oostende, Belgium. A. Moll and T. Pohlmann: Institute of Oceanography, Centre for Marine and Climate Research (ZMAW), University of Hamburg, Bundesstrasse 53, 20146 Hamburg, Germany. E. Rachor: Alfred-Wegener-Institute for Polar and Marine Research, 27515 Bremerhaven, Germany. M. Robertson: Marine Scotland, Marine Laboratory, PO Box 101, Victoria Road, Aberdeen AB11 9DB, UK. E. Vanden Berghe: Flanders Marine Institute (VLIZ), Wandelaarkaai 7, B-8400 Oostende, Belgium; present address: Ocean Biogeographic Information System, Rutgers University, 71 Dudley Road, New Brunswick, NJ 08901, USA. Correspondence to H. Reiss: tel: þ49 4421 9475 266; fax: þ49 4421 9475 222; e-mail: [email protected]. Introduction The increasing variety of anthropogenic pressures on the marine environment, such as those arising from commercial fisheries, aquaculture, the demand for sustainable energy, and transport routes, have led to the promotion of holistic ecosystem manage- ment approaches, including spatial management strategies to mini- mize adverse effects on ecosystem structure, function, and processes. Understanding the structure of the biological com- ponents and their underlying environmental drivers is an essential prerequisite for the development of spatial management units on scales relevant to biological and ecological processes because usually the delineation of these management units is based solely on administrative boundaries and social, economic, or political factors (Reiss et al., 2009). Habitat classification schemes in marine ecosystems have been based largely on spatial patterns in abiotic variables, with the under- lying presumption that these patterns would have both physical and biological significance (Roff et al., 2003; Gregr and Bodtker, 2007). The linkages between environmental and biological variability have to be known, and the environmental variables used within habitat classification approaches must be capable of discriminating variation in biological patterns (Snelder et al., 2007). The North Sea is one of the most intensively exploited and studied marine ecosystems in the world. It is a shelf sea characterized # 2009 International Council for the Exploration of the Sea. Published by Oxford Journals. All rights reserved. For Permissions, please email: [email protected] 278
Transcript of Spatial patterns of infauna, epifauna, and demersal …Spatial patterns of infauna, epifauna, and...

Spatial patterns of infauna, epifauna, and demersal fishcommunities in the North Sea
Henning Reiss, Steven Degraer, Gerard C. A. Duineveld, Ingrid Kroncke, John Aldridge,Johan A. Craeymeersch, Jacqueline D. Eggleton, Hans Hillewaert, Marc S. S. Lavaleye, Andreas Moll,Thomas Pohlmann, Eike Rachor, Mike Robertson, Edward Vanden Berghe, Gert van Hoey,and Hubert L. Rees
Reiss, H., Degraer, S., Duineveld, G. C. A., Kroncke, I., Aldridge, J., Craeymeersch, J., Eggleton, J. D., Hillewaert, H., Lavaleye, M. S. S., Moll, A.,Pohlmann, T., Rachor, E., Robertson, M., vanden Berghe, E., van Hoey, G., and Rees, H. L. 2010. Spatial patterns of infauna, epifauna, anddemersal fish communities in the North Sea. – ICES Journal of Marine Science, 67: 278–293.
Understanding the structure and interrelationships of North Sea benthic invertebrate and fish communities and their underlyingenvironmental drivers is an important prerequisite for conservation and spatial ecosystem management on scales relevant to ecologi-cal processes. Datasets of North Sea infauna, epifauna, and demersal fish (1999–2002) were compiled and analysed to (i) identify andcompare spatial patterns in community structure, and (ii) relate these to environmental variables. The multivariate analyses revealedsignificantly similar large-scale patterns in all three components with major distinctions between a southern community (OysterGround and German Bight), an eastern Channel and southern coastal community, and at least one northern community (.50 mdeep). In contrast, species diversity patterns differed between the components with a diversity gradient for infauna and epifaunadecreasing from north to south, and diversity hotspots of demersal fish, e.g. near the major inflows of Atlantic water. The large-scale hydrodynamic variables were the main drivers for the structuring of communities, whereas sediment characteristics appearedto be less influential, even for the infauna communities. The delineation of ecologically meaningful ecosystem management unitsin the North Sea might be based on the structure of the main faunal ecosystem components.
Keywords: benthic assemblages, community structure, demersal fish, ecosystem management, species diversity.
Received 5 February 2009; accepted 17 October 2009; advance access publication 29 November 2009.
H. Reiss and I. Kroncke: Department of Marine Science, Senckenberg Institute, Sudstrand 40, 26832 Wilhelmshaven, Germany. S. Degraer:Management Unit of the North Sea Mathematical Model, Marine Ecosystem Management Section, Royal Belgian Institute of Natural Sciences,Gulledelle 100, 1200 Brussels, Belgium. G. C. A. Duineveld and M. S. S. Lavaleye: Netherlands Institute of Sea Research, PO Box 59, 1792 ABDen Burg, Texel, The Netherlands. J. Aldridge, J. D. Eggleton, and H. L. Rees: Centre for Environment, Fisheries and Aquaculture Science,Pakefield Road, Lowestoft, Suffolk NR33 0HT, UK. J. A. Craeymeersch: Wageningen IMARES, Institute for Marine Resources and EcosystemStudies, PO Box 77, 4400 AB Yerseke, The Netherlands. H. Hillewaert and G. van Hoey: Institute for Agricultural and Fisheries Research (ILVOFisheries), Ankerstraat 1, 8400 Oostende, Belgium. A. Moll and T. Pohlmann: Institute of Oceanography, Centre for Marine and ClimateResearch (ZMAW), University of Hamburg, Bundesstrasse 53, 20146 Hamburg, Germany. E. Rachor: Alfred-Wegener-Institute for Polar andMarine Research, 27515 Bremerhaven, Germany. M. Robertson: Marine Scotland, Marine Laboratory, PO Box 101, Victoria Road, AberdeenAB11 9DB, UK. E. Vanden Berghe: Flanders Marine Institute (VLIZ), Wandelaarkaai 7, B-8400 Oostende, Belgium; present address: OceanBiogeographic Information System, Rutgers University, 71 Dudley Road, New Brunswick, NJ 08901, USA. Correspondence to H. Reiss: tel: þ494421 9475 266; fax: þ49 4421 9475 222; e-mail: [email protected].
IntroductionThe increasing variety of anthropogenic pressures on the marineenvironment, such as those arising from commercial fisheries,aquaculture, the demand for sustainable energy, and transportroutes, have led to the promotion of holistic ecosystem manage-ment approaches, including spatial management strategies to mini-mize adverse effects on ecosystem structure, function, andprocesses. Understanding the structure of the biological com-ponents and their underlying environmental drivers is an essentialprerequisite for the development of spatial management units onscales relevant to biological and ecological processes becauseusually the delineation of these management units is based solely
on administrative boundaries and social, economic, or politicalfactors (Reiss et al., 2009).
Habitat classification schemes in marine ecosystems have beenbased largely on spatial patterns in abiotic variables, with the under-lying presumption that these patterns would have both physical andbiological significance (Roff et al., 2003; Gregr and Bodtker, 2007).The linkages between environmental and biological variabilityhave to be known, and the environmental variables used withinhabitat classification approaches must be capable of discriminatingvariation in biological patterns (Snelder et al., 2007).
The North Sea is one of the most intensively exploited andstudied marine ecosystems in the world. It is a shelf sea characterized
# 2009 International Council for the Exploration of the Sea. Published by Oxford Journals. All rights reserved.For Permissions, please email: [email protected]
278
by seasonal fluctuations of environmental variables in the shallowersouthern parts and less variable environmental conditions in deeperwater towards the north. The spatial patterns of the benthic fauna ofthe North Sea were first studied by Petersen (1914, 1918), principallyin Danish waters, who identified the key importance of sedimenttype as a structuring force. Further insights into causal influenceson patterns in North Sea macrofauna communities were providedby Stephen (1923) and Ursin (1960). Glemarec (1973) consideredthat the thermal stability of the water column, i.e. the occurrenceand persistence of stratification, was an important explanatory vari-able for structuring benthic communities. Water temperatureregimes broadly matched the limited information then availableon the presence of assemblages in the shallow mixed waters in thesouth, which were distinct from those in the central North Seabetween 50 and 100 m deep, and also from those in the areasdeeper than 100 m to the north (Glemarec, 1973). However, it wasnot until 1986 that a coordinated synoptic survey of the benthicinfauna of the entire North Sea was conducted, allowing a more rig-orous evaluation of distributional patterns against a range ofenvironmental variables (Heip et al., 1992; Kunitzer et al., 1992).
The benthic invertebrate fauna is an important component ofmarine shallow shelf seas with tight bentho-pelagic coupling, suchas the North Sea, where they play a vital role in nutrient cycling, det-rital decomposition, and as a food source for higher trophic levels.Infauna communities are especially suited to comparative studiesof spatial and temporal changes in benthic ecosystems becausemany species are of low mobility and relatively long-lived andhence integrate the effects of environmental change (Pearson andRosenberg, 1978; Gray and Elliott, 2009). In contrast, other faunalcomponents, such as mobile demersal fish or invertebrate epifauna,have the potential to avoid unfavourable environmental conditions,at least on smaller scales, or even benefit from disturbances (Kaiserand Spencer, 1994; Ramsay et al., 1998). Studies of spatial patternsof benthic faunal components in the North Sea have focused onthe structure of invertebrate benthos, i.e. infauna (Heip et al., 1992;Kunitzer et al., 1992; Heip and Craeymeersch, 1995) and epifauna(Frauenheim et al., 1989; Zuhlke et al., 2001; Callaway et al., 2002),whereas less detailed information is available for spatial patterns ofdemersal fish communities (see, e.g., Daan et al., 1990; Greenstreetand Hall, 1996). Only limited effort has been made to examine anyinterrelationships in community structure and functional rolebetween these divergent components (infauna, epifauna, and fish).For example, Callaway et al. (2002) reported on a qualitative com-parison between epifaunal and demersal fish communities in theNorth Sea. A more detailed comparison between these components,which differ in life-cycle traits, mobility, trophic level, and ecologicalniches occupied, should allow further insights to be gained into themajor causal influences of patterns and processes observed.
Therefore, the objectives of this study are to (i) identify andcompare the spatial community patterns of infauna, epifauna,and demersal fish of the North Sea using univariate and multi-variate analyses, and (ii) relate spatial patterns of the different eco-system components to environmental variables to gain an insightinto the large-scale driving forces and the functional similaritiesand differences between them.
Material and methodsSampling and sample processingThe infauna data were compiled and processed within the frame-work of the ICES North Sea Benthos Project 2000 (NSBP 2000;
Rees et al., 2007). Although quasi-synoptic sampling was intendedfor late spring to summer in 2000, several regions of the North Seacould only be covered by including material from adjacent seasonsor years (from 1999 to 2002). Most of the infauna sampling forNSBP 2000 was conducted with a 0.1 m2 van Veen grab; Dutchand Scottish samples were obtained with boxcorers, and Englishsamples mostly with a 0.1 m2 Day or Hamon grab, dependingon the sediment type. Samples were sieved over a mesh of1 mm, before fixation with 4% formaldehyde, except for parts ofthe samples from Belgian waters, where they were fixed beforesieving (Degraer et al., 2007). All infauna data were standardizedto 1 m2. Generally, two or three replicates per station weretaken. In total, 808 stations were occupied in this study. A moredetailed description of the methods used for sampling and proces-sing the infauna is given in Rees et al. (2007).
The epifauna data were collected at 255 stations in summer2000 (Callaway et al., 2002). Samples were taken with a 2-mbeam trawl with a chain mat attached. The mesh size of the netwas 20 mm, and a liner of 4 mm knotless mesh was fitted insidethe codend. After contact with the seabed, the beam trawl wastowed at �1 knot for 5 min. To estimate the towing distanceand, therefore, the sampled area, a net probe was fixed to the head-line of the trawl to determine the exact point in time when the geartouched and left the bottom. Further details of the gear and thesampling procedure are given in Jennings et al. (1999), Zuhlkeet al. (2001), and Callaway et al. (2002). From the informationon towing distances, all data were standardized to a sampledarea of 500 m2. Colonial organisms, infaunal species, and pelagicfish species were excluded from the quantitative analysis.
The data for the demersal fish fauna were extracted from theICES International Bottom Trawl Survey (IBTS) database. Themain objective of the IBTS is to monitor the distribution and rela-tive abundance of demersal fish species in the North Sea (ICES,2006). The standard gear used within the IBTS is a GrandeOuverture Verticale (GOV) trawl. The height of the gear’s verticalopening was some 4.5–5 m, with a wingspread of �20 m depend-ing on water depth. The net was equipped with 20-cm-diameterrubber disc groundgear in the bosom, 10 cm rubber discs in thenet wings, with iron discs fixed between them. The codend con-tained a liner of 20 mm mesh. The standard towing time was30 min at a target speed of 4 knots over the ground. All catchdata were standardized to a tow duration of 60 min (catch perunit effort). The standardization to 60 min has historical reasonsbecause all nations fished for 60 min before 1976 (Heessen et al.,1997). Since 1999, all nations fish for 30 min, so a comparisonof species composition and diversity measures is possible,although diversity will be underestimated because of the one-sidedraising of abundance values. Detailed characteristics of the stan-dard GOV and of the sampling procedure are given in ICES(2006). Only data collected in summer 2000 (quarter 3) wereused; 316 stations in all. Pelagic fish species caught were omittedfrom the analysis.
The environmental variables used were depth, sediment charac-teristics (% mud, sand, and gravel), average water temperature andsalinity (winter and summer), stratification of the water column,chlorophyll content of the surface water column, tidal stress, andpeak wave stress.
Most NSBP 2000 data contributors collected information onsediment granulometry during the infauna surveys, but pro-cedures were not standardized, so all sediment datasets were col-lated into a uniform database. The datasets for which fractional
Spatial patterns of infauna, epifauna, and demersal fish communities in the North Sea 279

data were available were reprocessed to yield uniformly calculatedmeans, sorting coefficients, and descriptive assessments. Theprogram GRADISTAT, version 4.0 (Blott and Pye, 2001) wasused for analyses. The final dataset contains percentages for mudcontent (grain size ,63 mm), sand (63–2000 mm), gravel(.2000 mm), median grain size, and sediment sorting coefficient,except the data for the Dutch continental shelf, for which onlymedian grain size and mud content were available.
Data on temperature and salinity were derived from the hydro-dynamic HAMburg Shelf Ocean Model (HAMSOM), which is athree-dimensional, baroclinic primitive equation for simulationsof oceanic and coastal and shelf sea dynamics (Backhaus, 1985).It has a horizontal resolution of 12 min of latitude and 20 minof longitude, and a vertical resolution of a maximum of 19layers. For details about the specific HAMSOM application, seePohlmann (1996).
The ECOlogical North Sea Model HAMburg (ECOHAM1) wasused to estimate the primary production of the water column.ECOHAM1 is a model that can be used to calculate annual andlong-term phytoplankton dynamics, nutrient transport, andprimary productivity for shelf seas in a three-dimensional physicalenvironment (Skogen and Moll, 2005). It is based on a simplephosphorus/nitrogen cycle and takes four state variables intoaccount, three pelagic variables [phytoplankton, phosphate(DIP), and nitrogen (DIN)], and one for benthic detritus. Thehorizontal grid size of the numerical model is 20 � 20 km, the ver-tical resolution is 5 m for the upper 50 m, and increasing layerthickness below 50 m up to a maximum of 19 layers. TheECOHAM1 model was validated using observed chlorophyll(Moll, 1998), phosphate concentrations (Moll, 2000), andprimary production values (Skogen and Moll, 2000).
Tidal parameters were generated using a three-dimensionalhydrodynamic model (Davies and Aldridge, 1993), run indepth-integrated form on an �3.5-km resolution grid coveringthe European continental shelf. Average and peak wave stresswere calculated from a 1-year model run covering the periodSeptember 1999 to September 2000, on an �12-km grid, usingthe WAM spectral wave model run at the ProudmanOceanographic Laboratory (Osuna and Wolf, 2005). The stratifi-cation parameter S was derived from the formulation presentedin Pingree and Griffiths (1978), using modelled M2 tidal velocitiesand measured depths at the benthic stations.
Data analysisAs a measure of diversity, we calculated species number,Shannon–Wiener Index (H0), Hurlbert index (expected numberof species in 50 individuals; ES50), and Pielou’s evenness (J0).Inverse distance weighted interpolation (ArcGIS 9.0) was usedfor mapping univariate faunal variables. Interrelationship amongthe univariate variables of the infauna, epifauna, and fish commu-nities, such as diversity measures and abundance, and betweenenvironmental and univariate faunal variables were tested usingPearson product-moment correlation.
To permit direct comparison of the spatial patterns of thedifferent components, the datasets (infauna, epifauna, and fish)were reduced to stations with matching position or at least pos-itions relatively close to each other (Rees et al., 2007). Thenearest stations were determined using GIS software (ArcView3.1), and a dataset was created including only stations up to amaximum distance of 21 nautical miles apart (a total of 130matching stations). This distance was chosen because most of
the station combinations were below this value, and an extensionof the distance would have included stations with a distance abovethe edge-length of an ICES rectangle (30 nautical miles), whichwas originally set as the maximum distance. In cases where morethan one station was situated within the 21-nautical mile zone,the nearest station was chosen.
Multivariate ordination methods were applied to analyse thecommunity structure of the infauna, epifauna, and demersalfish, and the relationship between community structure andenvironmental variables. Hierarchical cluster analysis was carriedout with the statistical package PRIMER 6 (Clarke and Warwick,1994), using fourth-root transformed abundance data and theBray–Curtis similarity index with a group average method oflinkage. For the community analyses of infauna, epifauna, andfish, the complete station grids were used. Only stations withinclusters of more than five stations or very distinctive clusterswith more than three stations were used for further analyses, redu-cing the number of stations for infauna from 808 to 728, for epi-fauna from 255 to 217, and for fish from 316 to 303. SIMPER(Primer statistical package) was applied to identify characteristicspecies of the communities.
The similarity among the community structures was testedusing the RELATE routine in PRIMER 6, based on the reduceddatasets. Different transformation types were used (presence/absence, fourth-root, and no transformation) to explore the rela-tive importance of abundant or rare species. The relationshipbetween environmental variables and community structure wasevaluated by calculating Spearman rank correlations between thesimilarity matrices, using the BIOENV routine of PRIMER. Thesimilarity matrix for the environmental variables was calculatedusing normalized Euclidean distance.
Additional multivariate analyses were performed based onabundance data using CANOCO 4.5 (ter Braak and Smilauer,1998). The gradient length was determined using detrended corre-spondence analysis. The length of gradient expressed in standarddeviation (s.d.) units is a measure of how unimodal the speciesresponses are along an ordination axis. As all values were.3.5 s.d., subsequent analyses were based on unimodal species-response models (Jongman et al., 1995; ter Braak and Smilauer,1998). Therefore, the relationship between the community struc-ture of the faunal components and environmental variables wasanalysed further via canonical correspondence analysis (CCA).Forward selection was performed to order the environmental vari-ables according to the amount of variance they captured in thespecies data (ter Braak and Verdonschot, 1995). Statistical signifi-cance was tested using a Monte Carlo permutation test (999unrestricted permutations).
ResultsIn all, 489 infauna, 280 free-living epifauna, and 62 demersal fishspecies were recorded.
Abundance and diversity patternsHigh values of abundance for all three ecosystem components werefound in the coastal areas of the southern North Sea (Figure 1a–c).A contrasting pattern was found for fish and epifauna abundance,with the highest values in the eastern parts for epifauna, and in thewestern parts for demersal fish (Figure 1). There was no significantcorrelation for the abundances of infauna, epifauna, and demersalfish (Table 1).
280 H. Reiss et al.
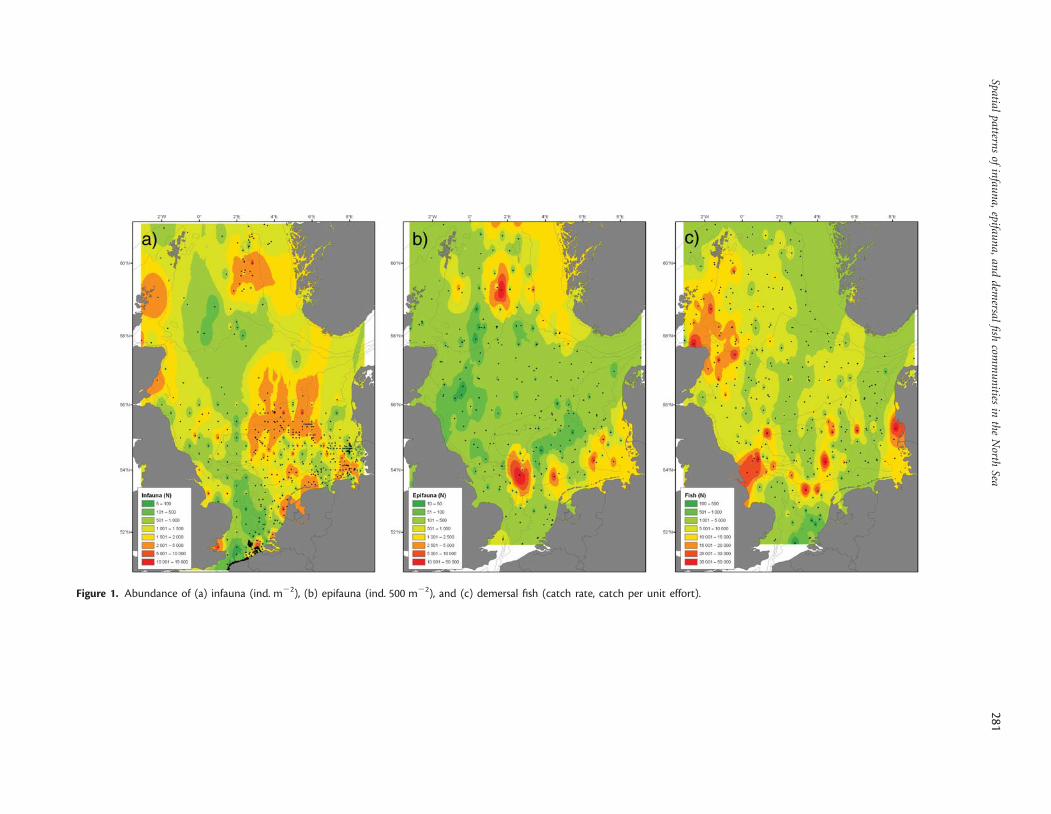
Figure 1. Abundance of (a) infauna (ind. m22), (b) epifauna (ind. 500 m22), and (c) demersal fish (catch rate, catch per unit effort).
Spatialpattern
sof
infau
na,
epifaun
a,an
dd
emersal
fish
comm
un
itiesin
the
North
Sea281
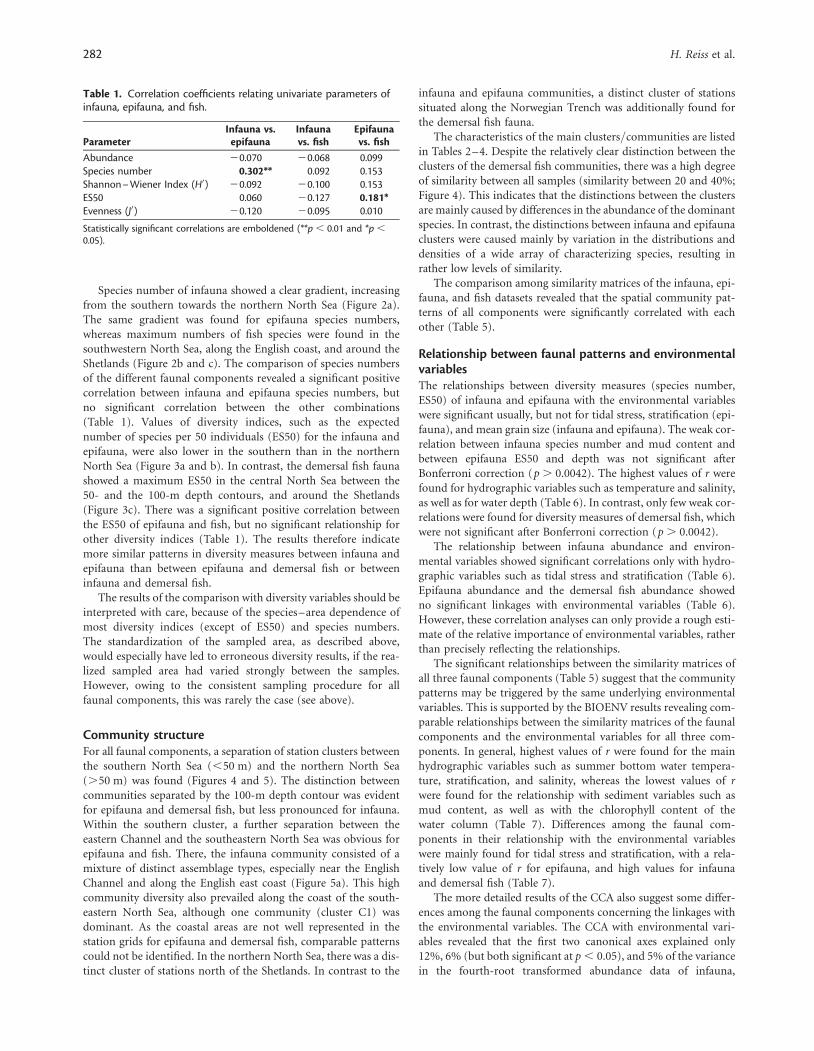
Species number of infauna showed a clear gradient, increasingfrom the southern towards the northern North Sea (Figure 2a).The same gradient was found for epifauna species numbers,whereas maximum numbers of fish species were found in thesouthwestern North Sea, along the English coast, and around theShetlands (Figure 2b and c). The comparison of species numbersof the different faunal components revealed a significant positivecorrelation between infauna and epifauna species numbers, butno significant correlation between the other combinations(Table 1). Values of diversity indices, such as the expectednumber of species per 50 individuals (ES50) for the infauna andepifauna, were also lower in the southern than in the northernNorth Sea (Figure 3a and b). In contrast, the demersal fish faunashowed a maximum ES50 in the central North Sea between the50- and the 100-m depth contours, and around the Shetlands(Figure 3c). There was a significant positive correlation betweenthe ES50 of epifauna and fish, but no significant relationship forother diversity indices (Table 1). The results therefore indicatemore similar patterns in diversity measures between infauna andepifauna than between epifauna and demersal fish or betweeninfauna and demersal fish.
The results of the comparison with diversity variables should beinterpreted with care, because of the species–area dependence ofmost diversity indices (except of ES50) and species numbers.The standardization of the sampled area, as described above,would especially have led to erroneous diversity results, if the rea-lized sampled area had varied strongly between the samples.However, owing to the consistent sampling procedure for allfaunal components, this was rarely the case (see above).
Community structureFor all faunal components, a separation of station clusters betweenthe southern North Sea (,50 m) and the northern North Sea(.50 m) was found (Figures 4 and 5). The distinction betweencommunities separated by the 100-m depth contour was evidentfor epifauna and demersal fish, but less pronounced for infauna.Within the southern cluster, a further separation between theeastern Channel and the southeastern North Sea was obvious forepifauna and fish. There, the infauna community consisted of amixture of distinct assemblage types, especially near the EnglishChannel and along the English east coast (Figure 5a). This highcommunity diversity also prevailed along the coast of the south-eastern North Sea, although one community (cluster C1) wasdominant. As the coastal areas are not well represented in thestation grids for epifauna and demersal fish, comparable patternscould not be identified. In the northern North Sea, there was a dis-tinct cluster of stations north of the Shetlands. In contrast to the
infauna and epifauna communities, a distinct cluster of stationssituated along the Norwegian Trench was additionally found forthe demersal fish fauna.
The characteristics of the main clusters/communities are listedin Tables 2–4. Despite the relatively clear distinction between theclusters of the demersal fish communities, there was a high degreeof similarity between all samples (similarity between 20 and 40%;Figure 4). This indicates that the distinctions between the clustersare mainly caused by differences in the abundance of the dominantspecies. In contrast, the distinctions between infauna and epifaunaclusters were caused mainly by variation in the distributions anddensities of a wide array of characterizing species, resulting inrather low levels of similarity.
The comparison among similarity matrices of the infauna, epi-fauna, and fish datasets revealed that the spatial community pat-terns of all components were significantly correlated with eachother (Table 5).
Relationship between faunal patterns and environmentalvariablesThe relationships between diversity measures (species number,ES50) of infauna and epifauna with the environmental variableswere significant usually, but not for tidal stress, stratification (epi-fauna), and mean grain size (infauna and epifauna). The weak cor-relation between infauna species number and mud content andbetween epifauna ES50 and depth was not significant afterBonferroni correction (p . 0.0042). The highest values of r werefound for hydrographic variables such as temperature and salinity,as well as for water depth (Table 6). In contrast, only few weak cor-relations were found for diversity measures of demersal fish, whichwere not significant after Bonferroni correction (p . 0.0042).
The relationship between infauna abundance and environ-mental variables showed significant correlations only with hydro-graphic variables such as tidal stress and stratification (Table 6).Epifauna abundance and the demersal fish abundance showedno significant linkages with environmental variables (Table 6).However, these correlation analyses can only provide a rough esti-mate of the relative importance of environmental variables, ratherthan precisely reflecting the relationships.
The significant relationships between the similarity matrices ofall three faunal components (Table 5) suggest that the communitypatterns may be triggered by the same underlying environmentalvariables. This is supported by the BIOENV results revealing com-parable relationships between the similarity matrices of the faunalcomponents and the environmental variables for all three com-ponents. In general, highest values of r were found for the mainhydrographic variables such as summer bottom water tempera-ture, stratification, and salinity, whereas the lowest values of rwere found for the relationship with sediment variables such asmud content, as well as with the chlorophyll content of thewater column (Table 7). Differences among the faunal com-ponents in their relationship with the environmental variableswere mainly found for tidal stress and stratification, with a rela-tively low value of r for epifauna, and high values for infaunaand demersal fish (Table 7).
The more detailed results of the CCA also suggest some differ-ences among the faunal components concerning the linkages withthe environmental variables. The CCA with environmental vari-ables revealed that the first two canonical axes explained only12%, 6% (but both significant at p , 0.05), and 5% of the variancein the fourth-root transformed abundance data of infauna,
Table 1. Correlation coefficients relating univariate parameters ofinfauna, epifauna, and fish.
ParameterInfauna vs.
epifaunaInfaunavs. fish
Epifaunavs. fish
Abundance 20.070 20.068 0.099Species number 0.302** 0.092 0.153Shannon–Wiener Index (H0) 20.092 20.100 0.153ES50 0.060 20.127 0.181*Evenness (J0) 20.120 20.095 0.010
Statistically significant correlations are emboldened (**p , 0.01 and *p ,
0.05).
282 H. Reiss et al.
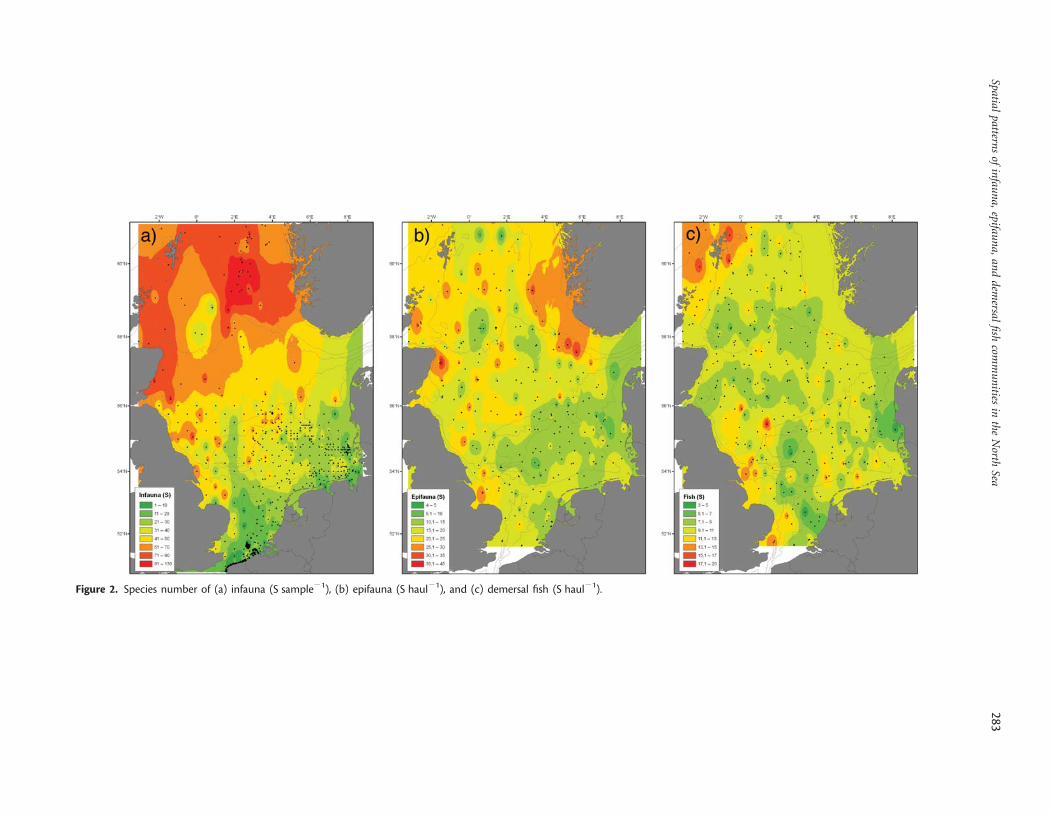
Figure 2. Species number of (a) infauna (S sample21), (b) epifauna (S haul21), and (c) demersal fish (S haul21).
Spatialpattern
sof
infau
na,
epifaun
a,an
dd
emersal
fish
comm
un
itiesin
the
North
Sea283
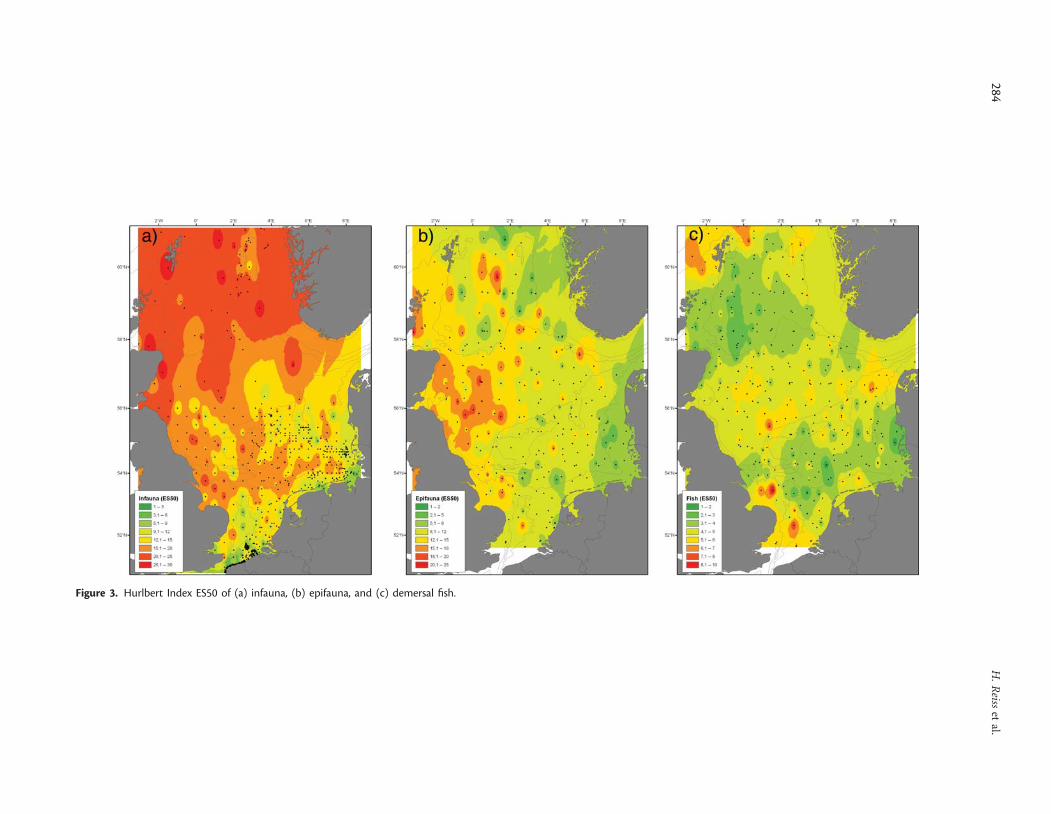
Figure 3. Hurlbert Index ES50 of (a) infauna, (b) epifauna, and (c) demersal fish.
284H
.R
eisset
al.

epifauna, and fish, respectively. The forward selection showed thatmost variables significantly explained the variance in the infaunaabundance data as sole predictors (marginal effects) and werealso significantly stepwise included in the CCA model (conditionaleffects; Table 8). In contrast, just depth, mud content, and summertemperature were significantly included in the model for epifaunaabundance, and only winter temperature for demersal fish abun-dance (Table 8).
DiscussionWe have compared the spatial patterns of infauna, epifauna, anddemersal fish community structure and linked the patterns withenvironmental factors. The multivariate analyses revealed the pres-ence of similar large-scale patterns of infauna, epifauna, anddemersal fish community structure, with major distinctionsbetween a southern community (including the Oyster Groundand the German Bight), an eastern Channel and southerncoastal community, and at least one northern community
(.50 m deep), evident in all three components. Also, the direct(multivariate) comparison of the community structure revealeda significant similarity among infauna, epifauna, and demersalfish, suggesting that similar underlying environmental variablesmay be influencing the community patterns. However, therelationships between community patterns and available environ-mental variables differed appreciably among components andwere always relatively weak for fish community structure.
Species diversityThe intercomparison of univariate measures such as abundanceand diversity measures for the different faunal components gener-ally revealed no significant correlations. Only the patterns of speciesnumbers between the infauna and epifauna were highly signifi-cantly correlated. However, because of differences in the samplingprocedures within the infaunal dataset (Rees et al., 2007), the lowand partly unknown catch efficiency of the 2-m beam trawl andthe GOV (Ehrich et al., 2004; Reiss et al., 2006), and the area
Figure 4. Schematic cluster dendrogram and groupings shown in Figure 5 revealed with fourth-root transformed abundance data of(a) infauna (n ¼ 808), (b) epifauna (n ¼ 255), and (c) demersal fish (n ¼ 316).
Spatial patterns of infauna, epifauna, and demersal fish communities in the North Sea 285

Figure 5. Distribution of (a) infauna, (b) epifauna, and (c) fish assemblages in the North Sea according to cluster analyses with fourth-root transformed abundance data (Figure 4). For furtherdetails concerning the infauna community, see Rachor et al. (2007).
286H
.R
eisset
al.
dependence of diversity measures, a station-by-station comparisonis expected to be relatively inaccurate (see also Greenstreet and Piet,2008). For example, the relationship between sampled area and epi-faunal species numbers differs depending on the region within theNorth Sea (HR, unpublished data). Nevertheless, the lower speciesnumber and richness in the southern than in the northern NorthSea found for infauna and epifauna was consistent with theresults of previous studies (e.g. Frauenheim et al., 1989; Heip
et al., 1992; Callaway et al., 2002). This gradient was even more con-spicuous for the diversity of sessile epibenthic species (Callawayet al., 2002), which were excluded from the present study.However, the north–south gradient was not found for demersalfish, with maximum species number near major Atlantic inflowssuch as the Fair Isles and East Shetland in the north, and theEnglish Channel in the south. This pattern indicates that immigra-tion from adjacent regions into the North Sea is an important
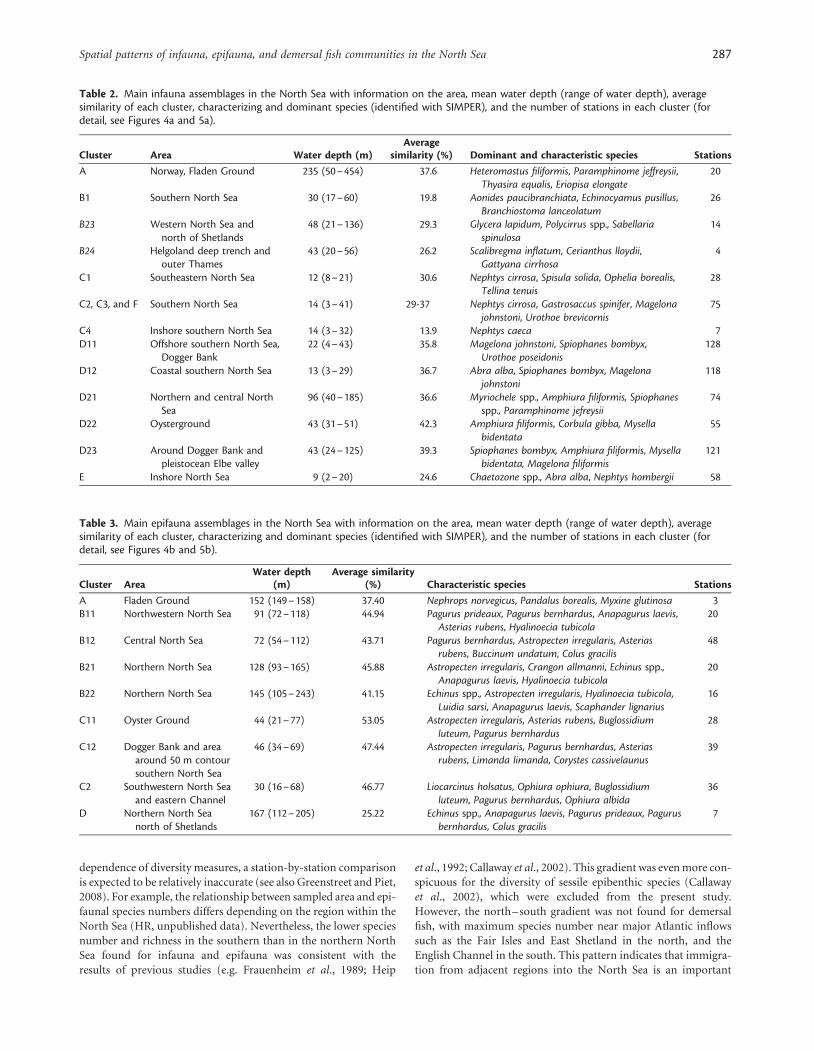
Table 2. Main infauna assemblages in the North Sea with information on the area, mean water depth (range of water depth), averagesimilarity of each cluster, characterizing and dominant species (identified with SIMPER), and the number of stations in each cluster (fordetail, see Figures 4a and 5a).
Cluster Area Water depth (m)Average
similarity (%) Dominant and characteristic species Stations
A Norway, Fladen Ground 235 (50–454) 37.6 Heteromastus filiformis, Paramphinome jeffreysii,Thyasira equalis, Eriopisa elongate
20
B1 Southern North Sea 30 (17–60) 19.8 Aonides paucibranchiata, Echinocyamus pusillus,Branchiostoma lanceolatum
26
B23 Western North Sea andnorth of Shetlands
48 (21–136) 29.3 Glycera lapidum, Polycirrus spp., Sabellariaspinulosa
14
B24 Helgoland deep trench andouter Thames
43 (20–56) 26.2 Scalibregma inflatum, Cerianthus lloydii,Gattyana cirrhosa
4
C1 Southeastern North Sea 12 (8– 21) 30.6 Nephtys cirrosa, Spisula solida, Ophelia borealis,Tellina tenuis
28
C2, C3, and F Southern North Sea 14 (3– 41) 29-37 Nephtys cirrosa, Gastrosaccus spinifer, Magelonajohnstoni, Urothoe brevicornis
75
C4 Inshore southern North Sea 14 (3– 32) 13.9 Nephtys caeca 7D11 Offshore southern North Sea,
Dogger Bank22 (4– 43) 35.8 Magelona johnstoni, Spiophanes bombyx,
Urothoe poseidonis128
D12 Coastal southern North Sea 13 (3– 29) 36.7 Abra alba, Spiophanes bombyx, Magelonajohnstoni
118
D21 Northern and central NorthSea
96 (40–185) 36.6 Myriochele spp., Amphiura filiformis, Spiophanesspp., Paramphinome jefreysii
74
D22 Oysterground 43 (31–51) 42.3 Amphiura filiformis, Corbula gibba, Mysellabidentata
55
D23 Around Dogger Bank andpleistocean Elbe valley
43 (24–125) 39.3 Spiophanes bombyx, Amphiura filiformis, Mysellabidentata, Magelona filiformis
121
E Inshore North Sea 9 (2– 20) 24.6 Chaetozone spp., Abra alba, Nephtys hombergii 58
Table 3. Main epifauna assemblages in the North Sea with information on the area, mean water depth (range of water depth), averagesimilarity of each cluster, characterizing and dominant species (identified with SIMPER), and the number of stations in each cluster (fordetail, see Figures 4b and 5b).
Cluster AreaWater depth
(m)Average similarity
(%) Characteristic species Stations
A Fladen Ground 152 (149– 158) 37.40 Nephrops norvegicus, Pandalus borealis, Myxine glutinosa 3B11 Northwestern North Sea 91 (72–118) 44.94 Pagurus prideaux, Pagurus bernhardus, Anapagurus laevis,
Asterias rubens, Hyalinoecia tubicola20
B12 Central North Sea 72 (54–112) 43.71 Pagurus bernhardus, Astropecten irregularis, Asteriasrubens, Buccinum undatum, Colus gracilis
48
B21 Northern North Sea 128 (93–165) 45.88 Astropecten irregularis, Crangon allmanni, Echinus spp.,Anapagurus laevis, Hyalinoecia tubicola
20
B22 Northern North Sea 145 (105– 243) 41.15 Echinus spp., Astropecten irregularis, Hyalinoecia tubicola,Luidia sarsi, Anapagurus laevis, Scaphander lignarius
16
C11 Oyster Ground 44 (21–77) 53.05 Astropecten irregularis, Asterias rubens, Buglossidiumluteum, Pagurus bernhardus
28
C12 Dogger Bank and areaaround 50 m contoursouthern North Sea
46 (34–69) 47.44 Astropecten irregularis, Pagurus bernhardus, Asteriasrubens, Limanda limanda, Corystes cassivelaunus
39
C2 Southwestern North Seaand eastern Channel
30 (16–68) 46.77 Liocarcinus holsatus, Ophiura ophiura, Buglossidiumluteum, Pagurus bernhardus, Ophiura albida
36
D Northern North Seanorth of Shetlands
167 (112– 205) 25.22 Echinus spp., Anapagurus laevis, Pagurus prideaux, Pagurusbernhardus, Colus gracilis
7
Spatial patterns of infauna, epifauna, and demersal fish communities in the North Sea 287

factor in structuring fish diversity (Greenstreet and Piet, 2008).Additionally, high fish species diversity in terms of ES50 wasfound across the central North Sea between 50 and 100 m deep,similar to the patterns found by Greenstreet and Piet (2008)based on diversity indices N1 and N2. The greater diversity inthe central North Sea, situated between the two main communitiesin the south and the north, might be attributable to an overlap ofdistributions of the northern and southern fish species there.However, the differences in the patterns of species diversitybetween the three ecosystem components, in contrast to the signifi-cant match in terms of community structure, indicate that differentprocesses may be influencing species diversity patterns on the onehand and community structure on the other. This is also shown bythe correlations between environmental variables and univariatefaunal parameters, which identified contrasting results forinfauna and fish diversity (Table 6).
Community structureThe spatial patterns we observed in infaunal community structurelargely match the results of earlier studies. The main division ofthe infauna in the North Sea was between the deeper northernand shallower southern parts (Glemarec, 1973; Kunitzer et al.,1992; Heip and Craeymeersch, 1995), with the 50-m contour as a
boundary for both epifauna and demersal fish (Figure 5).Therefore, this boundary in the central North Sea seems to existfor the majority of benthic ecosystem components (see also Daanet al., 1990; Greenstreet and Hall, 1996; Callaway et al., 2002; Reisset al., 2003; Fraser et al., 2008; Neumann et al., 2008; Ehrich et al.,2009), as well as for planktonic components (Fransz et al., 1991;Williams et al., 1993; Krause et al., 1995). Another distinct commu-nity evident in all three benthic components was found near theDover Strait and along the eastern English coast. However, for theinfauna, that community was characterized by several divergentassemblages, most likely reflecting the relatively heterogeneousseabed substrata in the area. Rachor et al. (2007) showed that theinfauna communities farther south in the eastern English Channelare distinct from all other communities in the North Sea. For epi-fauna and demersal fish, a clear separation between communitiesin the central North Sea and north of the 100-m contour wasevident. This differentiation in the northern North Sea was alsofound in previous infauna studies, but was not so clear for theinfauna in this study, perhaps because of the relatively few samplingstations in the northern North Sea compared with previous studies(Figure 5). However, differentiation of infauna communities wasevident at lower similarity levels as well as using Twinspan analysis(Rachor et al., 2007). A distinct community near the Shetlands,for epifauna and demersal fish, was also not apparent in theinfauna data, which might have been caused by the inadequatenumber of infauna stations sampled there (Figure 5).
In some previous analyses (e.g. of epifauna; Callaway et al.,2002), presence/absence transformation was used, which ignoresthe abundance of species. In this study, the fourth-root transform-ation was chosen to include both abundant and rare species.However, especially in terms of demersal fish fauna, a fewspecies are dominant, and less abundant species hardly contributeto the assemblage structure. Therefore, the abundant fish speciesare still the most important for the assemblage patterns foundhere.
Table 4. Main fish assemblages in the North Sea with information on the area, the mean water depth (range of water depth), the averagesimilarity of each cluster, characterizing and dominant species (identified with SIMPER), and number of stations in the cluster (details seeFigures 4c and 5c).
Cluster AreaWater depth
(m)Average
similarity (%) Characteristic species Stations
B1 Western central North Sea 75 (51–94) 66.61 Merlangius merlangus, Melanogrammus aeglefinus,Limanda limanda, Eutrigla gurnardus
8
B21 Northwestern North Sea 92 (50–120) 75.92 Melanogrammus aeglefinus, Merlangius merlangus,Microstomus kitt, Limanda limanda
22
B22 Central North Sea 75 (43–111) 87.86 Melanogrammus aeglefinus, Merlangius merlangus,Limanda limanda, Hippoglossus platessoides
82
B23 East of Dogger Bank around50 m contour
45 (37–58) 76.92 Limanda limanda, Merlangius merlangus, Melanogrammusaeglefinus, Eutrigla gurnardus
12
B3 Northern North Sea mainly.100 m
122 (85–153) 71.07 Melanogrammus aeglefinus, Merlangius merlangus,Hippoglossus platessoides, Gadus morhua
60
B4 Northern North Sea,Shetlands
150 (96–209) 65.11 Melanogrammus aeglefinus, Hippoglossus platessoides,Eutrigla gurnardus, Merlangius merlangus
13
C Mainly near NorwegianTrench
157 (132 –228) 62.22 Melanogrammus aeglefinus, Pollachius virens, Hippoglossusplatessoides, Merlangius merlangus
12
D11 Oysterground andsouthwestern North Sea
42 (36–48) 68.16 Merlangius merlangus, Limanda limanda, Eutriglagurnardus, Pleuronectes platessa
35
D12 Dogger Bank and coastalsoutheastern North Sea
35 (21–58) 65.80 Limanda limanda, Eutrigla gurnardus, Merlangiusmerlangus, Pleuronectes platessa
40
D2 Southwestern North Seaand Channel
32 (24–39) 60.19 Merlangius merlangus, Limanda limanda, Trachinus vipera,Pleuronectes platessa
19
Table 5. Correlation coefficients relating the similarity matrices ofinfauna, epifauna, and demersal fish communities for differenttransformation types (RELATE).
TransformationInfauna vs.
epifaunaInfauna vs.
fishEpifauna vs.
fish
Fourth-root 0.410** 0.568** 0.495**Presence/absence 0.386** 0.502** 0.369**No transformation 0.252** 0.332** 0.250**
Statistically significant correlations are emboldened (**p , 0.01).
288 H. Reiss et al.

Spatial patterns related to external environmentaldriversFor community structures on the scale of the whole North Sea, themost influential environmental variables appeared to be hydro-graphic variables such as bottom water temperature, bottomwater salinity, and tidal stress (for the infauna). In particular,bottom water temperature has a strong influence on the commu-nity structure of all three faunal components, as indicated by theresults of the BIOENV and CCA analysis. Although the stratifica-tion parameter was not significantly correlated with the commu-nity structure, it is nevertheless expected to be an importantdeterminant of spatial variation in bottom temperature (see alsoHeip and Craeymeersch, 1995; Callaway et al., 2002). Therefore,the main boundary between the faunal communities along the50-m contour also reflects the boundary between the thermallystratified waters to the north and the more or less permanentlymixed waters to the south (Brown et al., 1999). The influence ofdifferent water masses in the North Sea may also determine thefaunal community structures. The main inflow of Atlantic waterinto the northern North Sea is via the Fair Isle current to thewest, and the East Shetland and the Norwegian Trench inflow tothe east (Turrell, 1992). The community patterns of epifaunaand demersal fish in the northern North Sea closely mirror thiscurrent regime, with a separation approximately along the100-m contour into an eastern and a western community
(Figure 5). Distinct communities were also found near theeastern English Channel, corresponding to the inflow of Atlanticwater to the south. Significant linkages between the differentwater masses and the fish community patterns in the North Seawere found by Ehrich et al. (2009) across different mesoscaleareas in the North Sea. In contrast, sediment characteristicsexpressed as mud content appeared to be less influential, evenfor the infauna communities, which would be expected to bemore closely dependent on them than the more mobile epifaunaland demersal fish fauna. It is also important to recognize practicalconstraints on the facility to quantify environmental variability soas to represent realistically the habitats within or over which thefaunal components are sampled. For example, sediment typededuced from a 0.1-m2 grab sample used for collecting theinfauna should provide a realistic habitat descriptor for all theorganisms in that sample. However, it may be completelyinadequate to describe the sedimentary environment along theentirety of epifaunal or fish trawl tows. Therefore, although itseems biologically plausible to anticipate a reduced dependenceof motile epifaunal and fish species on substratum type, sedimentdescriptors from the infauna survey alone are too narrowly definedto demonstrate this, other than in homogeneous areas. Also, othermeasures such as sorting coefficients may better describe thedynamic nature of the seabed environment, so may link moreclosely with measures such as tidal stress, which was an influentialvariable in this study (see also Rees et al., 1999).
The relative influence of environmental factors on the structureof communities depends on the spatial scale and the environ-mental gradients under consideration (Menge and Olson, 1990;McArdle et al., 1997; Thrush et al., 1997). Therefore, the relation-ship we observed between environmental variables and faunalstructure seems to be valid on a North Sea-wide scale, but lessso on a smaller spatial scale. Sediment characteristics were themost important variables affecting infaunal community structurein the southwestern North Sea (van Hoey et al., 2004;Schratzberger et al., 2006), and epifaunal community structurein the southern North Sea (Rees et al., 1999; Callaway et al.,2002). Moreover, in the southwestern North Sea, the influenceof sediment characteristics on community structure was lesspronounced or even absent for the epifauna and fish fauna,compared with the infauna (Schratzberger et al., 2006). Hence,on a regional or local spatial scale, the community structure of
Table 6. Correlation coefficients relating univariate community attributes and environmental variables.
Parameter
Abundance Species number ES50
Infauna Epifauna Fish Infauna Epifauna Fish Infauna Epifauna Fish
Depth (130) 20.075 20.001 20.008 0.646** 0.354** 0.034 0.634** 0.187* b 0.006Tidal stress (130) 20.265** 20.009 20.042 20.369** 0.064 20.042 20.321** 0.039 0.241** b
Mean wave stress (130) 0.092 20.009 0.039 20.418** 20.322** 20.148 20.382** 20.329** 20.185* b
Peak wave stress (130) 0.153 20.031 0.031 20.404** 20.384** 20.108 20.390** 20.352** 20.158Salinity winter (129) 0.145 20.011 0.063 0.676** 0.316** 0.164 0.543** 0.356** 0.081Salinity summer (129) 0.118 20.027 0.083 0.660** 0.351** 0.155 0.517** 0.382** 0.095Temperature winter (129) 0.066 20.041 20.025 0.560** 0.333** 0.115 0.418** 0.375** 0.178* b
Temperature summer (129) 20.114 0.033 20.105 20.751** 20.344** 20.170 20.630** 20.329** 20.027Stratification coefficient (130) 0.268** 20.040 0.036 0.433** 20.028 0.027 0.353** 0.065 20.150Mean grain size (72) 0.091 20.027 20.124 20.010 0.032 20.313** 0.016 20.001 0.079Mud content (96) 0.029 20.064 0.128 0.221*b 0.092 0.128 0.293** 0.059 20.223* b
Chlorophyll (129) 0.087 0.043 20.075 20.452** 20.371** 20.077 20.325** 20.412** 20.245** b
The number of stations compared is shown in parenthesis. Statistically significant correlations are emboldened (**p , 0.01 and *p , 0.05; bnot significantafter Bonferroni correction, p , 0.00417).
Table 7. Correlation coefficients (r) relating community structure(abundance data) and the environmental variables revealed withBIOENV (99 stations compared).
Parameter Infauna (r) Epifauna (r) Fish (r)
Depth 0.409 0.700 0.505Tidal stress 0.515 0.141 0.381Mean wave stress 0.352 0.290 0.431Peak wave stress 0.220 0.180 0.266Stratification 0.537 0.135 0.410Salinity winter 0.470 0.424 0.531Salinity summer 0.434 0.416 0.487Temperature winter 0.405 0.462 0.481Temperature summer 0.526 0.582 0.631Chlorophyll 0.290 0.358 0.361Mud 0.163 0.204 0.038
Spatial patterns of infauna, epifauna, and demersal fish communities in the North Sea 289

Table 8. Results of CCA for infauna, epifauna, and demersal fish based on fourth-root transformed abundance data.
Parameter Axis 1 Axis 2 Axis 3
InfaunaEigenvalue 0.490 0.397 0.253Species-environment correlation 0.966 0.881 0.901Cumulative % variance
of species data 6.6 11.9 15.3of species environmental relationship 23.7 42.9 55.1
EpifaunaEigenvalue 0.305 0.225 0.163Species-environment correlation 0.716 0.741 0.702Cumulative % variance
of species data 3.7 6.3 8.3of species environmental relationship 24.3 42.1 55.1
FishEigenvalue 0.079 0.041 0.027Species-environment correlation 0.520 0.477 0.363Cumulative % variance
of species data 3.5 5.3 6.5of species environmental relationship 34.3 52.1 63.7
Marginal Conditional
l1 p-value la p-value
InfaunaTemperature summer 0.44 0.001 0.44 0.001Depth 0.42 0.001 0.18 0.001Salinity winter 0.41 0.001 0.13 0.001Temperature winter 0.41 0.001 0.14 0.001Stratification 0.40 0.001 0.38 0.001Salinity summer 0.40 0.001 0.09 0.094Tidal stress 0.37 0.001 0.15 0.001Chlorophyll 0.37 0.001 0.11 0.002Mean wave stress 0.36 0.001 0.13 0.002Mud 0.27 0.001 0.21 0.001Peak wave stress 0.26 0.001 0.11 0.013
EpifaunaDepth 0.26 0.001 0.26 0.001Mud 0.21 0.001 0.15 0.004Temperature summer 0.20 0.001 0.16 0.003Temperature winter 0.20 0.001 0.08 0.553Chlorophyll 0.18 0.001 0.06 0.851Salinity winter 0.18 0.001 0.11 0.153Salinity summer 0.17 0.001 0.09 0.396Mean wave stress 0.15 0.009 0.09 0.585Peak wave stress 0.12 0.097 0.08 0.469Stratification 0.11 0.090 0.09 0.385Tidal stress 0.10 0.298 0.09 0.383
FishTemperature winter 0.04 0.040 0.04 0.040Temperature summer 0.04 0.046 0.02 0.694Salinity summer 0.04 0.067 0.02 0.539Depth 0.04 0.140 0.02 0.810Salinity winter 0.03 0.198 0.03 0.391Mean wave stress 0.03 0.213 0.01 0.879Chlorophyll 0.03 0.257 0.01 0.757Peak wave stress 0.03 0.244 0.01 0.867Stratification 0.02 0.739 0.01 0.665Tidal stress 0.01 0.786 0.04 0.144Mud 0.01 0.934 0.02 0.649
The marginal effects represent the percentage variance explained by each variable as the sole predictor variable. The conditional effects represent thepercentage variance explained by each environmental variable with the variables already selected treated as covariables, based on forward selection.
290 H. Reiss et al.
benthic ecosystem components seems to be influenced mainly byphysical habitat characteristics (e.g. bottom topography and sub-stratum type) and biological interactions (e.g. predator–preyrelationships, interspecific competition for space, and foodsupply), whereas on larger scales, community structure seems tobe more influenced by hydroclimatic variability. The relativeimportance of the major influencing factors will vary not onlywith the spatial scale, but also with the characteristics of the eco-system component, e.g. between mobile demersal fish and seden-tary infauna. This anticipated difference between the ecosystemcomponents was not evident on the scale of the whole NorthSea because community structure was similar between all threefaunal components.
Implications for ecosystem managementAlthough each dataset used in this study constitutes the most com-prehensive contemporary data available for the North Sea benthicecosystem components, the data were collected on differentoccasions and under separate programmes, so no congruentstation grid was available. It was therefore necessary to select asubset of stations to allow direct comparison of faunal patterns,which limited the scope and the level of detail of the analyses.To permit a more comprehensive analysis of the faunal patternsand hypothesis formulation for the underlying processes, futuremonitoring programmes should (e.g. IBTS) aim if feasible to inte-grate sampling of these faunal components. Such an integratedapproach, as promoted by the ICES Transition Group onIntegrated Surveys for the Ecosystem Approach (TGISURV), isparticularly important because future marine management needsto implement an integrated approach towards the evaluation ofanthropogenic impacts across all ecosystem components.
Our study further has provided a glimpse of the possible deli-neation of biologically relevant spatial management units in theNorth Sea, going beyond existing administrative and sectoralboundaries (e.g. Douvere et al., 2007; Reiss et al., 2009). To date,spatially defined management units have been based mainly onadministrative boundaries and social, economic, or politicalfactors and, at most, on the abiotic characteristics such as hydro-graphic features or seabed structure among the ecosystem proper-ties (Zacharias et al., 1998; Roff et al., 2003). In fact, the lattercriteria should only be used as a proxy for the biological structureif tightly linked to the biological units at the relevant spatial scale(Roff et al., 2003; Snelder et al., 2007; McBreen et al., 2008). Whendelineating management units, the spatial differentiation directlyfrom spatially and ecologically wide-scale biological data, as pre-sented here, should be considered superior to the use of abioticproxies alone.
AcknowledgementsWe thank ICES for providing the IBTS fish data. The ICES NorthSea Benthos Project 2000 depended on the contributions of datafrom a variety of national sources. Thanks are therefore due tothe following additional data holders/guardians and to the organ-izations they represent: S. Cochrane (NIVA, Norway), N. Desroy(IFREMER, France), J-M. Dewarumez (Wimereux/LilleUniversity, France), S. Nehring (AeT-Umweltplanung,Germany), R. Newell (MES Ltd, on behalf of a UK dredging con-sortium), E. Oug (NIVA, Norway), Rebecca Smith (Cefas, UK),and J. Van Dalfsen (TNO IMARES, the Netherlands). We alsogratefully acknowledge the large numbers of scientists and
support staff who were responsible for the original collectionand analyses of the samples.
ReferencesBackhaus, J. O. 1985. A three-dimensional model for simulation of
shelf sea dynamics. Deutsche Hydrographische Zeitschrift, 38:165–187.
Blott, S. J., and Pye, K. 2001. GRADISTAT: a grain size distributionand statistics package for the analysis of unconsolidated sediments.Earth Surface Processes and Landforms, 26: 1237–1248.
Brown, J., Hill, A. E., Fernand, L., and Horsburgh, K. J. 1999.Observations of a seasonal jet-like circulation at the centralNorth Sea cold pool margin. Estuarine, Coastal and ShelfScience, 48: 343–355.
Callaway, R., Alsvag, J., De Boois, I., Cotter, J., Ford, A., Hinz, H.,Jennings, S., et al. 2002. Diversity and community structure of epi-benthic invertebrates and fish in the North Sea. ICES Journal ofMarine Science, 59: 1199–1214.
Clarke, K. R., and Warwick, R. M. 1994. Change in MarineCommunities: an Approach to Statistical Analysis andInterpretation. Plymouth Marine Laboratory, Plymouth, UK. 130pp.
Daan, N., Bromley, P. J., Hislop, J. R. G., and Nielsen, N. A. 1990.Ecology of North Sea fish. Netherlands Journal of Sea Research,26: 343–386.
Davies, A. M., and Aldridge, J. N. 1993. A numerical model study ofparameters influencing tidal currents in the Irish Sea. Journal ofGeophysical Research, 98: 7049–7068.
Degraer, S., Moulaert, I., van Hoey, G., and Vincx, M. 2007. Sievingalive or after fixation: effects of sieving procedure on macrobenthicdiversity, density and community structure. Helgoland MarineResearch, 61: 143–152.
Douvere, F., Maes, F., Vanhulle, A., and Schrijvers, J. 2007. The role ofmarine spatial planning in sea use management: the Belgian case.Marine Policy, 31: 182–191.
Ehrich, S., Reiss, H., Damm, U., and Kroncke, I. 2004. Vulnerability ofbottom fish species to the standard GOV. ICES Document CM2004/D: 05. 16 pp.
Ehrich, S., Stelzenmuller, V., and Adlerstein, S. 2009. Linking spatialpattern of bottom fish assemblages with water masses in theNorth Sea. Fisheries Oceanography, 18: 36–50.
Fransz, H. G., Colebrook, J. M., Gamble, J. C., and Krause, M. 1991.The zooplankton of the North-Sea. Netherlands Journal of SeaResearch, 28: 1–52.
Fraser, H. M., Greenstreet, S. P. R., Fryer, R. J., and Piet, G. J. 2008.Mapping spatial variation in demersal fish species diversity andcomposition in the North Sea: accounting for species andsize-related catchability in survey trawls. ICES Journal of MarineScience, 65: 531–538.
Frauenheim, K., Neumann, V., Thiel, H., and Turkay, M. 1989. Thedistribution of the larger epifauna during summer and winter inthe North Sea and its suitability for environmental monitoring.Senckenbergiana Maritima, 20: 101–118.
Glemarec, M. 1973. The benthic communities of the European NorthAtlantic continental shelf. Oceanography and Marine Biology: anAnnual Review, 11: 263–289.
Gray, J. S., and Elliott, M. 2009. Ecology of Marine Sediments. OxfordUniversity Press, New York. 225 pp.
Greenstreet, S. P. R., and Hall, S. J. 1996. Fishing and the ground-fishassemblage structure in the north-western North Sea: an analysis oflong-term and spatial trends. Journal of Animal Ecology, 65:577–598.
Greenstreet, S. P. R., and Piet, G. J. 2008. Assessing the sampling effortrequired to estimate a species diversity in the groundfish assem-blages of the North Sea. Marine Ecology Progress Series, 364:181–197.
Spatial patterns of infauna, epifauna, and demersal fish communities in the North Sea 291

Gregr, E. J., and Bodtker, K. M. 2007. Adaptive classification of marineecosystems: identifying biologically meaningful regions in themarine environment. Deep Sea Research, 54: 385–402.
Heip, C., Basford, D., Craeymeersch, J., Dewarumez, J. M., Dorjes, J.,De Wilde, P., Duineveld, G., et al. 1992. Trends in biomass, densityand diversity of North Sea macrofauna. ICES Journal of MarineScience, 49: 13–22.
Heip, C., and Craeymeersch, J. A. 1995. Benthic community structuresin the North Sea. Helgolander Meeresuntersuchungen, 49:313–328.
Heessen, H. J. L., Dalskov, J., and Cook, R. M. 1997. The internationalbottom trawl survey in the North Sea, the Skagerrak and Kattegat.ICES Document CM 1997/Y: 31. 25 pp.
ICES. 2006. Report of the International Bottom Trawl Survey WorkingGroup (IBTSWG). ICES Document CM 2006/RMC: 03. 298 pp.
Jennings, S., Lancaster, J., Woolmer, A., and Cotter, J. 1999.Distribution, diversity and abundance of epibenthic fauna in theNorth Sea. Journal of the Marine Biological Association of theUK, 79: 385–399.
Jongman, R. H. G., ter Braak, C. J. F., and van Tongeren, O. F. R. 1995.Data Analysis in Community and Landscape Ecology. CambridgeUniversity Press, Cambridge, UK. 321 pp.
Kaiser, M. J., and Spencer, B. E. 1994. Estimates of scavenging behav-iour in recently trawled areas. In Environmental Impact of BottomGears on Benthic Fauna in Relation to Natural ResourcesManagement and Protection of the North Sea, pp. 237–250. Ed.by S. J. de Groot, and H. J. Lindeboom. NIOZ-Rapport 1994-11,Rivo-DLO report C026/94, Den Burg, the Netherlands. 257 pp.
Krause, M., Dippner, J. W., and Beil, J. 1995. A review of hydrographiccontrols on the distribution of zooplankton biomass and species inthe North Sea with particular reference to a survey conducted inJanuary–March 1987. Progress in Oceanography, 35: 81–152.
Kunitzer, A., Basford, D., Craeymeersch, J. A., Dewarumez, J. M.,Dorjes, J., Duineveld, G. C. A., Eeleftheriou, A., et al. 1992. Thebenthic infauna of the North Sea: species distribution and assem-blages. ICES Journal of Marine Science, 49: 127–143.
McArdle, B. H., Hewitt, J. E., and Thrush, S. F. 1997. Pattern fromprocess: it is not as easy as it looks. Journal of ExperimentalMarine Biology and Ecology, 216: 229–242.
McBreen, F., Wilson, J. G., Mackie, A. S. Y., and Aonghusa, C. N. 2008.Seabed mapping in the southern Irish Sea: predicting benthic bio-logical communities based on sediment characteristics.Hydrobiologia, 606: 93–103.
Menge, B. A., and Olson, A. M. 1990. Role of scale and environmental-factors in regulation of community structure. Trends in Ecologyand Evolution, 5: 52–57.
Moll, A. 1998. Regional distribution of primary production in theNorth Sea simulated by a three-dimensional model. Journal ofMarine Systems, 16: 151–170.
Moll, A. 2000. Assessment of three-dimensional physical-biologicalECOHAM1 simulations by quantified validation for the NorthSea with ICES and ERSEM data. ICES Journal of Marine Science,57: 1060–1068.
Neumann, H., Ehrich, S., and Kroncke, I. 2008. Spatial variability ofepifaunal communities in the North Sea in relation to samplingeffort. Helgoland Marine Research, 62: 215–225.
Osuna, P., and Wolf, J. 2005. Results from a one-year run of a wavemodel for the UK continental shelf. Proudman OceanographicLaboratory, Internal Document, 170. 47 pp.
Pearson, T. H., and Rosenberg, R. 1978. Macrobenthic succession inrelation to organic enrichment and pollution of the marineenvironment. Oceanography and Marine Biology: an AnnualReview, 16: 229–311.
Petersen, C. G. J. 1914. Valuation of the sea. 2. The animal commu-nities of the sea bottom and their importance for marine zoogeo-graphy. Report of the Danish Biological Station, 21: 1–44.
Petersen, C. G. J. 1918. The sea bottom and its production of fish-food. Report of the Danish Biological Station, 25: 1–62.
Pingree, R. D., and Griffiths, D. K. 1978. Tidal fronts on shelf seasaround British Isles. Journal of Geophysical Research, 83:4615–4622.
Pohlmann, T. 1996. Predicting the thermocline in a circulation modelof the North Sea. 1. Model description, calibration and verification.Continental Shelf Research, 16: 131–146.
Rachor, E., Reiss, H., Degraer, S., Duineveld, G. C. A., van Hoey, G.,Lavaleye, M., Willems, W., et al. 2007. Structure, distribution andcharacterizing species of North Sea macro-zoobenthos commu-nities in 2000. In Structure and Dynamics of the North SeaBenthos, pp. 46–60. Ed. by H. L. Rees, J. D. Eggleton, E. Rachor,and E. vanden Berghe. ICES Cooperative Research Report, 288.258 pp.
Ramsay, K., Kaiser, M. J., and Hughes, R. N. 1998. Responses ofbenthic scavengers to fishing disturbance by towed gears in differ-ent habitats. Journal of Experimental Marine Biology and Ecology,224: 73–98.
Rees, H. L., Eggleton, J. D., Rachor, E., and vanden Berghe, E. (Eds).2007. Structure and dynamics of the North Sea benthos. ICESCooperative Research Report, 288. 258 pp.
Rees, H. L., Pendle, M. A., Waldock, R., Limpenny, D. S., and Boyd, S.E. 1999. A comparison of benthic biodiversity in the North Sea,English Channel, and Celtic Seas. ICES Journal of MarineScience, 56: 228–246.
Reiss, H., Hoarau, G., Dickey-Collas, M., and Wolff, W. J. 2009.Genetic population structure of marine fish: mismatch betweenbiological and fisheries management units. Fish and Fisheries, 10:361–395.
Reiss, H., Knauper, S., and Kroncke, I. 2003. Invertebrate associationswith gastropod shells inhabited by Pagurus bernhardus(Paguridae)—secondary hard substrate increasing biodiversity inNorth Sea soft-bottom communities. Sarsia, 88: 404–414.
Reiss, H., Kroncke, I., and Ehrich, S. 2006. Estimating catching effi-ciency of a 2-m beam trawl for sampling epifauna by removalexperiments. ICES Journal of Marine Science, 64: 1453–1464.
Roff, J. C., Taylor, M. E., and Laughren, J. 2003. Geophysicalapproaches to the classification, delineation and monitoring ofmarine habitats and their communities. Aquatic Conservation:Marine and Freshwater Ecosystems, 13: 77–90.
Schratzberger, M., Warr, K., and Rogers, S. I. 2006. Patterns of nema-tode populations in the southwestern North Sea and their link toother components of the benthic fauna. Journal of Sea Research,55: 113–127.
Skogen, M. D., and Moll, A. 2000. Interannual variability of the NorthSea primary production: comparison from two model studies.Continental Shelf Research, 20: 129–151.
Skogen, M. D., and Moll, A. 2005. Importance of ocean circulation inecological modeling: an example from the North Sea. Journal ofMarine Systems, 57: 289–300.
Snelder, T. H., Leathwick, J. R., Dey, K. L., Rowden, A. A.,Weatherhead, M. A., Fenwick, G. D., Francis, M. P., et al. 2007.Development of an ecologic marine classification in the NewZealand region. Environmental Management, 39: 12–29.
Stephen, A. C. 1923. Preliminary survey of the Scottish waters of theNorth Sea by the Petersen grab. Fisheries Board for Scotland,Scientific Investigations, 1922, 3: 3–21.
ter Braak, C. J. F., and Smilauer, P. 1998. CANOCO Reference Manualand User’s Guide to Canoco for Windows: Software for CanonicalCommunity Ordination (version 4). Microcomputer Power,Ithaca, NY. 352 pp.
ter Braak, C. J. F., and Verdonschot, P. F. M. 1995. Canonical corre-spondence analysis and related multivariate methods in aquaticecology. Aquatic Science, 57: 255–289.
Thrush, S. F., Cummings, V. J., Dayton, P. K., Ford, R., Grant, J.,Hewitt, J. E., Hines, A. H., et al. 1997. Matching the outcome of
292 H. Reiss et al.

small-scale density manipulation experiments with larger scale pat-terns: an example of bivalve adult/juvenile interactions. Journal ofExperimental Marine Biology and Ecology, 216: 153–169.
Turrell, W. R. 1992. New hypotheses concerning the circulation of thenorthern North Sea and its relation to North Sea fish stock recruit-ment. ICES Journal of Marine Science, 49: 107–123.
Ursin, E. 1960. A quantitative investigation of the echinoderm fauna ofthe central North Sea. Meddelelser fra Danmarks Fiskeri-ogHavundersogelser, 2: 1–204.
van Hoey, G., Degrear, S., and Vincx, M. 2004. Macrobenthic commu-nity structure of soft-bottom sediments at the Belgian continentalshelf. Estuarine, Coastal and Shelf Science, 59: 599–613.
Williams, R., Lindley, J. A., Hunt, H. G., and Collins, N. R. 1993.Plankton community structure and geographical distribution inthe North Sea. Journal of Experimental Marine Biology andEcology, 172: 143–156.
Zacharias, M. A., Howes, D. E., Harper, J. R., and Wainwright, P.1998. The British Columbia marine ecosystem classification:rationale, development, and verification. Coastal Management,26: 105–124.
Zuhlke, R., Alsvag, J., De Boois, I., Cotter, J., Ehrich, S., Ford, A., Hinz,H., et al. 2001. Epibenthic diversity in the North Sea.Senckenbergiana Maritima, 31: 269–281.
doi:10.1093/icesjms/fsp253
Spatial patterns of infauna, epifauna, and demersal fish communities in the North Sea 293